Introduction
Lung cancer is a malignant tumour with a high
morbidity and mortality rate, which poses serious threats to human
life and health. Lung adenocarcinoma (LUAD) is the most common
histological type of lung cancer, with a high incidence (1,2). A
tumor that invades beyond the elastic layer of the visceral pleura
(PL1) and exposes the pleural surface (PL2) is known as a visceral
pleural invasion (VPI). VPI is also correlated with the severity of
lung cancer progression according to the 8th edition of TNM
classification for lung cancer (3).
Since VPI is associated with occult lymph node
metastases and local recurrence, standardized lobectomy and lymph
node dissection are recommended over local excision alone, even in
early-stage VPI (4). Therefore, a
highly specific non-invasive preoperative VPI diagnostic tool may
be useful in screening candidates for lobectomy among those
patients in good general condition, thereby increasing the
likelihood of beneficial surgical resection.
It is generally accepted by thoracic surgeons that a
lung lesion that appears on computed tomography (CT) as an adjacent
pleural lesion suggests the development of VPI (5). However, a previous clinical study
indicated that not all lesions with pleural reactions on imaging
(pleural traction sign, pleural depression sign, etc.) present with
VPI postoperatively (6). In
addition, pure ground glass nodules (pGGNs) are thought to be
weakly invasive, making it difficult to invade the visceral pleura
(6). Patients with invasive LUAD
adjacent to the pleura and confirmed by postoperative pathology,
who are at a greater risk of VPI, were recruited for the present
study.
The current gold standard for validation of VPI
remains the elastic staining of the diseased tissue pleura after
surgical excision (7). Therefore,
evaluating the predictive performance of CT-based clinical and
radiomics features may help to further refine the treatment
strategy to prevent the inappropriate choice of treatment modality
and thus benefit the patient. In the present study, patients with
invasive LUAD adjacent to the pleura were screened, preoperative
imaging and clinical data were collected and a VPI prediction model
was constructed and its model efficacy was validated.
Patients and methods
Patient screening and collection of
clinical characteristics
Clinical and laboratory data from October 2021 to
July 2022 were retrospectively collected. A total of 112 patients
with invasive LUAD confirmed by postoperative pathological findings
and CT presentation of adjacent pleura were enrolled from the
Department of Thoracic Surgery at Hebei General Hospital
(Shijiazhuang, China). The inclusion criteria were as follows:
Patients aged ≥18 years at the time of surgery and diagnosed with
stage I–IIIA LUAD (TNM staging with a T stage of 1–2, N stage of
0–2 and M stage of 0) with complete preoperative clinical and
laboratory data. Patients were excluded if they had incomplete or
unclear preoperative CT imaging data, pGGNs on CT, postoperative
pathology suggesting non-invasive carcinoma or were unable to
tolerate standardized lobectomy and lymph node dissection for
various reasons.
This study was approved by the Ethics Committee of
Hebei General Hospital (Shijiazhuang, China; no. 2023054). The
requirement of informed consent was waived due to the retrospective
nature of the study. The study was conducted following the
Declaration of Helsinki and all identifying information was removed
from the data to ensure patient confidentiality. The data of the
study were also reported in compliance with the Reporting
Recommendations for Tumor Marker Prognostic Studies guidelines
(8).
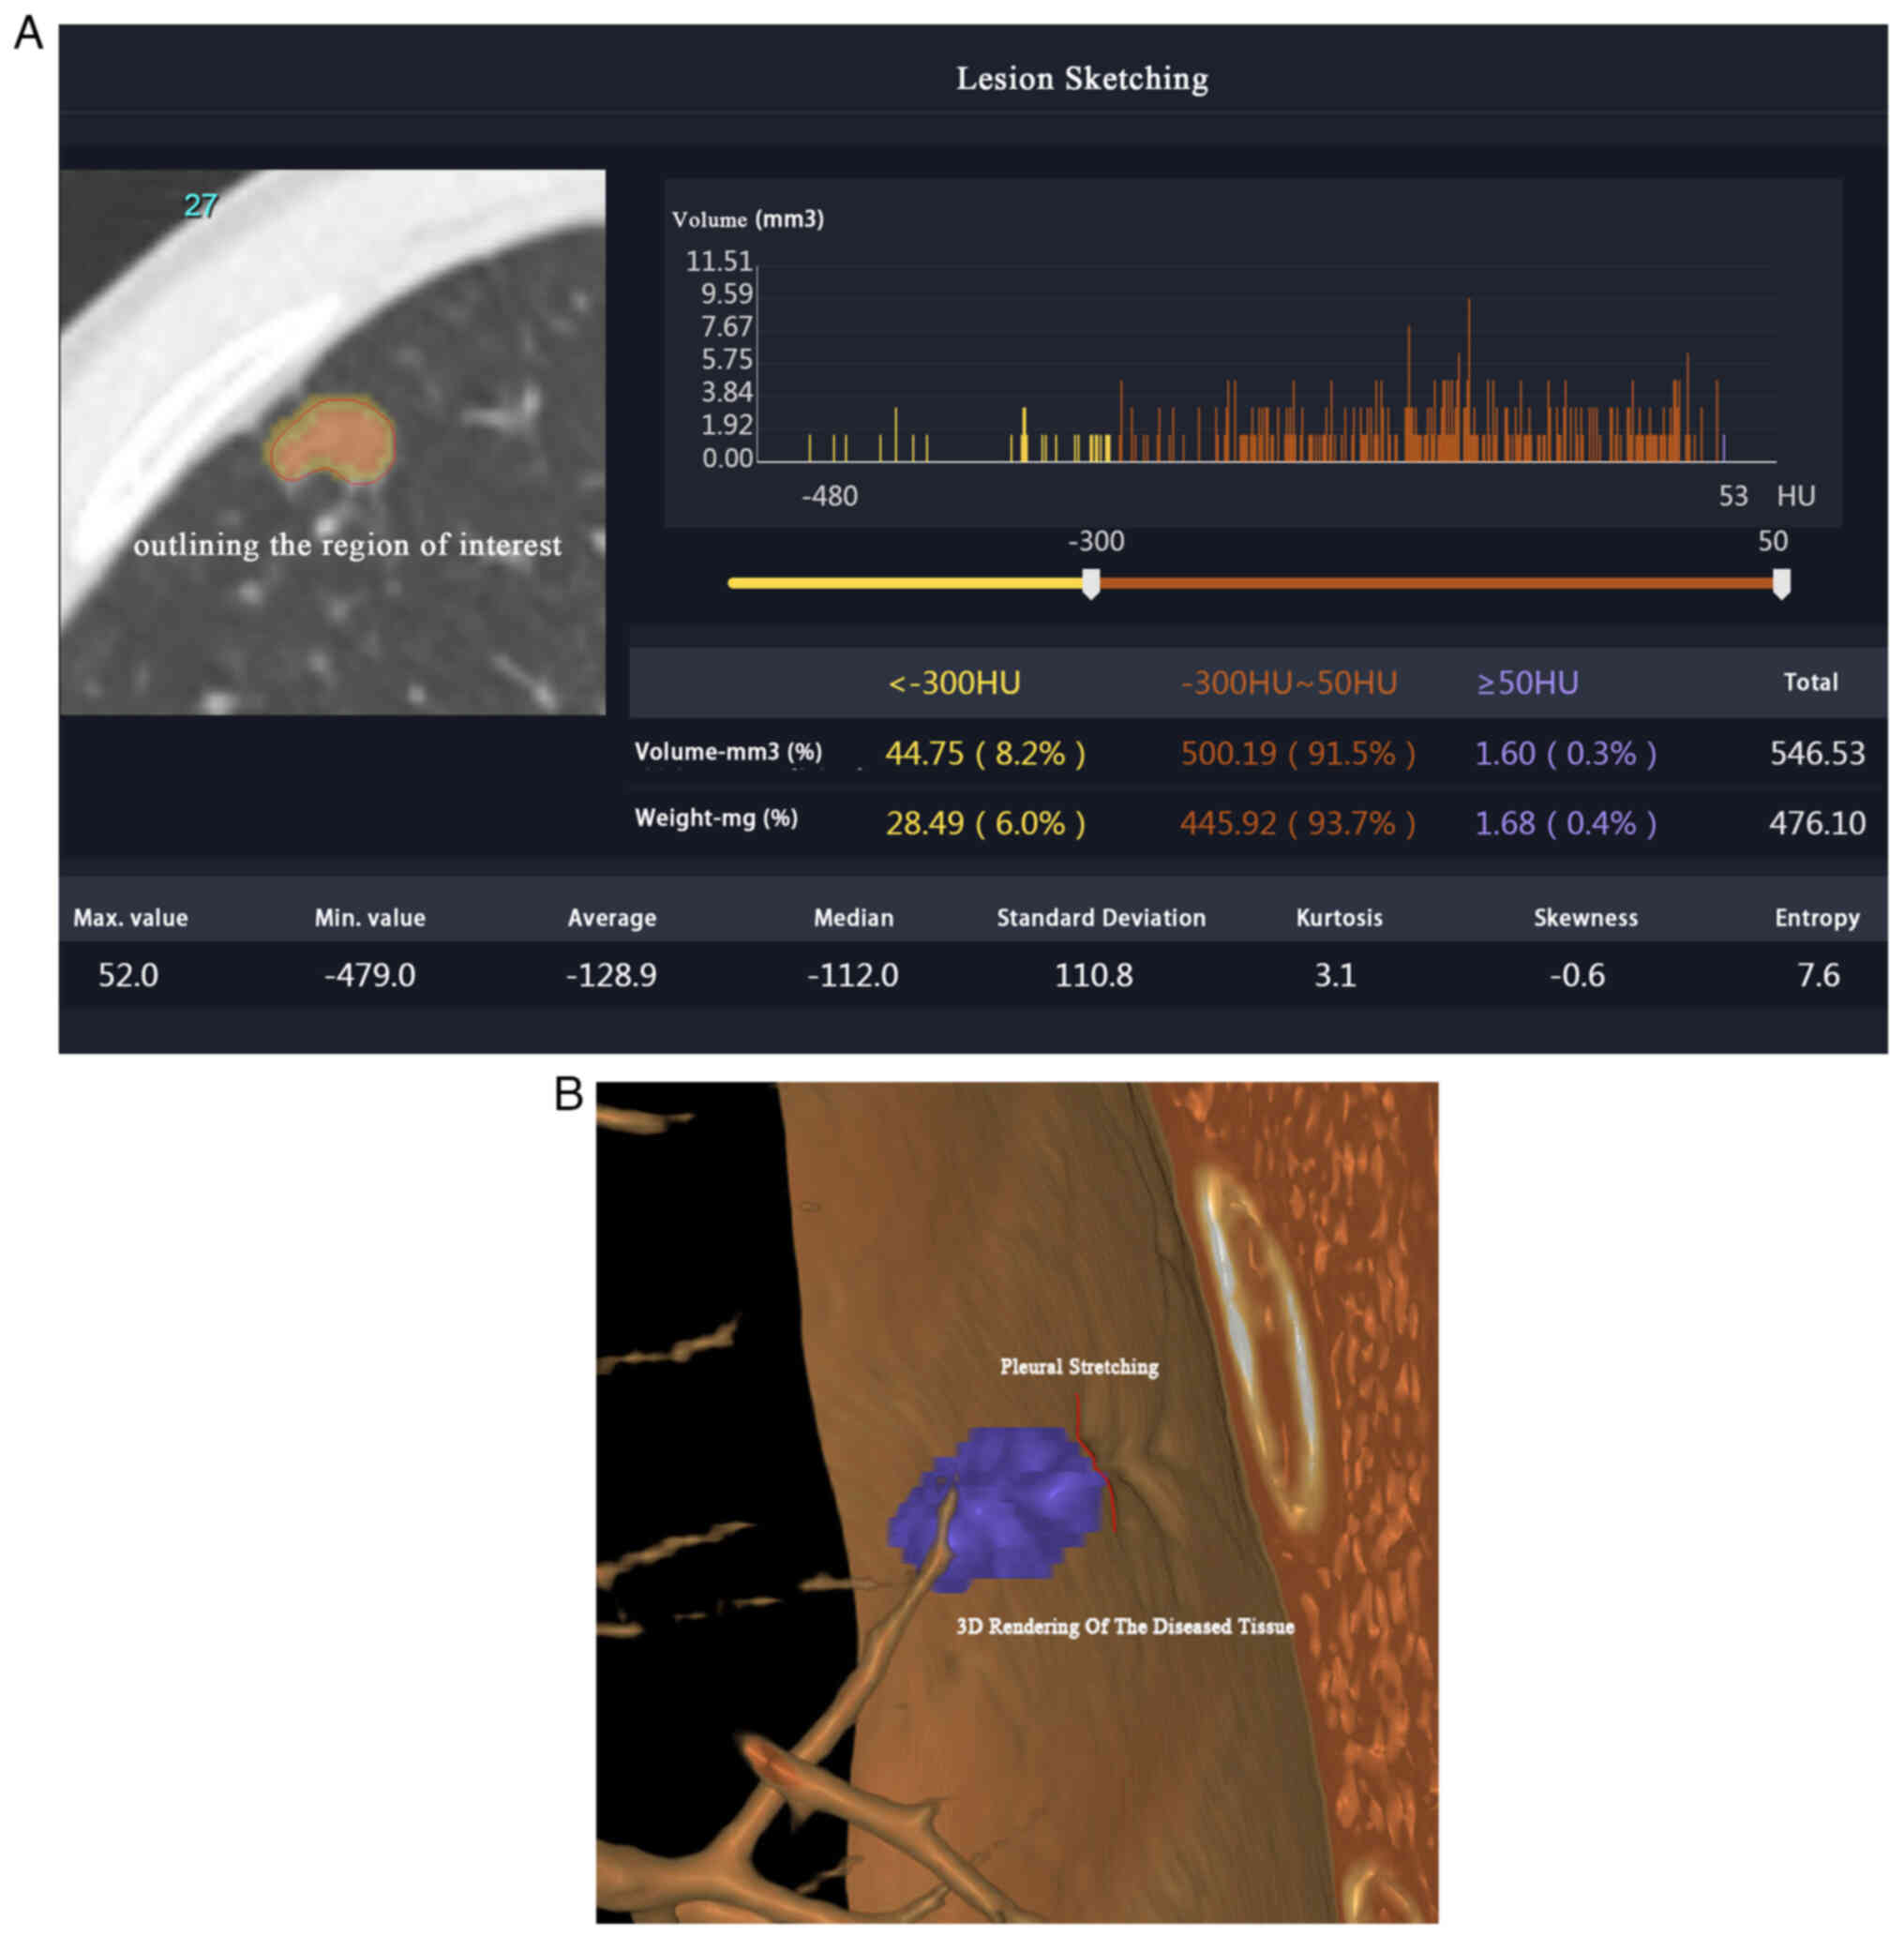
Image and specimen pre-processing
The plain CT of the lungs was used to accurately
identify and classify the pleural invasion status. Specifically,
the Siemens 64-slice dual-source CT scanning equipment (Siemens
Healthineers) was used to scan the entire lung field with specific
collimator thickness, reconstruction layer and interlayer spacing
settings (0.6-mm thin layer image acquisition). All imaging results
were carefully analyzed by outlining the region of interest (ROI)
(Fig. 1A and B) and reviewed by two
Chinese Academy of Management Science certified technical imaging
engineers using ITK-SNAP version 3.8 software (9). In addition, elastic stain was used to
differentiate among various stages of pleural invasion (10), including PL0, PL1 and PL2. The
rigorous and standardized approach ensured accurate identification
and classification of the pleural invasion status in the study
population.
Feature extraction
Imaging features were grouped into three categories:
Geometry, intensity and texture. The three-dimensional shape of the
tumor was characterized using geometric features, while the
distribution of voxel intensities within the tumor was described
using intensity features. Texture features captured spatial
patterns in the distribution of intensities, including both second-
and high-order distributions. Several methods, including the
gray-level co-occurrence matrix (GLCM), gray-level run length
matrix, gray-level size zone matrix (GLSZM) and neighborhood
gray-tone difference matrix (NGTDM), were employed to extract
texture features for a comprehensive analysis.
Feature selection
Statistics
The Mann-Whitney U-test and feature screening were
conducted for all radiomic features. Subsequently, only features
with a P<0.05 were retained for further analysis.
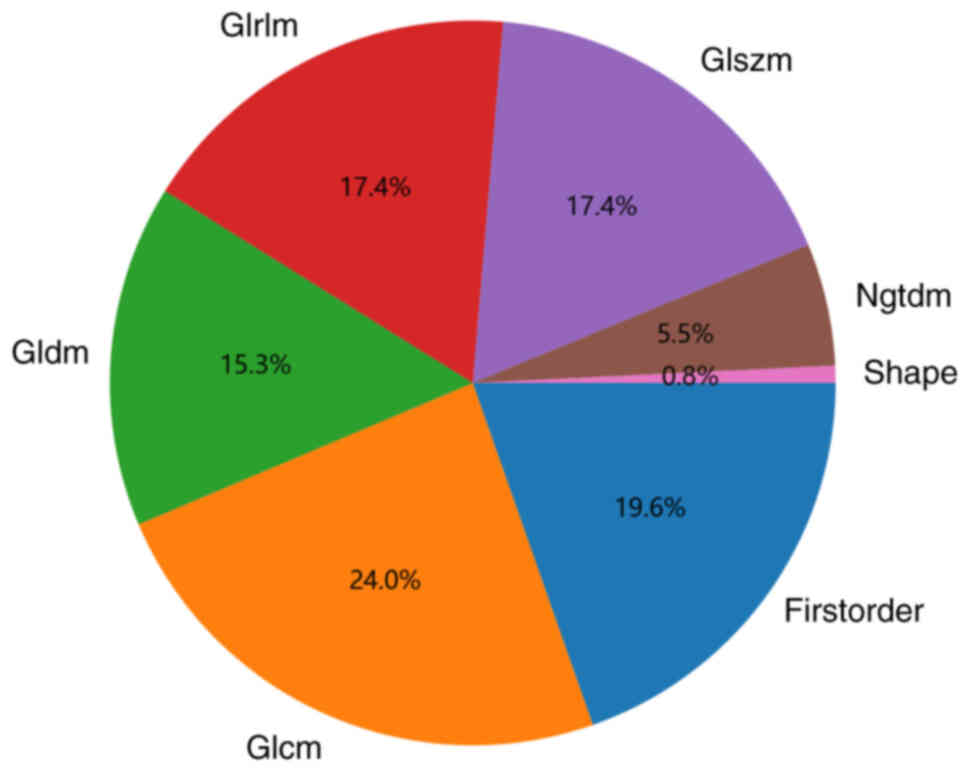
Correlation
For radiomic features with high repeatability, the
correlation between features was calculated by determining
Spearman's rank correlation coefficient. Fig. 2 shows the percentage of each group
of imaging features out of the total number of features. If the
correlation coefficient between any two features was >0.9, one
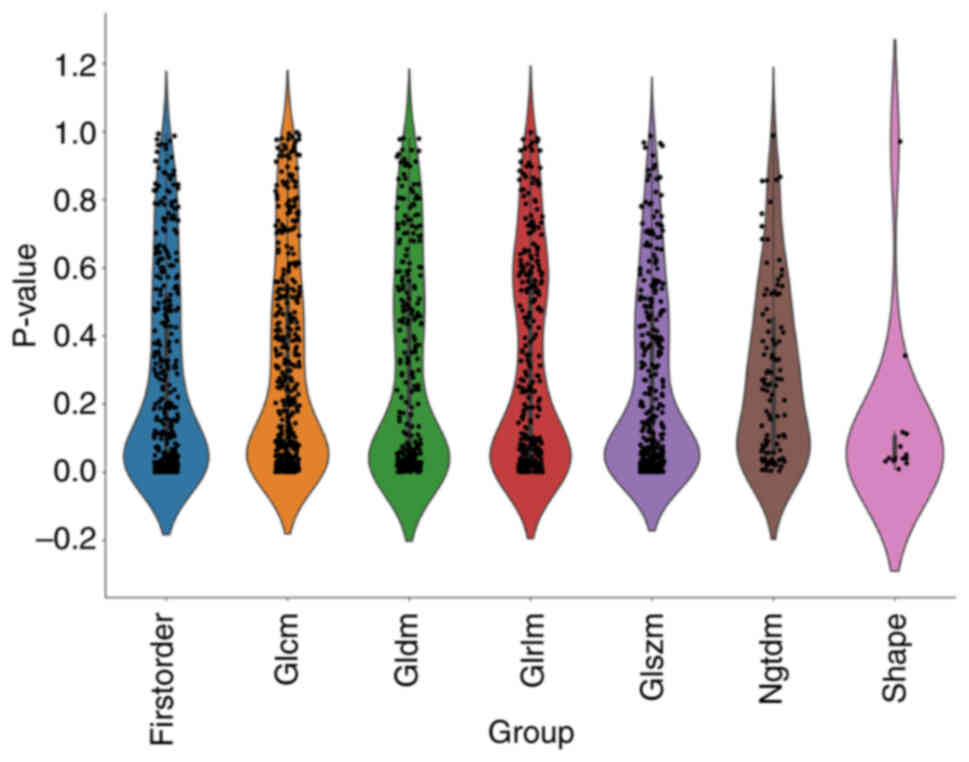
of the features was retained. The distribution of individual
features is shown in Fig. 3. To
preserve the ability of the features to accurately represent the
data, a greedy algorithm was used for feature filtering. This
involved removing the feature with the greatest redundancy in the
current set at each iteration. Following this process, 23 features
were retained for further analysis.
Least absolute shrinkage and selection
operator (LASSO)
The dataset was utilized to build a signature via
the LASSO regression model. The LASSO regression model reduces
regression coefficients towards zero and sets the coefficients of
irrelevant features to zero, based on the regulation weight λ. To
identify the optimal λ, 10-fold cross-validation via minimum
criteria was applied and the final value of λ was selected based on
the minimum cross-validation error. The non-zero coefficients of
the retained features were used to fit the regression model and
combined to create a radiomics signature (Rad signature). Each
patient received a radiomics score (Rad score) that was determined
by a linear combination of the retained features and their model
coefficients. LASSO regression modeling was implemented using the
Python scikit-learn package 1.3.0 (https://scikit-learn.org/stable/index.html).
Rad signature
Following LASSO feature screening, the final
features were used to construct a risk model using machine-learning
algorithms, such as logistic regression (LR), support vector
machine (SVM), random forest (RF) and eXtreme Gradient Boosting
(XGBoost). Five-fold cross-validation was used to obtain the final
Rad signature. All machine-learning occurred via Python 3.11.4
(https://www.python.org/).
Clinical signature
The process of constructing the clinical signature
was similar to that for the Rad signature. Initially, the features
used to create the clinical signature were selected using baseline
statistics with a P-value threshold of <0.05. The machine
learning model used in the Rad signature building process was also
employed. To ensure a fair comparison, the 5-fold cross-validation
and testing cohort were fixed.
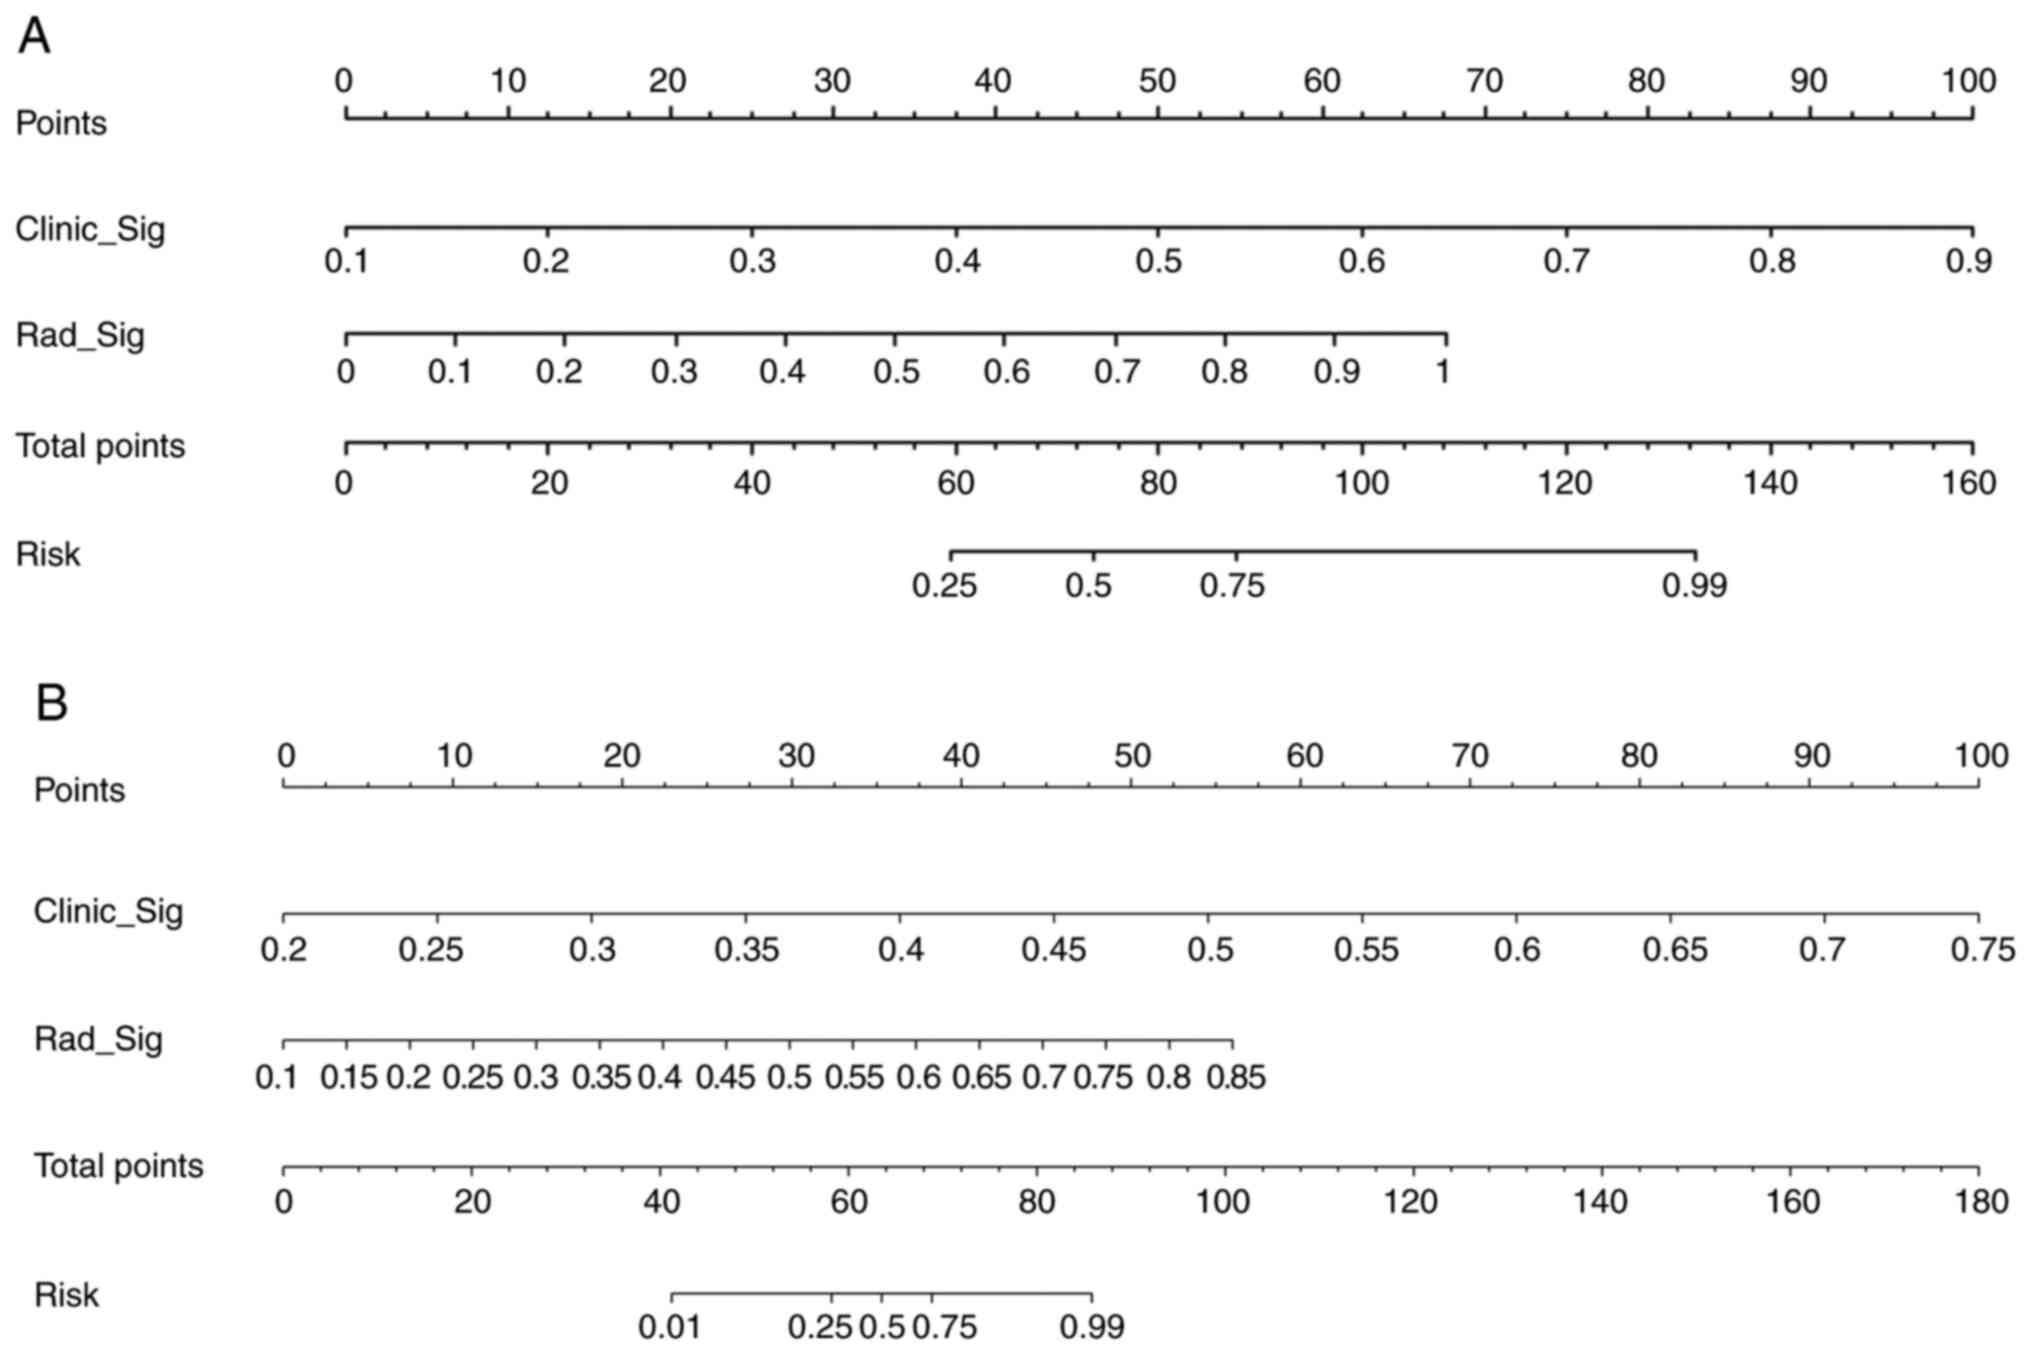
Radiomic nomogram
A radiomic nomogram was established by combining the
Rad signature and clinical signature. Receiver operating
characteristic (ROC) curves were drawn to test the diagnostic
efficacy of the radiomic nomogram. Calibration curves were also
drawn to evaluate the calibration efficiency of the nomogram and
the Hosmer-Lemeshow analytical fit was used to evaluate its
calibration ability. The nomogram was based on the logistic
regression algorithm and incorporated both the Rad signature and
clinical risk factors. The calibration curve was calculated to
assess the degree of agreement between the nomogram's prediction of
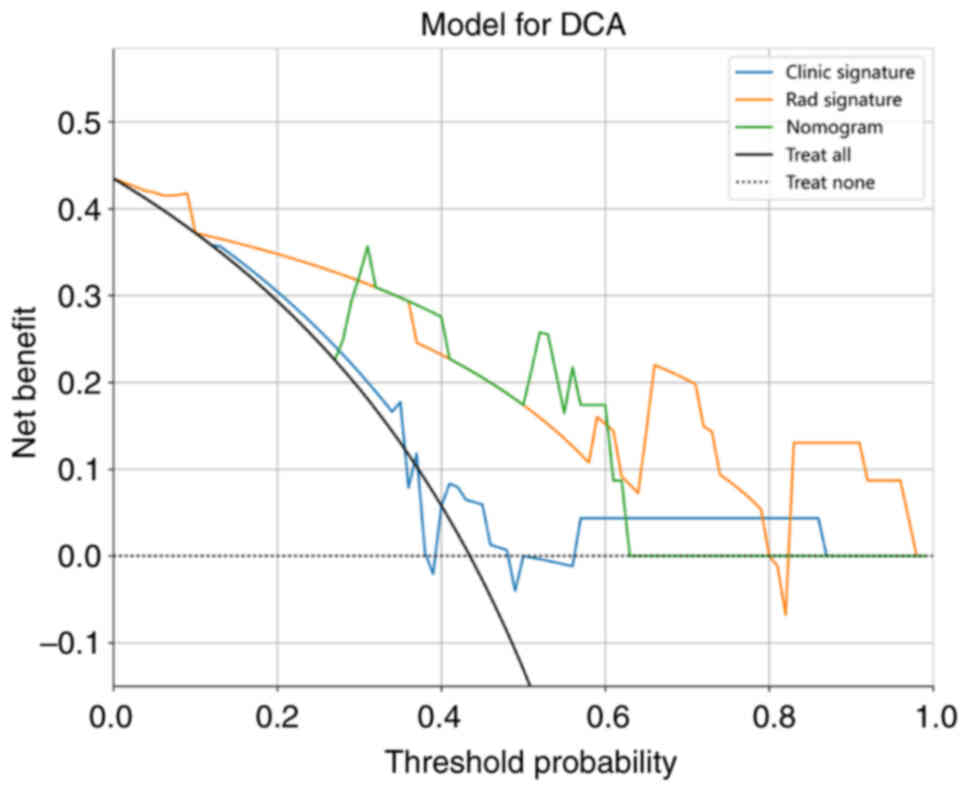
pleural infiltration and actual observation. Decision curve
analysis (DCA) was employed to assess the clinical utility of the
predictive models. These analyses were conducted using the testing
cohort.
Data sets
The patients were divided into 2 groups based on the
presence or absence of pleural invasion. In a ratio of 4:1, all
patients were divided into a training group and a test group by
randomization. The Mann-Whitney U-test, t-test and χ2
test were used to compare the clinical characteristics of the two
groups and determine any significant differences in patient
demographics, clinical presentation and other relevant factors that
may potentially affect the study outcomes. The results of these
tests are summarized in Table I.
Statistical analysis of the patient characteristics is an important
step in ensuring the validity and reliability of the study
results.
 | Table I.Baseline characteristics of patients
in cohorts. |
Table I.
Baseline characteristics of patients
in cohorts.
|
| Training Cohort |
| Testing Cohort |
|
|---|
|
|
|
|
|
|
|---|
| Feature | All (n=89) | Non-pleural invasion
(n=50) | Pleural invasion
(n=39) | P-value | All (n=23) | Non-pleural invasion
(n=13) | Pleural invasion
(n=10) | P-value |
|---|
| Age, years | 62.29±7.36 | 61.86±8.02 | 62.85±6.47 | 0.533 | 57.04±9.53 | 60.23±6.80 | 52.90±11.26 | 0.066 |
| Days | 11.49±4.91 | 9.20±3.39 | 14.44±5.03 | <0.001 | 9.09±2.94 | 8.15±1.86 | 10.30±3.68 | 0.082 |
| CEA, ng/ml | 9.11±25.49 | 3.30±2.61 | 16.55±37.35 | 0.014 | 3.18±4.47 | 2.27±1.40 | 4.37±6.59 | 0.274 |
| NSE, ng/ml | 13.63±4.87 | 14.51±5.78 | 12.50±3.09 | 0.053 | 13.85±3.15 | 14.80±2.99 | 12.60±3.04 | 0.097 |
| CK19, ng/ml | 2.77±1.48 | 2.77±1.51 | 2.78±1.46 | 0.997 | 1.99±0.75 | 2.08±0.59 | 1.89±0.95 | 0.564 |
| Size, cm | 2.09±1.19 | 2.00±1.30 | 2.21±1.02 | 0.431 | 2.13±0.78 | 2.07±0.84 | 2.21±0.72 | 0.677 |
| BMI,
kg/m2 | 25.84±3.24 | 26.23±3.62 | 25.34±2.62 | 0.199 | 25.24±4.06 | 25.50±1.93 | 24.91±5.92 | 0.741 |
| Sex |
|
|
| 0.579 |
|
|
| 1.0 |
|
Female | 53 (59.55) | 28 (56.00) | 25 (64.10) |
| 16 (69.57) | 9 (69.23) | 7 (70.00) |
|
|
Male | 36 (40.45) | 22 (44.00) | 14 (35.90) |
| 7 (30.43) | 4 (30.77) | 3 (30.00) |
|
| ECOG PS |
|
|
| 0.059 |
|
|
| 0.634 |
| 0 | 7 (7.87) | 1 (2.00) | 6 (15.38) |
| 4 (17.39) | 2 (15.38) | 2 (20.00) |
|
| 1 | 52 (58.43) | 30 (60.00) | 22 (56.41) |
| 12 (52.17) | 6 (46.15) | 6 (60.00) |
|
| 2 | 30 (33.71) | 19 (38.00) | 11 (28.21) |
| 7 (30.43) | 5 (38.46) | 2 (20.00) |
|
| Diabetes |
|
|
| 0.004 |
|
|
| 1.0 |
| No | 71 (79.78) | 34 (68.00) | 37 (94.87) |
| 22 (95.65) | 12 (92.31) | 10 (100.00) |
|
|
Yes | 18 (20.22) | 16 (32.00) | 2 (5.13) |
| 1 (4.35) | 1 (7.69) | Null |
|
| Smoking |
|
|
| 1.0 |
|
|
| 1.0 |
| No | 69 (77.53) | 39 (78.00) | 30 (76.92) |
| 17 (73.91) | 10 (76.92) | 7 (70.00) |
|
|
Yes | 20 (22.47) | 11 (22.00) | 9 (23.08) |
| 6 (26.09) | 3 (23.08) | 3 (30.00) |
|
| CHD |
|
|
| 0.204 |
|
|
| 0.183 |
| No | 71 (79.78) | 37 (74.00) | 34 (87.18) |
| 16 (69.57) | 11 (84.62) | 5 (50.00) |
|
|
Yes | 18 (20.22) | 13 (26.00) | 5 (12.82) |
| 7 (30.43) | 2 (15.38) | 5 (50.00) |
|
| T Stage |
|
|
| 0.728 |
|
|
| 0.791 |
| 1 | 70 (78.65) | 38 (76.00) | 32 (82.05) |
| 19 (82.61) | 10 (76.92) | 9 (90.00) |
|
| 2 | 17 (19.10) | 11 (22.00) | 6 (15.38) |
| 4 (17.39) | 3 (23.08) | 1 (10.00) |
|
| 3 | 2 (2.25) | 1 (2.00) | 1 (2.56) |
| None | None | None |
|
| N Stage |
|
|
| 0.093 |
|
|
| 1.0 |
| 0 | 77 (86.52) | 46 (92.00) | 31 (79.49) |
| 22 (95.65) | 12 (92.31) | 10 (100.00) |
|
| 1 | 9 (10.11) | 4 (8.00) | 5 (12.82) |
| 1 (4.35) | 1 (7.69) | Null |
|
| 2 | 3 (3.37) | Null | 3 (7.69) |
| None | None | None |
|
| Stage |
|
|
| 0.243 |
|
|
| 0.492 |
| I | 63 (70.79) | 37 (74.00) | 26 (66.67) |
| 18 (78.26) | 9 (69.23) | 9 (90.00) |
|
| II | 21 (23.60) | 12 (24.00) | 9 (23.08) |
| 5 (21.74) | 4 (30.77) | 1 (10.00) |
|
|
IIIA | 5 (5.62) | 1 (2.00) | 4 (10.26) |
| None | None | None |
|
| Position |
|
|
| 0.153 |
|
|
| 0.1 |
|
LUL | 28 (31.46) | 20 (40.00) | 8 (20.51) |
| 5 (21.74) | 3 (23.08) | 2 (20.00) |
|
|
LLL | 15 (16.85) | 10 (20.00) | 5 (12.82) |
| 6 (26.09) | 6 (46.15) | Null |
|
|
RUL | 25 (28.09) | 10 (20.00) | 15 (38.46) |
| 8 (34.78) | 3 (23.08) | 5 (50.00) |
|
|
RML | 7 (7.87) | 3 (6.00) | 4 (10.26) |
| 1 (4.35) | Null | 1 (10.00) |
|
|
RLL | 14 (15.73) | 7 (14.00) | 7 (17.95) |
| 3 (13.04) | 1 (7.69) | 2 (20.00) |
|
Results
Patients
A total of 112 patients were enrolled, aged 34–77
years with a median age of 62 years. Among them, 69 cases (61.6%)
were female and 81 cases (72.3%) were at stage I. Days indicates
the time between the first detection of a lung lesion and its
surgical removal, with a median time of 10 days. Pleural invasion
was confirmed in 49 cases (43.8%) after elastin fibre staining.
Signature construction
Features statistics
A total of 1,835 imaging features were extracted
across six categories, including 360 first-order features and 14
shape features. All features were extracted using an in-house
analysis program implemented in Pyradiomics (http://pyradiomics.readthedocs.io). All features and
corresponding P-values are shown in Fig. 3. Rad characteristics of each type
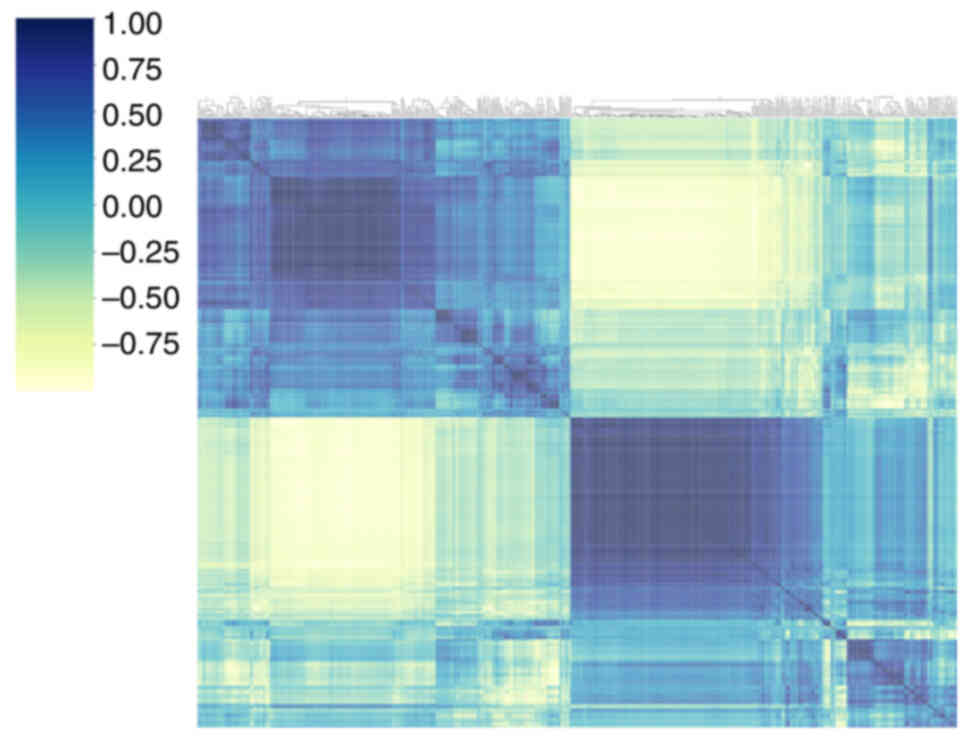
showed some convergence in the P<0.2 interval. Fig. 4 shows the matrix for visualizing the
phase clustering analysis with different correlation coefficients.
The color change reacts to the data information in the
two-dimensional matrix or table. Darker colors indicate positive
correlation and lighter colors indicate negative correlation. Color
depth indicates the magnitude of the coefficient value; the darker
the color, the stronger the correlation, indicating that the
correlation coefficient is closer to 1. Correlations between each
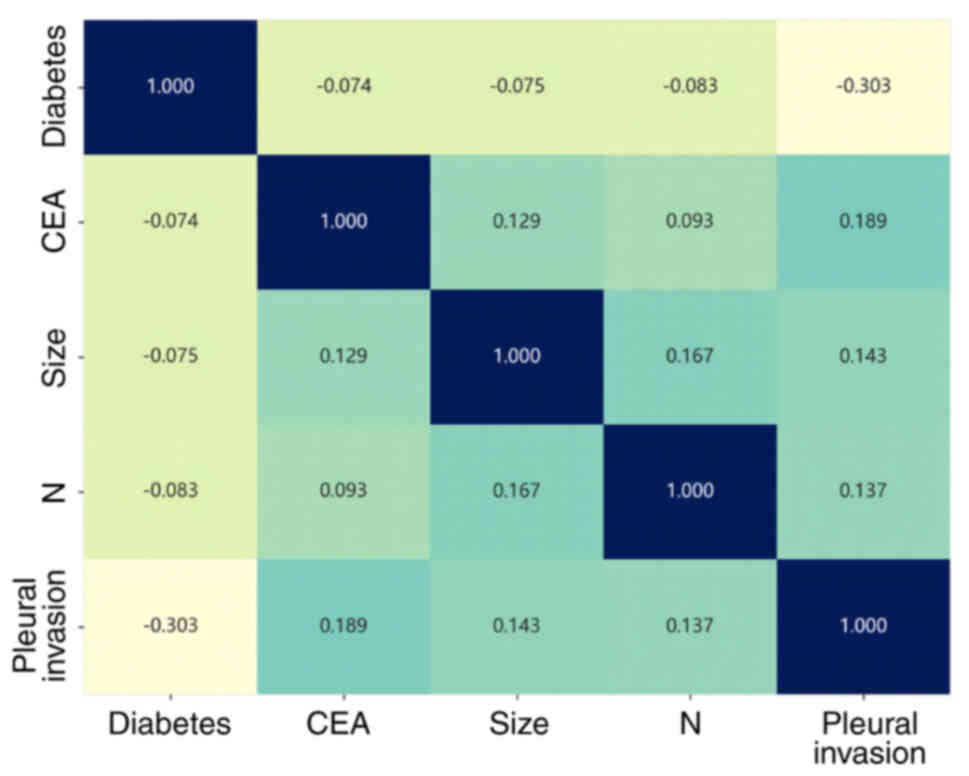
clinical feature are displayed in Fig.
5, where CEA and pleural invasion had a maximum correlation
coefficient. The intersection of the horizontal and vertical
coordinates is the correlation between the corresponding two
clinical features.
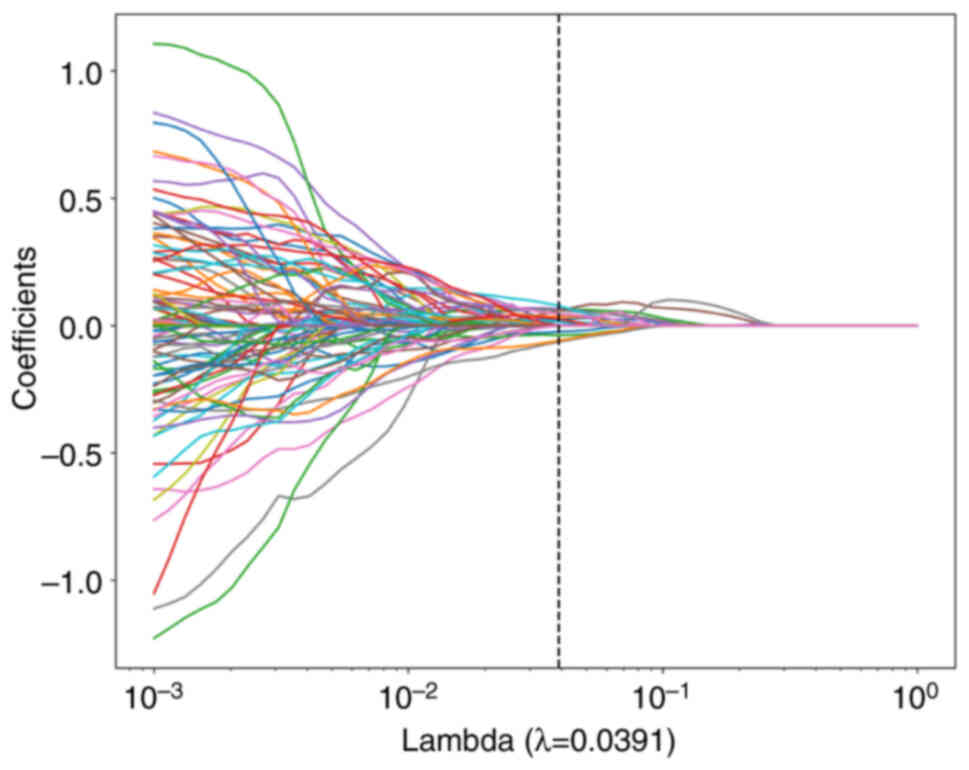
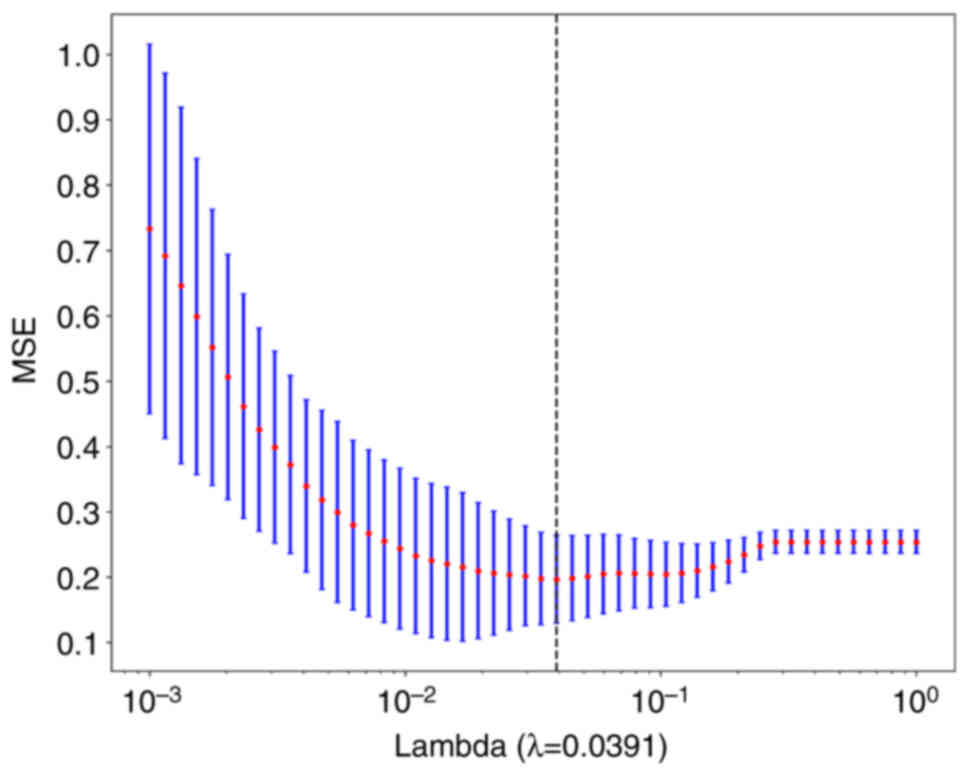
LASSO feature selection
After selecting the nonzero coefficients using a
LASSO logistic regression model, the Rad score was established. The
coefficients and mean standard error of the 10-fold validation are
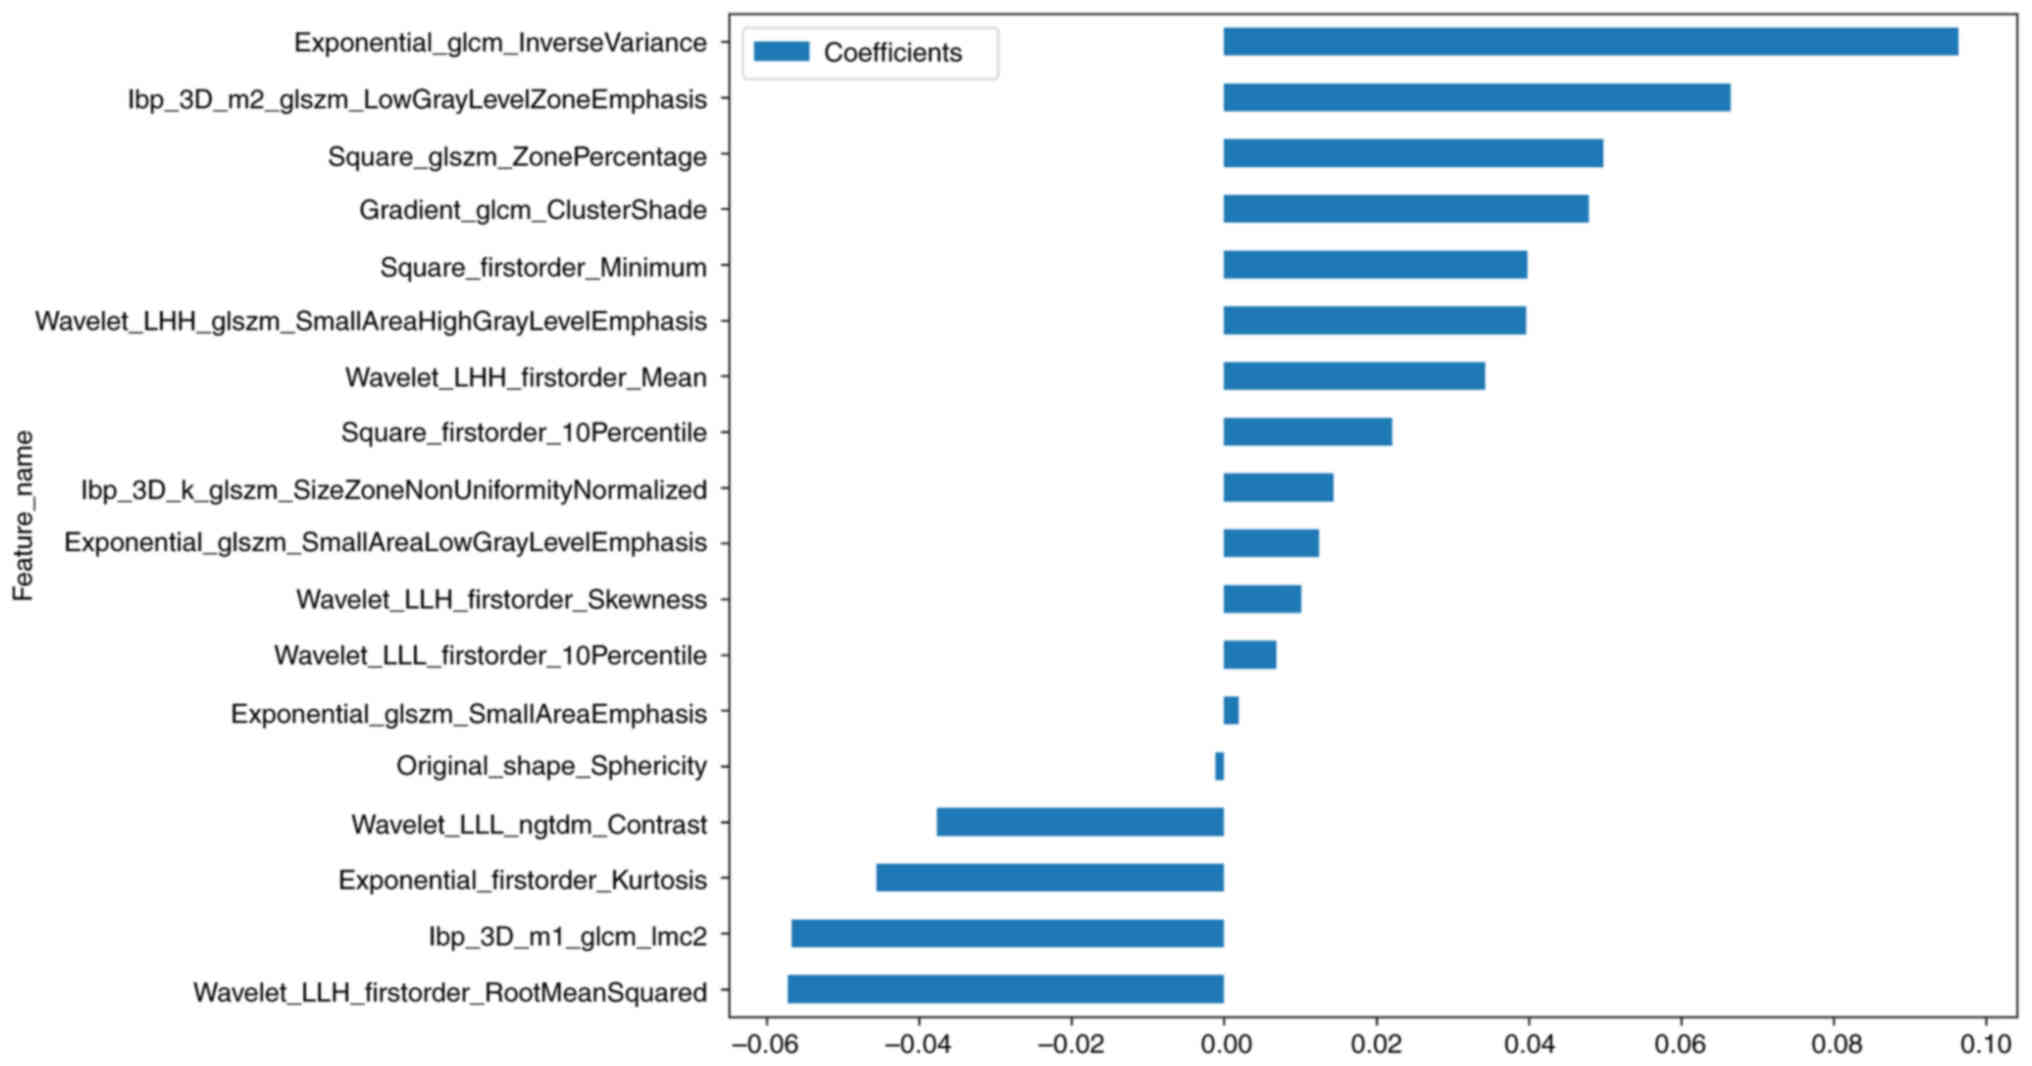
presented in Figs. 6 and 7, respectively. λ=0.0391 and the
coefficient values of the final selected nonzero features are shown
in Fig. 8. The calculation formula
is as follows:
Pleural invasion=0.45844761565741105-0.045632 ×
xponential_firstorder_Kurtosis + 0.096350 ×
exponential_glcm_InverseVariance + 0.001937 ×
exponential_glszm_SmallAreaEmphasis + 0.012465 ×
exponential_glszm_SmallAreaLowGrayLevelEmphasis + 0.047830 ×
gradient_glcm_ClusterShade + 0.014364 ×
lbp_3D_k_glszm_SizeZoneNonUniformityNormalized −0.056740 ×
lbp_3D_m1_glcm_Imc2 + 0.066505 ×
lbp_3D_m2_glszm_LowGrayLevelZoneEmphasis −0.001098 ×
original_shape_Sphericity + 0.022044 ×
square_firstorder_10Percentile + 0.039820 ×
square_firstorder_Minimum + 0.049771 × square_glszm_ZonePercentage
+ 0.034308 × wavelet_LHH_firstorder_Mean + 0.039643 ×
wavelet_LHH_glszm_SmallAreaHighGrayLevelEmphasis −0.057262 ×
wavelet_LLH_firstorder_RootMeanSquared + 0.010122 ×
wavelet_LLH_firstorder_Skewness + 0.006867 ×
wavelet_LLL_firstorder_10Percentile −0.037673 ×
wavelet_LLL_ngtdm_Contrast.
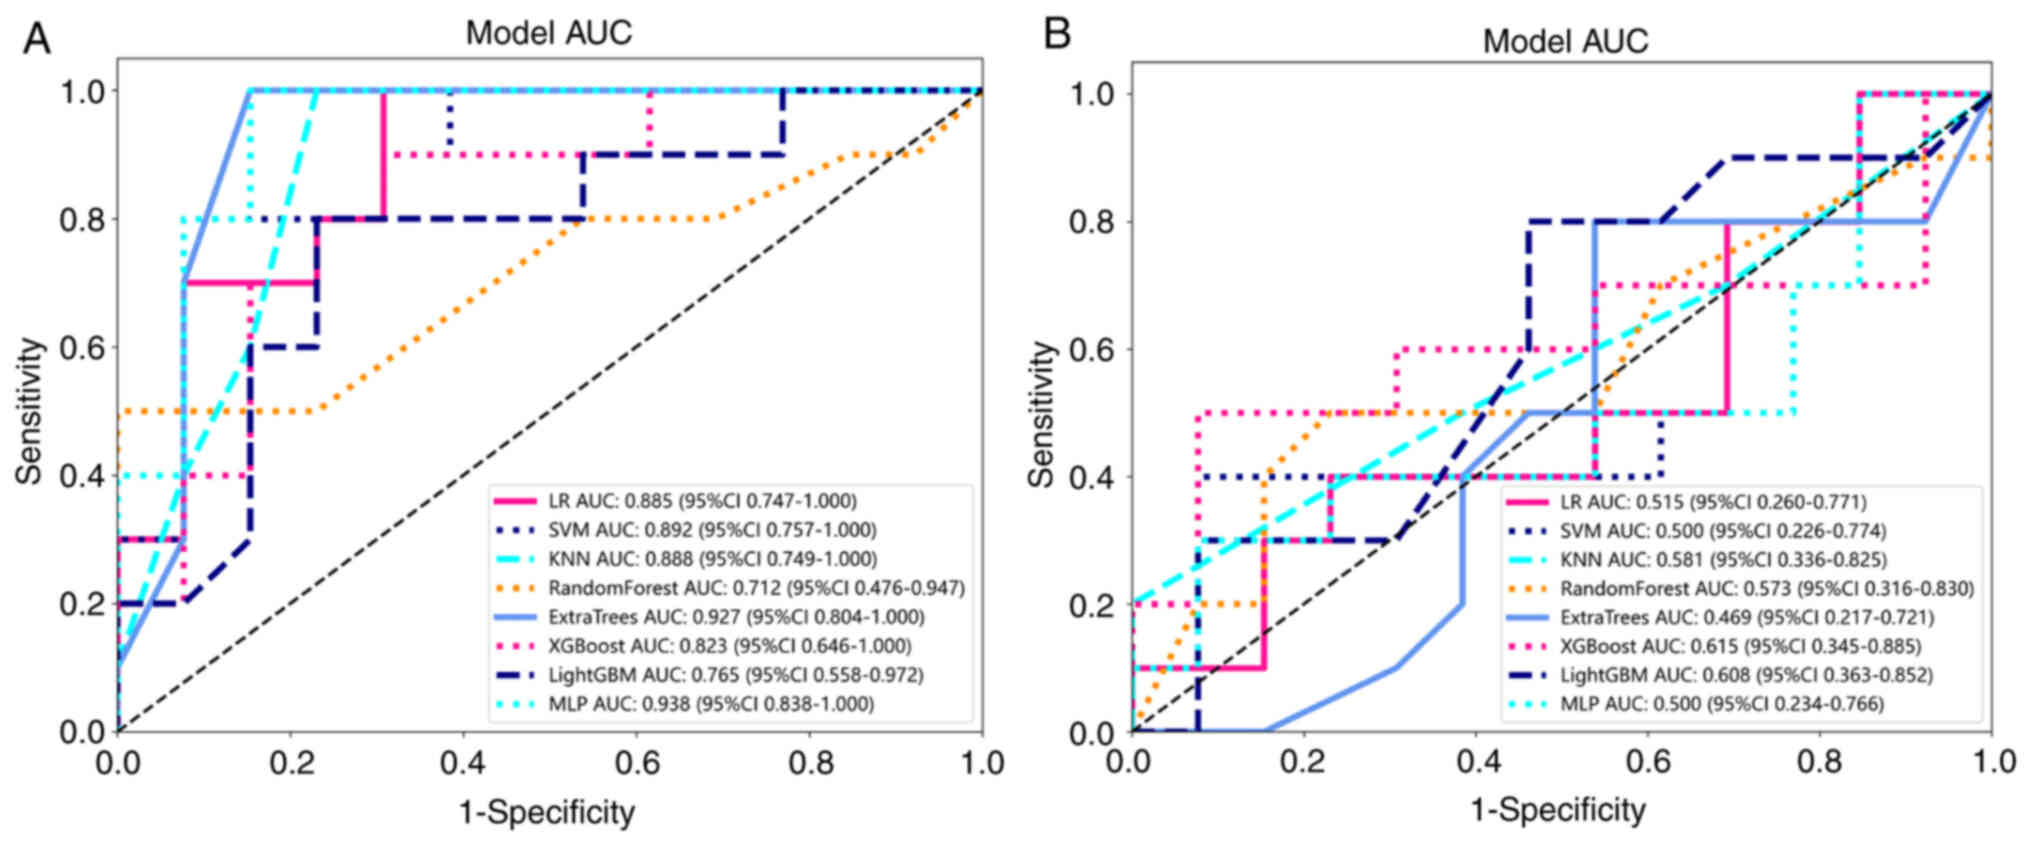
Model comparison
Table II shows all
models used to predict pleural infiltration, and the LR model
exhibited an excellent performance. Thus, the LR model was selected
as the base model in the construction of the clinical signature. By
utilizing radiomics features, the optimal model was achieved and
compared with classifiers such as LR, SVM, K-nearest neighbor
algorithm, Decision Tree, RF, Extra Trees, XGBoost and LightGBM.
Multilayer perceptron and LR models achieved the best predictive
value for pleural infiltration in LUAD, with an area under the
curve (AUC) of 0.885 and 0.515 for the training and testing cohort,
respectively. Fig. 9A and B shows
the AUC of each Rad signature model in the testing cohort. In the
test group, SVM, KNN and EXTRA TREES express better model efficacy,
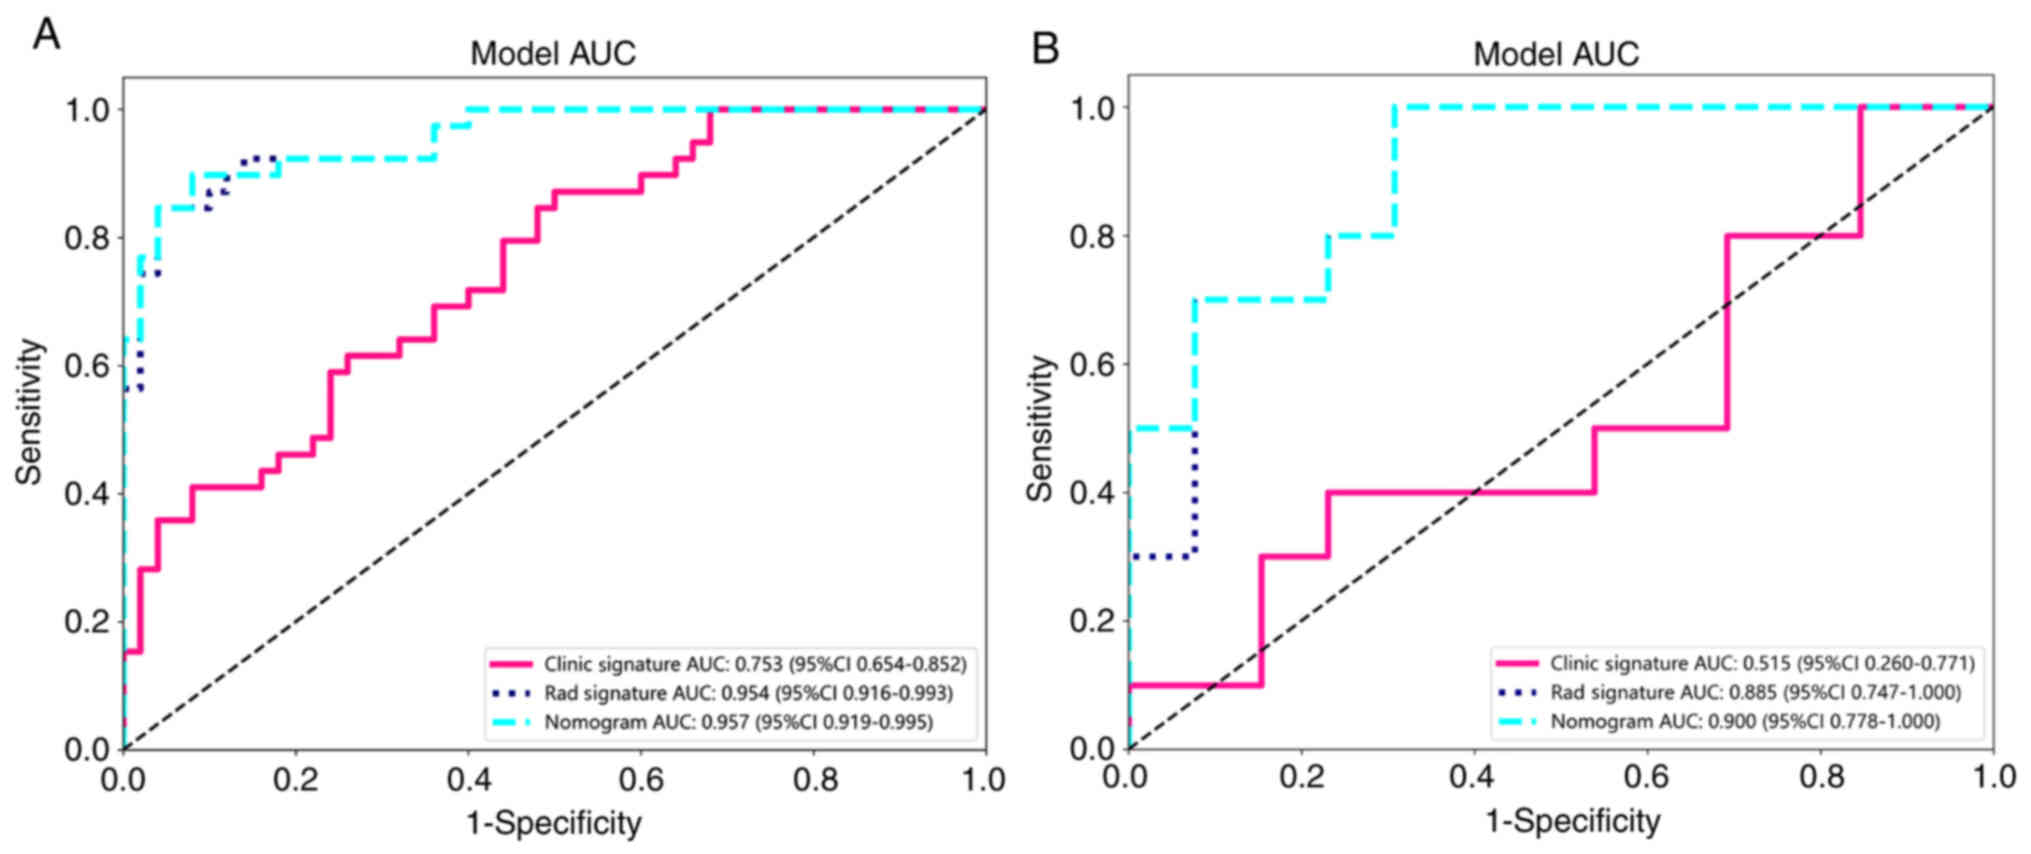
with the exception of the LR model. Table III indicates the performance of
each model on the clinical signature. The efficacy of models
constructed by combining clinical and imaging features was better
than that of models constructed by a single feature. Fig. 10A and B shows the AUC of each
clinical signature model in the testing cohort. In the training
set, the Clinical Signature model had an AUC of 0.753 (95% CI,
0.654–0.852). The Rad Signature model had an AUC of 0.954 (95% CI,
0.916–0.993) and the mixed nomogram model had an AUC of 0.957 (95%
CI, 0.919–0.995).
| Table II.Characteristics of all models. |
Table II.
Characteristics of all models.
| Model name | Accuracy | AUC | 95% CI | Sensitivity | Specificity | PPV | NPV | Precision | Recall | F1 | Threshold | Task |
|---|
| LR | 0.742 | 0.805 | 0.7159–0.8933 | 0.692 | 0.780 | 0.711 | 0.765 | 0.711 | 0.692 | 0.701 | 0.469 | Label-train |
| LR | 0.652 | 0.638 | 0.4037–0.8732 | 0.500 | 0.769 | 0.625 | 0.667 | 0.625 | 0.500 | 0.556 | 0.459 | Label-test |
| SVM | 0.640 | 0.690 | 0.5805–0.8000 | 0.667 | 0.620 | 0.578 | 0.705 | 0.578 | 0.667 | 0.619 | 0.393 | Label-train |
| SVM | 0.696 | 0.546 | 0.2831–0.8092 | 0.400 | 0.923 | 0.800 | 0.667 | 0.800 | 0.400 | 0.533 | 0.399 | Label-test |
| KNN | 0.753 | 0.819 | 0.7368–0.9022 | 0.692 | 0.800 | 0.730 | 0.769 | 0.730 | 0.692 | 0.711 | 0.600 | Label-train |
| KNN | 0.565 | 0.512 | 0.2681–0.7550 | 0.400 | 0.750 | 0.500 | 0.600 | 0.500 | 0.400 | 0.444 | 0.600 | Label-test |
| Random Forest | 0.955 | 0.994 | 0.9858–1.0000 | 0.974 | 0.940 | 0.927 | 0.979 | 0.927 | 0.974 | 0.950 | 0.500 | Label-train |
| Random Forest | 0.609 | 0.377 | 0.1166–0.6372 | 0.100 | 1.000 | 1.000 | 0.591 | 1.000 | 0.100 | 0.182 | 1.000 | Label-test |
| Extra Trees | 1.000 | 1.000 | 1.0000–1.0000 | 1.000 | 1.000 | 1.000 | 1.000 | 1.000 | 1.000 | 1.000 | 1.000 | Label-train |
| Extra Trees | 0.565 | 0.442 | 0.1959–0.6887 | 1.000 | 0.273 | 0.500 | 1.000 | 0.500 | 1.000 | 0.667 | 0.100 | Label-test |
| XG Boost | 0.899 | 0.959 | 0.9245–0.9930 | 0.872 | 0.920 | 0.895 | 0.902 | 0.895 | 0.872 | 0.883 | 0.453 | Label-train |
| XG Boost | 0.739 | 0.615 | 0.3454–0.8854 | 0.500 | 0.923 | 0.833 | 0.706 | 0.833 | 0.500 | 0.625 | 0.721 | Label-test |
| Light GBM | 0.652 | 0.739 | 0.6360–0.8430 | 0.821 | 0.520 | 0.571 | 0.788 | 0.571 | 0.821 | 0.674 | 0.405 | Label-train |
| Light GBM | 0.652 | 0.608 | 0.3634–0.8520 | 0.800 | 0.583 | 0.571 | 0.778 | 0.571 | 0.800 | 0.667 | 0.416 | Label-test |
| MLP | 0.708 | 0.762 | 0.6638–0.8603 | 0.718 | 0.700 | 0.651 | 0.761 | 0.651 | 0.718 | 0.683 | 0.405 | Label-train |
| MLP | 0.652 | 0.608 | 0.3624–0.8530 | 0.900 | 0.462 | 0.562 | 0.857 | 0.562 | 0.900 | 0.692 | 0.381 | Label-test |
| Table III.Nomogram indicators. |
Table III.
Nomogram indicators.
| Signature | Accuracy | AUC | 95% CI | Sensitivity | Specificity | PPV | NPV | Precision | Recall | F1 | Threshold |
|---|
| Training
cohort |
|
|
|
|
|
|
|
|
|
|
|
|
Clinical | 0.742 | 0.805 | 0.7159–0.8933 | 0.692 | 0.780 | 0.711 | 0.765 | 0.711 | 0.692 | 0.701 | 0.469 |
|
Rad | 0.910 | 0.954 | 0.9155–0.9932 | 0.846 | 0.960 | 0.943 | 0.889 | 0.943 | 0.846 | 0.892 | 0.583 |
|
Nomogram | 0.921 | 0.957 | 0.9195–0.9954 | 0.897 | 0.940 | 0.921 | 0.922 | 0.921 | 0.897 | 0.909 | 0.450 |
| Testing cohort |
|
|
|
|
|
|
|
|
|
|
|
|
Clinical | 0.652 | 0.638 | 0.4037–0.8732 | 0.500 | 0.769 | 0.625 | 0.667 | 0.625 | 0.500 | 0.556 | 0.459 |
|
Rad | 0.826 | 0.885 | 0.7471–1.0000 | 1.000 | 0.692 | 0.714 | 1.000 | 0.714 | 1.000 | 0.833 | 0.095 |
|
Nomogram | 0.826 | 0.900 | 0.7755–1.0000 | 1.000 | 0.692 | 0.714 | 1.000 | 0.714 | 1.000 | 0.833 | 0.326 |
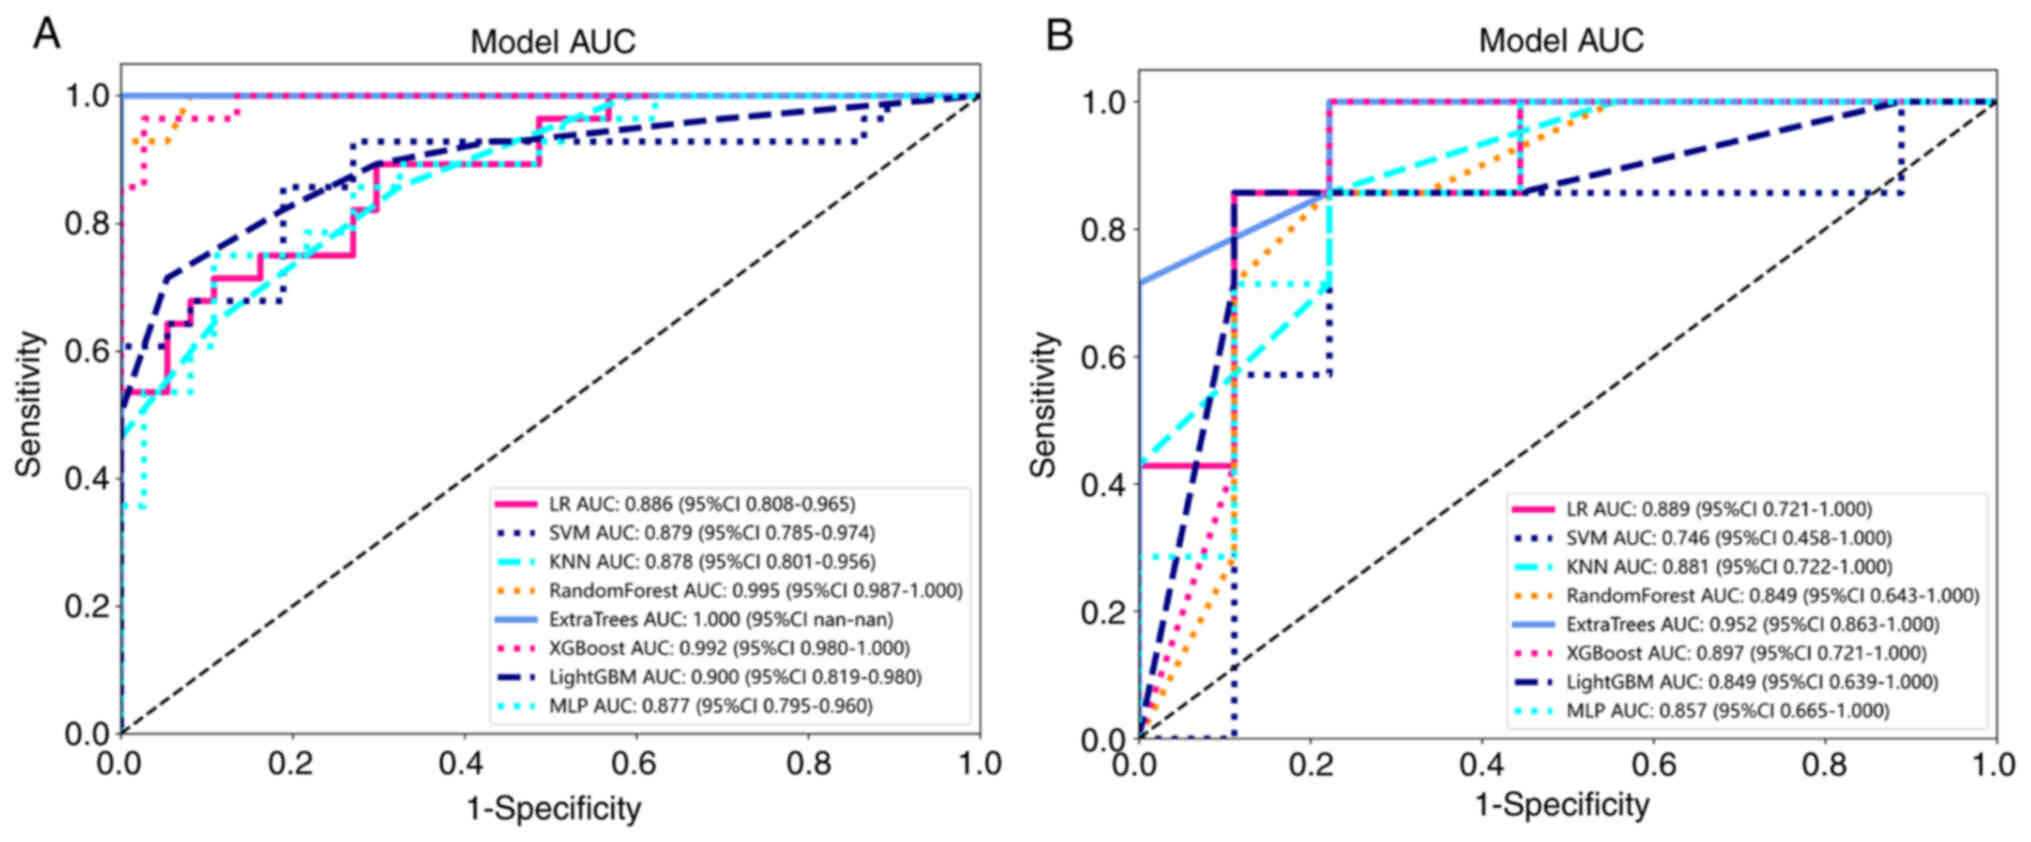
Subgroup comparison
To establish a VPI model useful for surgical
selection, a subgroup analysis of patients was performed with tumor
size <2 cm and c-stage I. A total of 81 patients were included
in this group. This group was randomly divided into a training set
and a testing set with a ratio of 4:1. Machine learning methods
were applied to plot the ROC curves (Fig. 11A and B) for the training and
testing sets. All of the models showed good predictive modeling,
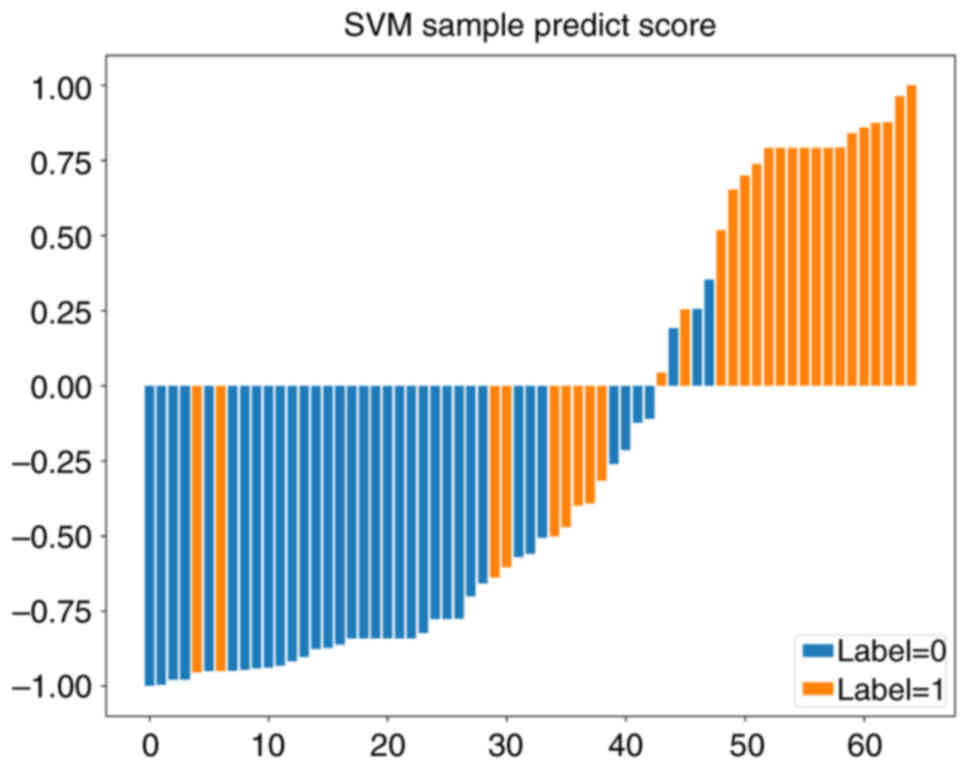
except for the ExtraTrees model, which showed overfitting. Fig. 12 presents the sample prediction
histogram of the SVM model. The blue part of the figure represents
patients without pleural invasion and the orange part represents
positive patients.
Nomogram
AUC
Both the clinical signature and Rad signature
exhibited a perfect fit in the training cohort. The clinical
signature was overfitted in the testing cohort, whereas the Rad
signature showed satisfying goodness-of-fit. A nomogram was
established based on both clinical and Rad signatures using the
logistic regression algorithm, which ultimately resulted in the
best performance. The Delong test was utilized to compare the
clinical signature, Rad signature and nomogram (Fig. 13A). In the subgroup analysis, the
construction of the nomogram of this group of patients was
performed based on the SVM model (Fig.
13B).
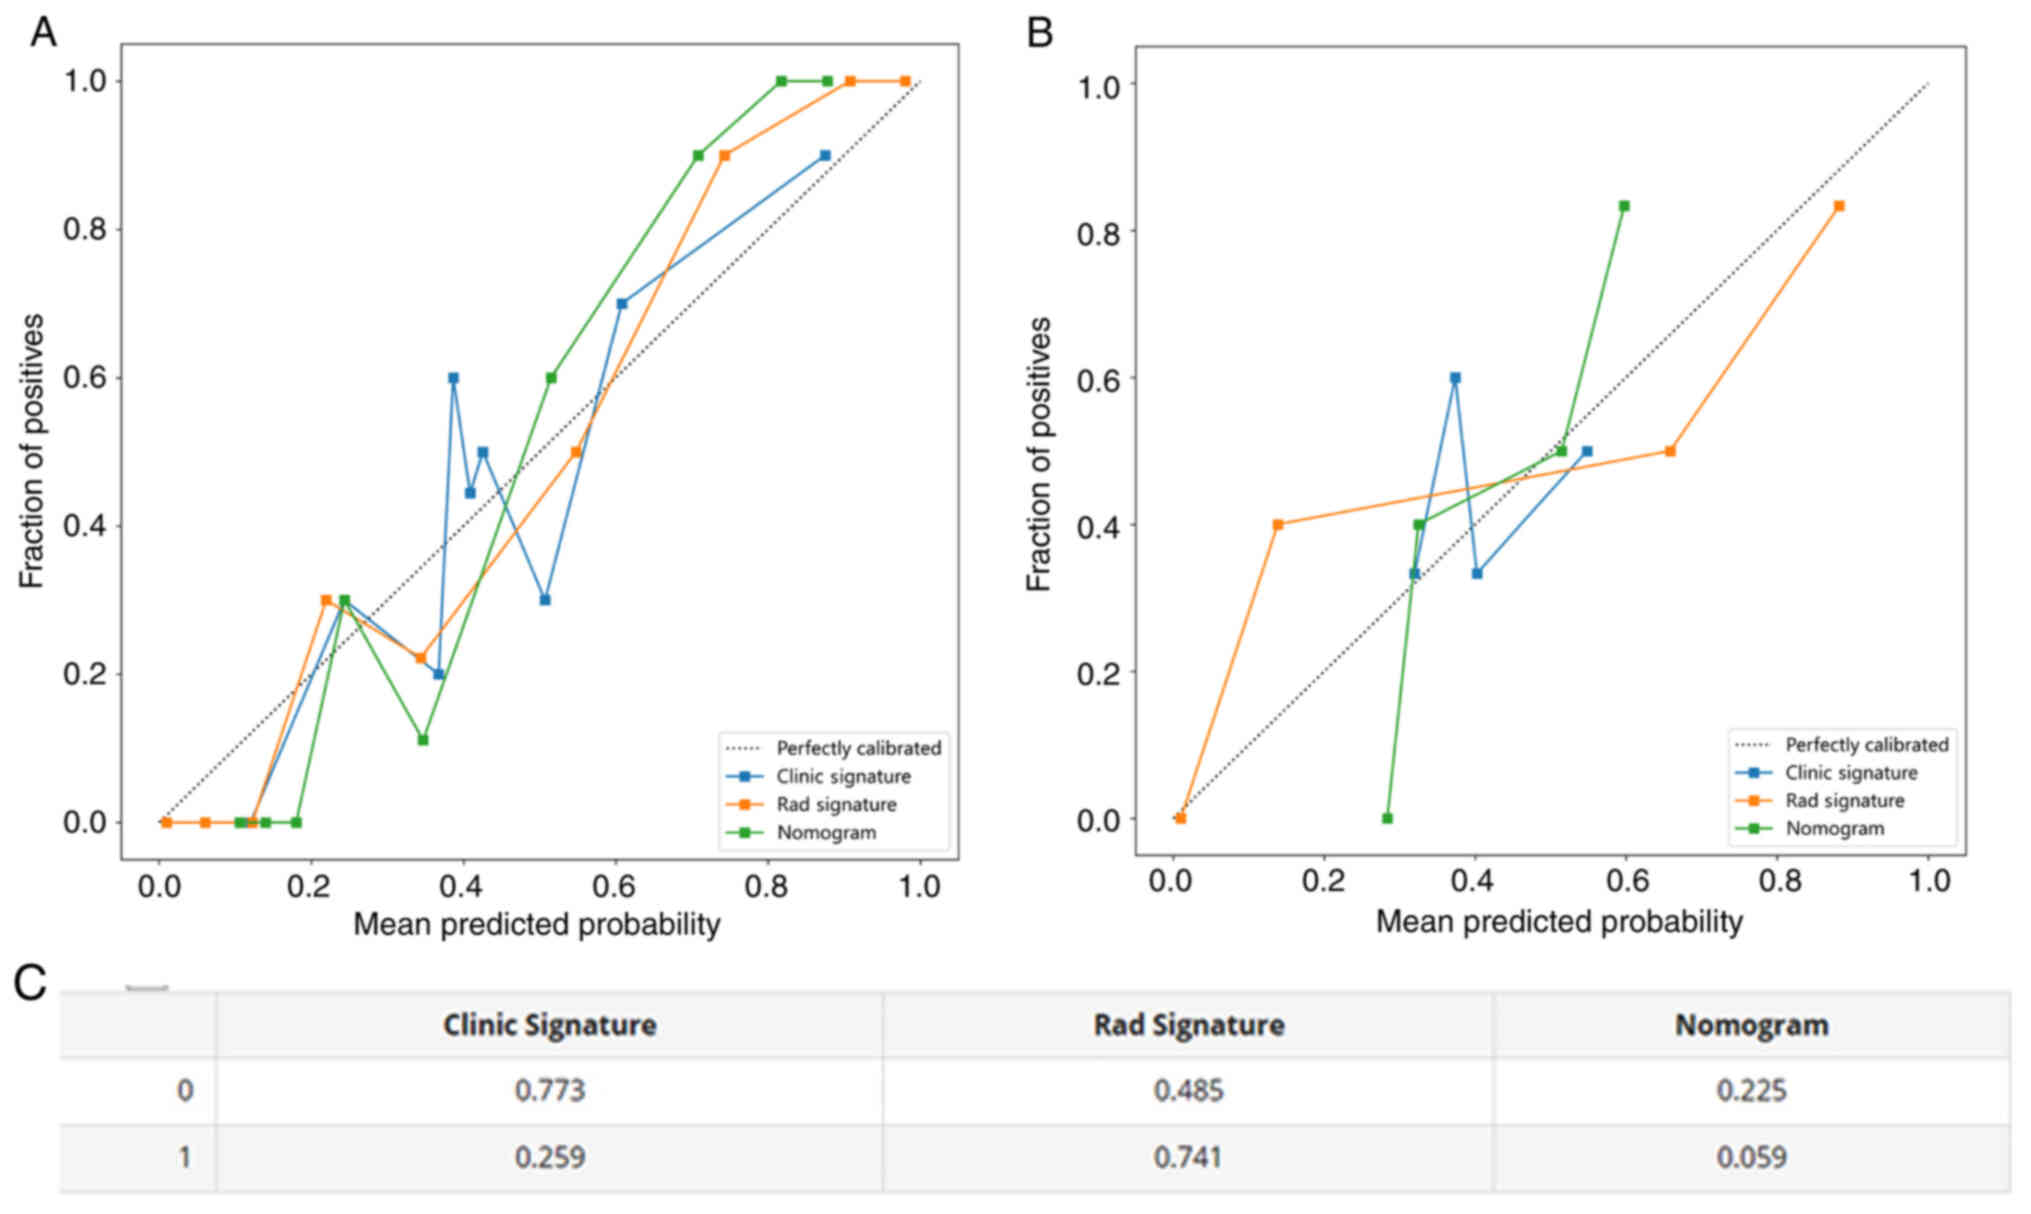
Calibration curves
Calibration curves of the nomogram exhibited a
strong agreement between predicted and observed values when
predicting pleural infiltration in both the training and testing
cohorts. The P-values obtained from the Hosmer-Lemeshow test were
used to evaluate the clinical signature, Rad signature and
nomogram, and the results revealed that the nomogram fitted
exceptionally well in both the training and testing cohorts.
Fig. 14A-C shows the calibration
curves for both the training and testing cohorts. Fig. 15 presents the DCA calibration curve
for the nomogram.
Discussion
In the present study, a tumor-derived radiomics
model based on chest CT images for the prediction of preoperative
VPI in LUAD was developed and independently validated. This model
has superior predictive performance compared with the single
imaging model or the clinical characterization model, suggesting
that it can help clinicians select the most effective treatment.
The endpoint of the present study was whether elastin fibre
staining indicated the presence of pleural invasion, and previous
studies have also shown that solid lung collapse or pulling under
the pleura is not equivalent to pleural invasion, with an accuracy
of only 71–95% (6,11–13).
VPI is currently defined as tumor invasion beyond
the elastic layer of the visceral pleura (i.e. PL1) or invasion of
the surface of the visceral pleura (i.e. PL2) according to the
‘Modified Hammar Classification’ (14). Previous meta-analyses indicated that
the degree of VPI was associated with the prognosis of patients
with non-small cell lung cancer who underwent surgical resection.
Furthermore, the prognosis was worse in the PL2 group compared with
the PL0 and PL1 groups (15,16).
Therefore, a model to predict the occurrence of VPI is necessary.
Several studies also found that pGGN did not undergo VPI (6,17). To
ensure the credibility of the data, all pGGNs were excluded from
the present study.
A previous study found that arch distance-to-maximum
tumor diameter ratios were more effective than conventional
criteria in diagnosing lung cancer (12). Tumor borders, pleural retraction and
tumor composition were also used to assess VPI (11,13,17–19). A
single CT image feature was only 62.7–72.3% accurate in the
postoperative confirmation of VPI (20). This suggests that the judgement of
VPI through human observation of CT images is still challenging,
even for specialist radiologists, due to differences in subjective
observation and experience of practitioners (7). A study examined the morphology of
stage IA lung cancer, and also used a deep-learning model to
evaluate VPI, and achieved a highly sensitive and specific
diagnosis (21).
It may be generally agreed that pulmonary nodules
with pathological findings confirming the presence of pleural
invasion have clear pleural changes visible to the microscopic
naked eye during lumpectomy (5). Of
note, pleural reactions (pleural traction sign, pleural depression
sign, etc.) were present on CT images of all patients enrolled in
the present study; however, some of these patients had no clear
submacular pleural changes under direct vision during lumpectomy,
and smaller (<1 cm diameter) pulmonary nodules were more
difficult to identify quickly. The model of the current study
predicted the presence of submacular pleural changes in patients,
thereby reducing unnecessary preoperative hook-and-wire
positioning, patient suffering and duration of hospitalization. The
model predicted the presence of subserosal pleural changes.
Conversely, for patients with low pleural invasion predicted by the
model, surgeons may have difficulty locating the lung nodule
intraoperatively and require preoperative localization to minimize
the time required to locate the lesion intraoperatively (22).
Patients at high risk of pleural infiltration as
predicted by the prediction model should undergo an anatomical
lobectomy to meet the margins, rather than partial resections, such
as a wedge resection, with waiting for intraoperative frozen
pathology results before further surgical treatment. This results
in a significant reduction in operative time, unnecessary
anesthetic drugs and tracheal intubation.
The present study had several limitations. First,
due to its retrospective design, the study has a certain risk of
selection bias. Furthermore, the study was a single-center
retrospective study. Hence, multi-center studies with larger
samples are warranted to support the findings of the present study.
Finally, although the internal validation of the model yielded good
discrimination, external validation is needed to prove its
generalizability. With the widespread use of positron electron
tomography/CT, metabolism-related indicators will be incorporated
in future studies. In addition, non-invasive LUADs are usually
considered to be free of pleural invasion, but some lung cancers at
the border of invasion still have a certain possibility of
developing pleural invasion (e.g., infiltration extent close to 0.5
cm). Subpleural solid lung collapse is demonstrated on CT images in
patients with noninvasive LUAD, and this is likewise a point of
interest in future studies
In conclusion, in the present study, CT histological
imaging and clinical features were combined to establish and
compare the efficacy of multiple models. Based on the dominant
model, a columnar line graph predicting the probability of VPI in
patients with invasive LUAD adjacent to the pleura was developed
and validated. The column line map is well-calibrated and
discriminatory, and is a potentially reliable tool for individual
assessment and clinical decision-making.
Acknowledgements
Not applicable.
Funding
This research was funded by the Key Research and Development
Program of Hebei Province (grant no. 22377790D).
Availability of data and materials
The datasets used and/or analyzed during the current
study are available from the corresponding author on reasonable
request.
Authors' contributions
LK and GD performed the collection of CT images and
the processing of image ROI outlines, and were major contributors
in writing the manuscript. WX performed the statistical analysis
and graphing. HZ performed the analysis and collection of
pathohistology. XZ performed the collection of clinical data and
contributed to the experimental design. SC performed the manuscript
drafting and contributed to the experimental design. DR
participated in the statistical analysis. LK and GD confirm the
authenticity of all the raw data. All authors have read and
approved the final manuscript.
Ethics approval and consent to
participate
This study was approved by the Ethics Committee of
Hebei General Hospital (no. 2023054). All patients signed a
treatment-related consent form during the consultation.
Retrospective information was recorded by the Hebei General
Hospital Medical Record System, which dispensed with the
requirement for informed patient consent.
Patient consent for publication
Not applicable.
Competing interests
The authors declare that they have no competing
interests.
References
|
1
|
Siegel RL, Miller KD and Jemal A: Cancer
Statistics, 2017. CA Cancer J Clin. 67:7–30. 2017. View Article : Google Scholar : PubMed/NCBI
|
|
2
|
Sung H, Ferlay J, Siegel RL, Laversanne M,
Soerjomataram I, Jemal A and Bray F: Global cancer statistics 2020:
GLOBOCAN estimates of incidence and mortality worldwide for 36
cancers in 185 countries. CA Cancer J Clin. 71:209–249. 2021.
View Article : Google Scholar : PubMed/NCBI
|
|
3
|
Goldstraw P, Chansky K, Crowley J,
Rami-Porta R, Asamura H, Eberhardt WE, Nicholson AG, Groome P,
Mitchell A, Bolejack V, et al: The IASLC lung cancer staging
project: Proposals for revision of the TNM Stage Groupings in the
Forthcoming (Eighth) Edition of the TNM classification for lung
cancer. J Thorac Oncol. 11:39–51. 2016. View Article : Google Scholar : PubMed/NCBI
|
|
4
|
Mizuno T, Arimura T, Kuroda H, Sakakura N,
Yatabe Y and Sakao Y: P2.16-34 visceral pleural invasion is closely
associated with nodal spread in cStage IA lung adenocarcinoma. J
Thorac Oncol. 13:S8452018. View Article : Google Scholar
|
|
5
|
Hwang JH, Song KS, Park SI, Lim TH, Kwon
KH and Goo DE: Subtle pleural metastasis without large effusion in
lung cancer patients: Preoperative detection on CT. Korean J
Radiol. 6:94–101. 2005. View Article : Google Scholar : PubMed/NCBI
|
|
6
|
Ahn SY, Park CM, Jeon YK, Kim H, Lee JH,
Hwang EJ and Goo JM: Predictive CT features of visceral pleural
invasion by T1-Sized peripheral pulmonary adenocarcinomas
manifesting as subsolid nodules. AJR Am J Roentgenol. 209:561–566.
2017. View Article : Google Scholar : PubMed/NCBI
|
|
7
|
Takizawa H, Kondo K, Kawakita N, Tsuboi M,
Toba H, Kajiura K, Kawakami Y, Sakiyama S, Tangoku A, Morishita A,
et al: Autofluorescence for the diagnosis of visceral pleural
invasion in non-small-cell lung cancer. Eur J Cardiothorac Surg.
53:987–992. 2018. View Article : Google Scholar : PubMed/NCBI
|
|
8
|
McShane LM, Altman DG, Sauerbrei W, Taube
SE, Gion M and Clark GM; Statistics Subcommittee of the NCI-EORTC
Working Group on Cancer Diagnostics, : Reporting recommendations
for tumor MARKer prognostic studies (REMARK). Nat Clin Pract Urol.
2:416–422. 2005. View Article : Google Scholar : PubMed/NCBI
|
|
9
|
Yushkevich PA, Piven J, Hazlett HC, Smith
RG, Ho S, Gee JC and Gerig G: User-guided 3D active contour
segmentation of anatomical structures: Significantly improved
efficiency and reliability. Neuroimage. 31:1116–1128. 2006.
View Article : Google Scholar : PubMed/NCBI
|
|
10
|
Jung G, Hwang HS, Jang SJ and Ro JY: Are
elastic stain and specialty sign out necessary to evaluate pleural
invasion in lung cancers? Ann Diagn Pathol. 16:250–254. 2012.
View Article : Google Scholar : PubMed/NCBI
|
|
11
|
Hsu JS, Han IT, Tsai TH, Lin SF, Jaw TS,
Liu GC, Chou SH, Chong IW and Chen CY: Pleural tags on CT scans to
predict visceral pleural invasion of non-small cell lung cancer
that does not abut the pleura. Radiology. 279:590–596. 2016.
View Article : Google Scholar : PubMed/NCBI
|
|
12
|
Imai K, Minamiya Y, Ishiyama K, Hashimoto
M, Saito H, Motoyama S, Sato Y and Ogawa J: Use of CT to evaluate
pleural invasion in non-small cell lung cancer: Measurement of the
ratio of the interface between tumor and neighboring structures to
maximum tumor diameter. Radiology. 267:619–626. 2013. View Article : Google Scholar : PubMed/NCBI
|
|
13
|
Yang S, Yang L, Teng L, Zhang S, Cui Y,
Cao Y and Shi H: Visceral pleural invasion by pulmonary
adenocarcinoma ≤3 cm: The pathological correlation with pleural
signs on computed tomography. J Thorac Dis. 10:3992–3999. 2018.
View Article : Google Scholar : PubMed/NCBI
|
|
14
|
Travis WD, Brambilla E, Rami-Porta R,
Vallières E, Tsuboi M, Rusch V and Goldstraw P; International
Staging Committee. Visceral pleural invasion, : Pathologic criteria
and use of elastic stains: Proposal for the 7th edition of the TNM
classification for lung cancer. J Thorac Oncol. 3:1384–1390. 2008.
View Article : Google Scholar : PubMed/NCBI
|
|
15
|
Wang T, Zhou C and Zhou Q: Extent of
visceral pleural invasion affects prognosis of resected non-small
cell lung cancer: A meta-analysis. Sci Rep. 7:15272017. View Article : Google Scholar : PubMed/NCBI
|
|
16
|
Liang RB, Li P, Li BT, Jin JT, Rusch VW,
Jones DR, Wu YL, Liu Q, Yang J, Yang MZ, et al: Modification of
pathologic T classification for non-small cell lung cancer with
visceral pleural invasion: Data from 1,055 cases of cancers ≤3 cm.
Chest. 160:754–764. 2021. View Article : Google Scholar : PubMed/NCBI
|
|
17
|
Zhao Q, Wang JW, Yang L, Xue LY and Lu WW:
CT diagnosis of pleural and stromal invasion in malignant
subpleural pure ground-glass nodules: An exploratory study. Eur
Radiol. 29:279–286. 2019. View Article : Google Scholar : PubMed/NCBI
|
|
18
|
Zuo Z, Li Y, Peng K, Li X, Tan Q, Mo Y,
Lan Y, Zeng W and Qi W: CT texture analysis-based nomogram for the
preoperative prediction of visceral pleural invasion in cT1N0M0
lung adenocarcinoma: An external validation cohort study. Clin
Radiol. 77:e215–e221. 2022. View Article : Google Scholar : PubMed/NCBI
|
|
19
|
Iizuka S, Kawase A, Oiwa H, Ema T, Shiiya
N and Funai K: A risk scoring system for predicting visceral
pleural invasion in non-small lung cancer patients. Gen Thorac
Cardiovasc Surg. 67:876–879. 2019. View Article : Google Scholar : PubMed/NCBI
|
|
20
|
Kim H, Goo JM, Kim YT and Park CM:
CT-defined visceral pleural invasion in T1 lung adenocarcinoma:
Lack of relationship to disease-free survival. Radiology.
292:741–749. 2019. View Article : Google Scholar : PubMed/NCBI
|
|
21
|
Choi H, Kim H, Hong W, Park J, Hwang EJ,
Park CM, Kim YT and Goo JM: Prediction of visceral pleural invasion
in lung cancer on CT: Deep learning model achieves a
radiologist-level performance with adaptive sensitivity and
specificity to clinical needs. Eur Radiol. 31:2866–2876. 2021.
View Article : Google Scholar : PubMed/NCBI
|
|
22
|
Klinkenberg TJ, Dinjens L, Wolf RFE, van
der Wekken AJ, van de Wauwer C, de Bock GH, Timens W, Mariani MA
and Groen HJM: CT-guided percutaneous hookwire localization
increases the efficacy and safety of VATS for pulmonary nodules. J
Surg Oncol. 115:898–904. 2017. View Article : Google Scholar : PubMed/NCBI
|