Introduction
Gastric cancer remains a leading cause of death
worldwide. According to the World Health Organization database
GLOBOCAN, gastric cancer is the fourth leading cause of cancer
death, accounting for 7.7% of all cancer-related deaths. In
addition, gastric cancer is the fifth most common cancer,
accounting for 5.6% of the total cancer cases (1). The incidence of gastric cancer varies
by region, with the highest rates reported in East Asia, Eastern
Europe and South America and the lowest rates in North America and
parts of Africa. Furthermore, the incidence is frequently higher in
males than in females (1). Although
the incidence of gastric cancer is declining owing to reduced
Helicobacter pylori infection rates, the incidence of
carcinoma of the fundic region remains problematic. The prognosis
of gastric cancer is stratified according to the
tumor-node-metastasis (TNM) classification and multidisciplinary
treatment is required. Despite advances in surgical techniques and
chemotherapy, the prognosis for advanced cases remains poor. An
international collaborative study (CONCRD-3) covering 71 countries
and territories reported 5-year survival rates of only 20–40%
(2).
Future perspectives for gastric cancer suggest that
treatment strategies will move toward personalized medicine.
Crucial elements in the field of personalized medicine include
identifying factors that can accurately stratify patient response
before the first therapeutic intervention, as well as the
development of methods to determine actual treatment outcomes and
prognosis. However, the human body is complex, with several
nonlinear factors affecting survival. Most conventional methods for
evaluating the prognosis of gastric cancer use a combination of
specific biomarkers that are indicators of inflammation and
nutritional status; however, their predictive accuracy is
inadequate. As surrogate markers for evaluating the prognosis of
gastrointestinal cancer, the advantages of TNM classification,
pathological findings and grading using a combination of blood
sampling data and features obtained from imaging tests (e.g.,
standardized uptake value by fluorodeoxyglucose-positron emission
tomography) have been documented (3,4).
However, although these results have been evaluated to a certain
extent, they are not considered objective and versatile models
owing to poor reproducibility and differences in results across
institutions. This may be partly as indicators consist of a single
or combination of factors, they are easy to grasp visually and it
is easy to infer a causal relationship with outcomes, leading us to
focus on indicators that are easy to perceive sensibly.
The essence of cancer lies in heterogeneity. To
overcome the complexity of cancer and achieve personalized
treatment, it is essential to utilize the advantages of AI to
integrate and analyze general test information, clinical data and
modality information handled in daily clinical practice in a
multilayered manner by employing AI-based machine learning
technology.
To date, extracting meaningful information from
large data sets with multiple input variables remains a
considerable challenge; however, artificial intelligence (AI)
techniques have facilitated advances in this field. Machine
learning is a branch of AI technology that allows computers to
‘learn’ potential patterns from past examples. The use of machine
learning approaches to predict new data by utilizing identified
patterns can help detect patterns that can be difficult to
recognize from complex combinations of multiple biomarkers.
The object of the present study was to utilize blood
data used in real-world clinical practice and employ AI techniques
to evaluate the prognosis of gastric cancer, followed by data
stratification distinct from that of the traditional TNM
classification.
Materials and methods
Study design and patients
The current retrospective study evaluated 1,687
patients with gastric cancer who had undergone surgical treatment
at Chiba Cancer Center between January 2007 and December 2016.
Table I summarizes the demographic
characteristics of the patients. Among the 1,687 patients, 1,185
(70.2%) were males, while 502 (29.8%) were females and the age
ranged from 29 to 92 years (median: 67 years). Considering the TNM
stage, 1,171 (69.4%), 173 (10.3%), 243 (14.4%) and 100 (5.9%)
patients had stage I, II, III and IV disease, respectively. The
present study retrospectively examined 35 clinicopathological
parameters, including age at diagnosis, preoperative biochemical
data and tumor markers. This study was approved by the Chiba Cancer
Center Review Board (approval no. H29-006) and was conducted in
accordance with the ethical principles of the Declaration of
Helsinki. All patients provided written informed consent to
participate.
 | Table I.Patient details and
clinicopathological features. |
Table I.
Patient details and
clinicopathological features.
| Clinicopathological
feature | Gastric cancer |
|---|
| Number | 1,687 |
| Sex, n (%) |
|
|
Male, | 1,185 (70.2) |
|
Female | 502 (29.8) |
| Mean age,
years | 67 |
| Age range,
years | 29-92 |
| Depth of tumor
invasion, n (%) |
|
| T1 | 874 (51.8) |
| T2 | 427 (25.3) |
| T3 | 336 (20.1) |
| T4 | 50 (2.8) |
| Lymph node
metastasis, n (%) |
|
|
Positive | 449 (26.6) |
|
Negative | 1,238 (73.4) |
| Distant metastasis,
n (%) |
|
|
Positive | 92 (5.5) |
|
Negative | 1,595 (94.5) |
| TNM stage, n
(%) |
|
| I | 1,171 (69.4) |
| II | 173 (10.3) |
|
III | 243 (14.4) |
| IV | 100 (5.9) |
Supervised machine learning
classifiers
To predict survival after 5 years based on
clinicopathological data (Task 1) and relapse after 5 years (Task
2), experiments were performed using four machine learning methods,
namely, logistic regression (LR), random forest (RF), gradient
boosting (GB) and deep neural network (DNN).
LR is a general linear model for two-class problems,
where a linear combination of each feature explains the log odds of
the posterior probability of each class. Therefore, it is also
possible to interpret the size of regression coefficients
corresponding to each feature as the importance of that feature
(5). The present study used the
least absolute shrinkage and selection operator-type LR, which
imposed the L1 norm of regression coefficients as a constraint to
obtain a sparse solution.
RF and GB are ensemble learning methods using
decision tree and weak learners. RF creates multiple distinct
decision trees using randomness in learning the decision trees,
subsequently integrating them for classifier construction (6). GB updates decision trees sequentially
and, after a specified number of updates, classifier construction
is achieved by integrating all decision trees with a weighted sum
(7). The DNN used in the present
study was a deep learning model for tabular numerical data, which
includes a layer estimating the importance of features from the
data (8).
All machine learning methods were implemented using
Python Version 3 (9), and LR and RF
were implemented using the Scikit-learn library (10). GB was implemented using xgboost
(11) and DNN was implemented using
TensorFlow backend and Keras API (12). The machine learning methods used in
the present study can effectively estimate the importance of
features for classification. Therefore, important features for each
task were selected using these four methods. However, the range of
values of each feature can generally differ considerably and thus a
comparison of the estimated feature importance may not be
reasonable. Therefore, data normalization was performed as
preprocessing to ensure each feature would have the same scale.
Clustering and visualization using 10
significant features
The importance of each machine learning method was
ranked in descending order and the top m features were employed to
perform clustering using the k-medoids method. Unlike the k-means
method, the k-medoids method utilizes the center of gravity as the
representative point of each cluster and uses medoids as the
representative point of the cluster. The medoids are calculated as
follows: argminxєxi ∑yє(xi-x) d(x,y),
where Xi={x} are clusters and d(x,y) is
the dissimilarity between data x and y. Additionally,
the k-medoids method performs clustering by minimizing the sum of
distances between the medoid and data points. Unlike the k-means
method, which evaluates loss using the square of the distance, the
k-medoids method evaluates loss using the absolute value of the
distance. Thus, the k-medoids method is less affected by outliers.
Clustering is performed in a high-dimensional space and, as such,
it is not possible to directly evaluate the results. Therefore,
t-distributed stochastic neighbor embedding (t-SNE) was used to
project data onto a two-dimensional space and visually evaluate
results qualitatively.
Results
Gastric cancer prognosis based on
multiple preoperative blood markers
The 5-year survival rate of patients with gastric
cancer was predicted using multiple supervised machine learning
methods (Task 1; Table II). The
predictive accuracy and area under the curve (AUC) were 76.8% and
0.702 for LR, 72.5% and 0.721 for RF, 75.3% and 0.73 for GB and
76.9% and 0.682 for DNN, respectively. Similarly, multiple
supervised machine learning methods were employed to predict the
5-year recurrence-free survival rate of patients with gastric
cancer (Task 2; Table II). The
prediction accuracy and AUC were 85.5% and 0.692 for LR, 79.0% and
0.721 for RF, 80.5% and 0.718 for GB and 83.2% and 0.670 for DNN,
respectively. These supervised machine learning analyses were
reasonably accurate in evaluating prognosis and recurrence using
clinical data.
| Table II.Predicting 5-year gastric cancer
survival using multiple supervised machine learning methods and
Significant Features Ranking. |
Table II.
Predicting 5-year gastric cancer
survival using multiple supervised machine learning methods and
Significant Features Ranking.
| A, Predicting
5-year gastric cancer survival |
|---|
|
|---|
| AI | Logistic
regression | Random forest | Gradient
boosting | Deep neural
network |
|---|
| Task 1 |
|
|
|
|
|
Accuracy, % | 76.8 | 72.5 | 75.3 | 76.9 |
|
AUC | 0.702 | 0.721 | 0.73 | 0.682 |
| Task 2 |
|
|
|
|
|
Accuracy, % | 85.5 | 79 | 80.5 | 83.2 |
|
AUC | 0.692 | 0.721 | 0.718 | 0.67 |
|
| B, Significant
Features Ranking |
|
| AI | Logistic
regression | Random
forest | Gradient
boosting | Deep neural
network |
|
| Task 1 |
|
|
|
|
| 1 | ALB | Hct | ALB | ALB |
| 2 | PLT | ALB | Hgb | CEA |
| 3 | PCT | Hgb | Hct | P.T |
| 4 | Hgb | CA19-9 | CEA | CA19-9 |
| 5 | P.T | CEA | CA19-9 | Cl |
| 6 | Cl | RBC | Cl | BUN |
| 7 | CA19-9 | RDW | age | age |
| 8 | MPV | age | RBC | Hgb |
| 9 | CEA | Ly | ALT | LDH |
| 10 | PDW | MCH | RDW | PDW |
| Task 2 |
|
|
|
|
| 1 | PCT | ALB | ALB | MCHC |
| 2 | MCHC | MCHC | Hgb | P.T |
| 3 | PLT | CEA | MCHC | TP |
| 4 | NEU | Hgb | CEA | RDW |
| 5 | RDW | Hct | P.T | AST |
| 6 | TP | CA19-9 | TP | CRNN |
| 7 | Hgb | PT | Hct | MPV |
| 8 | Ly | TP | CA19-9 | WBC |
| 9 | MCV | RBC | AST | ALP |
| 10 | ALB | PCT | age | BUN |
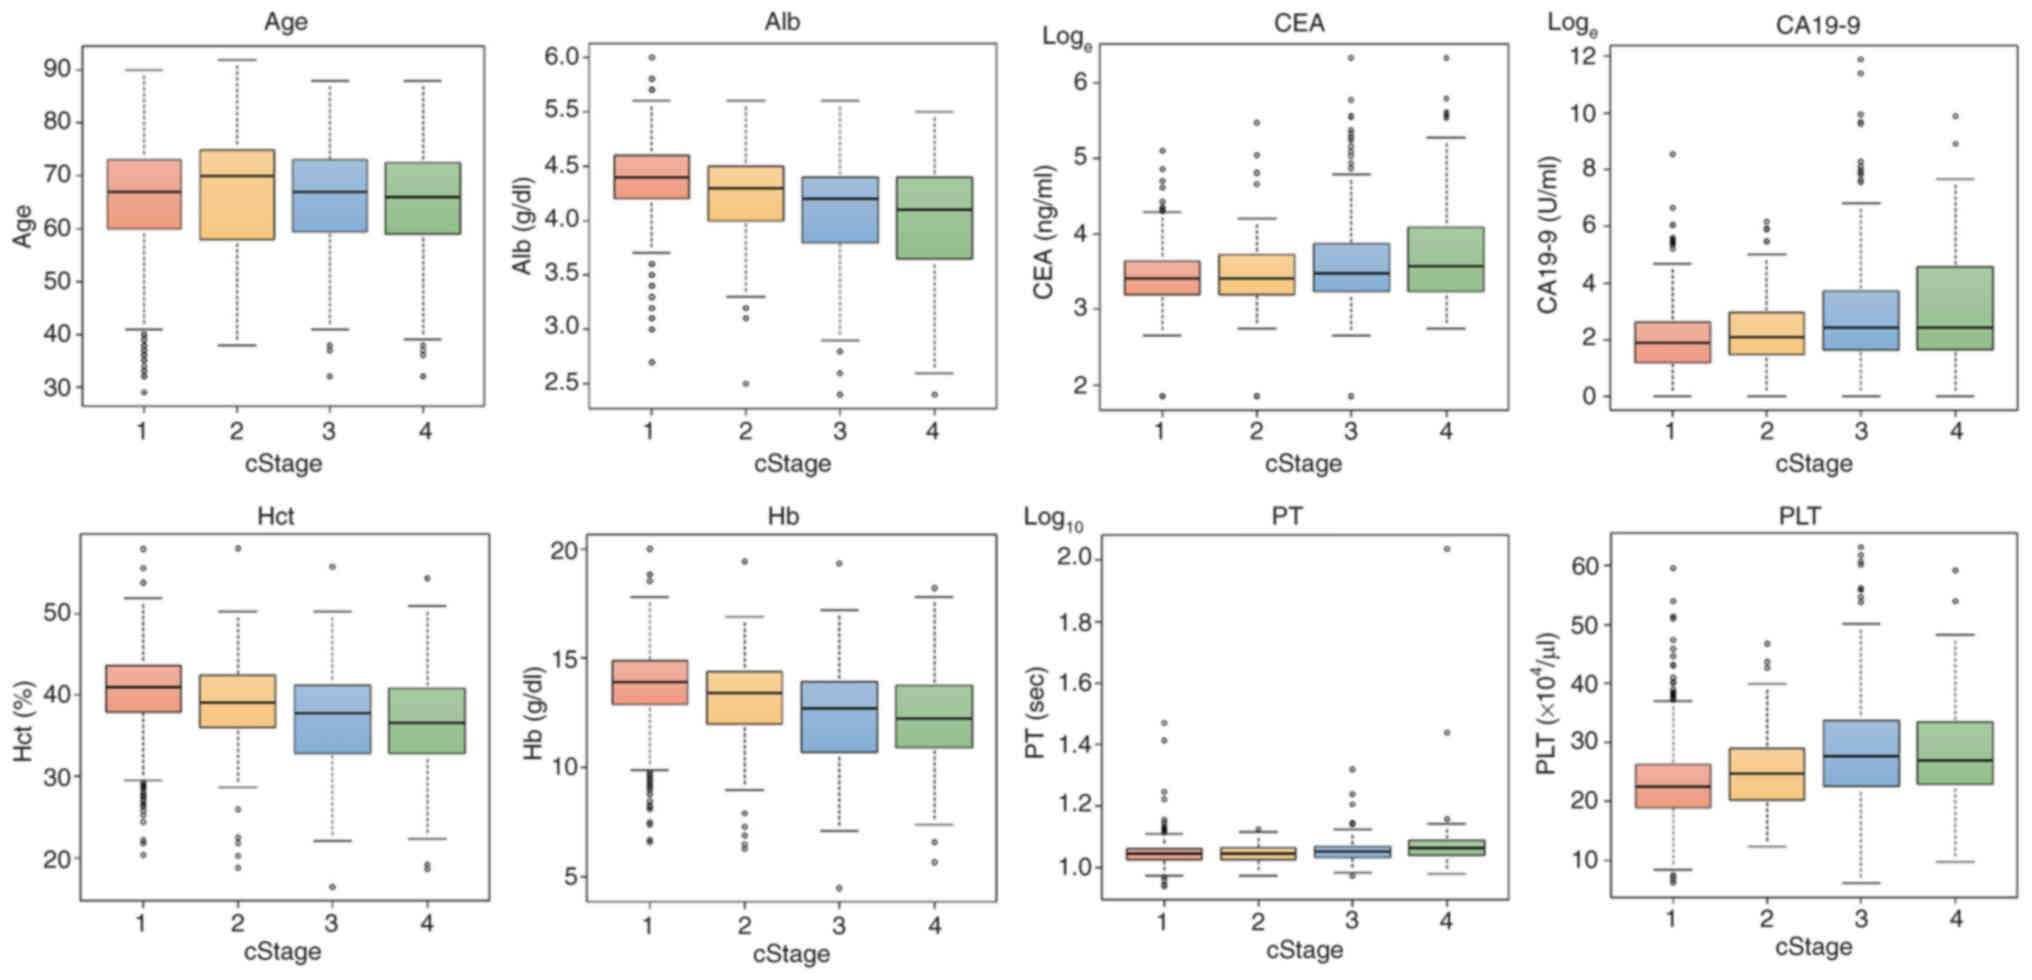
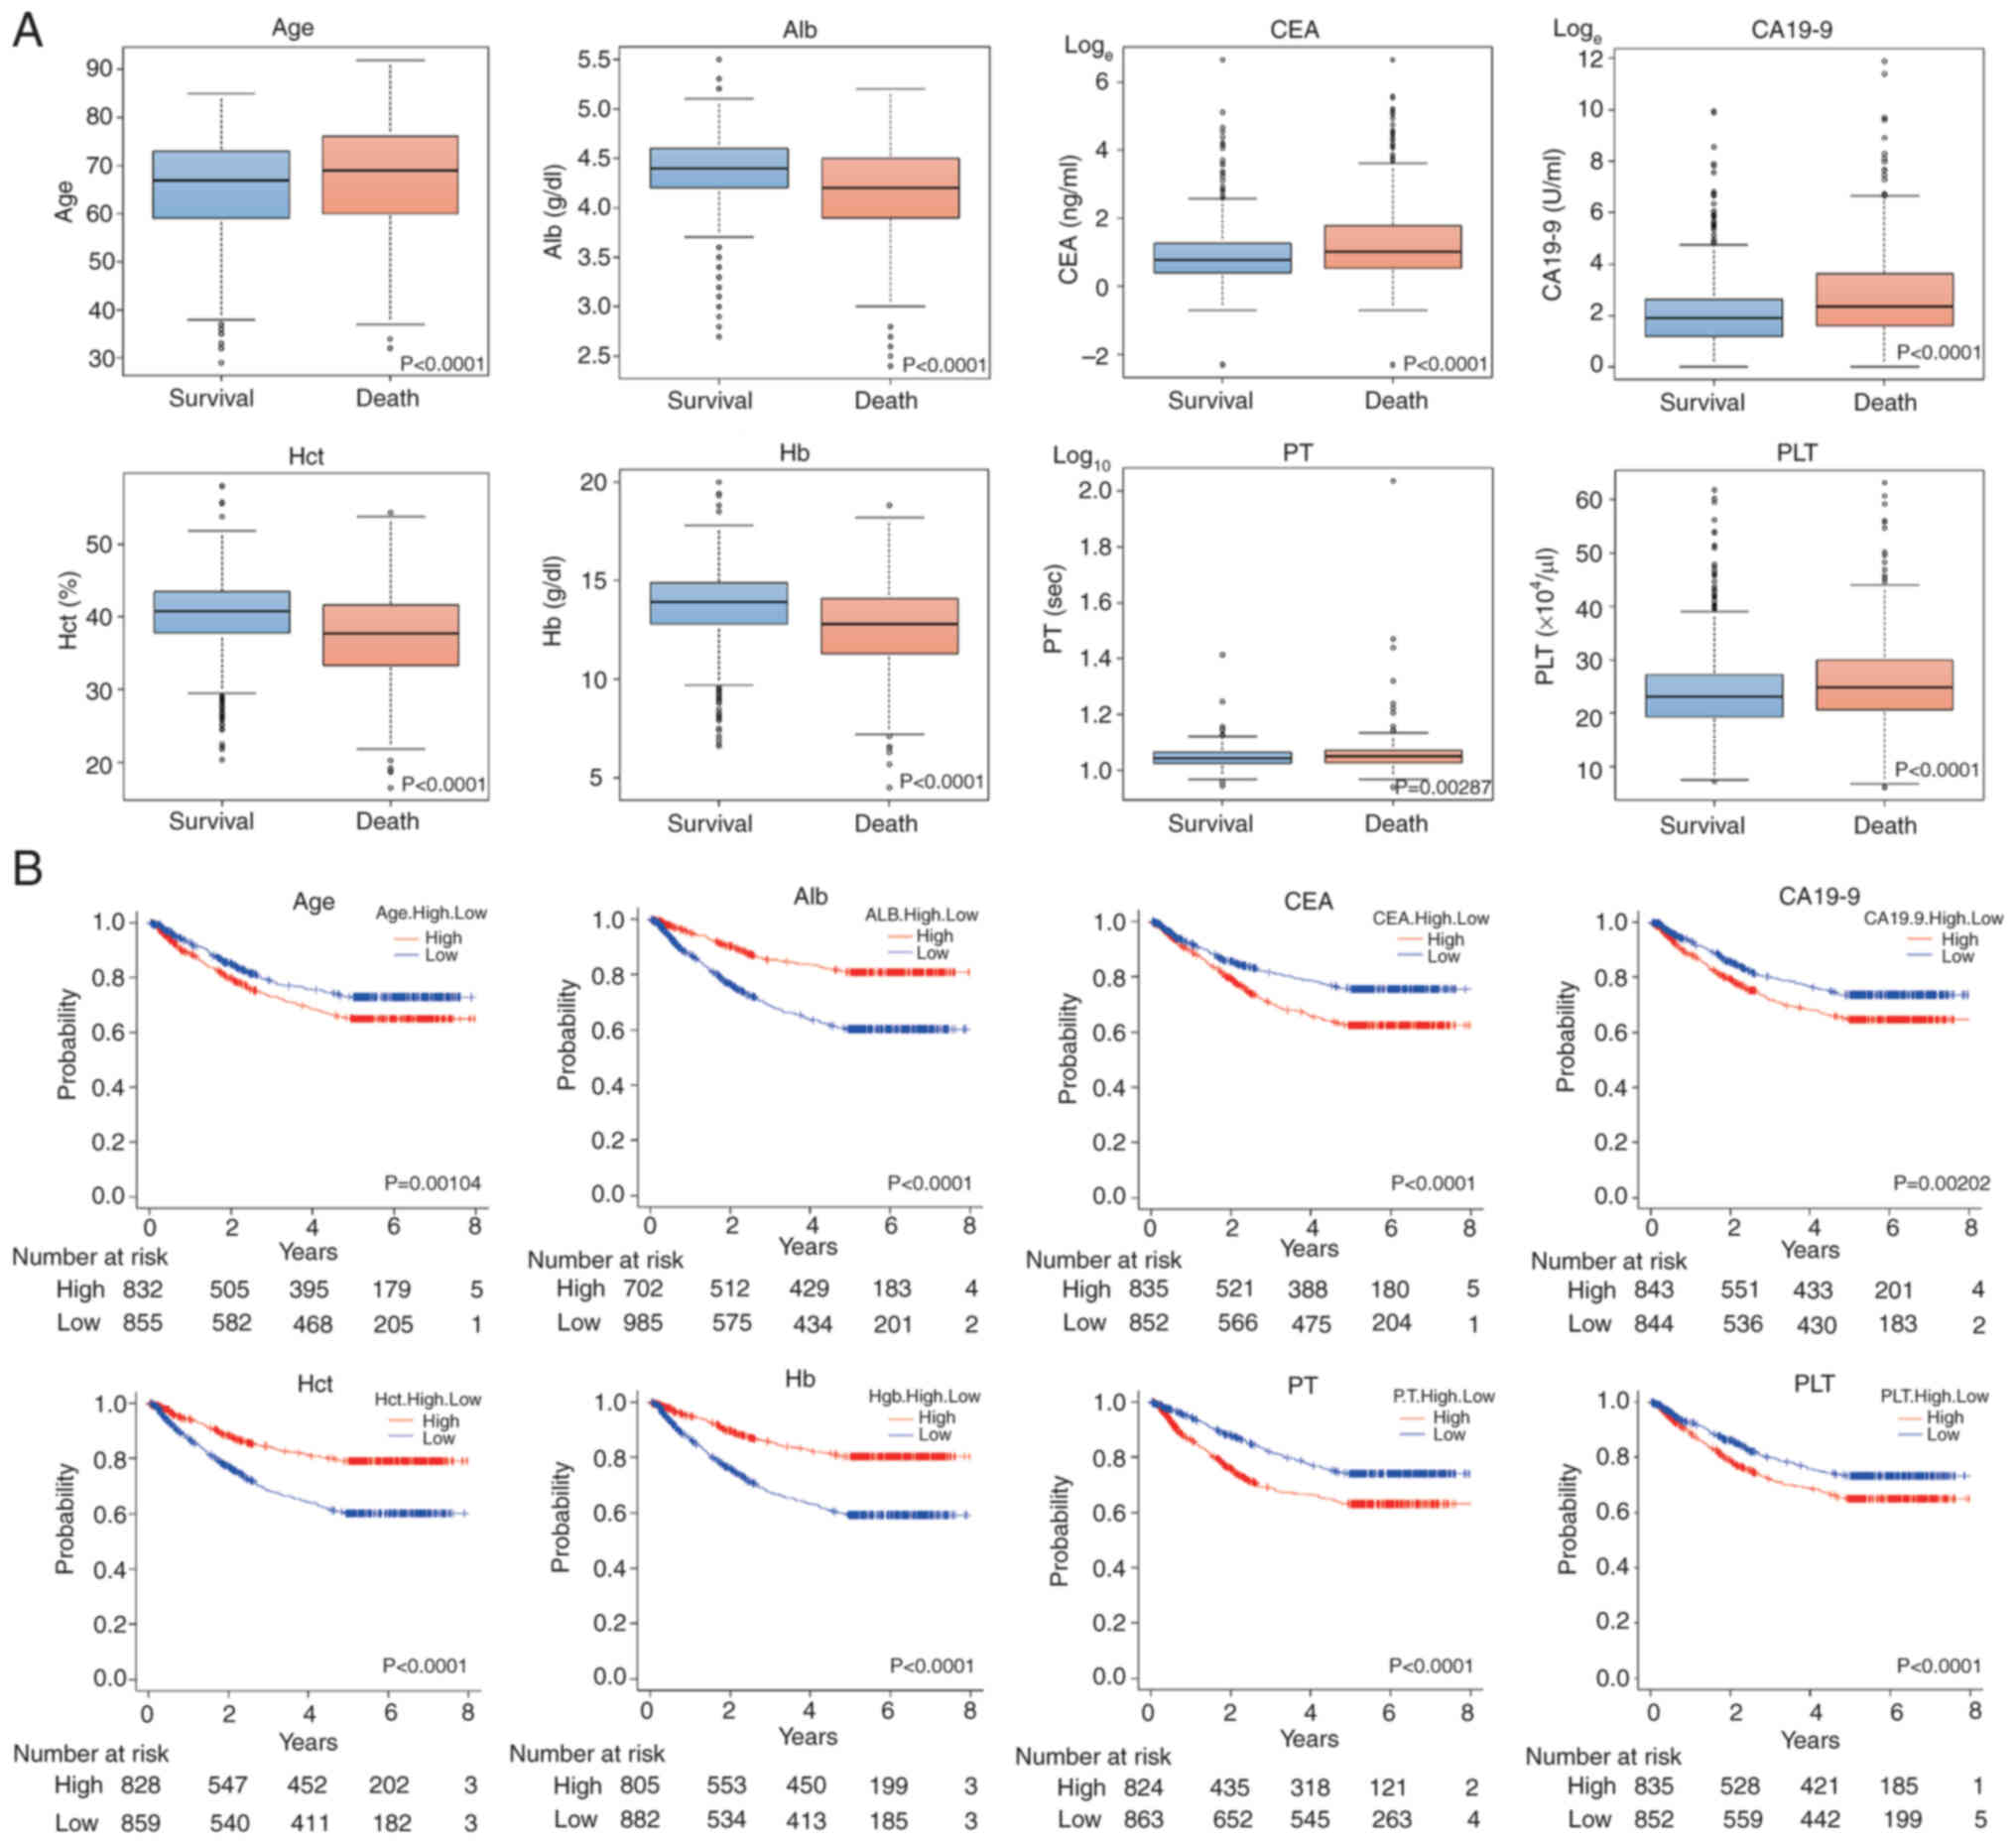
Next, important features were extracted for
analyzing prognosis (Table II).
The top 10 features were selected for each of the four AIs. Based
on the results, selected features differed for each AI method.
However, for 5-year overall survival, age and serum levels of tumor
markers, including albumin (ALB), carcinoembryonic antigen (CEA),
carbohydrate antigen (CA)19-9, hematocrit (Hct), hemoglobin level
(Hb), prothrombin time (PT) and platelet (PLT) count, were selected
for most AIs. Fig. 1 presents the
box-and-whisker plots for each feature by progression level and
Fig. 2A presents the
box-and-whisker diagrams divided by 5-year survival for Task 1 of
each feature. In addition, Fig. 2B
shows Kaplan-Meier (KM) curves divided into two groups by the
median value of each feature.
Next, important features were extracted for the
recurrence analysis. The top 10 features were selected for each of
the four AIs. The results revealed differences in features selected
for each AI (Table II). However,
for the 5-year recurrence-free survival, the tumor markers CEA and
CA19-9, as well as ALB, total protein (TP), Hb, mean corpuscular
hemoglobin concentration (MCHC), PT and procalcitonin level (PCT)
were similarly selected in several AIs. Fig. S1A presents the box-and-whisker
diagrams for each selected feature by progression. Fig. S1B shows the box-and-whisker plots
of 5-year recurrence-free survival for Task 2 of each feature.
Fig. S1C presents the KM curves
divided into two groups by the median of each feature.
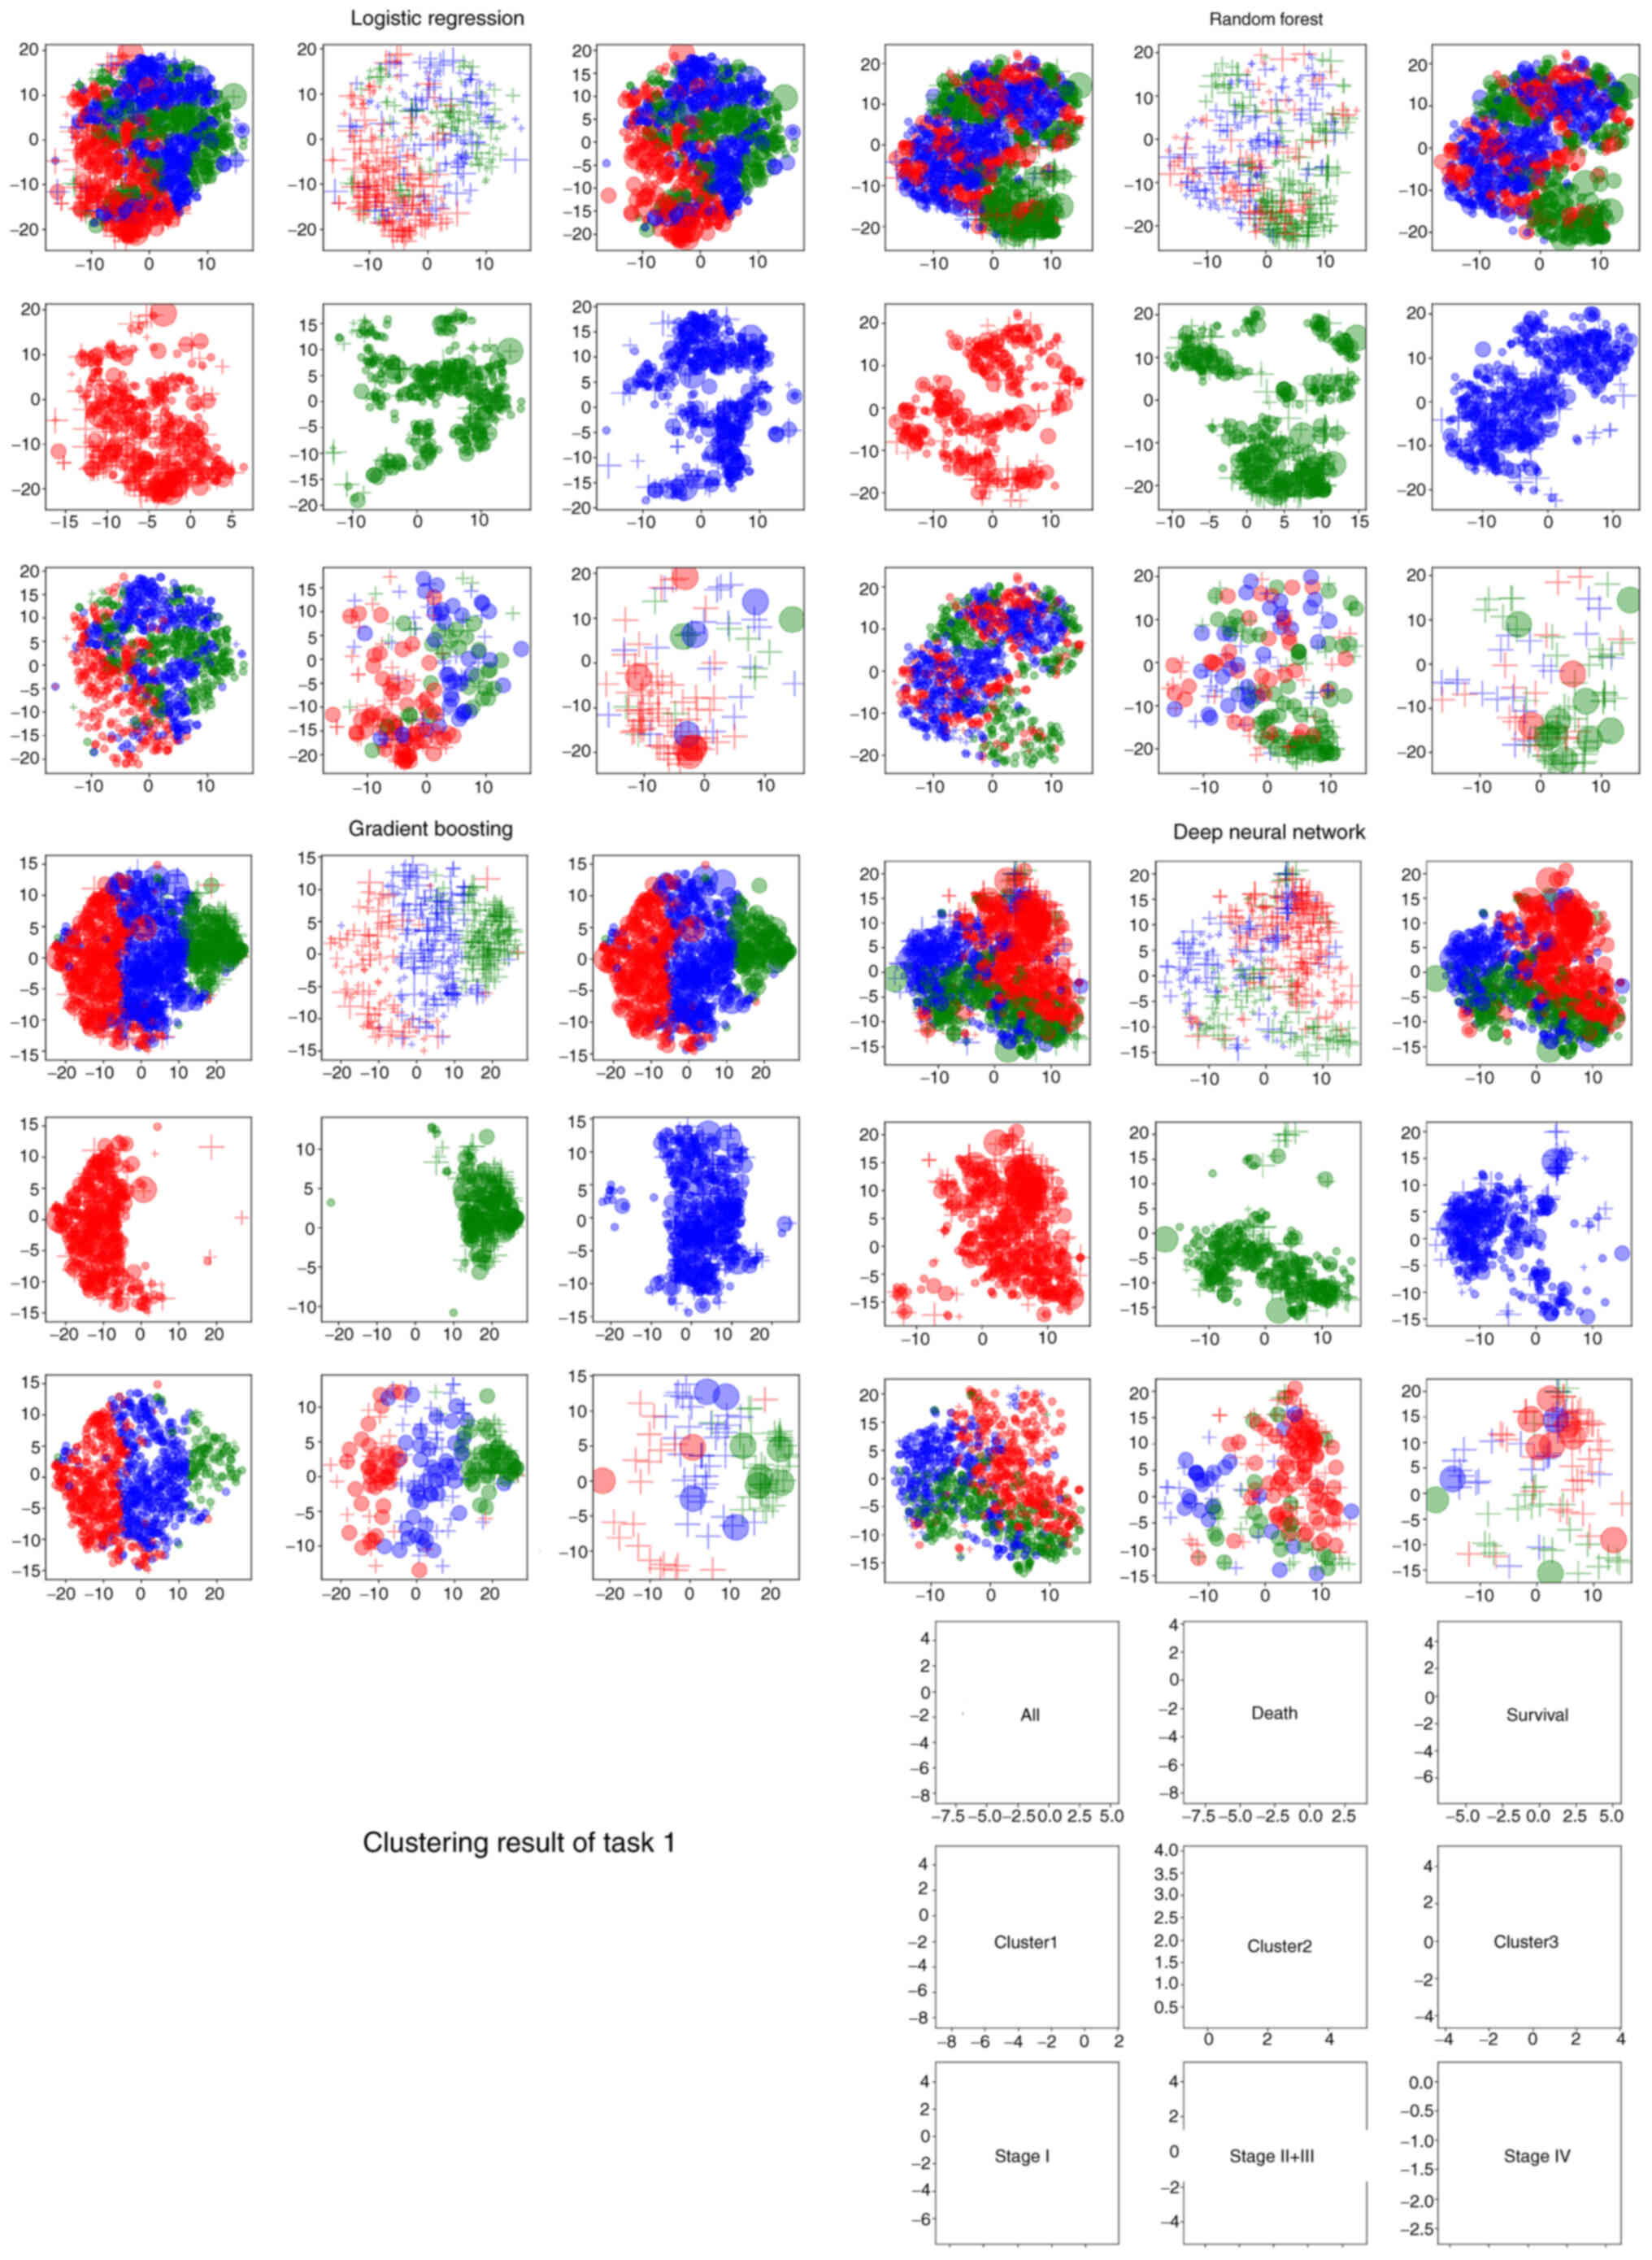
Clustering analysis of prognosis using
the machine learning approach
Next, clustering analysis was performed to identify
specific patient subgroups with various prognoses based on the same
35 preoperative blood markers and age. Clustering was performed
using the top 10 features extracted for each AI. The k-medoids
method was used to visualize clustering results in 10-dimensional
space, which were transformed into two dimensions using t-SNE
(Fig. 3). In the visualization,
each cluster was represented by a color, each stage was represented
by a plot size and the prognosis was represented by a symbol to
indicate differences among data.
A total of 10 factors were used for clustering in
each of the four AIs as follows: i) in LR: ALB, PLT count, PCT, Hb,
PT, Cl, CA19-9, mean platelet volume (MPV), CEA and platelet
distribution width (PDW); ii) in RF: Hct, ALB, Hb, CA19-9, CEA, red
blood cell count (RBC), red cell distribution width (RDW), age, Ly
and MCHC; iii) in GB: ALB, Hb, Hct, CEA, CA19-9, Cl, age, RBC,
alanine transaminase level and RDW; and iv) in DNN: ALB, CEA, PT,
CA19-9, Cl, blood urea nitrogen level (BUN), age, Hgb, lactate
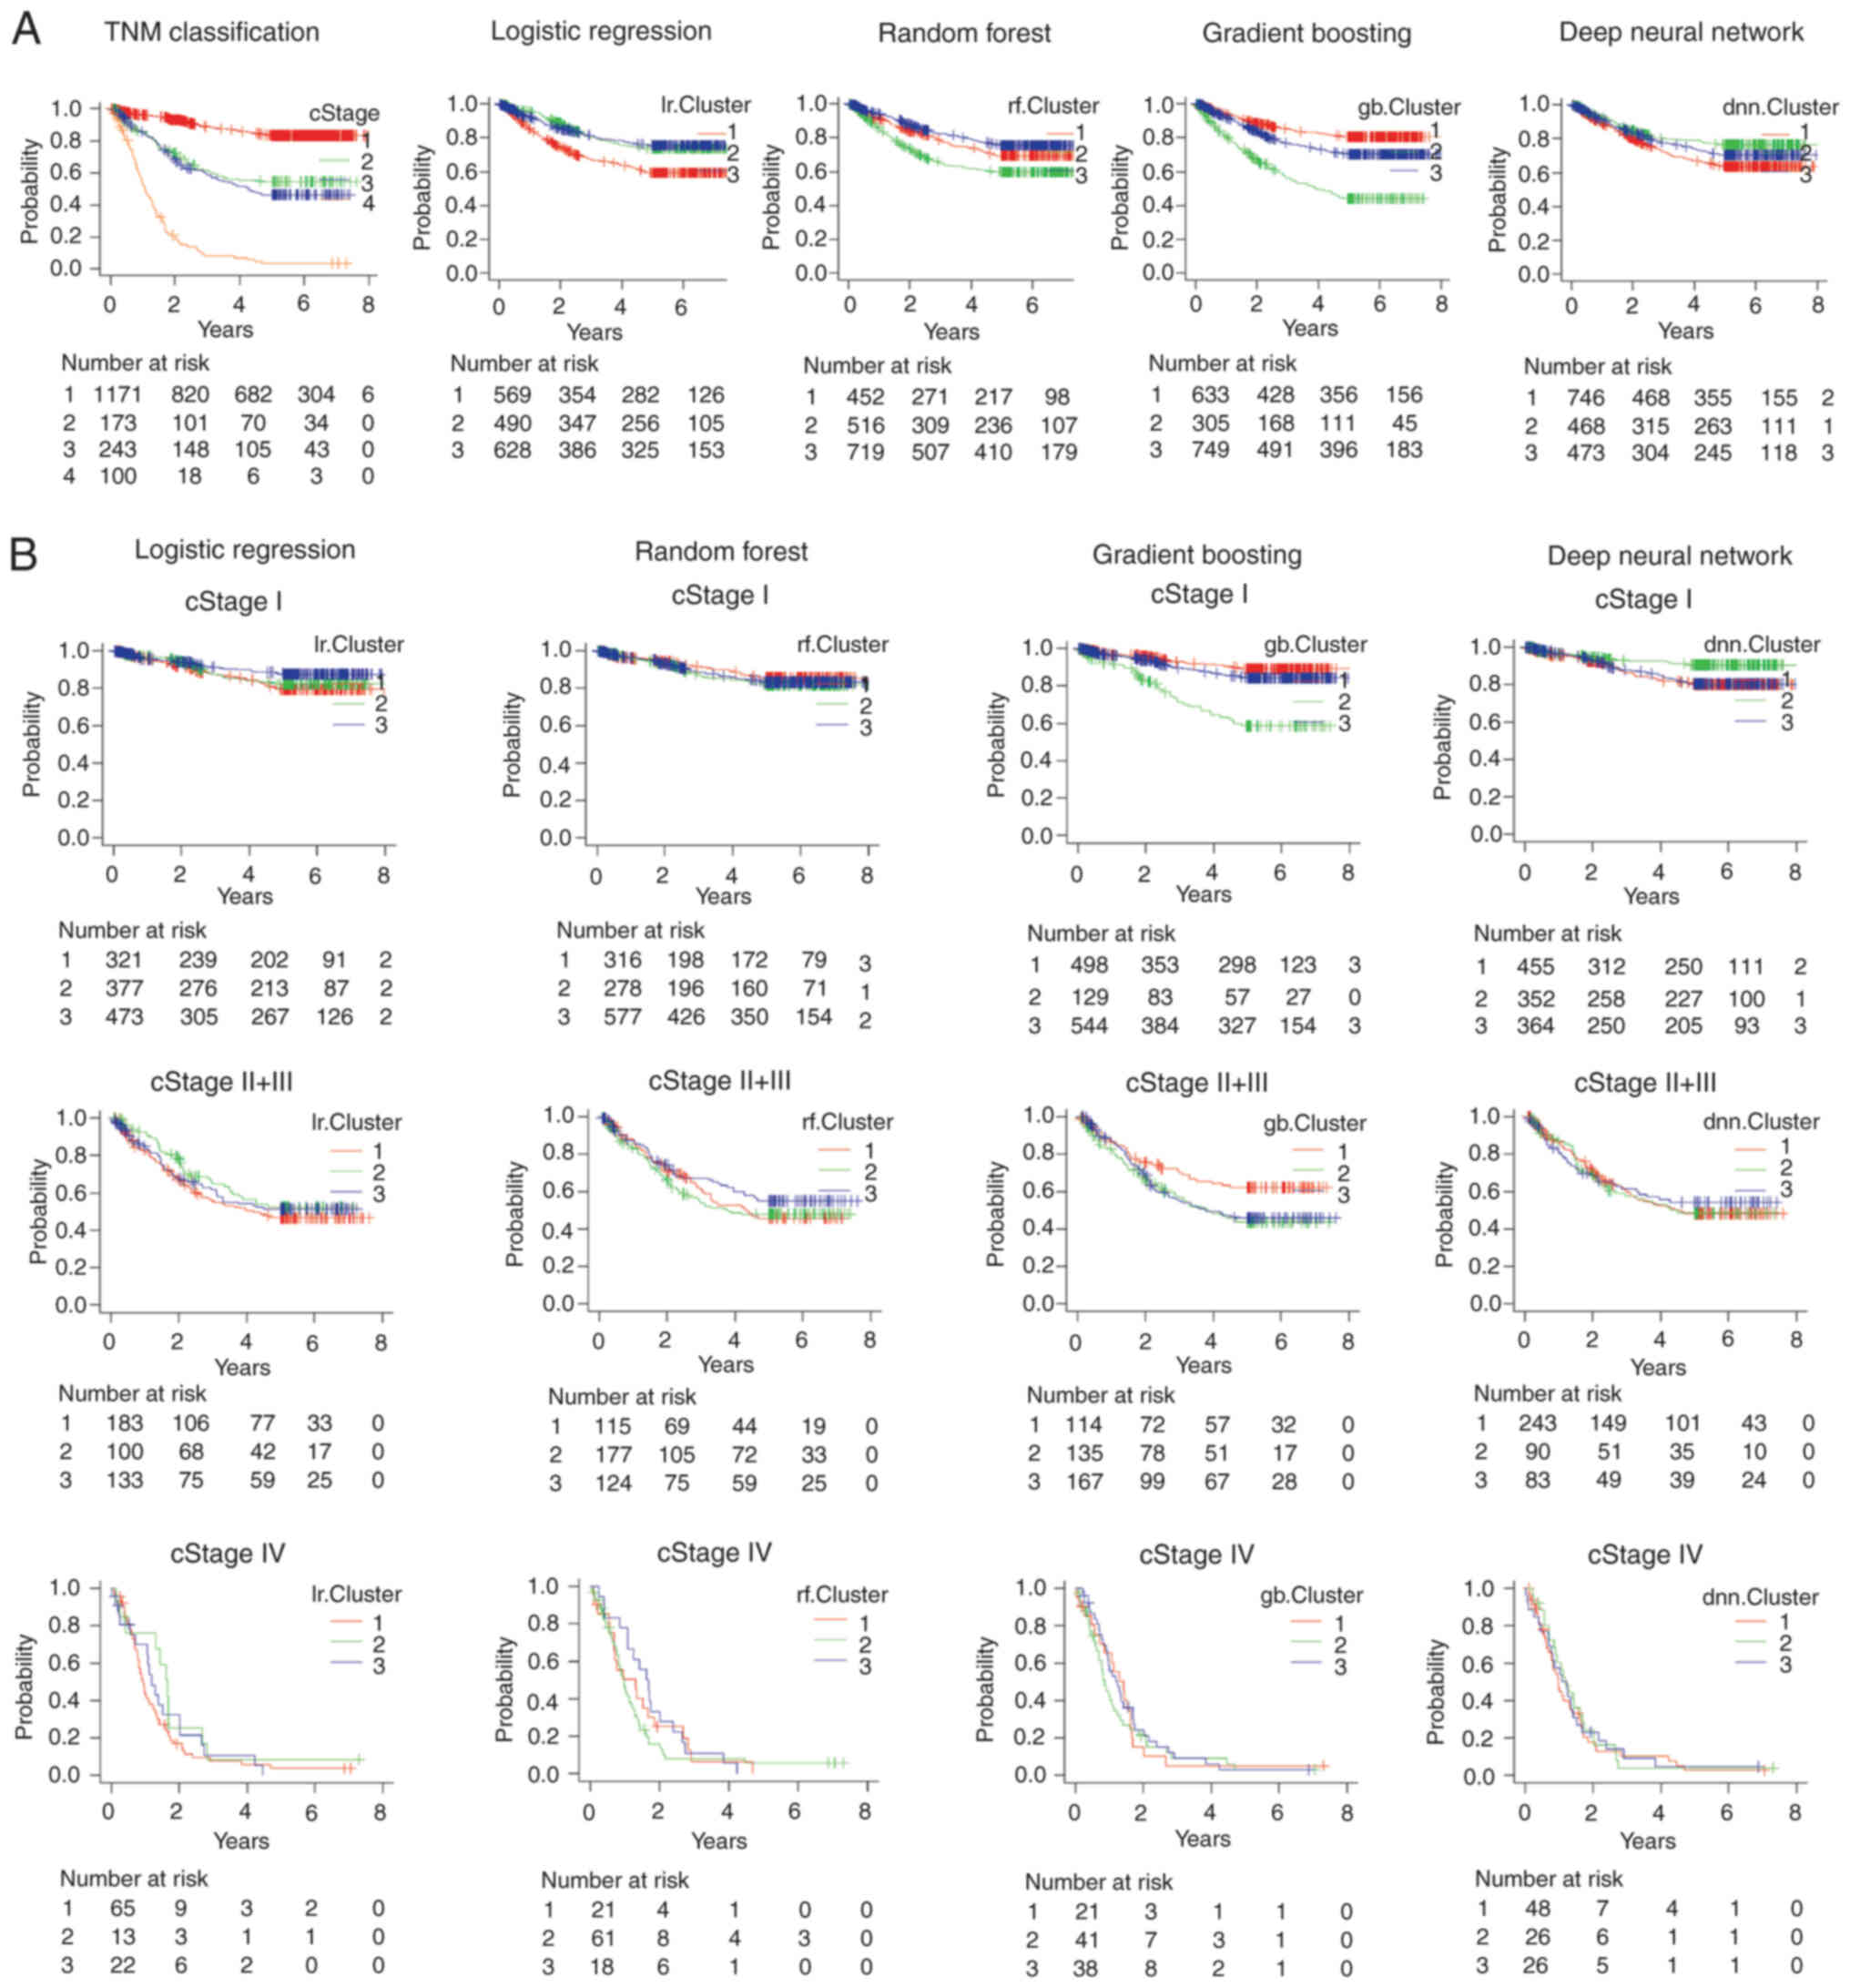
dehydrogenase level and PDW. Clustering was performed in three
groups. The KM curve was plotted for the three clusters and the
results of all AI clustering revealed significant differences in
prognosis (Fig. 4A). The KM curves
for each stage of progression (cStage I, cStage II+III and cStage
IV) showed that all AIs in stage I clustered in different
prognostic groups. In stage II+III, GB data were divided into three
clusters with different prognoses (Fig.
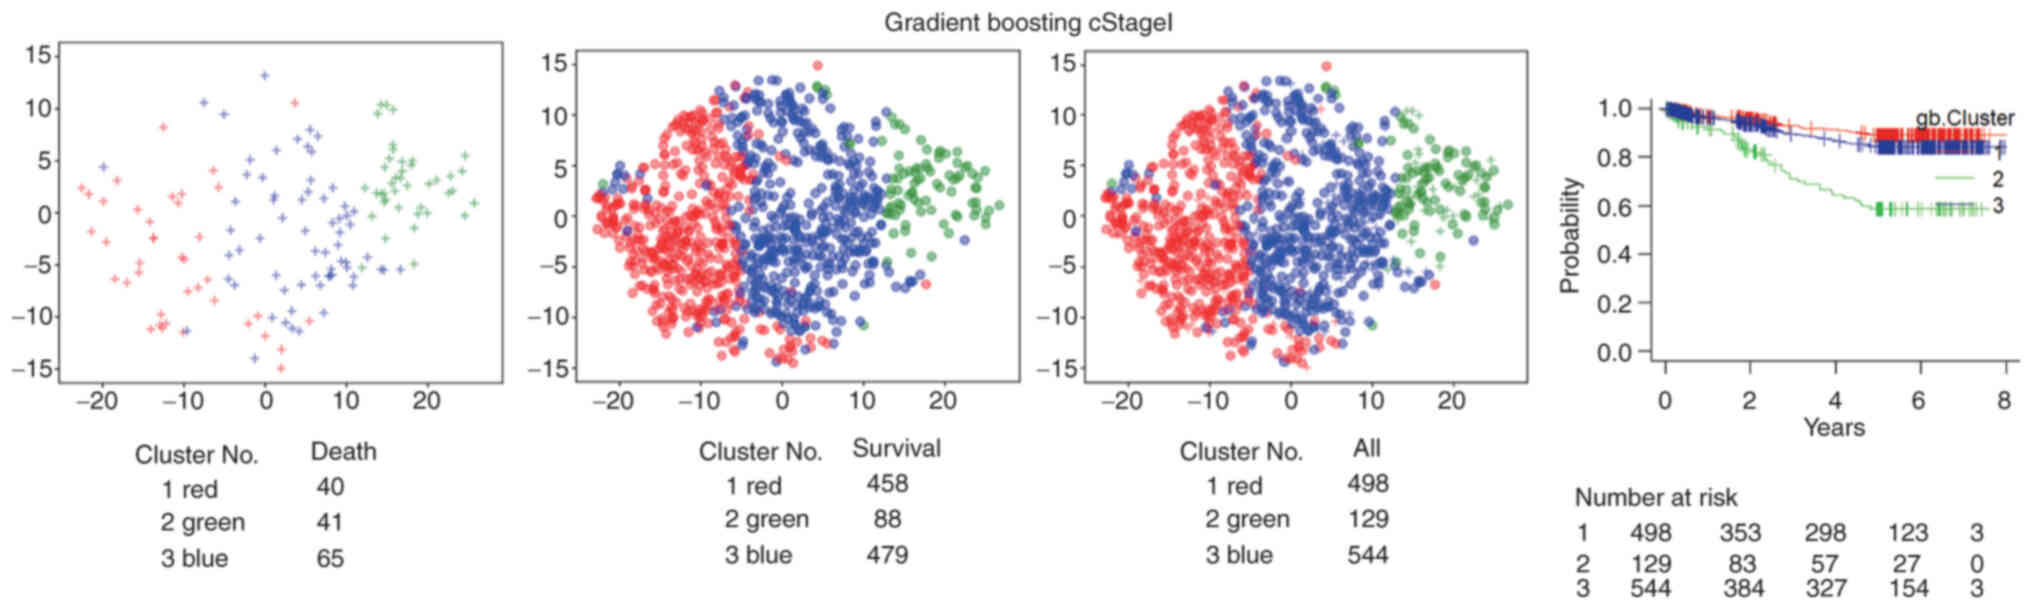
4B). For GB, considering stage I, Cluster number 2 (green)
included more mortalities than Cluster numbers 1 and 3 (Fig. 5).
Comparable results were obtained for recurrence-free
survival. Recurrence-free survival was similarly validated using 10
factors in each of the four AI methods; i) in LR: PCT, MCHC, PLT
count, neutrophil (NEU), RDW, TP, Hb, Ly, mean corpuscular volume
and ALB; ii) in RF: ALB, MCHC, CEA, Hb, Hct, CA19-9, PT, TP, RBC
and PCT; iii) in GB: ALB, Hb, MCHC, CEA, PT, TP, Hct, CA19-9,
aspartate aminotransferase and age; and iv) in DNN: MCHC, PT, TP,
RDW, aspartate aminotransferase level, CRNN, MPV, white blood cell
count, alkaline phosphatase level and BUN. Data were divided into
three clusters. The KM curve was plotted in three clusters to
verify the prognosis; the clustering results of RF and GB showed
that clustering was performed in three groups with significantly
different prognoses. In the RF and GB clustering, the KM curve for
each stage of progression (cStage I, cStage II+III and cStage IV)
revealed that the prognoses of patients with stage I differed from
those of patients with stage II+III and stage IV. In RF clustering,
the prognoses differed for patients with stage II+III (Fig. S2).
Discussion
The present study evaluated the prognosis of
patients with gastric cancer by analyzing routine clinical data
using machine learning of multiple AI types. The advantages of
machine learning is that it can simultaneously process large
datasets containing several factors and predict new data by
recognizing hidden patterns (13,14).
TNM staging is the most widely used system for staging gastric
cancer and determining the treatment and prognosis (15). However, the prognosis varies even
among patients exhibiting the same disease stage. Prediction of
high-risk patients after radical surgery is crucial for
postoperative follow-up, selecting adjuvant therapy and planning
new treatment strategies. Inflammatory biomarkers, such as
neutrophil count, PLT count and lymphocyte count (16,17);
preoperative ALB and transthyretin levels; and the tumor marker
CA19-9, have been employed to evaluate the prognosis of patients
with gastric cancer (18–20). In addition, the function of
prognostic indices, including the Controlling Nutritional Status
score (21,22), which is calculated from ALB, total
lymphocyte count and serum total cholesterol levels; the Glasgow
prognostic score, a combination of inflammation and nutritional
status indices; the neutrophil-to-lymphocyte ratio (NLR); and the
Prognostic Nutritional Index, have been reported (23–25).
However, the prognostic ability of specific
biomarkers, or their combination, remains poor, which can be
explained by the complexity of the human body, with numerous
nonlinear factors affecting survival. Furthermore, with the advent
of various molecular-targeted drugs and the prognostic association
between immune cells and gastric cancer (26), treatment options will continue to
diversify. In recent years, AI has been used to evaluate the
prognosis of gastric cancer, including survival and risk of
recurrence, by combining multiple factors (Table SI). There are four studies that
have employed the artificial neural network (ANN) in their
prediction model. Que et al (27) predicted the 3-year overall survival
using a preoperative ANN and the tool showed 75.2% accuracy, 86.5%
sensitivity and 43.8% specificity. Kangi et al (28), Oh et al (29) and Li et al (30) predicted the 5-year overall survival
and the AUC values were 0.935, 0.81 and 0.84, respectively. Afrash
et al (31) predicted the
5-year survival for gastric cancer using multiple AIs, with Hist GB
exhibiting the best predictive ability (accuracy, 88.37%;
sensitivity, 89.72%; specificity, 86.24%; and AUC, 0.88). Based on
the findings of these reports, prognosis can be evaluated to a
certain level. However, these studies selected tumor diameter and
TNM factors as critical factors and so their models may fail to
represent a new alternative stratification to the TNM
classification.
The novelty of the present study was that it
evaluated prognosis using only blood test data, excluding
clinicopathological features such as tumor depth and lymph node
metastasis, which are typically employed in the conventional TNM
classification. The findings revealed that AI techniques could
predict the 5-year overall survival and recurrence-free survival
with a certain degree of accuracy even when only clinical data from
blood sampling and age and not pathological factors, were analyzed.
In the present study, 10 significant features were selected for
prediction by AI. Based on the selected features, patients were
stratified into three groups by clustering them with each of the
four AIs. Regarding the 5-year overall survival, the four AIs,
i.e., LR, RF, GB and DNN, presented substantially distinct
prognoses. Based on multivariate analysis, clustering results were
an independent prognostic factor (Table III). In addition, the prognosis
differed in the three groups subjected to clustering, even when
evaluated by stage. For GB, in stage I, Cluster number 2 (green)
included more mortalities than Cluster numbers 1 and 3 (Fig. 5). For stage II + III, Cluster number
1 (red) included fewer mortalities. These findings suggested that
the clustering results of the current study were stratified in a
different manner when compared with the TNM classification staging.
Among patients with stage I disease in Cluster number 2 (green),
41/129 patients succumbed. This was an noteworthy result, well
below the traditional TNM stage I survival rate; the 5-year
survival rates for patients with gastric cancer treated with
surgery alone are 95.1% for stage IA and 88.9% for stage IB
(32).
| Table III.Multivariate analysis showed that
clustering results were independent prognostic factors. |
Table III.
Multivariate analysis showed that
clustering results were independent prognostic factors.
| Multivariate
analysis | Hazard ratio | Lower 95% CI | Upper 95% CI | P-value |
|---|
| Logistic
regression | 0.8767 | 0.7798 | 0.9856 |
2.76×10⁻³ |
| cStage
I–IV | 2.338 | 2.14 | 2.555 | <0.001 |
| Random forest | 0.9905 | 0.8732 | 1.124 |
8.82×10⁻¹ |
| cStage
I–IV | 2.383 | 2.182 | 2.602 | <0.001 |
| Gradient
boosting | 1.144 | 1.021 | 1.281 |
2.09×10⁻² |
| cStage
I–IV | 2.374 | 2.176 | 2.59 | <0.001 |
| Deep neural
network | 0.9999 | 0.8893 | 1.124 |
9.99×10⁻¹ |
| cStage
I–IV | 2.385 | 2.185 | 2.604 | <0.001 |
The prognosis of patients with cancer cannot be
evaluated in a unified manner owing to the complex interplay of
factors such as age, nutritional status and inflammatory response,
as well as the degree of tumor progression in the TNM
classification. The selection criteria for the four machine
learning methods included LR, RF, GB and DNN, which were all chosen
due to their capacity to quantify the importance of specific
minutiae. Regarding the importance ranking, all methods stem from
the learning of data that ‘increasing the importance of these
selected minutiae will increase the classification accuracy of the
data as a whole’. Although the selection process may be unclear, it
can be assumed that the AI has determined that the data possesses
this characteristic. The 10 features selected in the current study
included not only the tumor markers CEA and CA19-9 but also ALB,
TP, age and lymphocyte count, which reflect nutritional status. In
addition, these items have been previously reported as factors
associated with prognosis in gastric cancer (16–25).
The preoperative NLR is an independent prognostic factor in gastric
cancer (33). Lin et al
(16) have also reported that the
lymphocyte-to-monocyte ratio and Hb levels are independent
prognostic factors. Conversely, some features, such as Cl, which
have rarely been reported before the application of AI methods,
were extracted, with Cl found to affect prognosis (Fig. S3).
Notably, different feature values were also
extracted for each of the four AIs; these need to be validated
using multiple AIs rather than in a single AI and can be undertaken
in the future.
All selected features, including nutritional status,
reflect the general condition of patients. However, AI can
simultaneously analyze all input variables, including these
critical features and unselected items, to evaluate prognosis that
reflects the general condition of patients. In addition, given that
the combination of these items is judged comprehensively and
stratified by clustering, there is no need to arbitrarily set
cutoff values and evaluate risk, unlike conventional judgments
based on a single evaluation item. In the present study, the
analysis was conducted using items that excluded information
regarding existing TNM classification. The stratification results
showed that the prognoses were divided, indicating that AI-based
machine learning algorithms afford a powerful tool that can provide
important information for prognostic evaluation. It is assumed that
stratification was performed based on the general characteristics
of patients, such as age and nutrition, using a distinct approach
from the TNM classification, which is related to oncological data.
Additional analysis of the poor prognosis group may allow further
consideration of treatment strategies, such as the indication for
chemotherapy.
The present study has some limitations. It is
difficult to verify the process through which the AI prediction
results led to the observed conclusion. The AI methods used in the
current study could calculate and rank the features that were
mechanisms contributing to the predictions of the model. In the
present study, the top 10 features were used for clustering, which
is highly interpretable and could be white-boxed. However, some
issues could not be explained, such as criteria for which variables
alter predictions and by how much. In addition, the current study
did not distinguish the timing of chemotherapy (preoperatively
compared with postoperatively). Additional information should be
added in future analyses. Furthermore, the study was a
single-center study and needs to be validated with data from other
hospitals. Despite these limitations, the multilayered AI analysis
identified important prognostic factors reflecting the condition of
patients. Further analysis of the background factors of stratified
groups, with additional cases and clinical information, will
improve the usefulness of the tool for clinical practice.
In conclusion, AI machine learning using routine
clinical data can help evaluate the prognosis of gastric cancer and
the prognosis differs according to the clusters identified by the
type of AI. Analyzing the background of gastric cancer patients
with poor prognosis, despite early-stage disease, can be used to
determine the need for additional treatment. Further accumulation
of cases will facilitate a more accurate prognosis evaluation.
Ultimately, a comprehensive assessment of tumors,
including TNM, would be desirable.
The objective of the present study was to determine
whether a new index for measuring tumor malignancy could be
constructed using only AI with blood test data, excluding TNM. It
is considered that the results of the current study are no better
than TNM but could have been stratified differently as in stage I
clustered by GB.
Supplementary Material
Supporting Data
Supporting Data
Acknowledgements
Not applicable.
Funding
Funding: No funding was received.
Availability of data and materials
The datasets used and/or analyzed during the current
study are available from the corresponding author on reasonable
request.
Authors' contributions
NK and IH conceived the study. NK and IH confirm the
authenticity of all the raw data. YM, HY, YI and TU developed the
statistical analysis plan and conducted statistical analyses. IH,
YI and TU contributed to the interpretation of the results. NK
drafted the original manuscript. IH, YI and TU supervised the
conduct of this study. All authors reviewed the manuscript draft
and revised it critically on intellectual content. All authors read
and approved the final manuscript.
Ethics approval and consent to
participate
The present study was approved by the Chiba Cancer
Center Review Board (approval no. H29-006) and was conducted in
accordance with the ethical principles of the Declaration of
Helsinki. All patients provided written informed consent to
participate.
Patient consent for publication
Not applicable.
Competing interests
The authors declare that they have no competing
interests.
Glossary
Abbreviations
Abbreviations:
|
ALB
|
serum albumin
|
|
AUC
|
area under the curve
|
|
AI
|
artificial intelligence
|
|
ANN
|
artificial neural network
|
|
BUN
|
blood urea nitrogen
|
|
CA
|
carbohydrate antigen
|
|
CEA
|
carcinoembryonic antigen
|
|
DNN
|
deep neural network
|
|
GB
|
gradient boosting
|
|
KM
|
Kaplan-Meier
|
|
LR
|
logistic regression
|
|
MCHC
|
mean corpuscular hemoglobin
concentration
|
|
MPV
|
mean platelet volume
|
|
NLR
|
neutrophil-to-lymphocyte ratio
|
|
PDW
|
platelet distribution width
|
|
PCT
|
procalcitonin
|
|
PLT
|
platelet
|
|
PT
|
prothrombin time
|
|
RBC
|
red blood cell count
|
|
RDW
|
red cell distribution width
|
|
RF
|
random forest
|
|
TP
|
total protein
|
References
|
1
|
Sung H, Ferlay J, Siegel RL, Laversanne M,
Soerjomataram I, Jemal A and Bray F: Global cancer statistics 2020:
GLOBOCAN estimates of incidence and mortality worldwide for 36
cancers in 185 countries. CA Cancer J Clin. 71:209–249. 2021.
View Article : Google Scholar : PubMed/NCBI
|
|
2
|
Allemani C, Matsuda T, Di Carlo V,
Harewood R, Matz M, Nikšić M, Bonaventure A, Valkov M, Johnson CJ,
Estève J, et al: Global surveillance of trends in cancer survival
2000–14 (CONCORD-3): Analysis of individual records for 37 513 025
patients diagnosed with one of 18 cancers from 322 population-based
registries in 71 countries. Lancet. 391:1023–1075. 2018. View Article : Google Scholar : PubMed/NCBI
|
|
3
|
Sugawara K, Yamashita H, Urabe M, Uemura
Y, Okumura Y, Yagi K, Aikou S and Seto Y: Combining nutritional
status with TNM stage: A physiological update on gastric cancer
staging for improving prognostic accuracy in elderly patients. Int
J Clin Oncol. 27:1849–1858. 2022. View Article : Google Scholar : PubMed/NCBI
|
|
4
|
Song BI, Kim HW, Won KS, Ryu SW, Sohn SS
and Kang YN: Preoperative standardized uptake value of metastatic
lymph nodes measured by 18F-FDG PET/CT improves the prediction of
prognosis in gastric cancer. Medicine (Baltimore). 94:e10372015.
View Article : Google Scholar : PubMed/NCBI
|
|
5
|
Mishra P: Practical explainable AI using
python: Artificial intelligence model explanations using
python-based libraries, extensions, and frameworks. Apress Media;
New York, NY: 2021
|
|
6
|
Ho TK: Random decision forests. In:
Proceedings of 3rd international conference on document analysis
and recognition. Volume 1. Montreal, QC: pp. 278–282. 1995
|
|
7
|
Friedman JH: Greedy function
approximation: A gradient boosting machine. Ann Statist.
29:1189–232. 2001. View Article : Google Scholar
|
|
8
|
Mori Y, Yokota H, Hoshino I, Iwatate Y,
Wakamatsu K, Uno T and Suyari H: Deep learning-based gene selection
in comprehensive gene analysis in pancreatic cancer. Sci Rep.
11:165212021. View Article : Google Scholar : PubMed/NCBI
|
|
9
|
Van Rossum G and Drake FL: Python 3
reference manual. CreateSpace Scotts Valley, CA: 2009
|
|
10
|
Pedregosa F, Varoquaux G, Gramfort A,
Michel V, Thirion B, Grisel O, Blondel M, Prettenhofer P, Weiss R,
Dubourg V, et al: Scikit-learn: Machine learning in python. J Mach
Learn Res. 12:2825–2830. 2011.
|
|
11
|
Chen T and Guestrin C: XGBoost: A scalable
tree boosting system. Proceedings of the 22nd ACM SIGKDD
international conference on knowledge discovery and data mining.
ACM; New York, NY: pp. 785–794. 2016, View Article : Google Scholar : PubMed/NCBI
|
|
12
|
Chollet F: Others: Keras. GitHub.
2015.https://github.com/fchollet/kerasSeptember 1–2023
|
|
13
|
Ian G, Bengio Y and Courville A: Deep
learning. MIT Press; Cambridge, MA: 2016
|
|
14
|
Theodoridis S and Koutroumbas K: Pattern
recognition. 4th edition. Academic Press; Cambridge, MA: 2008
|
|
15
|
Piñeros M, Parkin DM, Ward K, Chokunonga
E, Ervik M, Farrugia H, Gospodarowicz M, O'Sullivan B,
Soerjomataram I, Swaminathan S, et al: Essential TNM: A registry
tool to reduce gaps in cancer staging information. Lancet Oncol.
20:e103–e111. 2019. View Article : Google Scholar : PubMed/NCBI
|
|
16
|
Lin JX, Lin JP, Xie JW, Wang JB, Lu J,
Chen QY, Cao LL, Lin M, Tu R, Zheng CH, et al: Complete blood
count-based inflammatory score (CBCS) is a novel prognostic marker
for gastric cancer patients after curative resection. BMC Cancer.
20:112020. View Article : Google Scholar : PubMed/NCBI
|
|
17
|
Kim EY, Lee JW, Yoo HM, Park CH and Song
KY: The platelet-to-lymphocyte ratio versus
neutrophil-to-lymphocyte ratio: Which is better as a prognostic
factor in gastric cancer? Ann Surg Oncol. 22:4363–4370. 2015.
View Article : Google Scholar : PubMed/NCBI
|
|
18
|
McMillan DC: The systemic
inflammation-based glasgow prognostic score: A decade of experience
in patients with cancer. Cancer Treat Rev. 39:534–540. 2013.
View Article : Google Scholar : PubMed/NCBI
|
|
19
|
Shimura T, Shibata M, Gonda K, Okayama H,
Saito M, Momma T, Ohki S and Kono K: Serum transthyretin level is
associated with prognosis of patients with gastric cancer. J Surg
Res. 227:145–150. 2018. View Article : Google Scholar : PubMed/NCBI
|
|
20
|
Xiao J, He X, Wang Z, Hu J, Sun F, Qi F,
Yang S and Xiao Z: Serum carbohydrate antigen 19-9 and prognosis of
patients with gastric cancer. Tumour Biol. 35:1331–1334. 2014.
View Article : Google Scholar : PubMed/NCBI
|
|
21
|
Kuroda D, Sawayama H, Kurashige J,
Iwatsuki M, Eto T, Tokunaga R, Kitano Y, Yamamura K, Ouchi M,
Nakamura K, et al: Controlling nutritional status (CONUT) score is
a prognostic marker for gastric cancer patients after curative
resection. Gastric Cancer. 21:204–212. 2018. View Article : Google Scholar : PubMed/NCBI
|
|
22
|
Takagi K, Domagala P, Polak WG, Buettner
S, Wijnhoven BPL and Ijzermans JNM: Prognostic significance of the
controlling nutritional status (CONUT) score in patients undergoing
gastrectomy for gastric cancer: A systematic review and
meta-analysis. BMC Surg. 19:1292019. View Article : Google Scholar : PubMed/NCBI
|
|
23
|
Namikawa T, Ishida N, Tsuda S, Fujisawa K,
Munekage E, Iwabu J, Munekage M, Uemura S, Tsujii S, Tamura T, et
al: Prognostic significance of serum alkaline phosphatase and
lactate dehydrogenase levels in patients with unresectable advanced
gastric cancer. Gastric Cancer. 22:684–691. 2019. View Article : Google Scholar : PubMed/NCBI
|
|
24
|
Cupp MA, Cariolou M, Tzoulaki I, Aune D,
Evangelou E and Berlanga-Taylor AJ: Neutrophil to lymphocyte ratio
and cancer prognosis: An umbrella review of systematic reviews and
meta-analyses of observational studies. BMC Med. 18:3602020.
View Article : Google Scholar : PubMed/NCBI
|
|
25
|
Ding P, Guo H, Sun C, Yang P, Kim NH, Tian
Y, Liu Y, Liu P, Li Y and Zhao Q: Combined systemic
immune-inflammatory index (SII) and prognostic nutritional index
(PNI) predicts chemotherapy response and prognosis in locally
advanced gastric cancer patients receiving neoadjuvant chemotherapy
with PD-1 antibody sintilimab and XELOX: A prospective study. BMC
Gastroenterol. 22:1212022. View Article : Google Scholar : PubMed/NCBI
|
|
26
|
Ren F, Zhao Q, Zhao M, Zhu S, Liu B,
Bukhari I, Zhang K, Wu W, Fu Y, Yu Y, et al: Immune infiltration
profiling in gastric cancer and their clinical implications. Cancer
Sci. 112:3569–3584. 2021. View Article : Google Scholar : PubMed/NCBI
|
|
27
|
Que SJ, Chen QY, Qing-Zhong Liu ZY, Wang
JB, Lin JX, Lu J, Cao LL, Lin M, Tu RH, et al: Application of
preoperative artificial neural network based on blood biomarkers
and clinicopathological parameters for predicting long-term
survival of patients with gastric cancer. World J Gastroenterol.
25:6451–6464. 2019. View Article : Google Scholar : PubMed/NCBI
|
|
28
|
Kangi AK and Bahrampour A: Predicting the
survival of gastric cancer patients using artificial and bayesian
neural networks. Asian Pac J Cancer Prev. 19:487–490.
2018.PubMed/NCBI
|
|
29
|
Oh SE, Seo SW, Choi MG, Sohn TS, Bae JM
and Kim S: Prediction of overall survival and novel classification
of patients with gastric cancer using the survival recurrent
network. Ann Surg Oncol. 25:1153–1159. 2018. View Article : Google Scholar : PubMed/NCBI
|
|
30
|
Li Z, Wu X, Gao X, Shan F, Ying X, Zhang Y
and Ji J: Development and validation of an artificial neural
network prognostic model after gastrectomy for gastric carcinoma:
An international multicenter cohort study. Cancer Med. 9:6205–6215.
2020. View Article : Google Scholar : PubMed/NCBI
|
|
31
|
Afrash MR, Shanbehzadeh M and
Kazemi-Arpanahi H: Design and development of an intelligent system
for predicting 5-year survival in gastric cancer. Clin Med Insights
Oncol. 16:117955492211168332022. View Article : Google Scholar : PubMed/NCBI
|
|
32
|
Ahn HS, Lee HJ, Hahn S, Kim WH, Lee KU,
Sano T, Edge SB and Yang H-K: Evaluation of the seventh American
joint committee on cancer/international union against cancer
classification of gastric adenocarcinoma in comparison with the
sixth classification. Cancer. 116:5592–5598. 2010. View Article : Google Scholar : PubMed/NCBI
|
|
33
|
Deng Q, He B, Liu X, Yue J, Ying H, Pan Y,
Sun H, Chen J, Wang F, Gao T, et al: Prognostic value of
pre-operative inflammatory response biomarkers in gastric cancer
patients and the construction of a predictive model. J Transl Med.
13:662015. View Article : Google Scholar : PubMed/NCBI
|