Introduction
Phyllodes tumors (PTs) are rare biphasic neoplasms
that account for <1% of all breast tumors (1,2). PTs
are histologically classified as benign, borderline or malignant
(1). The primary standard treatment
for PTs is adequate surgical resection with negative margins
(2). Local relapse occurs in 10–65%
of all PTs and distant metastasis develops in 5–40% (3,4).
Recurrent and metastatic PTs pose therapeutic challenges as
effective treatment options are yet to be elucidated (3–6).
Therefore, the development of novel treatment options or
therapeutic targets for PTs is needed.
Metabolic reprogramming is an emerging hallmark of
cancer that enables tumor growth and progression (7). Aerobic glycolysis is one of the
characteristics of cancer cell metabolic reprogramming (8). However, metabolic reprogramming of
cancer cells is complicated because it involves multiple metabolic
compartments connected by transfer of metabolites (9–12).
Rapidly proliferating cancer cells induce oxidative stress in
surrounding stromal cells, causing aerobic glycolysis and formation
of metabolites such as lactate and pyruvate, which are taken up by
anabolic cancer cells. This metabolic coupling is also present
within tumor cells, between tumor cells adjacent to blood vessels
and tumor cells distant from blood vessels.
Profiling markers associated with metabolic coupling
is an active area of research to identify drivers of tumor
progression and elucidate the prognostic and predictive biomarkers
as well as novel targets for cancer treatment (9–12).
Loss of caveolin-1 (Cav-1) in stromal cells and upregulation of
monocarboxylate transporters (MCTs), particularly MCT1 and MCT4, in
both stromal and cancer cells serve a key role in metabolic
coupling required for the release and uptake of metabolites
(9,10,12).
Several studies have evaluated the relationship between protein
expression of Cav-1, MCT1 and MCT4 in cancer and stromal cells and
outcome in patients with breast cancer (13–18).
Most studies report that these markers are associated with tumor
progression and clinical outcomes (13–18).
Nonetheless, information on the protein expression of Cav-1, MCT1
and MCT4 in PTs of the breast is limited (19,20).
The aim of the present study was to evaluate the
protein expression of Cav-1, MCT1 and MCT4 in PTs and to assess
associations between the protein expression data and the
clinicopathological factors of PTs. Representative areas from 101
PTs (60 benign, 26 borderline and 15 malignant) and nine breast
tissue samples with no pathological lesions were selected to
construct tissue microarrays (TMAs) that were immunohistochemically
stained for Cav-1, MCT1 and MCT4. Cav-1, MCT1 and MCT4 protein
expression was evaluated in both stromal and epithelial
components.
Materials and methods
Tumor samples
PT samples with a follow-up period of 10–20 years
were used to compare patient clinical results (recurrence and
progression). Formalin-fixed, paraffin-embedded (FFPE) PT specimens
collected from January 1999 to December 2012 were obtained. As the
incidence of phyllodes tumors is low (<1%) (1,2),
samples were obtained from the following four hospitals: Chonnam
National University Hospital (Gwangju, South Korea), Chonnam
National University Hwasun Hospital (Hwasun, South Korea), Cell In
All Private Clinics (Gwangju, South Korea) and Foryou Private
Clinics (Gwangju, South Korea). A total of nine breast tissue
samples collected from January 2007 to December 2009 with no
pathological lesions were obtained from Chonnam National University
Hwasun Hospital.
Archived hematoxylin and eosin-stained slides of PTs
were reviewed by two pathologists. PTs were classified as benign,
borderline or malignant according to the 2019 World Health
Organization criteria (1). A total
of 101 PTs (60 benign, 26 borderline and 15 malignant) were
selected. A total of 20, 47, 21 and 13 specimens were obtained from
Chonnam National University Hospital, Chonnam National University
Hwasun Hospital, Cell In All Private Clinics and Foryou Private
Clinics, respectively. Among the 47 specimens from Chonnam National
University Hwasun Hospital, 19 specimens were provided by the
Biobank of Chonnam National University Hwasun Hospital Biobank of
Korea.
TMA construction
Histologically representative sites of each PT and
normal breast tissue were selected for inclusion in TMA blocks. For
each FFPE block, two cores (diameter, 2 mm) were punched to form a
TMA block.
Immunohistochemistry and evaluation of
immunohistochemical staining
Immunohistochemical staining for Cav-1, MCT1 and
MCT4 was performed on TMA sections (4 µm) using an automated
BOND-MAX immunostainer (Leica Microsystems, Inc.) as previously
described (21). Mouse monoclonal
antibodies for Cav-1 (cat. no. 610407, 1:50; clone 2297/Caveolin 1;
BD Transduction Laboratories; BD Biosciences), MCT1 (cat. no.
MA5-18288; 1:200; clone P14612; Thermo Fisher Scientific, Inc.),
and MCT4 (cat. no. sc-376140; 1:50; clone D-1; Santa Cruz
Biotechnology, Inc.) were used. BOND Primary Antibody Diluent (cat.
no. AR9352; Leica Microsystems, Inc.) was used to dilute the
primary antibodies. Primary antibodies binding to tissue sections
were visualized using the BOND Polymer Refine Detection system
(cat. no. DS9800, Leica Microsystems, Inc.).
The immunostained TMA slides were digitized using a
scanning microscope Leica Aperio AT2 (Leica Microsystems, Inc.),
annotations were made using Aperio ImageScope 12.3 (Leica
Microsystems, Inc.). Immunoreactivity of Cav-1, MCT1 and MCT4 was
assessed in both stromal and epithelial components, with slight
modifications of previously reported methods (14). Immunoreactivity was scored based on
the intensity (0, no reaction; 1, weak staining; 2, moderate
staining; 3, strong staining) and proportion of positive cells (0,
0; 1, <5; 2, 5–50; 3, >50%). The intensity and extent scores
were added to obtain a final staining score. In addition to
previously reported methods (14),
the immunoexpression of Cav-1, MCT1, and MCT4 were classified into
two groups. Final staining scores ≤3 were considered low
expression, whilst those >3 were considered high expression.
Statistical analysis
The number of replicates is one and all categorized
variables are presented as the count (percentage). Differences in
Cav-1, MCT1 and MCT4 protein expression between groups were
analyzed using Pearson's χ2 or Fisher's exact test.
Linear-by-linear association test was used to analyze the trends of
Cav-1, MCT1 and MCT4 expression according to grades of PTs.
χ2 test with Bonferroni post hoc test was used for each
possible paired comparison. To measure a linear correlation, a
Pearson correlation coefficient test was performed. A total of 101
patients were classified as low and high expression based on the
expression of Cav-1, MCT1 and MCT4. Disease-free survival was
estimated using the Kaplan-Meier estimate and survival curve
comparisons were performed using log-rank tests. When the log-rank
test could not be applied to survival plots where late-stage
crossover between the groups was observed, the weighted Renyi test
was used instead. SPSS Statistics version 27 (IBM Corp.) was used
for statistical analyses. P<0.05 was considered to indicate a
statistically significant difference.
Results
Clinicopathological data
All patients were female. Age of patients with no
pathological breast lesions was 24–50 years (median, 40 years;
mean, 39 years). PT tissue samples were obtained from diagnostic
and therapeutic vacuum-assisted breast biopsy or surgical excision.
Wide excision was performed immediately for lesions diagnosed as
borderline or malignant. Postoperative follow-up was performed
without adjuvant therapy. This treatment was in accordance with the
medical insurance program controlled by the Ministry of Health and
Welfare of Korea. Age of patients with PTs was 16–77 years (median,
43 years; mean, 41 years). Tumor size of PTs was 1.9–21.0 cm in
diameter (median, 4.0 cm; mean, 4.9 cm). Mean age of patients and
tumor size were as follows: 39.6 years and 4.2 cm for benign; 43.7
years and 5.9 cm for borderline and 46.5 years and 6.1 cm for
malignant PTs. Tumor size significantly increased with increase in
grade of PTs (P<0.05). Mean follow-up period was 61 months, with
a range of 5–212 months. Local recurrence occurred in 15 patients,
including three (20.0%) malignant, four (15.4%) borderline and
eight (13.3%) benign PT cases. Although not statistically
significant, the local recurrence rate was notably higher in
patients with positive surgical margins than in those with negative
surgical margins (20.0 and 12.8%, respectively). Distant metastasis
was observed in one case of malignant PTs. Deaths related to PTs
were not recorded.
Protein expression of Cav-1, MCT1 and
MCT4 in normal breast tissue and PTs
Cav-1, MCT1 and MCT4 expression levels were assessed
in both epithelial and stromal components in nine normal breast
tissue samples. For epithelial component of the 101 PT cases, a
total of 99, 97 and 100 cases were assessed for Cav-1, MCT1 and
MCT4, respectively. For stromal elements, all cases of PTs were
assessed.
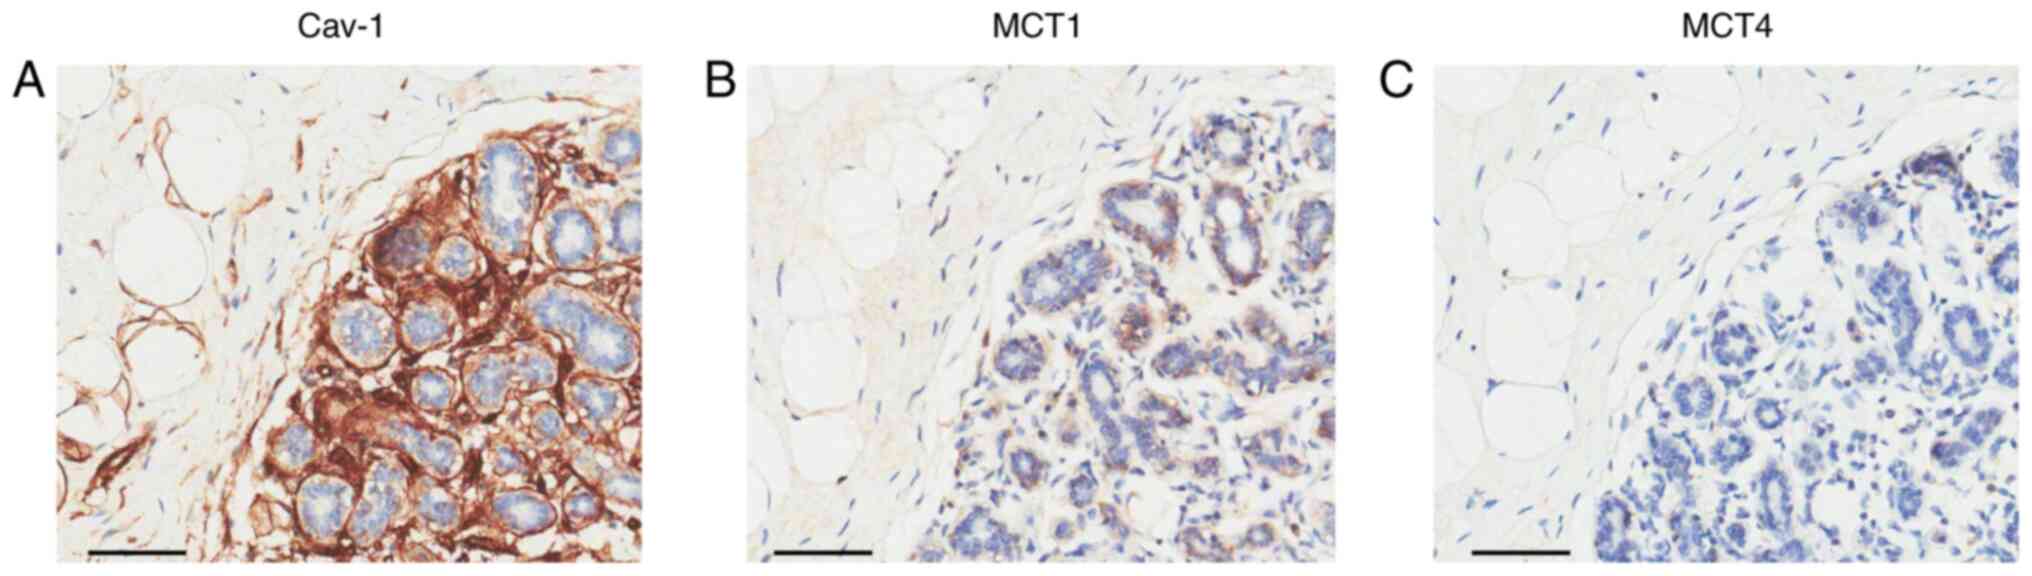
In normal breast tissue samples, Cav-1 expression
was not demonstrated in the epithelial component, whereas its
expression was observed in the stromal component including stromal
fibroblast, endothelial cells, vascular smooth muscles and
adipocytes (Fig. 1A). Cav-1
expression was only demonstrated in the cytoplasm. MCT1 expression
in normal breast tissue was variable in the epithelial components,
whereas its expression was absent in stromal components (Fig. 1B). MCT1 expression was demonstrated
in both the plasma membrane and cytoplasm. MCT4 expression was
absent in normal breast tissue (Fig.
1C). With a final staining score of >3 being defined as high
expression, high expression of Cav-1 (9/9; 100%) was demonstrated
in the stromal component of normal breast tissue and MCT1 (4/9;
55.6%) in the epithelial component (Table I).
 | Table I.Expression of Cav-1, MCT1 and MCT4 in
normal breast tissue and phyllodes tumors. |
Table I.
Expression of Cav-1, MCT1 and MCT4 in
normal breast tissue and phyllodes tumors.
|
| Cav-1 | MCT1 | MCT4 |
|---|
|
|
|
|
|
|---|
| Sample | Epithelial |
Stromala,b |
Epitheliala,b |
Stromala,b | Epithelial | Stromal |
|---|
| Normal | 0/9 (0.0) | 9/9 (100.0) | 4/9 (55.6) | 0/9 (0.0) | 0/9 (0.0) | 0/9 (0.0) |
| Phyllodes
tumor | 0/99 (0.0) | 24/101 (23.8) | 96/97 (99.0) | 73/101 (72.3) | 2/100 (2.0) | 3/101 (3.0) |
In PTs, the expression and localization of Cav-1 and
MCT1 was similar to that in normal breast tissue (Figs. 2 and 3). MCT4 expression in PTs was not notable
and the expression was localized to the cell membrane (Fig. 3). High expression of Cav-1, MCT1 and
MCT4 expression were observed in 0 (0/99), 99 (96/97) and 2%
(2/100) of the epithelial component and 23.8 (24/101), 72.3
(73/101) and 3.0% (3/101) of the stromal component, respectively
(Table I). Compared with normal
breast tissue, Cav-1 expression in PTs was significantly decreased
in the stromal component (P<0.001). MCT1 expression demonstrated
a significant increase in both epithelial and stromal components of
PTs compared with that in normal breast tissue (both P<0.001).
There was no significant difference in MCT4 expression between
normal breast tissue and PTs (Table
I).
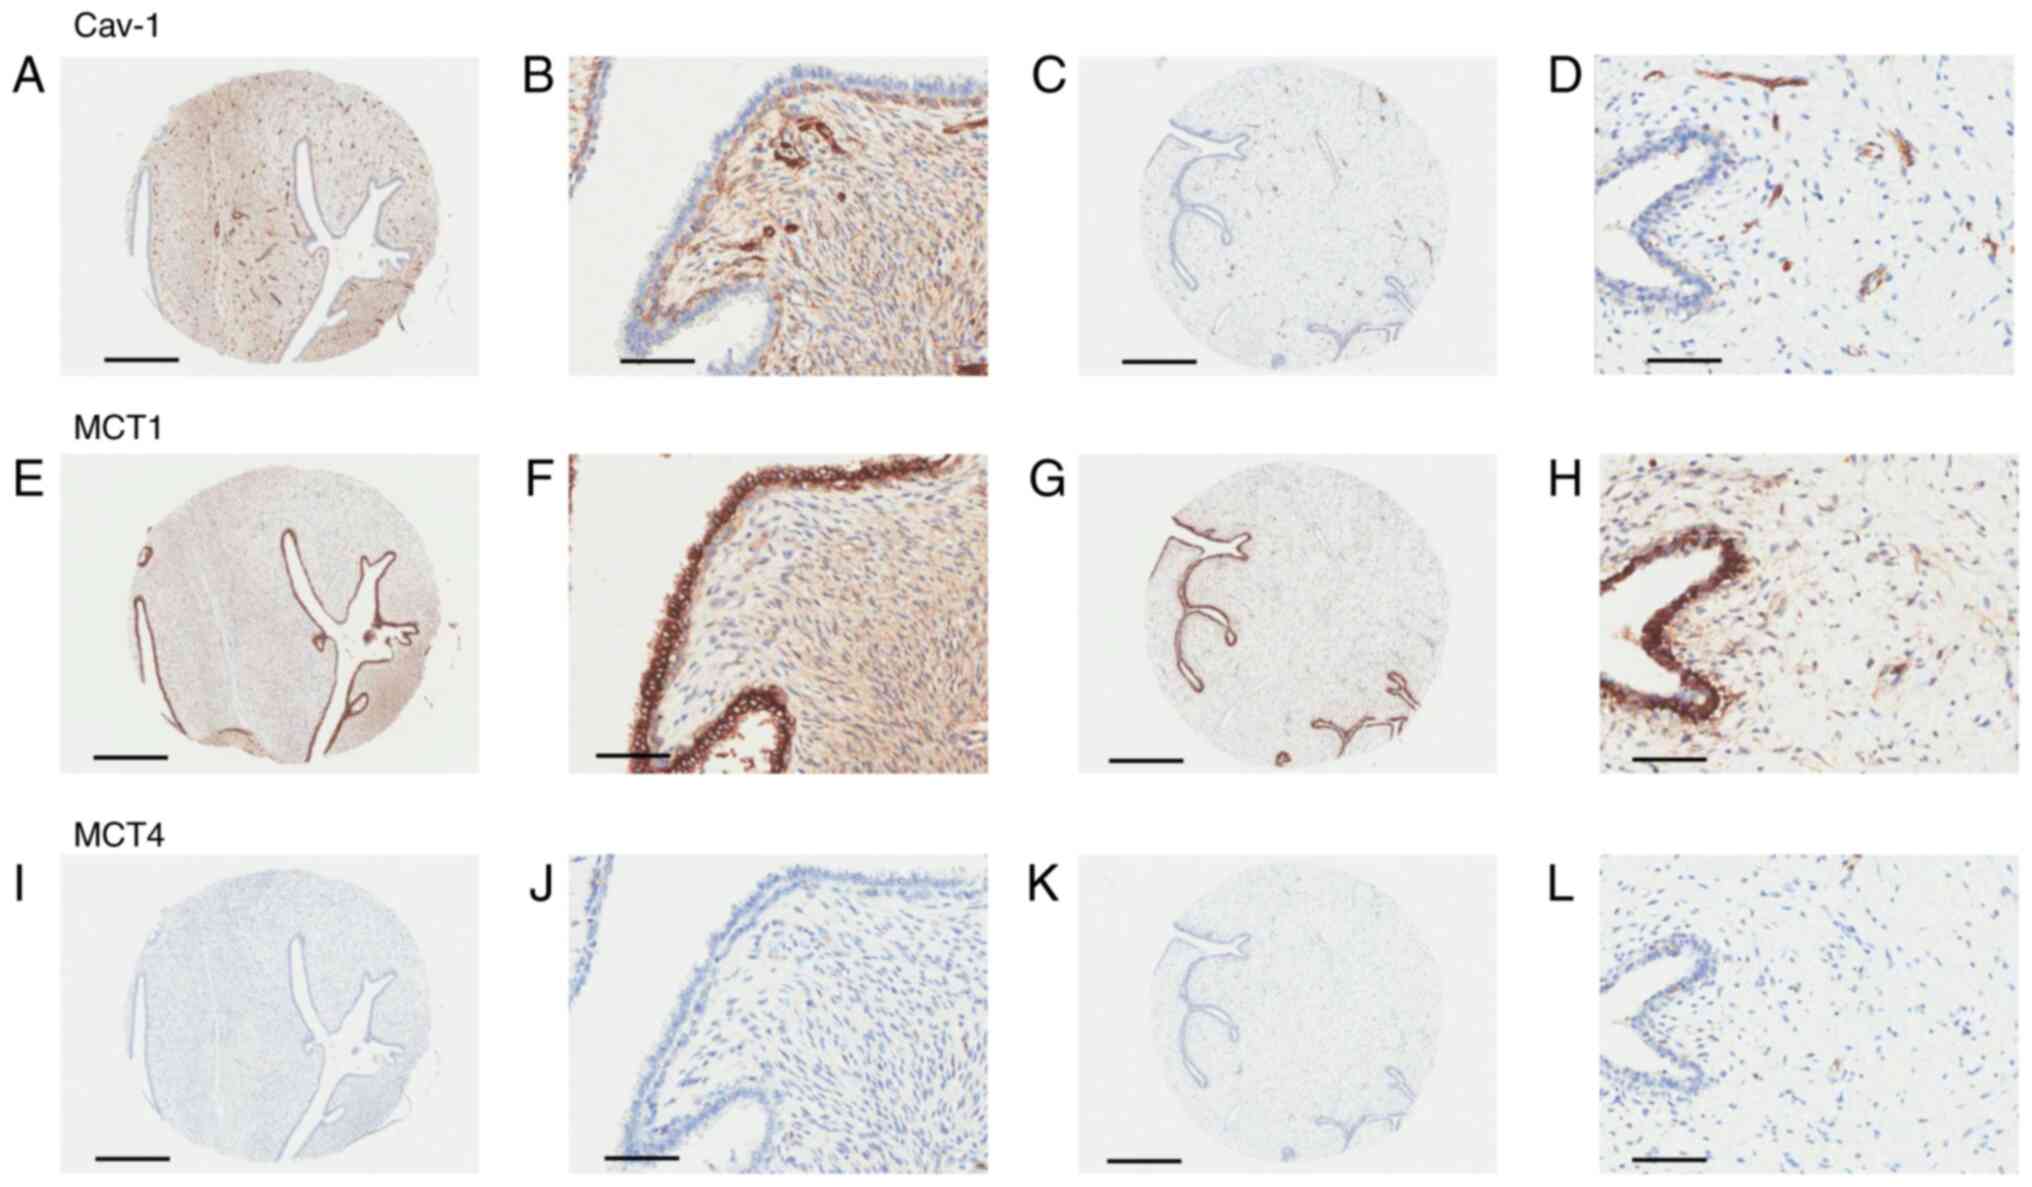 | Figure 2.Protein expression and localization of
(A-D) Cav-1, (E-H) MCT1 and (I-L) MCT4 were determined via
immunohistochemistry in the epithelial and stromal components of
two benign phyllodes tumors. (A and B) High expression of Cav-1 in
the stromal component. (C and D) Cav-1 expression was not
demonstrated in epithelial or stromal components, except in
endothelial cells. (E and F) Positive immunoreactivity of MCT1 in
both epithelial and stromal components. (H and K) High MCT1
expression in the epithelial component and low expression in the
stromal component. (I-L) Negative immunoreactivity of MCT4.
Magnification, ×4; Scale bar, 500 µm for A, C, E, G, I and K.
Magnification, ×200; Scale bar, 100 µm for B, D, F, H, J and L.
Cav-1, caveolin-1; MCT, monocarboxylate transporter. |
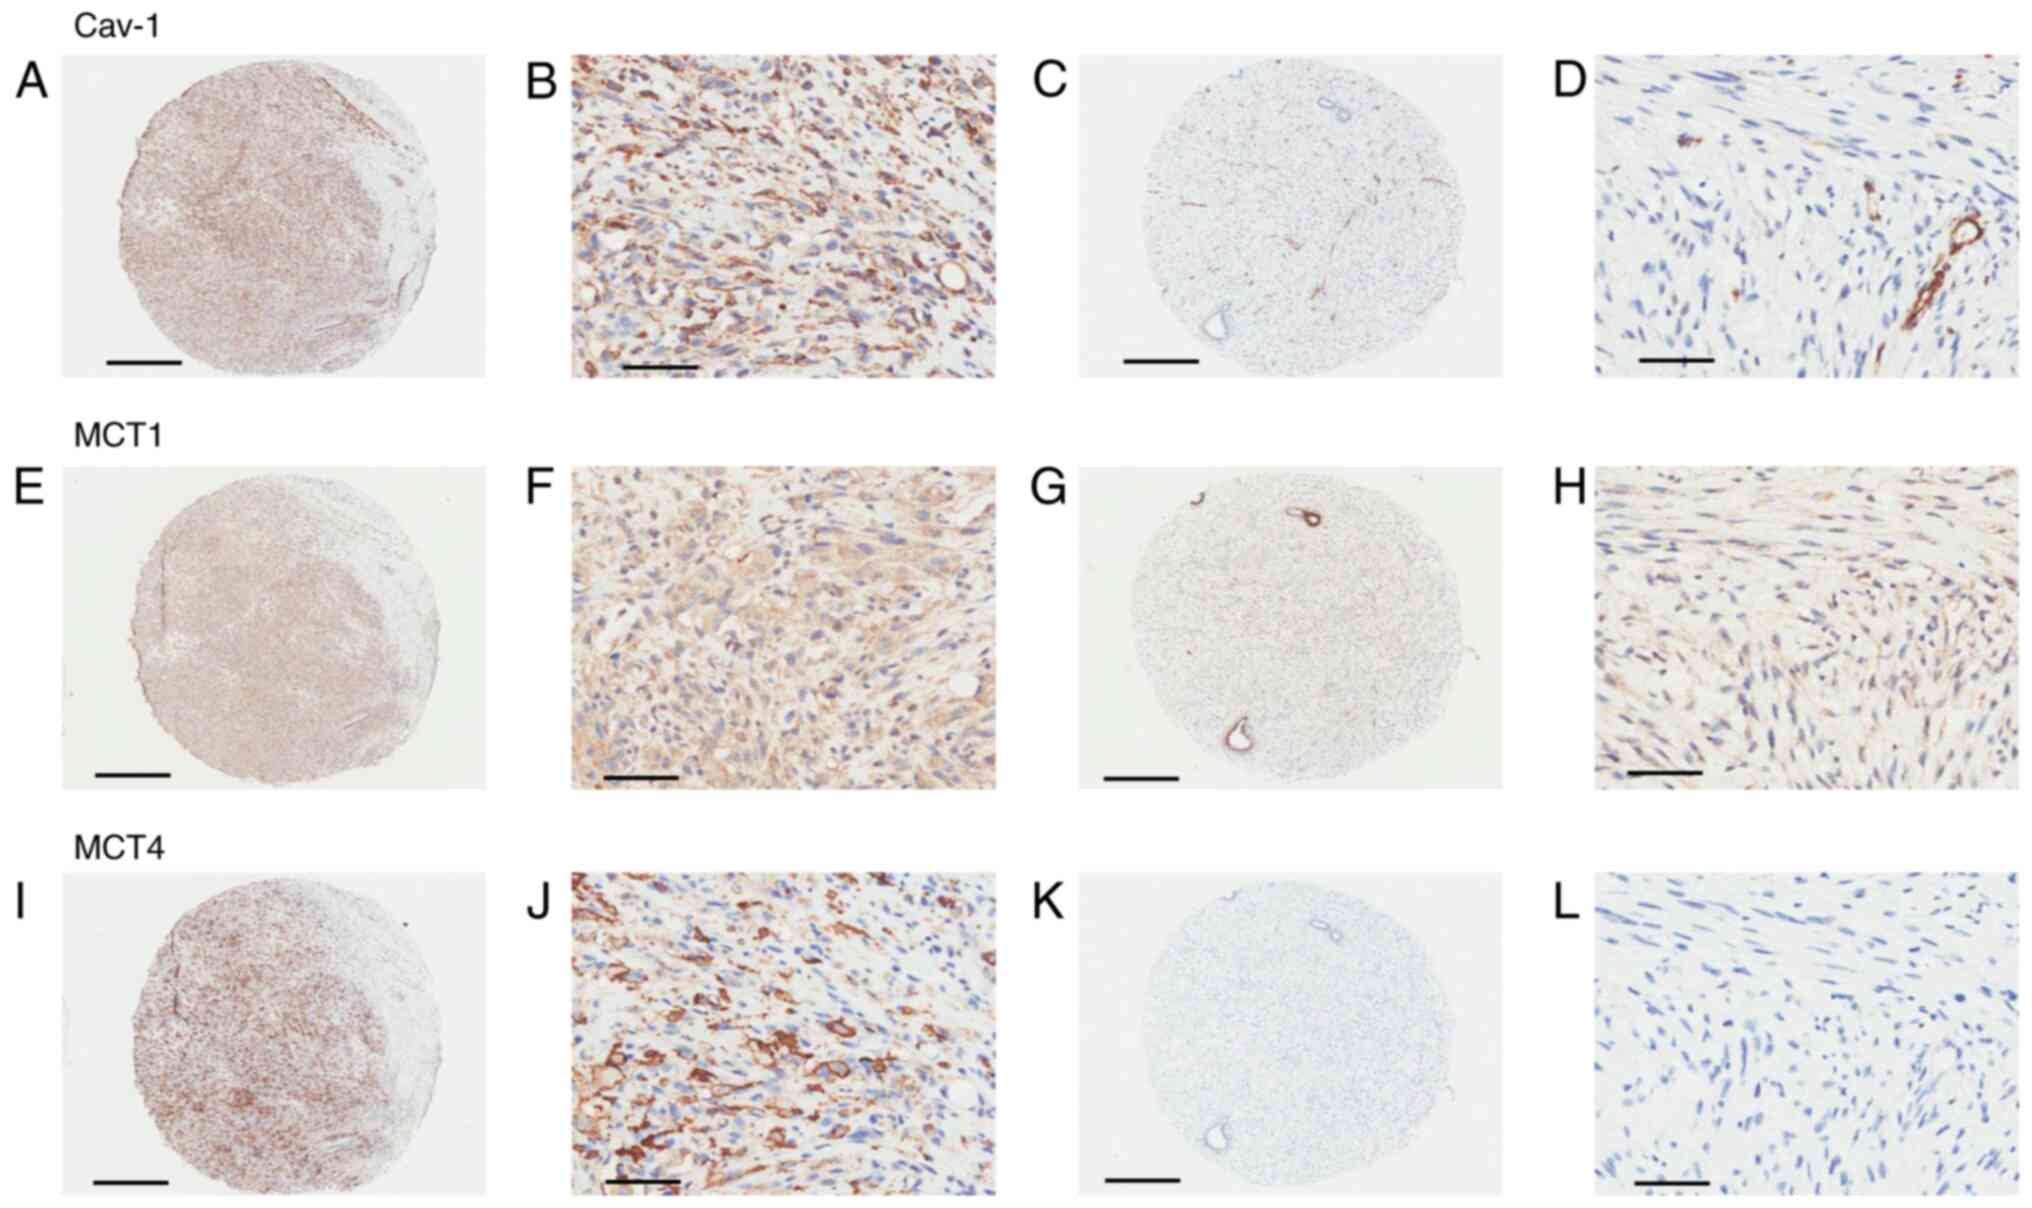 | Figure 3.Protein expression and localization of
Cav-1 (A-D) MCT1 (E-H) and MCT4 (I-L) was determined via
immunohistochemistry in the epithelial and stromal components of
two malignant phyllodes tumors. (A and B) Immunoreactivity of Cav-1
in stromal components. (C and D) Epithelial and stromal components,
excluding endothelial cells, demonstrated negative immunoreactivity
of Cav-1. Strong immunoreactivity was demonstrated in endothelial
cells. (E and F) Immunoreactivity of MCT1 in stromal components. (G
and H) MCT1 expression is high in epithelial components, but low in
stromal components. (I and J) Immunoreactivity of MCT4 in stromal
components and cell membranes. (K and L) Negative immunoreactivity
of MCT4. Magnification, ×4; Scale bar, 500 µm for A, C, E, G, I and
K. Magnification, ×200; Scale bar, 100 µm for B, D, F, H, J and L.
Cav-1, caveolin-1; MCT, monocarboxylate transporter. |
Associations between Cav-1 expression and MCT1 and
MCT4 expression in PTs were evaluated. High Cav-1 expression was
not observed in epithelial components, therefore no additional
statistical tests were performed for epithelial Cav-1 expression.
No associations were demonstrated between stromal Cav-1 and MCT 1
or MCT4 expression (Table II).
| Table II.Association between stromal Cav-1 and
MCT1 and MCT4 expression in phyllodes tumors. |
Table II.
Association between stromal Cav-1 and
MCT1 and MCT4 expression in phyllodes tumors.
|
| MCT1 | MCT4 |
|---|
|
|
|
|
|---|
|
| Epithelial | Stromal | Epithelial | Stromal |
|---|
|
|
|
|
|
|
|---|
| Expression | Low | High |
P-valueb | Low | High |
P-valuea | Low | High |
P-valueb | Low | High |
P-valueb |
|---|
| Stromal Cav-1 |
|
| 1.000 |
|
| 0.166 |
|
| 1.000 |
|
| 0.140 |
|
Low | 1/76 (1.3) | 75/76 (98.7) |
| 24/77 (31.2) | 53/77 (68.8) |
| 75/77 (97.4) | 2/77 (2.6) |
| 76/77 (98.7) | 1/77 (1.3) |
|
|
High | 0/21 (0.0) | 21/21 (100.0) |
| 4/24 (16.7) | 20/24 (83.3) |
| 23/23 (100.0) | 0/23 (0.0) |
| 22/24 (91.7) | 2/24 (8.3) |
|
The expression of Cav-1, MCT1 and MCT4 in benign,
borderline and malignant PTs is summarized in Table III. Stromal MCT1 expression varied
according to the tumor grade of PTs (P<0.001) and significantly
increased with increasing tumor grade (r=0.343, P<0.001) (data
not shown). Stromal MCT4 expression was also significantly
different according to the tumor grade of PTs (P<0.01).
Conversely, there was a notable decreasing trend of stromal Cav-1
expression with increasing tumor grade of PTs, however, the
difference was not statistically significant (r=−0.136; P=0.174).
As the linear-by-linear association test showed statistically
significant differences in the stromal expression of MCT1 and MCT4
depending on PT grade, an additional subgroup analysis was
performed (Table III). Stromal
MCT1 expression in borderline and malignant PTs was significantly
higher than that in benign PTs (both P<0.01). However, there was
no significant difference in the stromal MCT1 expression between
borderline and malignant PTs. Stromal MCT4 expression in malignant
PTs was significantly higher than that in benign and borderline PTs
(P<0.01 and P<0.05, respectively). However, no significant
difference in stromal MCT4 expression was observed between benign
and borderline PTs.
| Table III.Expression of Cav-1, MCT1 and MCT4 in
benign, borderline and malignant phyllodes tumors. |
Table III.
Expression of Cav-1, MCT1 and MCT4 in
benign, borderline and malignant phyllodes tumors.
|
| Cav-1
expression | MCT1
expression | MCT4
expression |
|---|
|
|
|
|
|
|---|
| Tumor | Epithelial | Stromal | Epithelial |
Stromala | Epithelial |
Stromalb |
|---|
| Benign | 0/60 (0.0) | 17/60 (28.3) | 58/59 (98.3) | 34/60
(56.7)c,d | 1/60 (1.7) | 0/60
(0.0)e |
| Borderline | 0/26 (0.0) | 5/26 (19.2) | 26/26 (100.0) | 24/26 (92.3) | 1/26 (3.8) | 0/26
(0.0)f |
| Malignant | 0/13 (0.0) | 2/15 (13.3) | 12/12 (100.0) | 15/15 (100.0) | 0/14 (0.0) | 3/15 (20.0) |
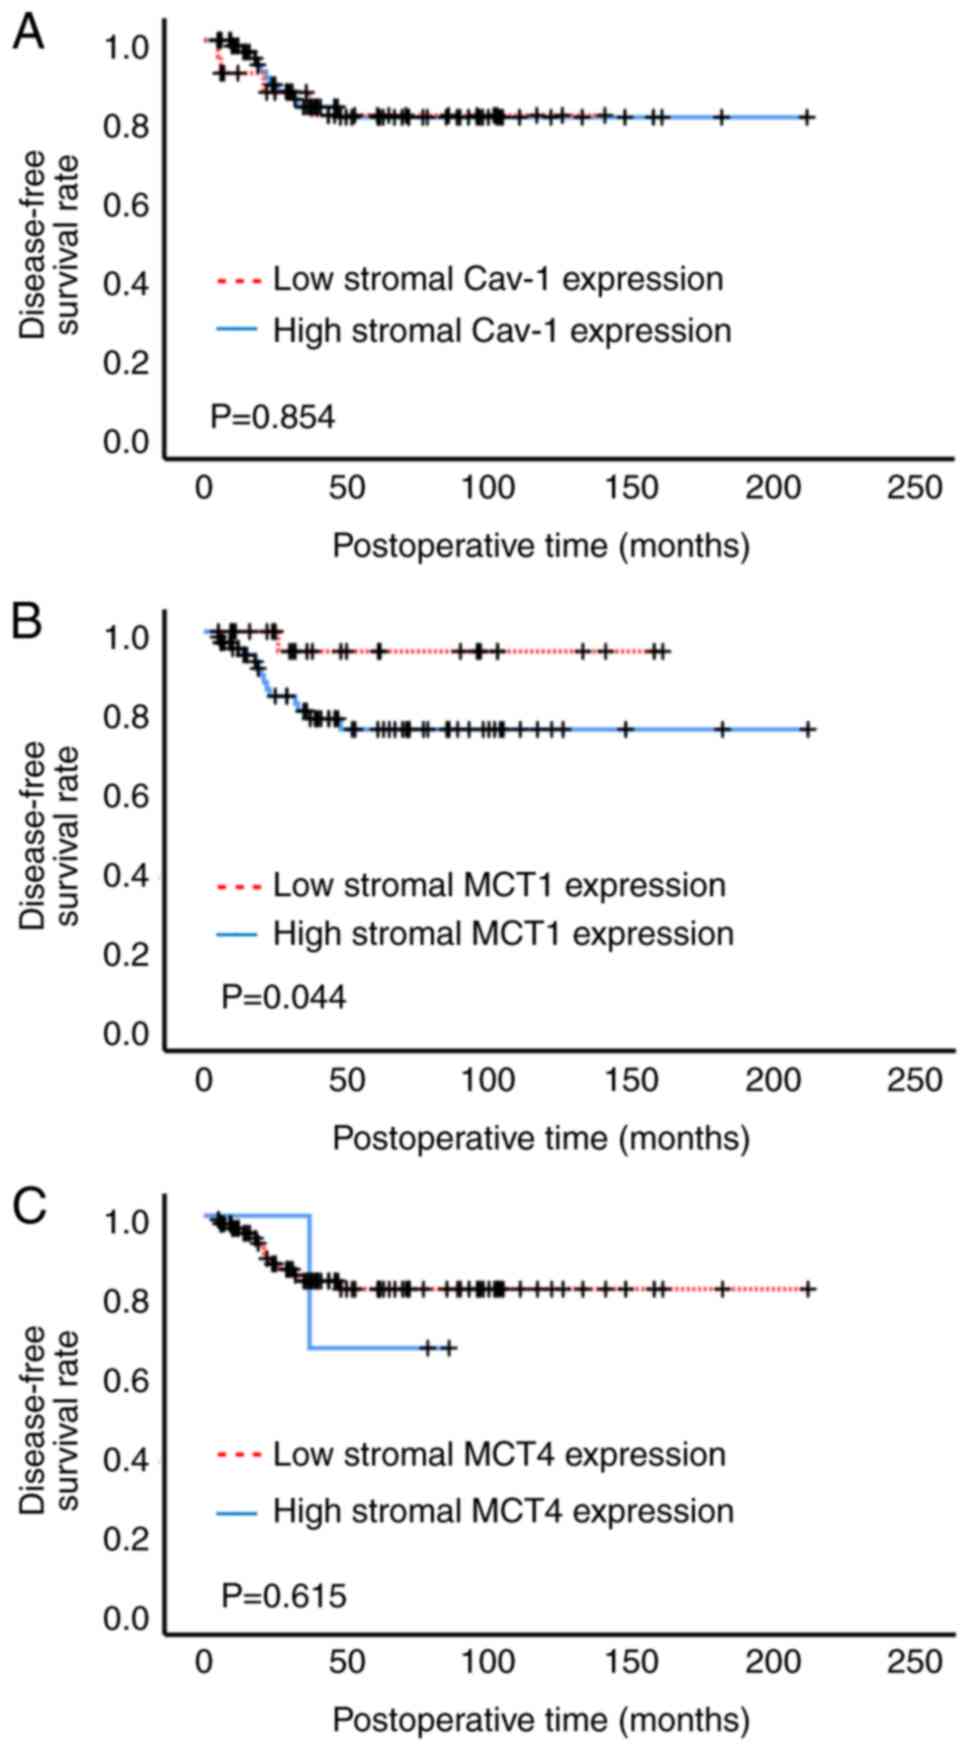
Fig. 4 illustrates
the Kaplan-Meier curves of disease-free survival on the basis of
stromal Cav-1, MCT1 and MCT4 expression. High stromal MCT1
expression demonstrated a significantly lower disease-free survival
rate than low stromal MCT1 expression (Fig. 4B). Stromal Cav-1 and MCT4 expression
had no notable prognostic value (Fig.
4A and C). As the disease-free survival curves for stromal MCT4
expression crossed-over (Fig. 4C),
an additional Renyi test was performed, but the results did not
affect the original interpretation results, with a non-significant
value of P=0.918.
Discussion
A substantial fraction of patients with PTs
experience recurrence or metastases (3,4).
Markers of metabolic coupling are associated with clinical outcomes
in breast cancer (13–18). To the best of our knowledge,
however, metabolic coupling remains to be evaluated in PTs.
Therefore, the present retrospective study was performed to assess
expression of Cav-1, MCT1 and MC4 in benign, borderline and
malignant PTs. It was demonstrated that stromal MCT1 and MCT4
expression was different according to the tumor grade of PT and the
stromal MCT1 expression increased with increasing tumor grade.
Moreover, high stromal MCT1 expression was associated with lower
disease-free survival rate.
The mechanisms of metabolic coupling in cancer are
an active area of research that may elucidate prognostic and
predictive cancer biomarkers as well as novel therapeutic targets
(9–12). MCTs are a family of proton-bound
membrane transporters responsible for migration of MCs, such as
lactate and pyruvate (22). MCT1
and MCT4 serve an important role in metabolic coupling between
cancer and cancer-associated stromal cells. Furthermore, caveolae
are small invaginations of plasma membrane that are involved in a
variety of signaling processes specifically related to stress
signaling (23). Caveolins are the
primary protein component of caveolae and consist of three members:
Cav-1, Cav-2 and Cav-3. Cav-1 is found on mesenchymal cells such as
fibroblasts, endothelial cells, adipocytes and muscle cells
(24). Decreased Cav-1 expression
in cancer-associated fibroblasts decreases mitochondrial metabolism
and induces aerobic glycolysis (25).
Changes in protein expression levels of Cav-1, MCT1
and MCT4 in different compartments within tumors serve a key role
in metabolic coupling and have been reported in numerous types of
cancer, including breast cancer (9,10,12).
Cav-1 is not expressed in the epithelium of normal breast tissue,
however its expression has been reported in the stromal component
(14). MCT1 and MCT4 expression in
normal breast tissue is low or absent (13,15,18).
Loss of stromal Cav-1 expression has been reported in breast cancer
tissue compared with normal breast tissue (14,15,17).
MCT1 expression is increased in cancer cells (13,16)
and MCT4 expression is increased in cancer cells (18) and cancer-associated stromal cells
(14,15).
Despite numerous studies on expression of Cav-1,
MCT1 and MCT4 in breast cancer (13–18),
their role in PTs is not well-explored. In the current study,
expression of Cav-1, MCT1 and MCT4 was determined using
immunohistochemistry in 101 PT and nine breast tissue samples with
no pathological lesions. Cav-1, MCT1 and MCT4 expression in normal
breast tissue was similar to that reported previously (13–15,18).
Compared with the expression levels in normal breast tissue,
decreased stromal Cav-1 and increased MCT1 expression in both
epithelial and stromal components were demonstrated in PTs.
However, there was no difference in MCT4 expression between normal
breast tissue and PTs. These results suggested that Cav-1 and MCT1
may serve an important role in the development of PTs and their
roles vary depending on the epithelial component and stromal
component.
Agelopoulos et al (19) reported Cav-1 expression in the
cytoplasm of 9/53 (17%) PTs and Cav-1 staining in both stromal and
epithelial components. This contradicts the findings of Martins
et al (15), which reported
stromal cells as a unique source of Cav-1 expression in breast
cancer. In the present study, Cav-1 expression was only
demonstrated in the stromal components of PTs.
The role of MCT1 expression in PTs has not yet been
elucidated. One of the characteristic features of malignant PTs is
overgrowth of sarcomatous stromal component (1). Pinheiro et al (26) evaluated MCT1 expression in 86 soft
tissue sarcomas and reported MCT1 expression in 52 cases (60.5%).
The present study demonstrated stromal MCT1 expression in 73
(72.3%) of 101 PTs.
Kwon et al (20) immunohistochemically evaluated MCT4
expression in 207 cases of PTs. MCT4 expression was observed in 16
(8.1%) of 198 epithelial components and 30 (14.5%) of 207 stromal
components. The present study demonstrated MCT4 expression in 2.0%
(2/100) of epithelial and 3.0% (3/101) of stromal components of
PTs. Although the reason for these discrepancies is unclear,
differences in criteria for evaluating positive staining may
explain them. Kwon et al (20) considered positive staining to be
>10% of cells stained. The present study used a final staining
score that combined intensity and extent, and final staining scores
>3 were considered to demonstrate high expression.
An evaluation of the association between Cav-1, MCT1
and MCT4 expression in breast cancer demonstrated that levels of
stromal Cav-1 and MCT4 are inversely related, and high levels of
stromal MCT4 directly correlate with a loss of stromal Cav-1
immunostaining (14,15). In the present study, stromal Cav-1
expression was not associated with MCT 1 or MCT4 expression in PTs.
Jensen et al (27) evaluated
Cav-1, MCT1 and MCT4 expression in oral squamous cell carcinoma and
did not report any association between decreased Cav-1 expression
and MCT4. Collectively these results suggest that expression of
MCT1 and MCT4 in PTs may be regulated by mechanisms other than
those demonstrated in breast cancer. Further studies are warranted
to elucidate the regulatory mechanisms involved in the expression
of MCT1 and MCT4 in PTs.
In the present study, stromal MCT1 expression varied
according to tumor grade of PTs and tended to increase with
increasing tumor grade. Stromal MCT1 expression was significantly
different between borderline or malignant and benign PTs, but not
between borderline and malignant PTs. Stromal MCT4 expression of
malignant PTs was significantly higher than that of borderline PTs.
Kwon et al (20) reported
that MCT4 expression in the stromal component increases with
increasing tumor grade of PTs. These data suggest that stromal MCT1
and MCT4 expression have different roles in the progression of PTs;
MCT1 is involved in the progression of benign to borderline PTs and
MCT4 in the progression to malignant PTs.
Downregulation of Cav-1 expression has been reported
during tumor progression (15,28).
Martins et al (15)
evaluated Cav-1 expression in breast cancer samples, including
matched in situ and invasive components, and reported a
significant decrease in stromal Cav-1 expression in progression of
ductal carcinoma in situ (13%) to invasive cancer (76%).
Wiechen et al (28)
evaluated Cav-1 expression in normal mesenchymal tissue, benign
mesenchymal tumors and sarcoma and reported that Cav-1 expression
is increased in normal mesenchymal tissue and benign mesenchymal
tumors but decreased in the majority of sarcomas of certain
histological types, such as fibrosarcoma, leiomyosarcoma,
angiosarcoma, malignant fibrous histiocytoma and synovial sarcoma.
In the present study, although differences were not significant,
stromal Cav-1 expression notably decreased with increasing PT
grade. Due to the small number of borderline and malignant cases in
the present study, these results need to be evaluated in additional
case series.
In the present study, high stromal MCT1 expression
was associated with lower disease-free survival rate compared with
low stromal MCT1 expression. This suggested that stromal MCT1
expression may be associated with a more aggressive phenotype in
PTs and may serve as marker of a poor prognosis in patients with
PTs. Kwon et al (20)
observed that stromal MCT4 expression is associated with shorter
disease-free and overall survival in patients with PTs. In breast
cancer, low Cav-1 expression in cancer-associated stroma, high MCT1
expression in cancer cells and high MCT4 expression in
cancer-associated stroma or cancer cells are associated with poor
prognostic clinicopathological factors and patient outcomes
(13,14,16–18).
In soft tissue sarcoma, expression of MCT1 and MCT4 is associated
with poor prognostic parameters such as high tumor grade, disease
progression and shortened overall survival (26). However, in the present study,
expression of Cav-1 and MCT4 was not associated with recurrence.
Given the potential prognostic value of Cav-1 or MCT4 in patients
with PT, further studies in large cohorts of patients with PT with
longer follow-up period are needed.
The present study highlighted that MCT1 was
upregulated in a subset of patients with PT recurrence, however
these patients do not have effective treatment options (3–6). The
development of therapies targeting MCT1 may be a promising strategy
for treating relapsed PTs. Further studies, including in
vitro approaches, are needed to assess this hypothesis.
There were a few limitations in the present study.
One limitation was the small number of borderline and malignant PT
cases. In addition, the number of recurrences was low during a
relatively limited follow-up time, which restricted the correlation
with outcome. Additionally, the assessment of protein expression
was somewhat limited using TMA technology, which uses only a small
part of tumor samples. However, the significance of this limitation
was reduced by including two 2 mm-sized representative cores per
case to account for tumor heterogeneity and possible sampling
issues.
In conclusion, the current study demonstrated that
MCT 1 and MCT4 were involved in progression of PTs and stromal MCT1
expression was associated with recurrence of PTs. Efforts are
needed to develop therapeutic approaches targeting metabolic
coupling, specifically MCT1, for treatment of PTs.
Acknowledgements
The abstract of the present article was presented at
the 2019 San Antonio Breast Cancer Symposium, December 10–14, 2019
in Texas, USA and published as abstract no. P1-09-06 in Cancer Res
80 (Suppl 4): 2020.
Funding
Funding: No funding was received.
Availability of data and materials
The datasets used and/or analyzed during the current
study are available from the corresponding author on reasonable
request.
Authors' contributions
NK and JL conceived the experiments. MP prepared the
samples. NK, MP and JL performed the experiments and analyzed the
data. SSK performed statistical analysis and edited the manuscript.
NK and JL wrote the manuscript. NI and JL confirm the authenticity
of all the raw data. All authors read and approved the final
manuscript.
Ethics approval and consent to
participate
This retrospective study utilized archived normal
and PTs tissues and did not impact patient care; approval was
granted by the Institutional Review Board of Chonnam National
University Hwasun Hospital (Jeollanam, South Korea) and the
requirement for patient consent was waived at the time of tissue
collection. (approval no. CNUHH-2018-068).
Patient consent for publication
Not applicable.
Competing interests
The authors declare that they have no competing
interests.
References
|
1
|
Allison KH, Brogi E, Ellis IO, Fox SB,
Morris EA, Sahin A, Salgado R, Sapino A, Sasano H, Schnitt SJ, et
al: World Health Organization classification of tumours editorial
board. Breast tumors. 5th edition. IARC Press; Lyon: 2019
|
|
2
|
Hoda SA, Brogi E, Koerner FC and Rosen PP:
Rosen's Breast Pathology. 4th edition. Lippincott Williams &
Wilkins; Philadelphia, PA: 2014
|
|
3
|
Spitaleri G, Toesca A, Botteri E,
Bottiglieri L, Rotmensz N, Boselli S, Sangalli C, Catania C,
Toffalorio F, Noberasco C, et al: Breast phyllodes tumor: A review
of literature and a single center retrospective series analysis.
Crit Rev Oncol Hematol. 88:427–436. 2013. View Article : Google Scholar : PubMed/NCBI
|
|
4
|
Zeng S, Zhang X, Yang D, Wang X and Ren G:
Effects of adjuvant radiotherapy on borderline and malignant
phyllodes tumors: A systematic review and meta-analysis. Mol Clin
Oncol. 3:663–671. 2015. View Article : Google Scholar : PubMed/NCBI
|
|
5
|
Fede ÂBS, Pereira Souza R, Doi M, De Brot
M, Aparecida Bueno de Toledo Osorio C, Rocha Melo Gondim G,
Casali-da-Rocha JC, Jbili R, Bitencourt AGV, Alves de Souza J, et
al: Malignant pyllodes tumor of the breast: A practice review. Clin
Pract. 11:205–215. 2021. View Article : Google Scholar : PubMed/NCBI
|
|
6
|
Yu J and Kansal K: Management of Stromal
Lesions. Surg Clin North Am. 102:1017–1030. 2022. View Article : Google Scholar : PubMed/NCBI
|
|
7
|
Hanahan D and Weinberg RA: Hallmarks of
cancer: The next generation. Cell. 44:646–674. 2011. View Article : Google Scholar : PubMed/NCBI
|
|
8
|
Warburg O: On the origin of cancer cells.
Science. 123:309–314. 1956. View Article : Google Scholar : PubMed/NCBI
|
|
9
|
Penkert J, Ripperger T, Schieck M,
Schlegelberger B, Steinemann D and Illig T: On metabolic
reprogramming and tumor biology: A comprehensive survey of
metabolism in breast cancer. Oncotarget. 7:67626–67649. 2016.
View Article : Google Scholar : PubMed/NCBI
|
|
10
|
Sun X, Wang M, Wang M, Yao L, Li X, Dong
H, Li M, Sun T, Liu X, Liu Y and Xu Y: Role of proton-coupled
monocarboxylate transporters in cancer: From metabolic crosstalk to
therapeutic potential. Front Cell Dev Biol. 8:6512020. View Article : Google Scholar : PubMed/NCBI
|
|
11
|
Stine ZE, Schug ZT, Salvino JM and Dang
CV: Targeting cancer metabolism in the era of precision oncology.
Nat Rev Drug Discov. 21:141–162. 2022. View Article : Google Scholar : PubMed/NCBI
|
|
12
|
Mostafavi S, Zalpoor H and Hassan ZM: The
promising therapeutic effects of metformin on metabolic
reprogramming of cancer-associated fibroblasts in solid tumors.
Cell Mol Biol Lett. 27:582022. View Article : Google Scholar : PubMed/NCBI
|
|
13
|
Pinheiro C, Albergaria A, Paredes J, Sousa
B, Dufloth R, Vieira D, Schmitt F and Baltazar F: Monocarboxylate
transporter 1 is up-regulated in basal-like breast carcinoma.
Histopathology. 56:860–867. 2010. View Article : Google Scholar : PubMed/NCBI
|
|
14
|
Witkiewicz AK, Whitaker-Menezes D,
Dasgupta A, Philp NJ, Lin Z, Gandara R, Sneddon S,
Martinez-Outschoorn UE, Sotgia F and Lisanti MP: Using the ‘reverse
Warburg effect’ to identify high-risk breast cancer patients:
Stromal MCT4 predicts poor clinical outcome in triple-negative
breast cancers. Cell Cycle. 11:1108–1117. 2012. View Article : Google Scholar : PubMed/NCBI
|
|
15
|
Martins D, Beça FF, Sousa B, Baltazar F,
Paredes J and Schmitt F: Loss of caveolin-1 and gain of MCT4
expression in the tumor stroma: Key events in the progression from
an in situ to an invasive breast carcinoma. Cell Cycle.
12:2684–2690. 2013. View
Article : Google Scholar : PubMed/NCBI
|
|
16
|
Johnson JM, Cotzia P, Fratamico R,
Mikkilineni L, Chen J, Colombo D, Mollaee M, Whitaker-Menezes D,
Domingo-Vidal M, Lin Z, et al: MCT1 in invasive ductal carcinoma:
Monocarboxylate metabolism and aggressive breast cancer. Front Cell
Dev Biol. 5:272017. View Article : Google Scholar : PubMed/NCBI
|
|
17
|
Yeong J, Thike AA, Ikeda M, Lim JCT, Lee
B, Nakamura S, Iqbal J and Tan PH: Caveolin-1 expression as a
prognostic marker in triple negative breast cancers of Asian women.
J Clin Pathol. 71:161–167. 2018. View Article : Google Scholar : PubMed/NCBI
|
|
18
|
Xiao S, Zhu H, Shi Y, Wu Z, Wu H and Xie
M: Prognostic and predictive value of monocarboxylate transporter 4
in patients with breast cancer. Oncol Lett. 20:2143–2152. 2020.
View Article : Google Scholar : PubMed/NCBI
|
|
19
|
Agelopoulos K, Kersting C, Korsching E,
Schmidt H, Kuijper A, August C, Wülfing P, Tio J, Boecker W, van
Diest PJ, et al: Egfr amplification specific gene expression in
phyllodes tumours of the breast. Cell Oncol. 29:443–451.
2007.PubMed/NCBI
|
|
20
|
Kwon JE, Jung WH and Koo JS: The
expression of metabolism-related proteins in phyllodes tumors.
Tumour Biol. 34:115–124. 2013. View Article : Google Scholar : PubMed/NCBI
|
|
21
|
Kim GE, Kim JH, Lee KH, Choi YD, Lee JS,
Lee JH, Nam JH, Choi C, Park MH and Yoon JH: Stromal matrix
metalloproteinase-14 expression correlates with the grade and
biological behavior of mammary phyllodes tumors. Appl
Immunohistochem Mol Morphol. 20:298–303. 2012. View Article : Google Scholar : PubMed/NCBI
|
|
22
|
Payen VL, Mina E, Van Hée VF, Porporato PE
and Sonveaux P: Monocarboxylate transporters in cancer. Mol Metab.
33:48–66. 2020. View Article : Google Scholar : PubMed/NCBI
|
|
23
|
Parton RG, McMahon KA and Wu Y: Caveolae:
Formation, dynamics, and function. Curr Opin Cell Biol. 65:8–16.
2020. View Article : Google Scholar : PubMed/NCBI
|
|
24
|
Williams TM and Lisanti MP: The Caveolin
genes: From cell biology to medicine. Ann Med. 36:584–595. 2004.
View Article : Google Scholar : PubMed/NCBI
|
|
25
|
Zhang Z, Gao Z, Rajthala S, Sapkota D,
Dongre H, Parajuli H, Suliman S, Das R, Li L, Bindoff LA, et al:
Metabolic reprogramming of normal oral fibroblasts correlated with
increased glycolytic metabolism of oral squamous cell carcinoma and
precedes their activation into carcinoma associated fibroblasts.
Cell Mol Life Sci. 77:1115–1133. 2020. View Article : Google Scholar : PubMed/NCBI
|
|
26
|
Pinheiro C, Penna V, Morais-Santos F,
Abrahão-Machado LF, Ribeiro G, Curcelli EC, Olivieri MV, Morini S,
Valença I, Ribeiro D, et al: Characterization of monocarboxylate
transporters (MCTs) expression in soft tissue sarcomas: Distinct
prognostic impact of MCT1 sub-cellular localization. J Transl Med.
12:1182014. View Article : Google Scholar : PubMed/NCBI
|
|
27
|
Jensen DH, Therkildsen MH and Dabelsteen
E: A reverse Warburg metabolism in oral squamous cell carcinoma is
not dependent upon myofibroblasts. J Oral Pathol Med. 44:714–721.
2015. View Article : Google Scholar : PubMed/NCBI
|
|
28
|
Wiechen K, Sers C, Agoulnik A, Arlt K,
Dietel M, Schlag PM and Schneider U: Down-regulation of caveolin-1,
a candidate tumor suppressor gene, in sarcomas. Am J Pathol.
158:833–839. 2001. View Article : Google Scholar : PubMed/NCBI
|