Introduction
Osteosarcoma (OS) is one of the most common primary
malignancies of the bone in adolescents and children (1). During the last few decades, the wide
use of resection surgery and addition of neoadjuvant chemotherapy
have led to an increase in the 5-year survival rate of patients
with OS to 60–70% (2,3). However, the survival rates of patients
who experience distant metastasis or local recurrence are still far
from satisfactory (3). Therefore,
new treatment modalities need to be investigated in order to
improve the survival of patients with OS.
MicroRNAs (miRNAs or miRs) are small non-coding RNA
molecules 19–25 nucleotides in length that impede gene expression
by binding to the 3′-untranslated region (UTR) of their target
mRNAs (4,5). Currently, the dysregulation of miRNAs
has been identified in several types of human solid tumors,
including prostate cancer, breast cancer, gastric cancer
hepatocellular carcinoma and glioblastoma (6–10). In
addition, increasing evidence shows that miRNAs play important
roles in various aspects of tumor biology, such as cell cycle,
progression, apoptosis and metabolism (11–13).
For instance, Xin et al (14) demonstrated that miR-519c was
significantly downregulated in pancreatic cancer, in which this
miRNA significantly suppressed cell migration and metabolism under
hypoxic conditions. Ren et al (15) showed that miR-210-3p was
significantly increased in bone metastatic prostate cancer, and
that miR-210-3p silencing inhibited epithelial-mesenchymal
transition, invasion and migration of prostate cancer cells.
Despite advances in the field, few miRNAs have been fully
investigated in OS.
Recently, increasing evidence reports that miRNA can
also be regulated by other regulators (16). Circular RNAs (circRNAs) have been
shown to competitively sponge miRNAs and diminish their suppression
of target mRNAs (17,18), act as competing endogenous RNA
(ceRNA) (17). Experimental results
have underscored the key role of circRNAs acting as ceRNAs in tumor
development and progression (19,20).
To the best of our knowledge, however, studies on the role and
mechanism of circRNA and ceRNA in OS remain in their infancy.
The present study aimed to investigate the role of
circKEAP1/miR-486-3p/MARCH1 axis in OS progression to provide
understanding of the role of miR-486-3p in the pathogenesis of OS
and provide novel insights into the molecular mechanisms and
therapeutic targets for OS.
Materials and methods
Bioinformatics analysis
First, the raw OS circRNA [GSE140256 (21)], miRNA [E-MTAB-1136 (22) and GSE28423 (23)] and mRNA data [TARGET-OS (24) and GSE12865 (25)], and the corresponding clinical
information were downloaded from the Gene Expression Omnibus
(https://www.ncbi.nlm.nih.gov/geo/),
The Cancer Genome Atlas (https://www.cancer.gov/ccg/research/genome-sequencing/tcga)
and ArrayExpress (https://www.ebi.ac.uk/biostudies/arrayexpress)
databases. The expression matrix was standardized according to the
Robust Multichip Average (RMA) and Linear Models for Microarray
data (LIMMA) algorithms (26).
Next, the differentially expressed genes (DEGs) between experiment
and control groups were identified using the DESeq2 package with
the thresholds of logFC>1.3 [log(fold change)] and P<0.05
(27). The candidate molecules were
identified by overlapping DEGs with predicted targets and
visualized using the VennDiagram 1.7.3 package
(cran.r-project.org/).
Cell culture and transfection
MNNG/HOS, U2OS and hFOB1.19 cells were obtained from
the Cell Bank of the Type Culture Collection of Chinese Academy of
Sciences (Beijing, China). The OS cell lines were cultured in
Eagle's minimal essential medium (Gibco; Thermo Fisher Scientific,
Inc.) with 10% FBS (Gibco; Thermo Fisher Scientific, Inc.). The
hFOB 1.19 was maintained in DMEM/F-12 (Gibco; Thermo Fisher
Scientific, Inc.) supplemented with 10% FBS and 0.3 mg/ml G418. The
cell culture environment was maintained at 37°C with 5%
CO2.
The OS cells were cultured in six-well plates at a
concentration of 3×10⁴ cells per well.
Lipofectamine® 3000 (Invitrogen; Thermo Fisher
Scientific, Inc.) was used for the plasmids (5 ug/plate) and miRNA
mimic (50 nM) or inhibitor (100 nM) transfection. Briefly, plasmid
cloning DNA [wild-type (wt)], miR-486-3p inhibitor or mimic as well
as the respective controls (Mut-Type/inhibitor-NC/mimic-NC) were
first mixed with Opti-MEM (Invitrogen; Thermo Fisher Scientific,
Inc.), incubated for 5 min, co-incubated with
Lipofectamine® 3000 for 20 min and transfected into
cells for 72 h at 37°C. In the construction of overexpression
vector, the CircKEAP1sequence was cloned into the pLC5-circ vector
(Guangzhou Geneseed Biotech Co., Ltd. Cat: GS0108) and the
full-length (wt) MARCH1 was cloned into pcDNA3.1 (Thermo Fisher
Scientific, Inc.; cat: V79020), the corresponding empty carrier was
used as a control. As for the knockdown vectors, lentivirus short
hairpin RNA (shRNA, 20uM/L) MARCH1 sequences (shRNA-MARCH1#1) which
were ligated into the plasmid of pGC-silencer-U6/Neo and scrambled
control shRNA (shRNA-NC) were established and synthesized by Jimon
Biotechnology (Shanghai) Co., Ltd. Cells were then harvested for a
later experiment.
Reverse transcription-quantitative PCR
(RT-qPCR)
TRIzol® (Invitrogen; Thermo Fisher
Scientific, Inc.) was used to isolate total RNA. Reverse
transcription was performed using the PrimeScript™ RT Reagent kit
(Takara Bio, Inc.), and the First Strand cDNA Synthesis kit for
miRNA (Sangon Biotech Co., Ltd.) was used according to the
manufacturer's instructions. SYBR® Premix Ex Taq (Takara
Bio, Inc.) was used for RT-qPCR on an Applied Biosystems
StepOne-Plus Real-time PCR System, according to the manufacturer's
instructions. Thermocycling conditions of PCR cycling were as
following: Activation of TaqMan at 95°C for 10 min, and then 40
cycles of denaturation at 95°C for 10 sec, and annealing/extension
at 60°C for 60 sec. β-Actin served as a control for cellular RNA
and mRNA. The level of miRNA was normalized against the endogenous
reference U6. Quantification was performed using the
2−ΔΔCq method (28).
Primer sequences are listed in Table
SI.
Colony formation assay
Transfected OS cells were seeded into six-well
plates at a density of 5×10² cells/well. After 2 weeks
of incubation at 37°C, these plates were fixed by 10% formaldehyde
at room temperature and stained with 0.5% crystal violet solution
at room temperature. The colonies were defined as >50
cells/colony and images were captured using an inverted microscope
(Olympus IX71; Olympus Corporation). The numbers of colonies was
then counted and measured using ImageJ software (version 1.8.0.112;
National Institutes of Health).
5-Ethynyl-2′-deoxyuridine (EdU)
analysis
Cell proliferation was detected using the EdU assay
kit (Guangzhou RiboBio Co., Ltd.). Briefly, cells were seeded into
96-well plates at a density of 1×10⁴ cells/well. The OS
cells were then treated with culture medium containing 50 µM EdU
reagent at 37°C for 2 h, and fixed with 4% formaldehyde for 30 min
at room temperature. The nuclei were stained with Hoechst 33342 (10
ug/ml; MedChemExpress; Cat: HY-15559). Finally, the results were
photographed using a fluorescence microscope (Nikon Corporation),
and the number of EdU-positive cells were quantified and
analyzed.
Wound healing assay
The transfected cells were implanted into a six-well
plate. When cells had reached 80% confluence, they were scratched
with a 200-µl sterile plastic tip, followed by culture in 2% serum
culture medium at 37°C for 48 h. Images of cells were captured.
Transwell cell migration and invasion
assays
Briefly, for cell migration assay, 2×10⁴
OS cells were suspended in 200 µl medium free of serum and added
into the top chamber. A total of 500 µl culture medium containing
30% FBS was added into the lower chamber. A total of 24 h after
incubation at 37°C, the cells on the upper surface of the membrane
were removed gently and fixed in 4% paraformaldehyde for 10 min at
room temperature. Next, 0.5% crystal violet was used to stain these
cells for 20 min at room temperature. Images of the migratory or
invasive cells were captured and counted under a light microscope.
However, for cell invasion assay, the filter membranes were
precoated with Matrigel (Corning, Inc.) at 37°C for 30 min, and
other steps were performed as described in the migration assay.
Nucleic acid electrophoresis and
Sanger sequencing
PCR products were separated by electrophoresis on a
2% agarose gel and gels were cut and sent to Shanghai Sangon
Bioengineering Co., Ltd. for sequencing following observation in a
UV imaging system.
Western blotting
Cell lysate was extracted using RIPA buffer (cat.
no. P0013B; Beyotime Institute of Biotechnology) and then
quantified with BCA Protein Assay (cat. no. P0012; Beyotime
Institute of Biotechnology). Proteins (30 µg/lane) were separated
via 10% SDS-PAGE, transferred to PVDF membranes (Millipore Sigma),
blocked with 5% non-fat milk for 2 h at room temperature and probed
with anti-MARCH1 (cat. no. PA5-69223; 1:1,000; Invitrogen; Thermo
Fisher Scientific, Inc.) and anti-β-actin (cat. no. 66009-1-Ig;
1:5,000; ProteinTech Group, Inc.) primary antibodies overnight at
4°C. This was followed by incubation with rabbit anti-mouse
horseradish peroxidase-conjugated secondary antibodies (cat. no.
#58802; CST; 1/1,000) for 60 min at room temperature. Enhanced
chemiluminescence (Pierce; Thermo Fisher Scientific, Inc.) was
performed to visualize the band signals, which were collected using
the ChemiDoc XRS molecular imager system (Bio-Rad Laboratories,
Inc.).
Flow cytometry
Harvested cells were fixed in 75% ethanol for 8 h at
4°C. The cells were then washed twice with cold phosphate-buffered
saline and resuspended in propidium iodide (50 µg/ml)/ribonuclease
A (RNaseA; 50 µg/ml)-mixed staining solution for 30 min. Finally, a
Beckman Coulter FACSCalibur (BD Biosciences) flow cytometer with
the FlowJo 10.6.2 software system (Tree Star, Inc.) was employed to
detect and analyze apoptotic cells.
Dual-luciferase reporter gene
assay
miR-486-3p binding sites on MARCH1 were predicted
using miRWalk3.0. For miRNA target gene luciferase reporter assays,
the promoter region of MARCH1 was synthesized and subcloned into
the pGL3 vector (GeneCreate Biotech). A total of 1×10⁵
OS cells were planted in a 24-well plate and cultured for 24 h at
37°C. The pGL3 reporter vector bearing wt or mutant (mut) MARCH1
was then transfected into OS cells using Lipofectamine®
3000 (Invitrogen; Thermo Fisher Scientific, Inc.). CircRNAs
containing wild or mutant full length of CircKEAP1 binding to
miR-486-3p were synthesized and cloned into psiCHECK2 vector
(Promega Corporation). Subsequently, cells were transfected with
miR-486-3p mimic, inhibitor or control. After 48 h of transfection
at 37 °C, relative luciferase activity was analyzed using Dual
Luciferase Reporter Assay System (Promega Corporation).
Renilla luciferase activity was used for normalization.
RNA immunoprecipitation (RIP)
assay
Anti-Flag (Flag-MARCH1) antibody (10 µl, cat. no.
14793, Cell Signaling Technology, Inc.) and anti-IgG antibodies (10
µl, cat. no. 8726S, Cell Signaling Technology, Inc.) were incubated
with protein A+G beads at 4°C for 1 h following the instructions
provided with the RIP kit (cat. no. P0101; Geneseed Biotech Co.,
Ltd.). Briefly, 1 ml of Buffer A working solution containing 1%
volume protease inhibitor and 1% volume RNase inhibitor was
prepared before use. A total of 1×10⁷ OS cells were used
for each IP reaction and added to 1 ml of the configured RIP lysis
buffer. The lysate (5 mg/ml, 400 µl) was then centrifuged at 14,000
× g for 10 min at 4°C. The resulting supernatant was incubated with
the antibody-attached magnetic beads for 1 h at 4°C. The product
was obtained by centrifugation at 12,000 × g for 1 min at 4°C. The
captured RNAs and target protein were finally eluted and purified
for RT-qPCR.
Exosome experiments
Culture medium was pre-cleared by filtration through
a 0.22-µm filter (MilliporeSigma), and exosomes were collected
using a high-speed centrifuge (100,000 × g) at 4°C for >1 h. The
following exosome isolation was performed according to the
manufacturer's instructions (Invitrogen; Thermo Fisher Scientific,
Inc.). NP100 nanopores (NanoSight NS500; Zetaview) of the
measurement system were calibrated using particles of known size
(CPC100 standard solution) and washed twice with PBS. The exosome
sample was diluted 1,000 times with PBS and subsequently added to
the nanopores for the recording and tracking of each visible
particle (NTA, Nanoparticle tracking analysis). and the morphology
was captured by electron microscopy. For exosomal RNA extraction,
an equal number of exosomes pre-treated with RNase were used for
RNA extraction. For the in vitro exosome treatment, 1 µg
exosomes (collected from ~5×10⁶ cells) were added to
2×10⁵ recipient cells. PKH26 (cat: HY-D1451) and GW4869
(Cat: HY-19363) were purchased from MedChemExpress. PKH26 (10 µM)
was incubated with exosomes for 5 min at 37°C to labels exosomes.
GW4869 (20 uM) was incubated with cells for 30 min at 37°C to
inhibit the release of exosomes.
Statistical analysis
Data are presented as the mean ± SD and were
analyzed using R language (4.0.2, cran.r-project.org/) and GraphPad
Prism 8.0 software (GraphPad Software, Inc.; Dotmatics). Unless
otherwise specified, all experiments were performed at least three
times. An unpaired t-test was used to estimate the statistical
differences between two groups. One-way analysis of variance was
used to determine the differences between three or more groups and
followed by Tukey's post hoc test. The data met the assumptions of
the tests. An estimate of variance was performed within each group
of data. The variation is similar between the groups. P<0.05 was
considered to indicate a statistically significant difference.
Results
miR-486-3p is aberrantly downregulated
in OS tissues and cells
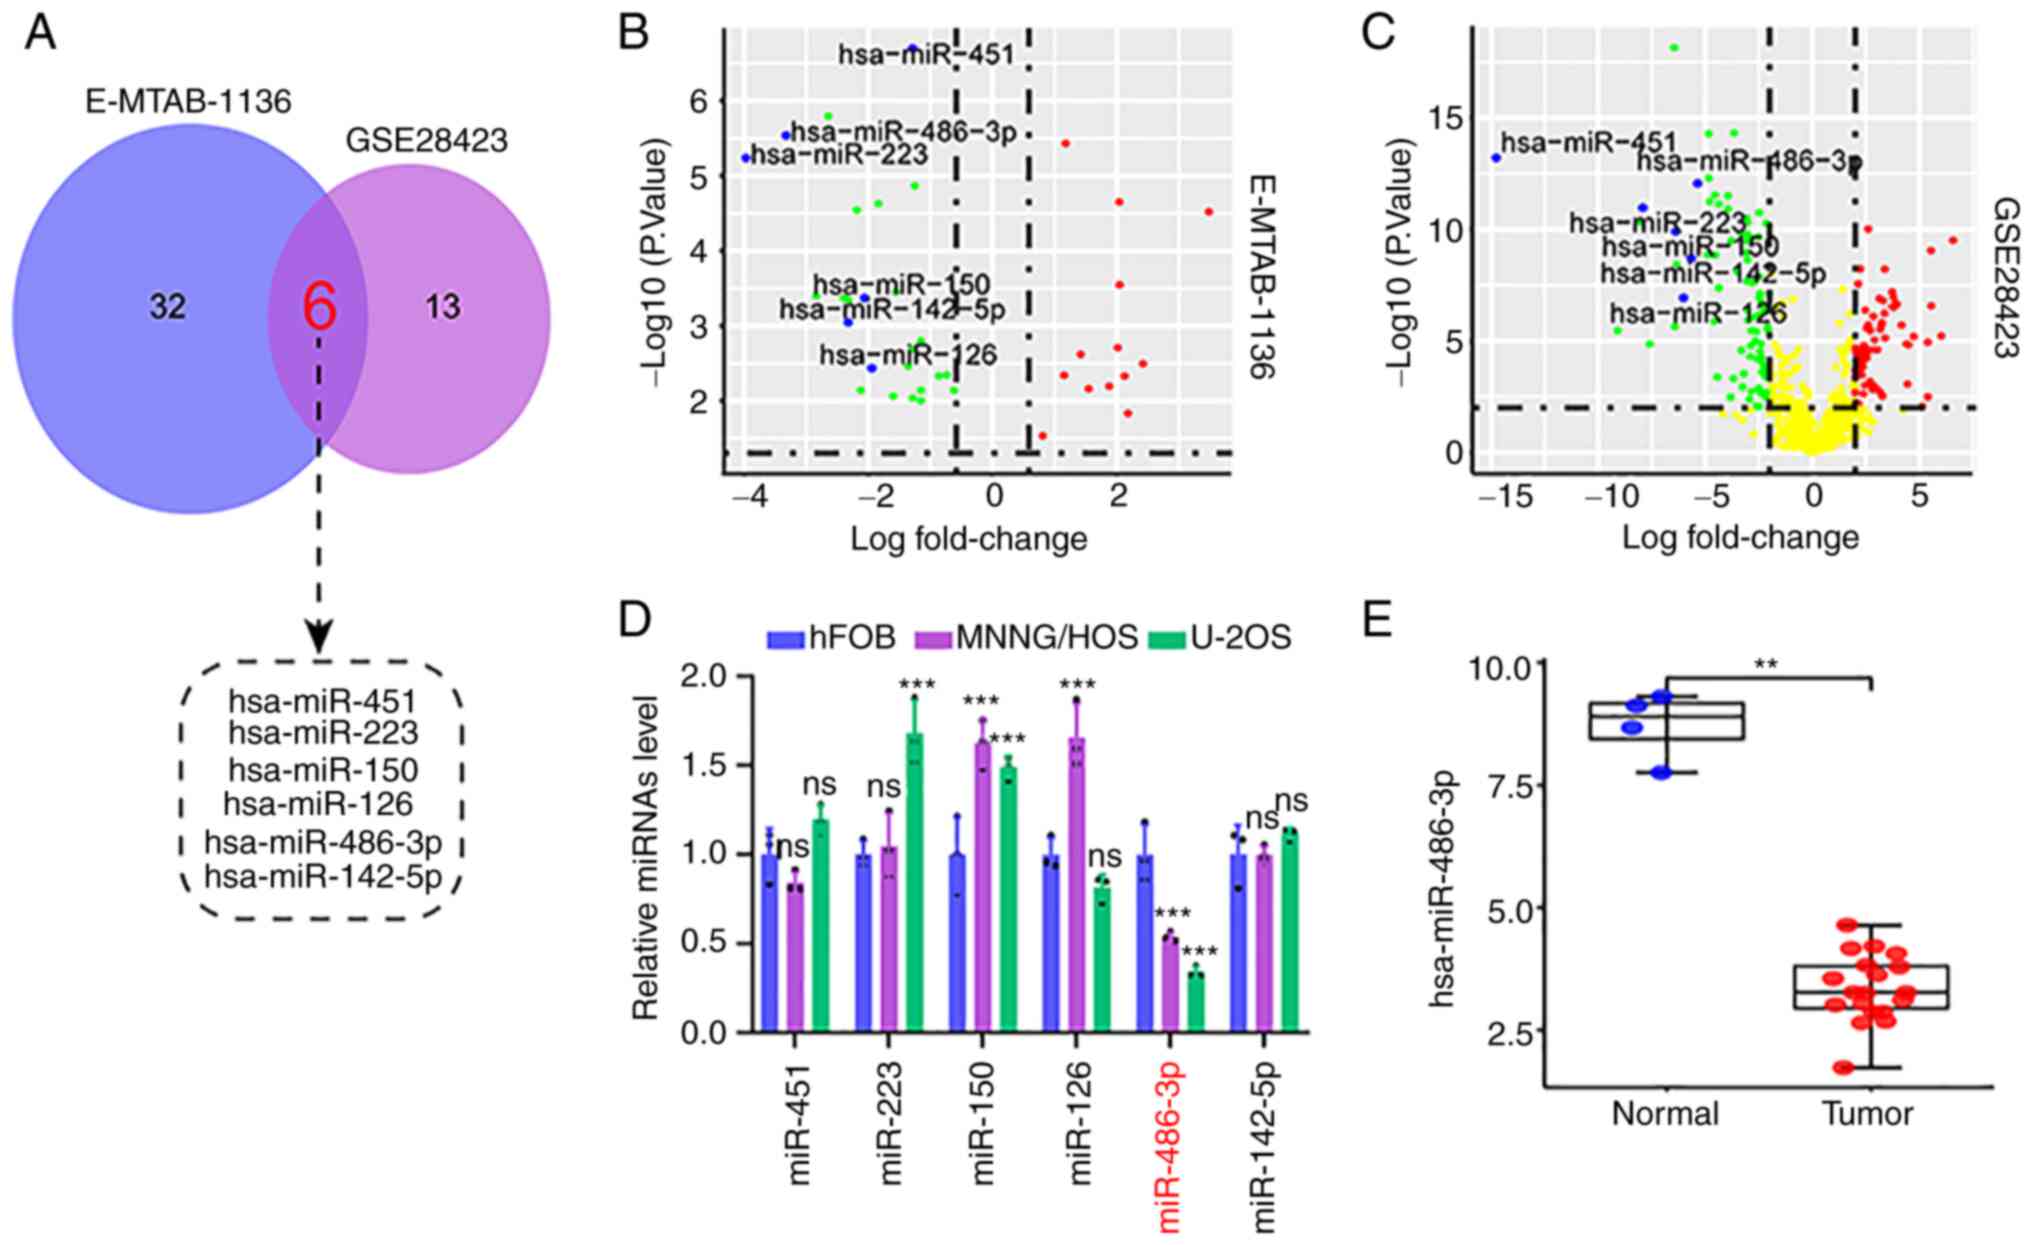
First, a total of 6 differentially expressed
microRNAs (DEMs) were identified by overlapping analysis of
OS-related datasets from the published microarray data (E-MTAB-1136
and GSE28423; Fig. 1A). As shown in
the volcano plot, these DEMs were significantly downregulated in
tumor tissue compared with that in normal tissues (Fig. 1B and C). Next, the expression level
of these DEMs was investigated in OS cell lines and tissues. Of
note, only miR-486-3p was significantly downregulated in OS cell
lines (MNNG/HOS and U2OS), as compared with normal osteoblast cells
(hFOB1.19; Fig. 1D); these findings
were consistent with those in OS tissues from the GSE28423 dataset
(Fig. 1E). These results suggested
that miR-486-3p downregulation may play a key role in the
occurrence and progression of OS.
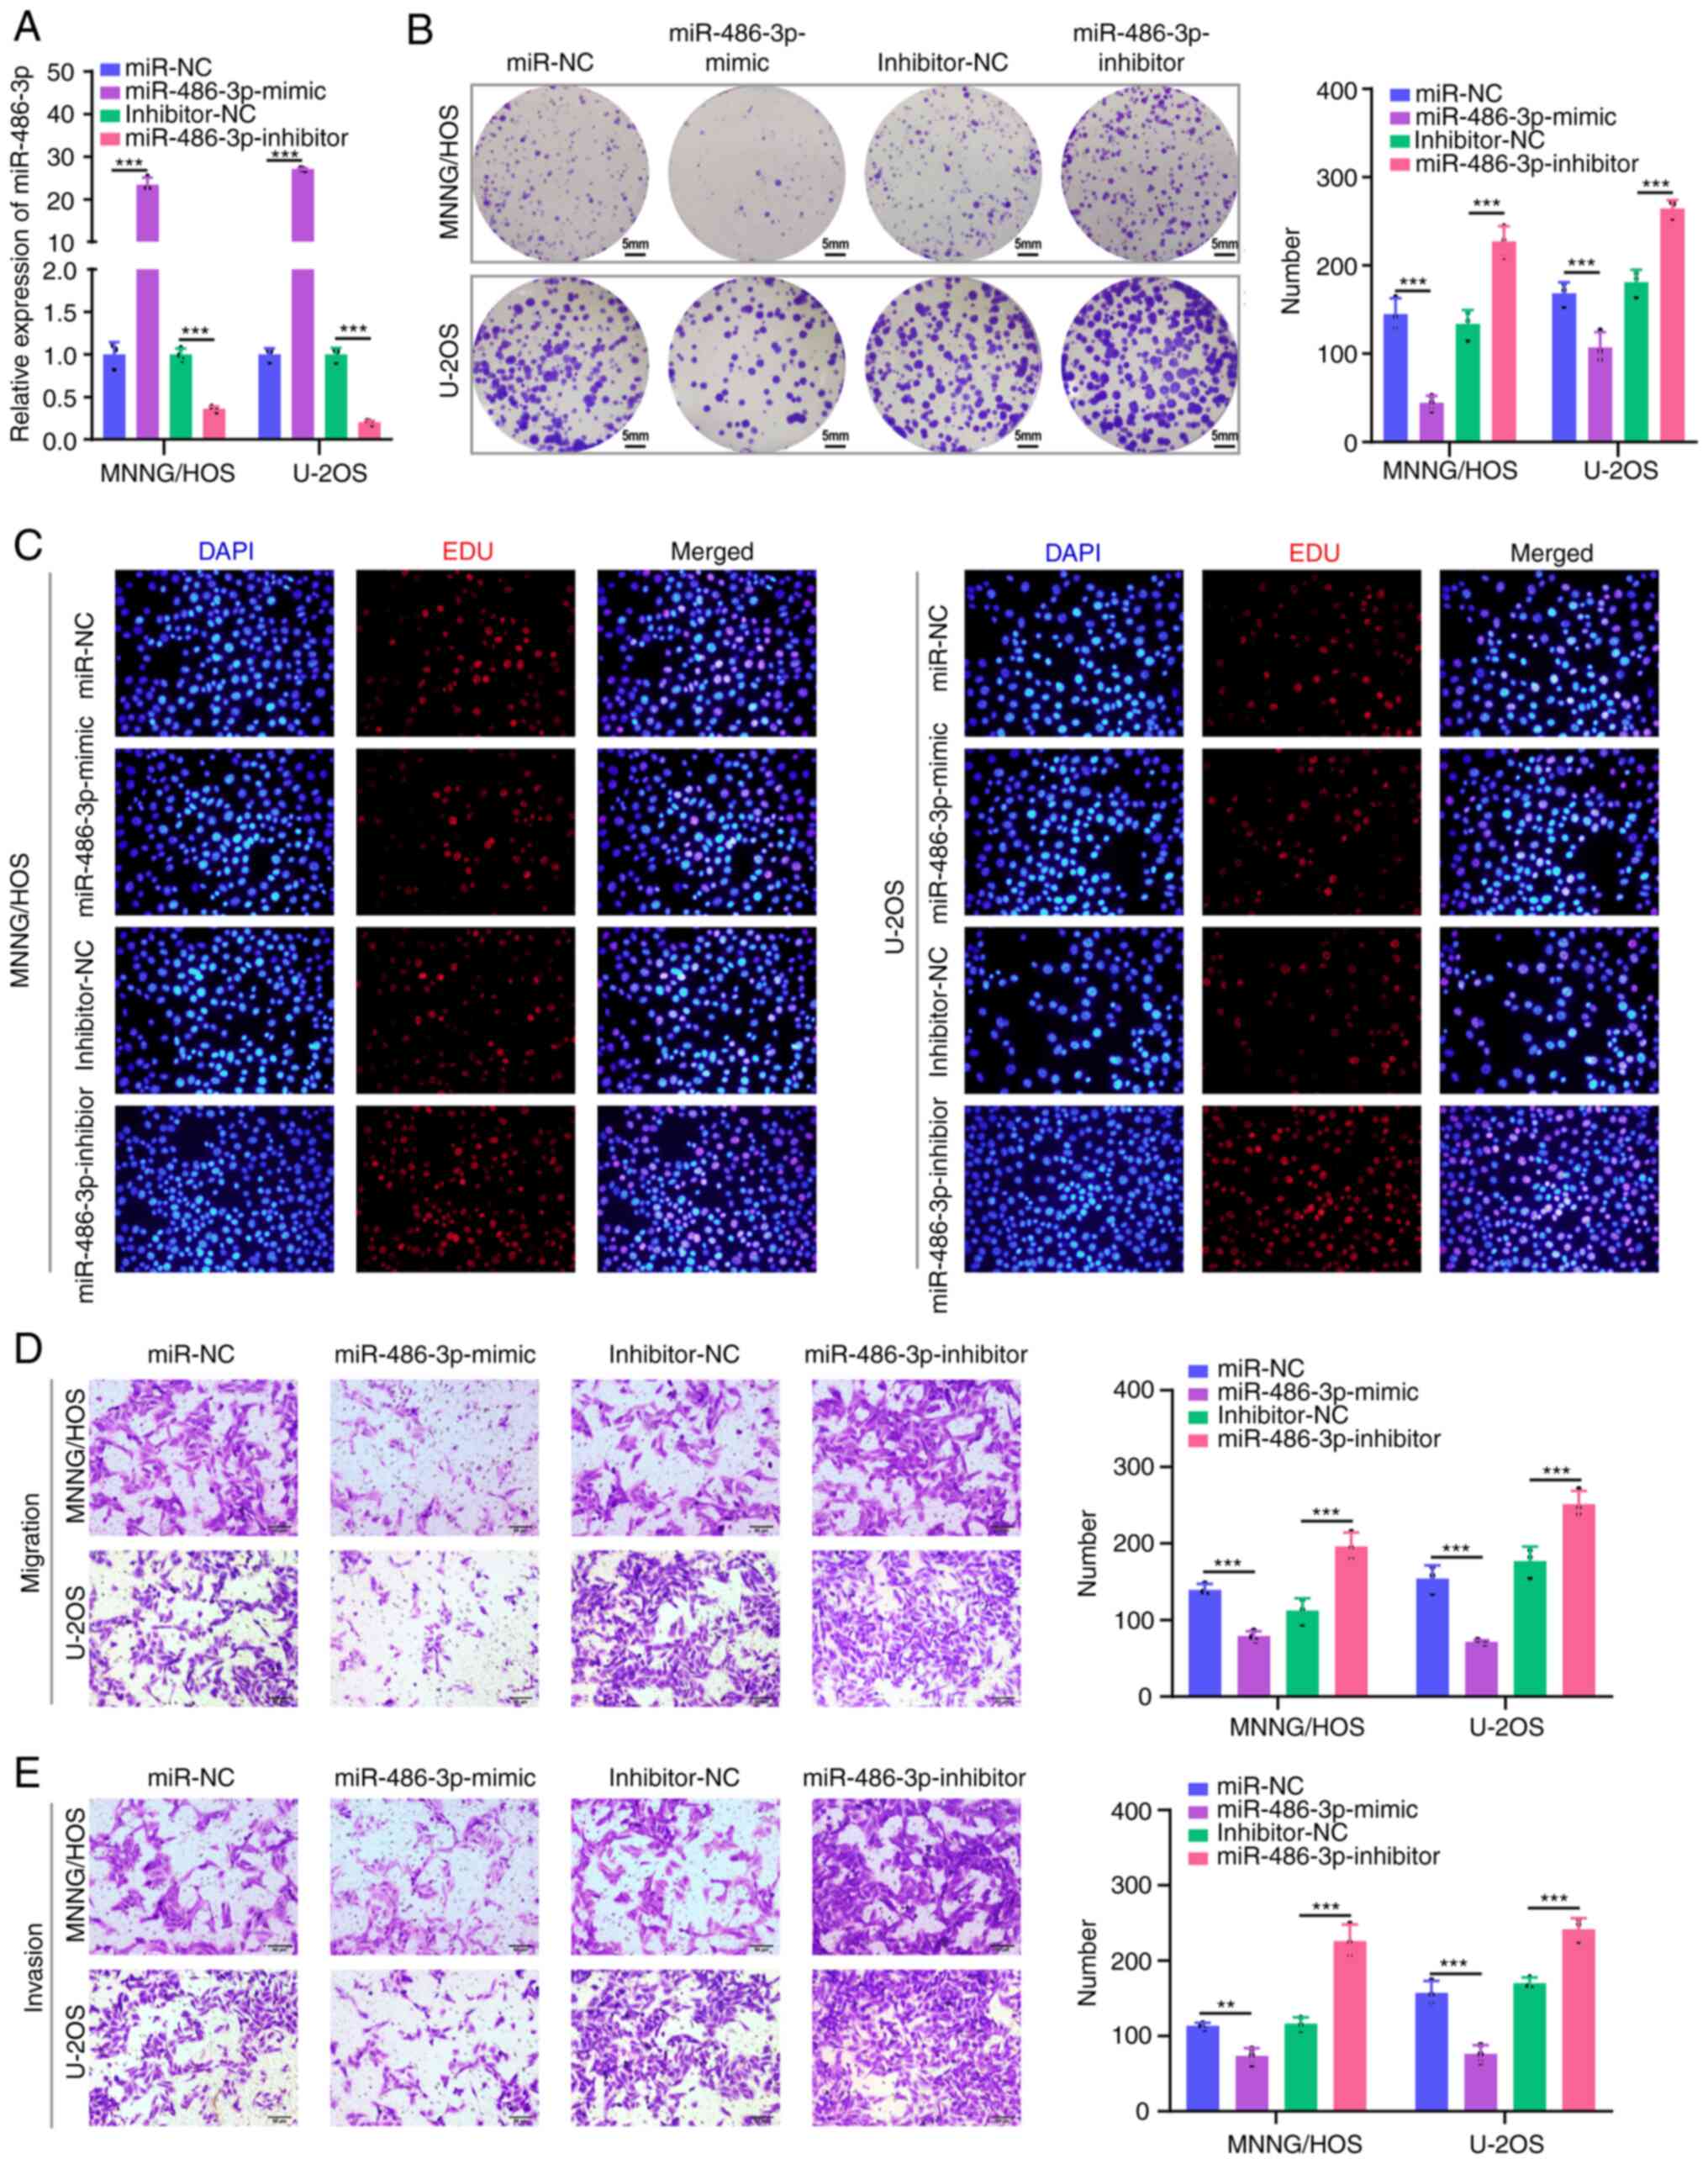
miR-486-3p overexpression inhibits the
progression of OS cells
To further investigate the biological effect of
miR-486-3p, miR-486-3p mimics or inhibitors were transfected into
MNNG/HOS and U2OS cells to upregulate or downregulate miR-486-3p
expression. As shown in Fig. 2A,
the transfection efficiency yielded a satisfactory result. The
colony formation and EdU incorporation assays indicated that
miR-486-3p overexpression inhibited MNNG/HOS and U2OS cell
proliferation, and miR-486-3p silencing significantly promoted cell
proliferation in these two cell lines (Fig. 2B and C). Moreover, Transwell
invasion assay demonstrated that miR-486-3p overexpression
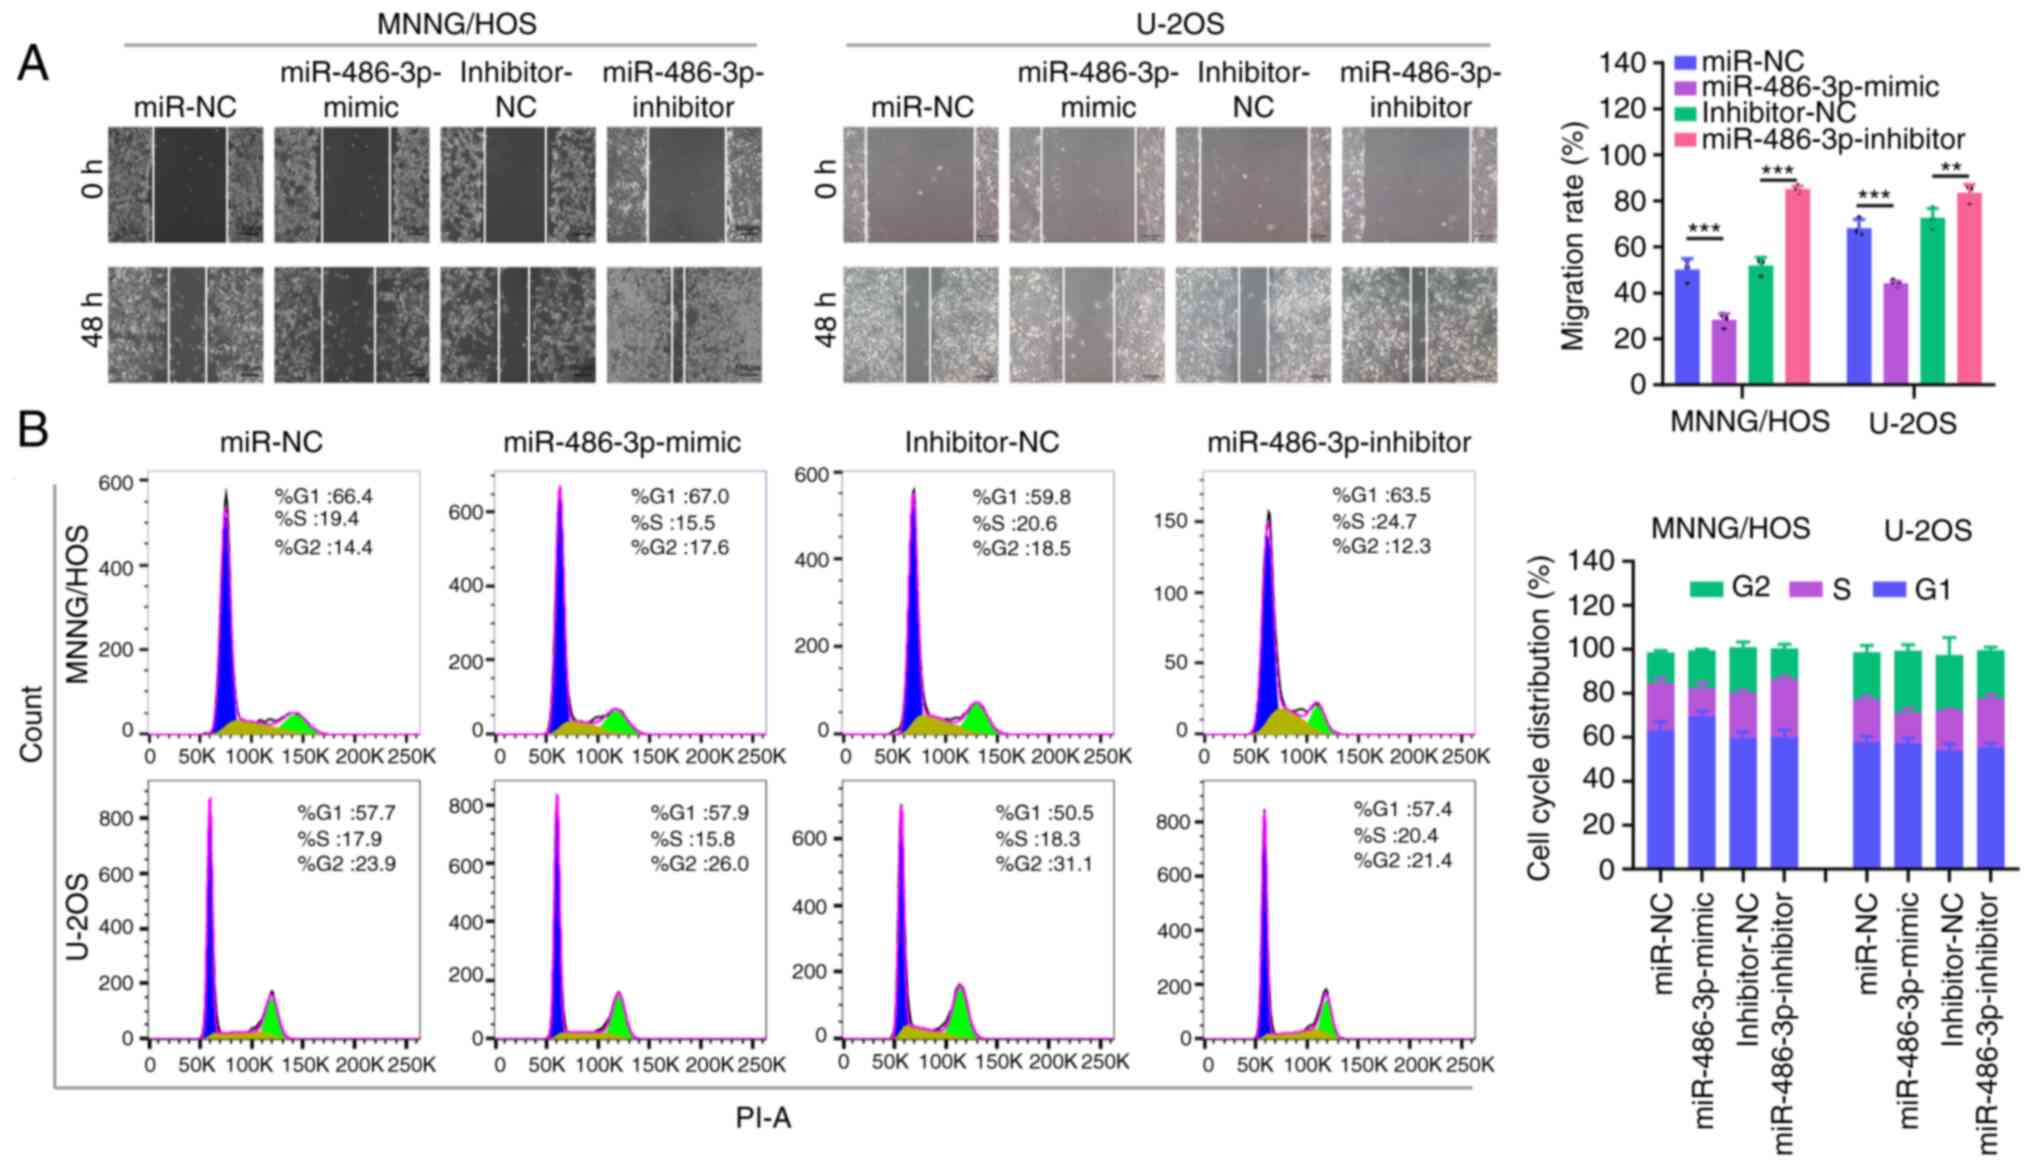
significantly impeded MNNG/HOS and U2OS cell migration (Fig. 2D) and invasion (Fig. 2E). In addition, the wound healing
assay demonstrated that miR-486-3p overexpression could
significantly inhibit OS cell migration (Fig. 3A). The cell cycle was analyzed by
flow cytometry and the results showed that the percentage of OS
cells in S phase was reduced in the miR-486-3p mimic group
(Fig. 3B), suggesting that
miR-486-3p overexpression halted the cell cycle in the G1/S
transition. Comparatively, miR-486-3p deficiency produced the
reverse effect in MNNG/HOS and U2OS cells. In combination, these
data suggested that miR-486-3p overexpression can delay the
progression of OS cells.
MARCH1 is a direct target of
miR-486-3p
To improve understanding of the underlying
mechanisms of miR-486-3p, the bioinformatics datasets TARGET-OS,
GSE12865 and miRWalk3.0 database were searched to predict potential
target genes of miR-486-3p, as previously reported (29–32).
As demonstrated in the Venn diagram, a total of eight genes were
identified as the underlying target of miR-486-3p (Fig. 4A). Among them, five genes (PDE10A,
THRB, UNC5C, MARCH1 and ROBO2) were simultaneously upregulated in
OS samples compared with the non-cancerous samples, as shown in the
volcano plots (Fig. 4B and C). The
expression levels of these genes in OS cells were analyzed using
RT-qPCR. As compared with the hFOB1.19 cells, only MARCH1
expression was elevated in both OS cells (Fig. 4D). Furthermore, a significantly
decreased expression of MARCH1 following miR-486-3p overexpression
was identified in MNNG/HOS and U2OS cells (Fig. 4E). The MARCH1 mRNA was found to have
potential binding sites for miR-486-3p (Fig. 4F). Next, the luciferase reporter
assay was carried out to validate their binding, and it was
observed that the co-transfection of the wt MARCH1 vector
(Luc-MARCH1-wt) and miR-486-3p mimics, but not the mut MARCH1
vector (Luc-MARCH1-mut), significantly suppressed luciferase
activity in MNNG/HOS and U2OS cells (Fig. 4G). RIP experiments also proved that
they are bond with each other (Fig.
4H). Therefore, MARCH1 was the downstream target gene of
miR-486-3p in OS.
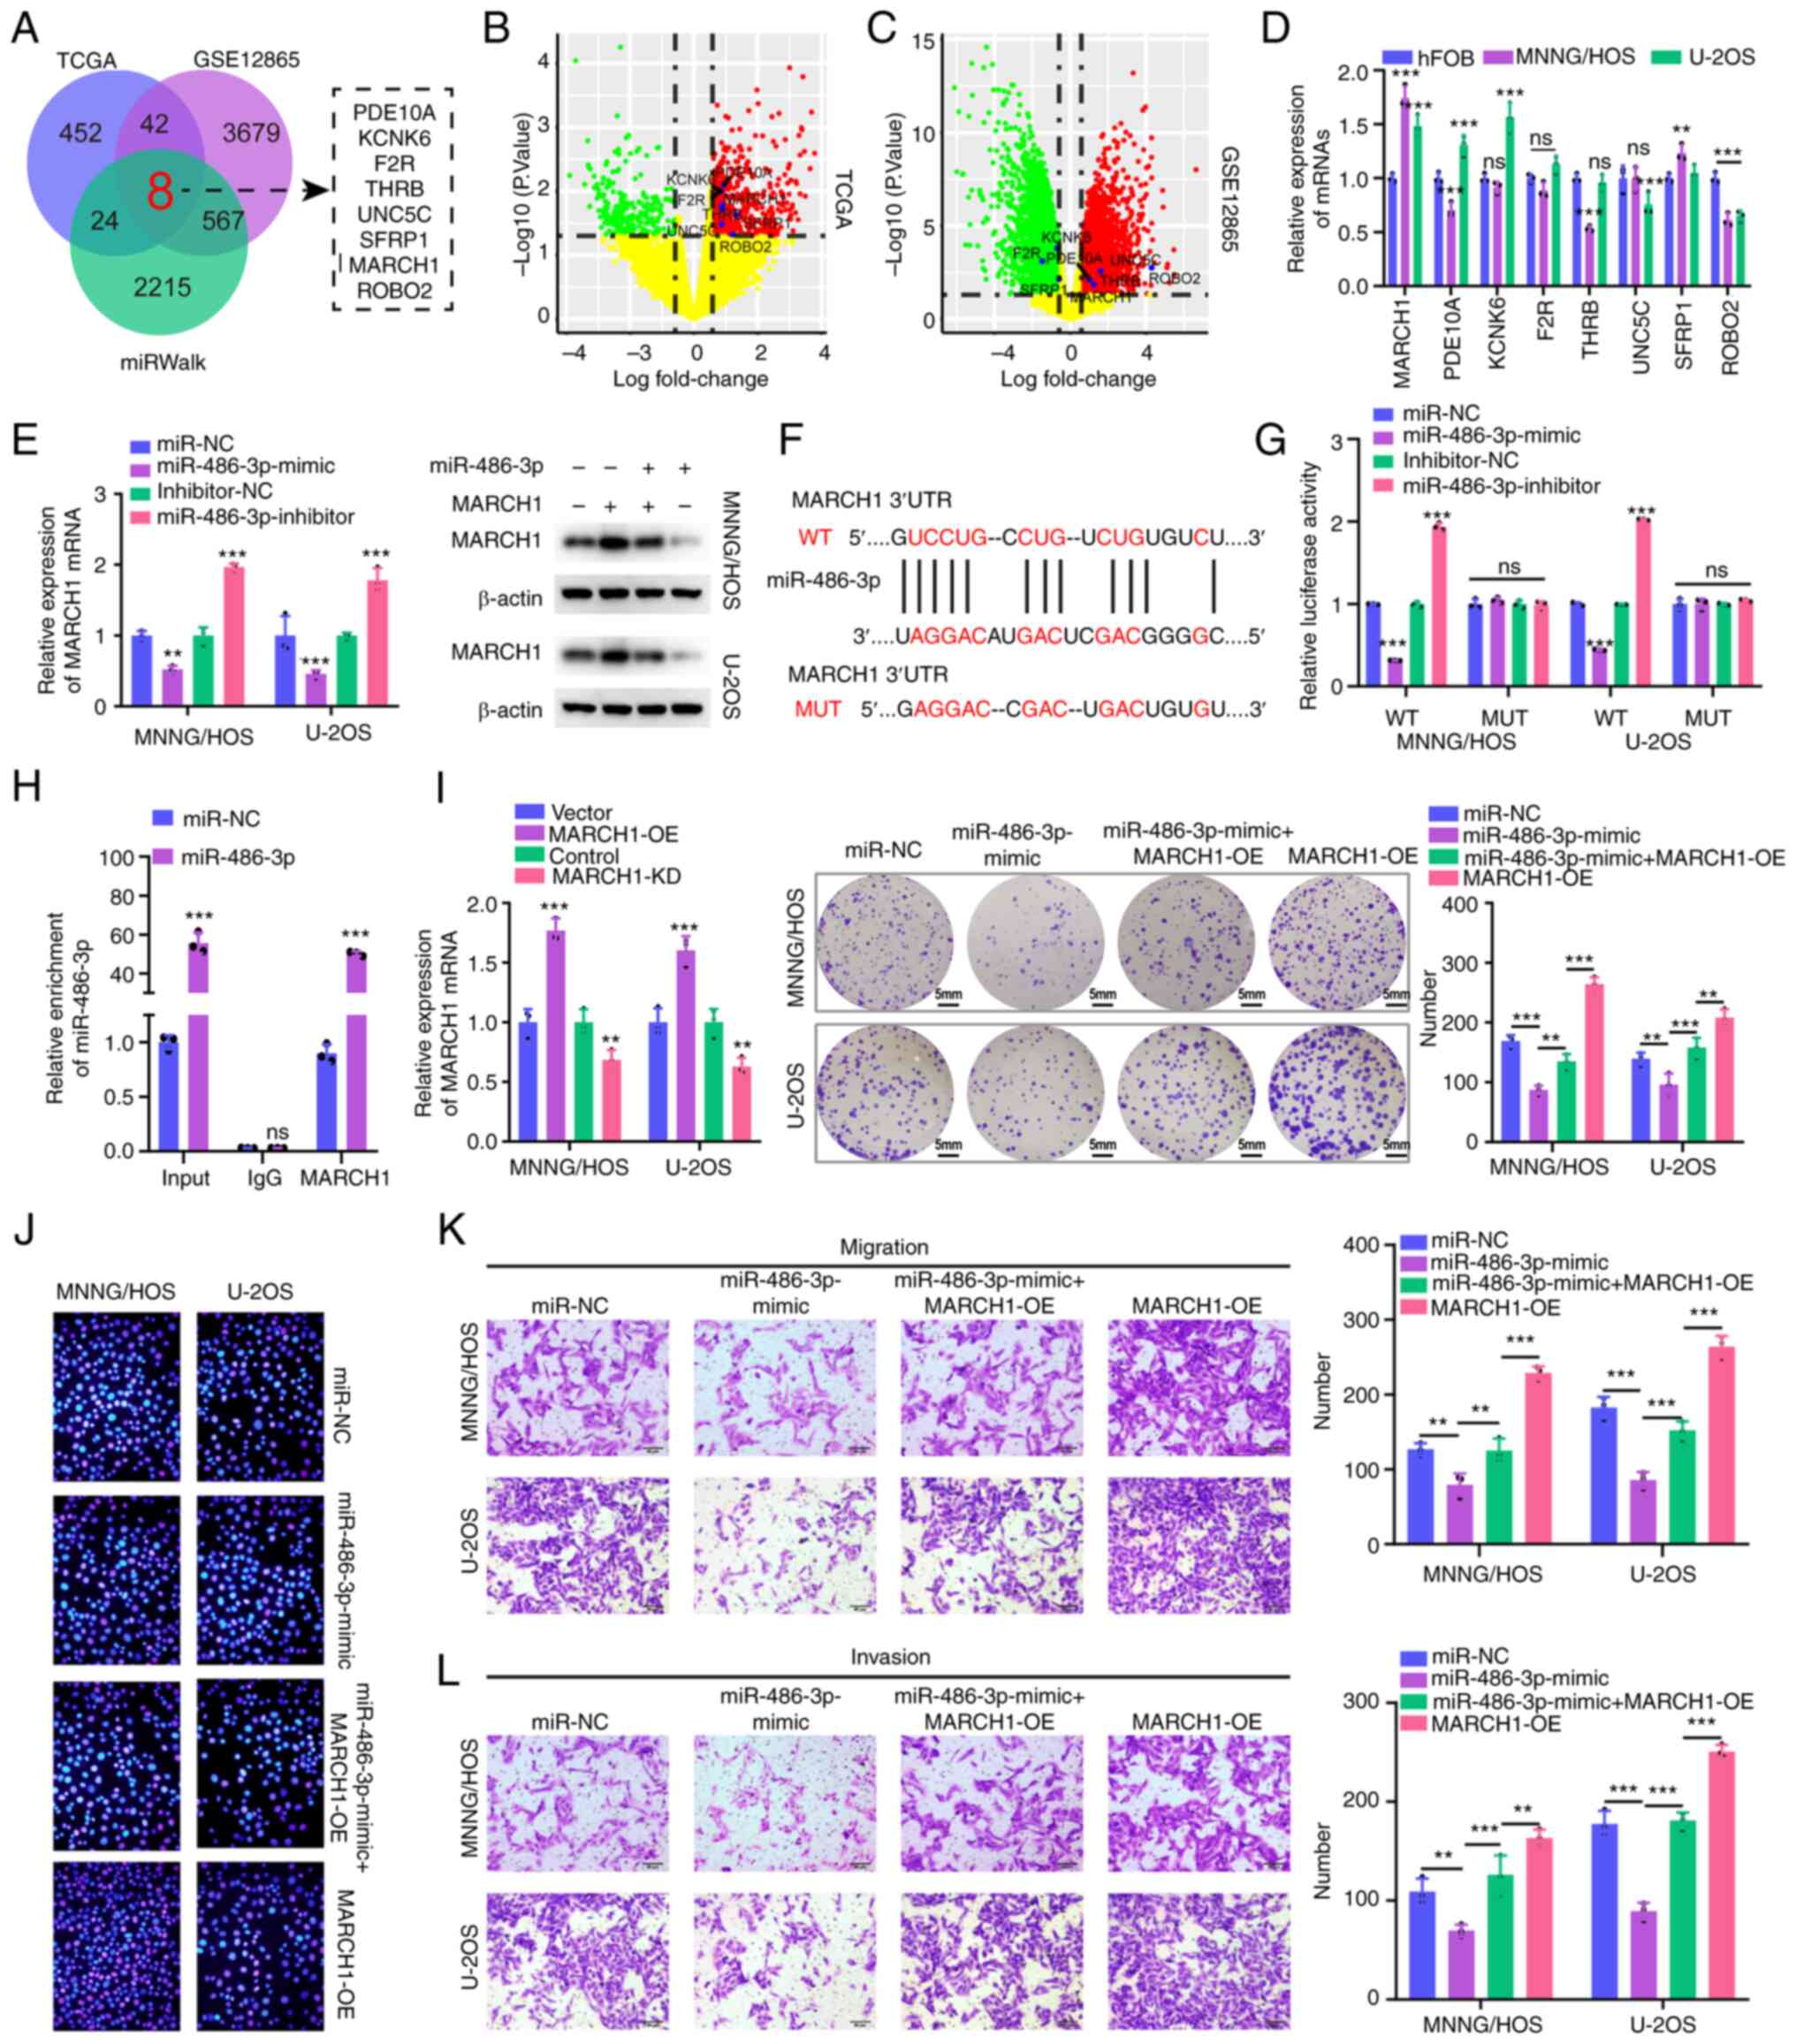 | Figure 4.MARCH1 is a direct target of
miR-486-3p. (A) Overlapping analysis of DEGs in osteosarcoma
tissues using bioinformatics analysis based on TCGA, GSE12865
datasets as well as miRWalk database. (B and C) Volcano plot of the
selected 8 DEGs in the TARGET-OS and GSE12865 datasets. (D) RT-qPCR
analysis for 8 screened mRNAs in MNNG/HOS, U2OS and hFOB1.19 cells.
(E) RT-qPCR and western blot assay were applied to evaluated MARCH1
mRNA (left) and protein level (right) in MNNG/HOS and U2OS cells
with or without miR-486-3p mimics. (F) The binding sites of MARCH1
and miR-486-3p and the mutant sequence of MARCH1 based on binding
region. (G) miR-486-3p mimics suppressed the luciferase activity of
MARCH1 wt vector in MNNG/HOS and U2OS cells. (H) The enrichment
level of IgG or MARCH1 to miR-486-3p was evaluated by RNA
immunoprecipitation assay with or without miR-486-3p
overexpression. (I and J) Cell proliferative ability was measured
by colony formation and 5-Ethynyl-2′-deoxyuridine incorporation
assays with MARCH1 overexpression or MARCH1 overexpression +
miR-486-3p mimics in MNNG/HOS and U2OS cells. The transfection
efficiency of vectors that overexpress and knock down MARCH1 was
validated at 4I (left). (K and L) Transwell assay was exploited to
explore the invasive and migratory ability with MARCH1
overexpression or MARCH1 overexpression + miR-486-3p mimics in
MNNG/HOS and U2OS cells. MARCH1, membrane-associated RINGCH finger
protein 1; miR, microRNA; DEG, differentially expressed genes;
TCGA, The Cancer Genome Atlas; RT-qPCR, reverse
transcription-quantitative PCR; wt, wild-type; mut, mutant; NC,
negative control; OE, overexpression. **P<0.01,
***P<0.001. |
MARCH1 overexpression in MNNG/HOS and U2OS cells
increased the colony numbers, an affect that could be largely
attenuated by miR-486-3p mimic transfection (Fig. 4I). The same trend as that of cell
proliferation was observed in EdU incorporation experiments
(Fig. 4J). Similarly, the
overexpression of miR-486-3p could reverse the increase in cell
migration and invasion caused by MARCH1 overexpression (Fig. 4K and L). Overall, the findings of
the present study, indicated that miR-486-3p could suppress the
progression of OS cells by targeting MARCH1.
circKEAP1 directly targets miR-486-3p
in OS cells
Accumulating evidence indicates that the ceRNA
networks play a significant role in the occurrence and progression
of cancer (20). To investigate
potential circRNAs that regulate miR-486-3p expression in OS,
differentially expressed circRNAs (DECs) from GSE140256 were
overlapped with predicted targets from the circBank database. As a
result, a total of four DECs (hsa_circ_0078767, hsa_circ_0010220,
hsa_circ_0020378 and hsa_circ_0049271) were identified (Fig. 5A). Among them, two circRNAs were
upregulated and two were downregulated in the OS samples compared
with the non-cancerous samples, as shown in the volcano plot
(Fig. 5B). Next, the expression
level of these 4 DECs were determined in OS cell lines, and it was
found that only hsa_circ_0049271 (circKEAP1) was validated by PCR
amplification using divergent primers from the cDNA of OS cell
lines (Fig. 5C). Hsa_circ_0049271
derived from the KEAP1 gene exon 2, and Sanger sequencing confirmed
the head-to-tail splicing structure in circKEAP1 (Fig. 5D). In addition, the circular
properties of circKEAP1 were also identified using divergent and
convergent primers (Fig. 5E).
circKEAP1 was also significantly upregulated in OS cells, as
revealed by RT-qPCR (Fig. 5F). Of
note, miR-486-3p overexpression decreased the expression of
circKEAP1, while miR-486-3p silencing increased the expression of
circKEAP1 in MNNG/HOS and U2OS cell lines (Fig. 5G). Moreover, dual luciferase
reporter assay indicated a direct regulatory association between
miR-486-3p and circKEAP1 (Fig.
5H).
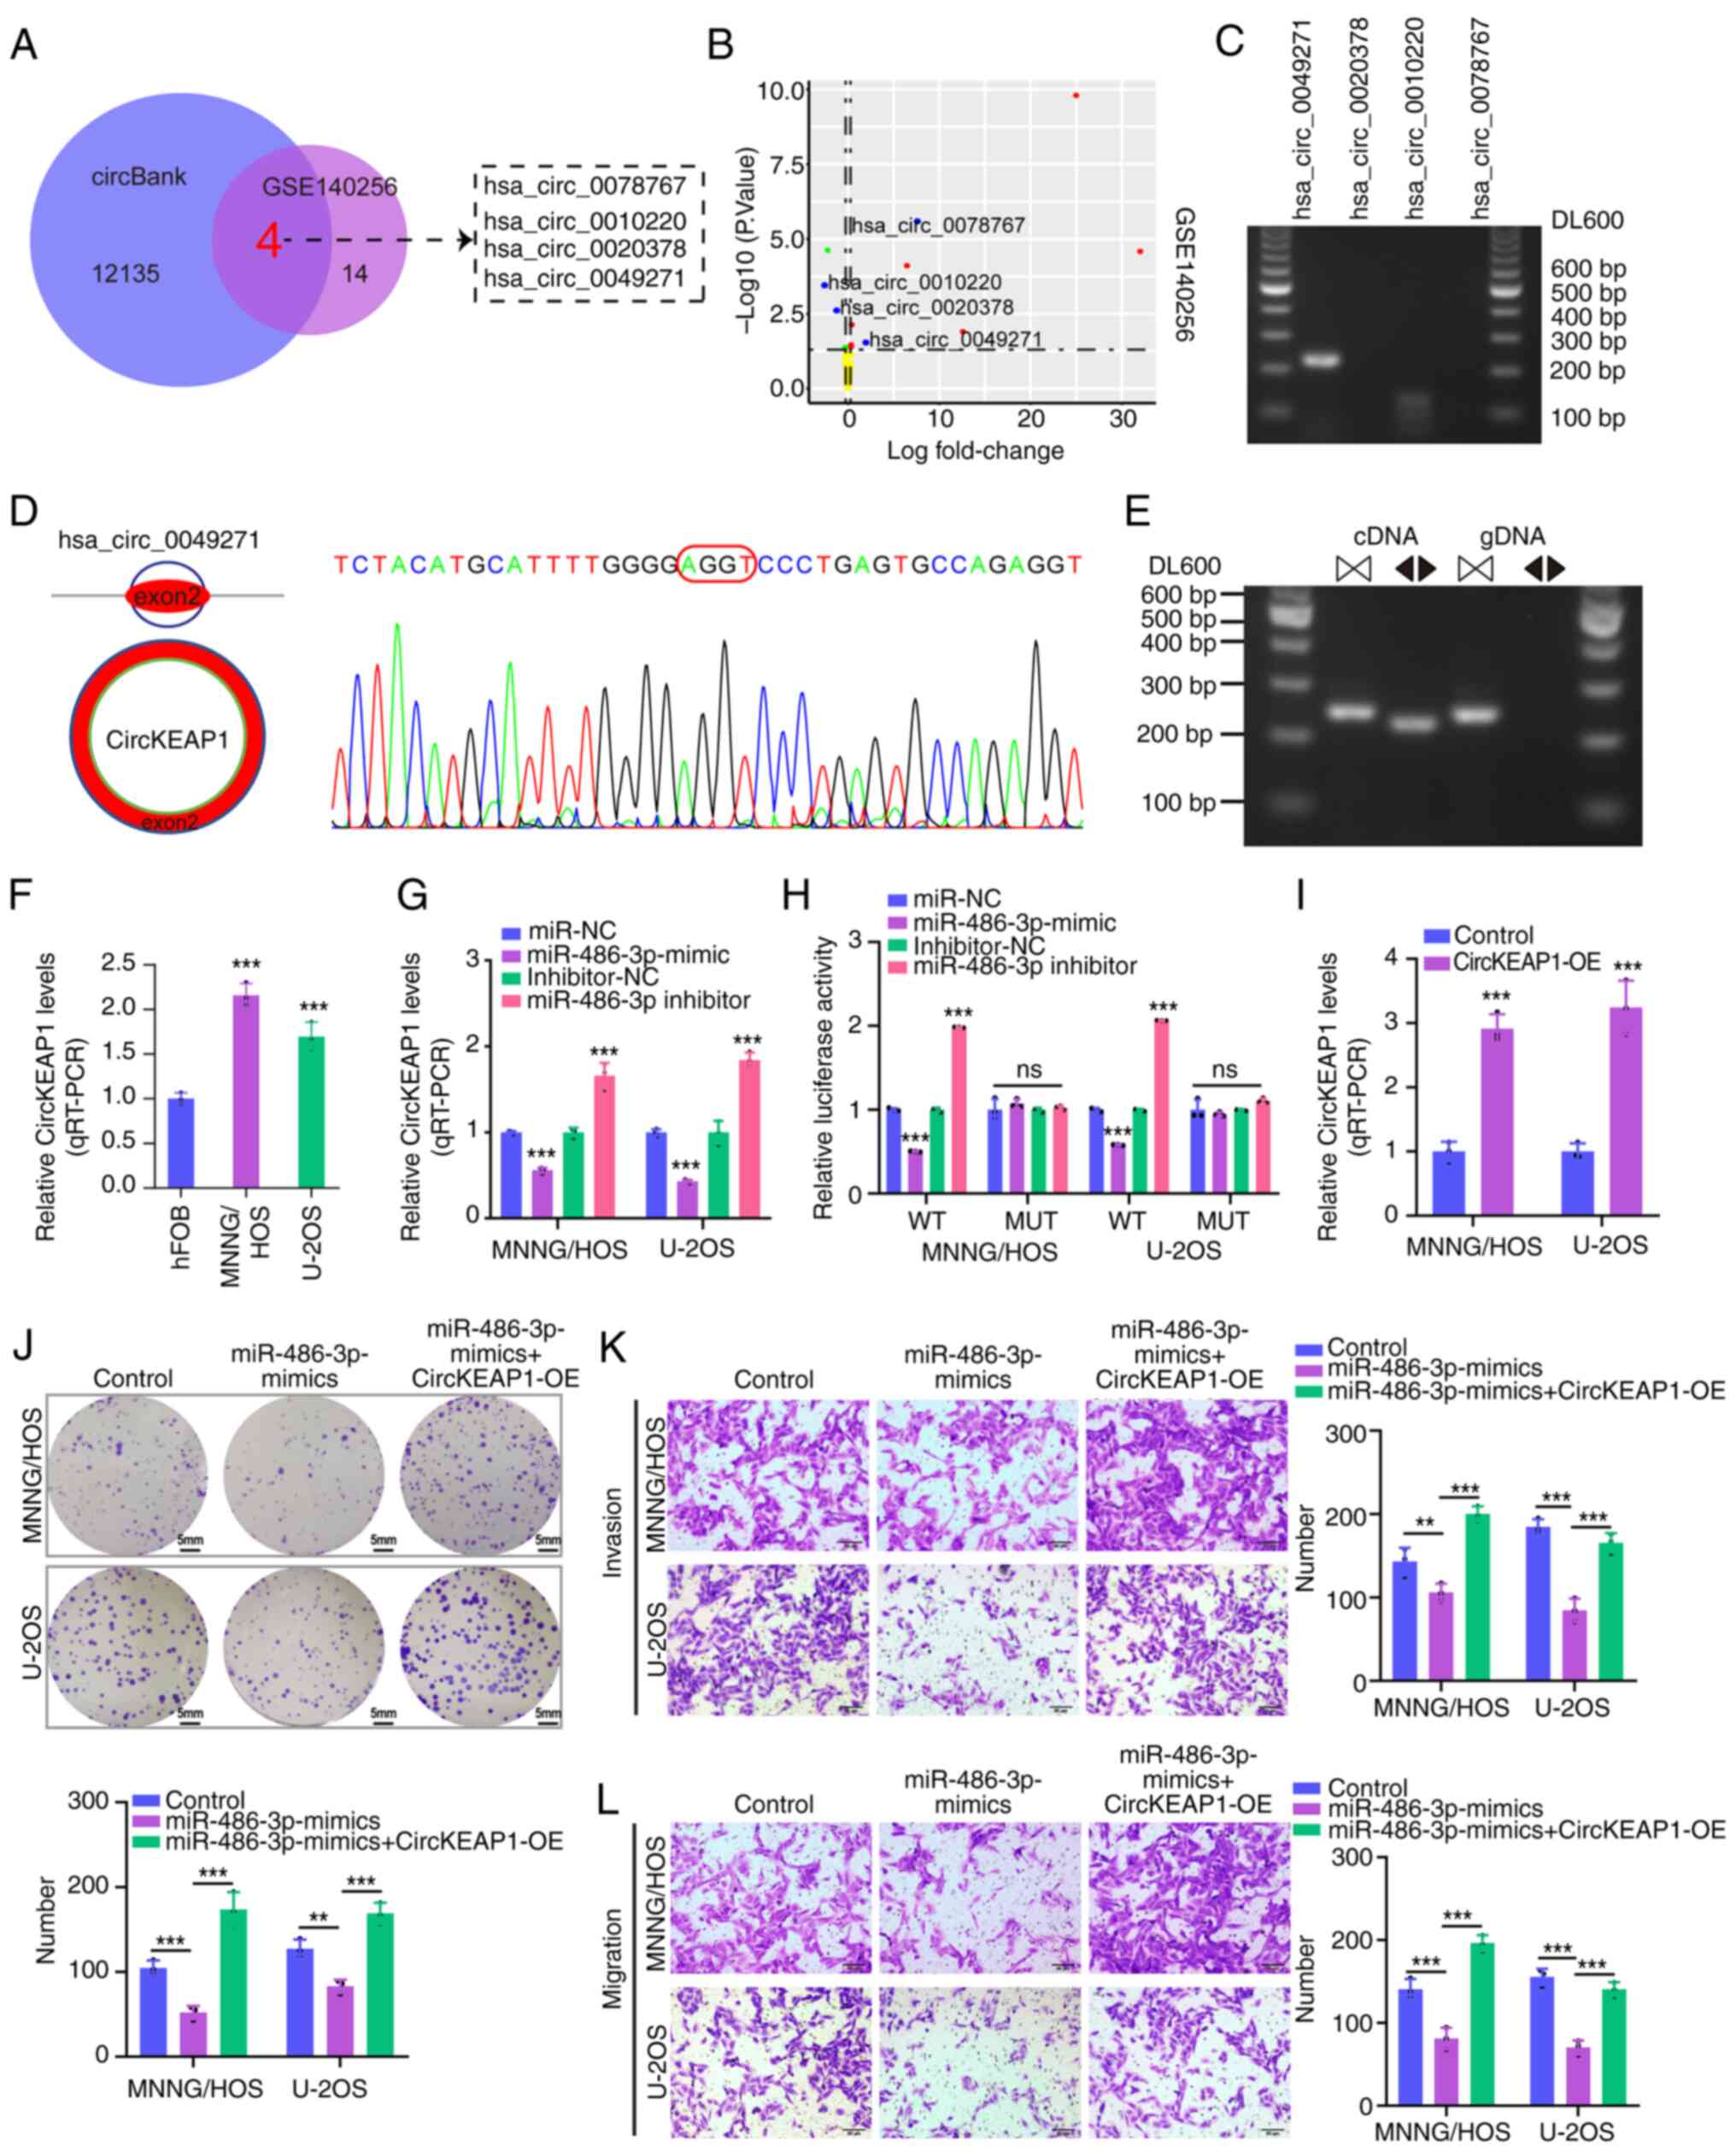 | Figure 5.CircKEAP1 directly targets miR-486-3p
in osteosarcoma cells. (A) DECs from GSE140256 dataset were
overlapped with predicted target circRNAs from circBank database.
(B) Volcano plot of the selected 4 DECs in the GSE140256 dataset.
(C) The expression level of 4 screened DECs in MNNG/HOS cells. (D
and E) The characterization of circKEAP1. The expression level of
circKEAP1 was assessed via RT-qPCR assay and Sanger sequencing.
Arrows represent divergent primers targeting circKEAP1 genome
region (Left); RT-qPCR products using divergent primers indicating
circularization of circKEAP1. cDNA represents complementary DNA.
gDNA represents genomic DNA (Right). (F) RT-qPCR analysis of
circKEAP1 expression in MNNG/HOS, U2OS and hFOB1.19 cells. (G)
RT-qPCR analysis of circKEAP1 expression with miR-486-3p
overexpression or miR-486-3p knockdown in MNNG/HOS and U2OS cells.
(H) miR-486-3p mimics suppressed the luciferase activity of
circKEAP1 wild-type vector in MNNG/HOS and U2OS cells. (I) RT-qPCR
assays for investigation of circKEAP1 expression levels with
circKEAP1 overexpression vectors in MNNG/HOS and U2OS cells and
empty vector was used as negative control. (J) Cell proliferation
was detected via colony formation with miR-486-3p mimics or
miR-486-3p mimics + circKEAP1 overexpression in MNNG/HOS and U2OS
cells. (K and L) Transwell assay was exploited to explore the
invasive and migratory ability in MNNG/HOS and U2OS cells. DEGs,
differentially expressed genes; circ, circular; miR, microRNA;
DECs, differentially expressed circRNAs; RT-qPCR, reverse
transcription-quantitative; gDNA, genomic DNA; NC, negative
control; OE, overexpression. **P<0.01, ***P<0.001. |
To further explore the pathological role of
circKEAP1 in OS cells, circKEAP1 overexpression vectors
(circKEAP1-OE) were transfected into MNNG/HOS and U2OS cells. As
compared with the blank control group, the expression level of
circKEAP1 was significantly upregulated in both cell types
following transfection with circKEAP1-OE (Fig. 5I). It was subsequently investigated
whether circKEAP1 plays a tumor-promoting role by sponging
miR-486-3p by co-transfecting MNNG/HOS and U2OS cells with
miR-486-3p mimics and circKEAP1 overexpression vectors. circKEAP1
upregulation blocked the inhibition of cell proliferation,
migration and invasion caused by miR-486-3p mimics (Fig. 5J-L). In combination, these results
suggested that circKEAP1 can sponge miR-486-3p to affect OS cell
proliferation, migration and invasion.
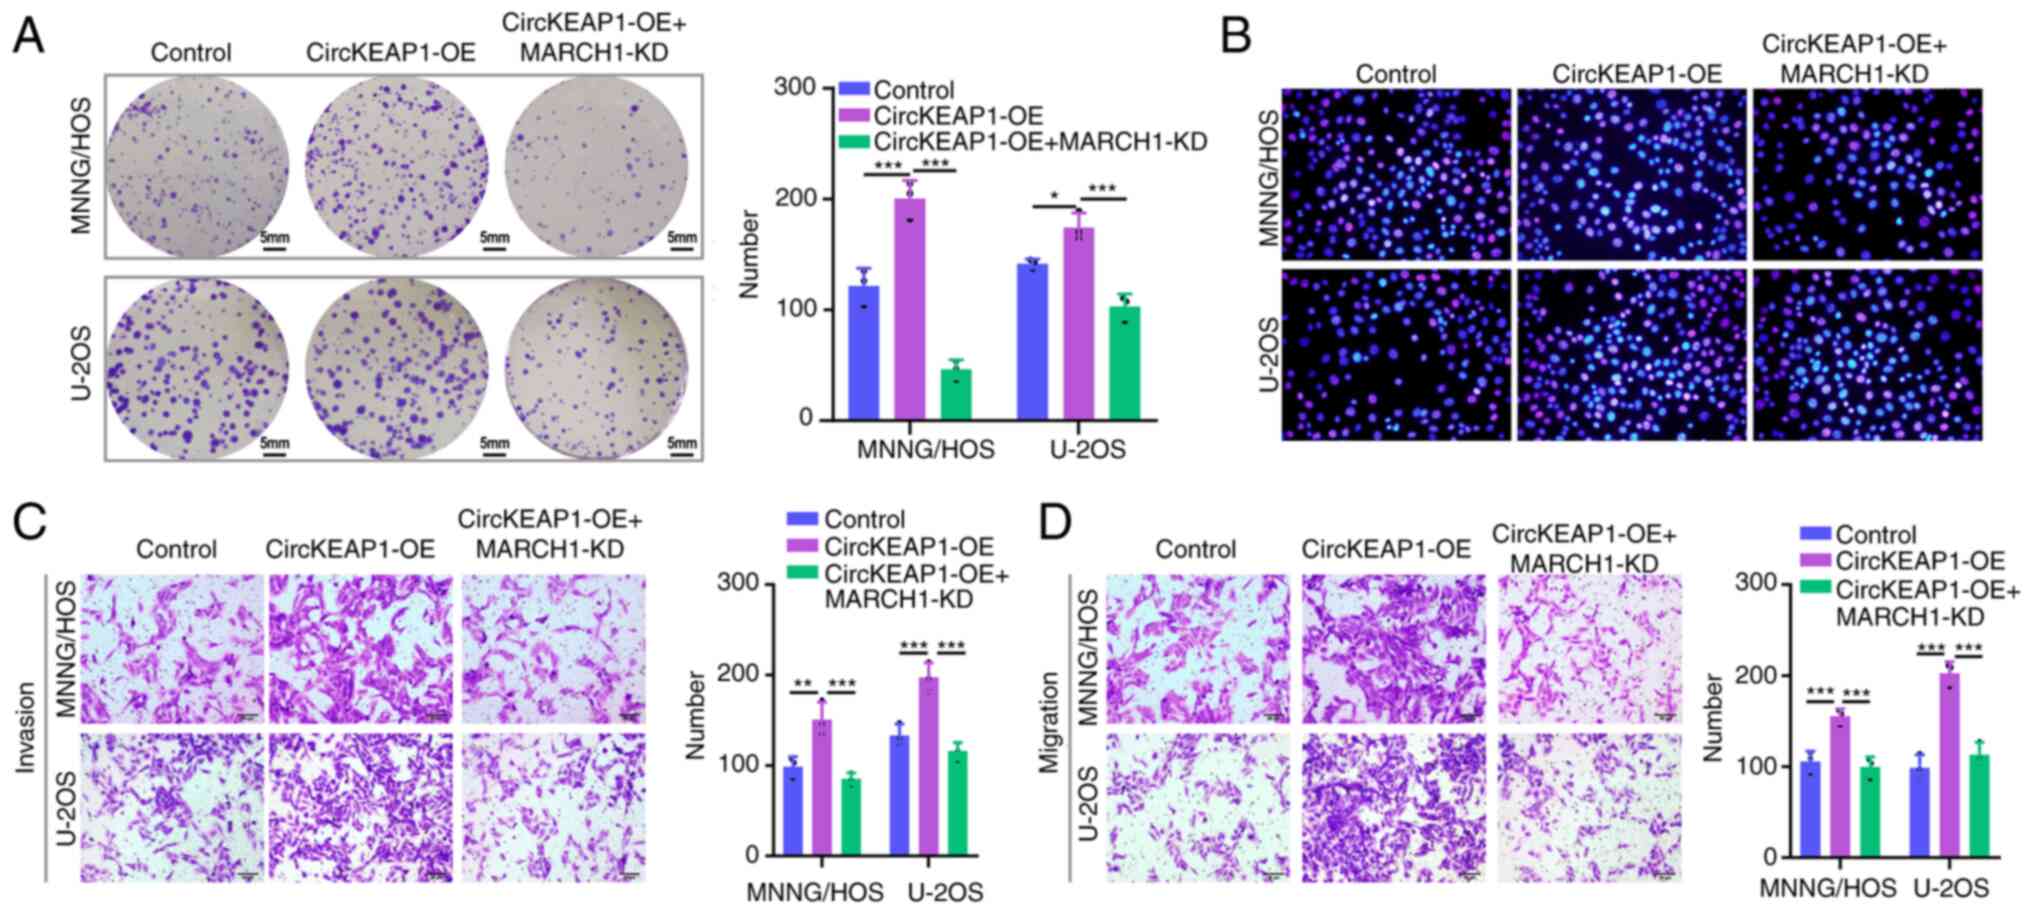
circKEAP1 promotes OS cell
proliferation and migration through MARCH1 upregulation
To investigate whether circKEAP1 plays a promoting
role in OS by upregulating MARCH1, sh-MARCH1 alone or combined with
circKEAP1-OE plasmid was transfected into OS cells. As shown by the
colony formation assay results, following circKEAP1 upregulation,
the cell proliferation ability exhibited by the two OS cell lines
was significantly increased, which was effectively reversed by
MARCH1 downregulation (Fig. 6A).
Similarly, EdU-positive cells were increased following circKEAP1-OE
plasmid transfection, whereas following MARCH1 knockdown reversed
this increase (Fig. 6B).
Furthermore, the Transwell assay results revealed that MARCH1
knockdown could reverse the promoting effect of circKEAP1
overexpression on the invasion and migration ability of MNNG/HOS
and U2OS cells (Fig. 6C and D).
Collectively, these results suggested that circKEAP1 regulated
MARCH1 expression by sponging miR-486-3p in OS cells.
Exosomal miR-486-3p reverses OS cell
progression via packing into exosomes
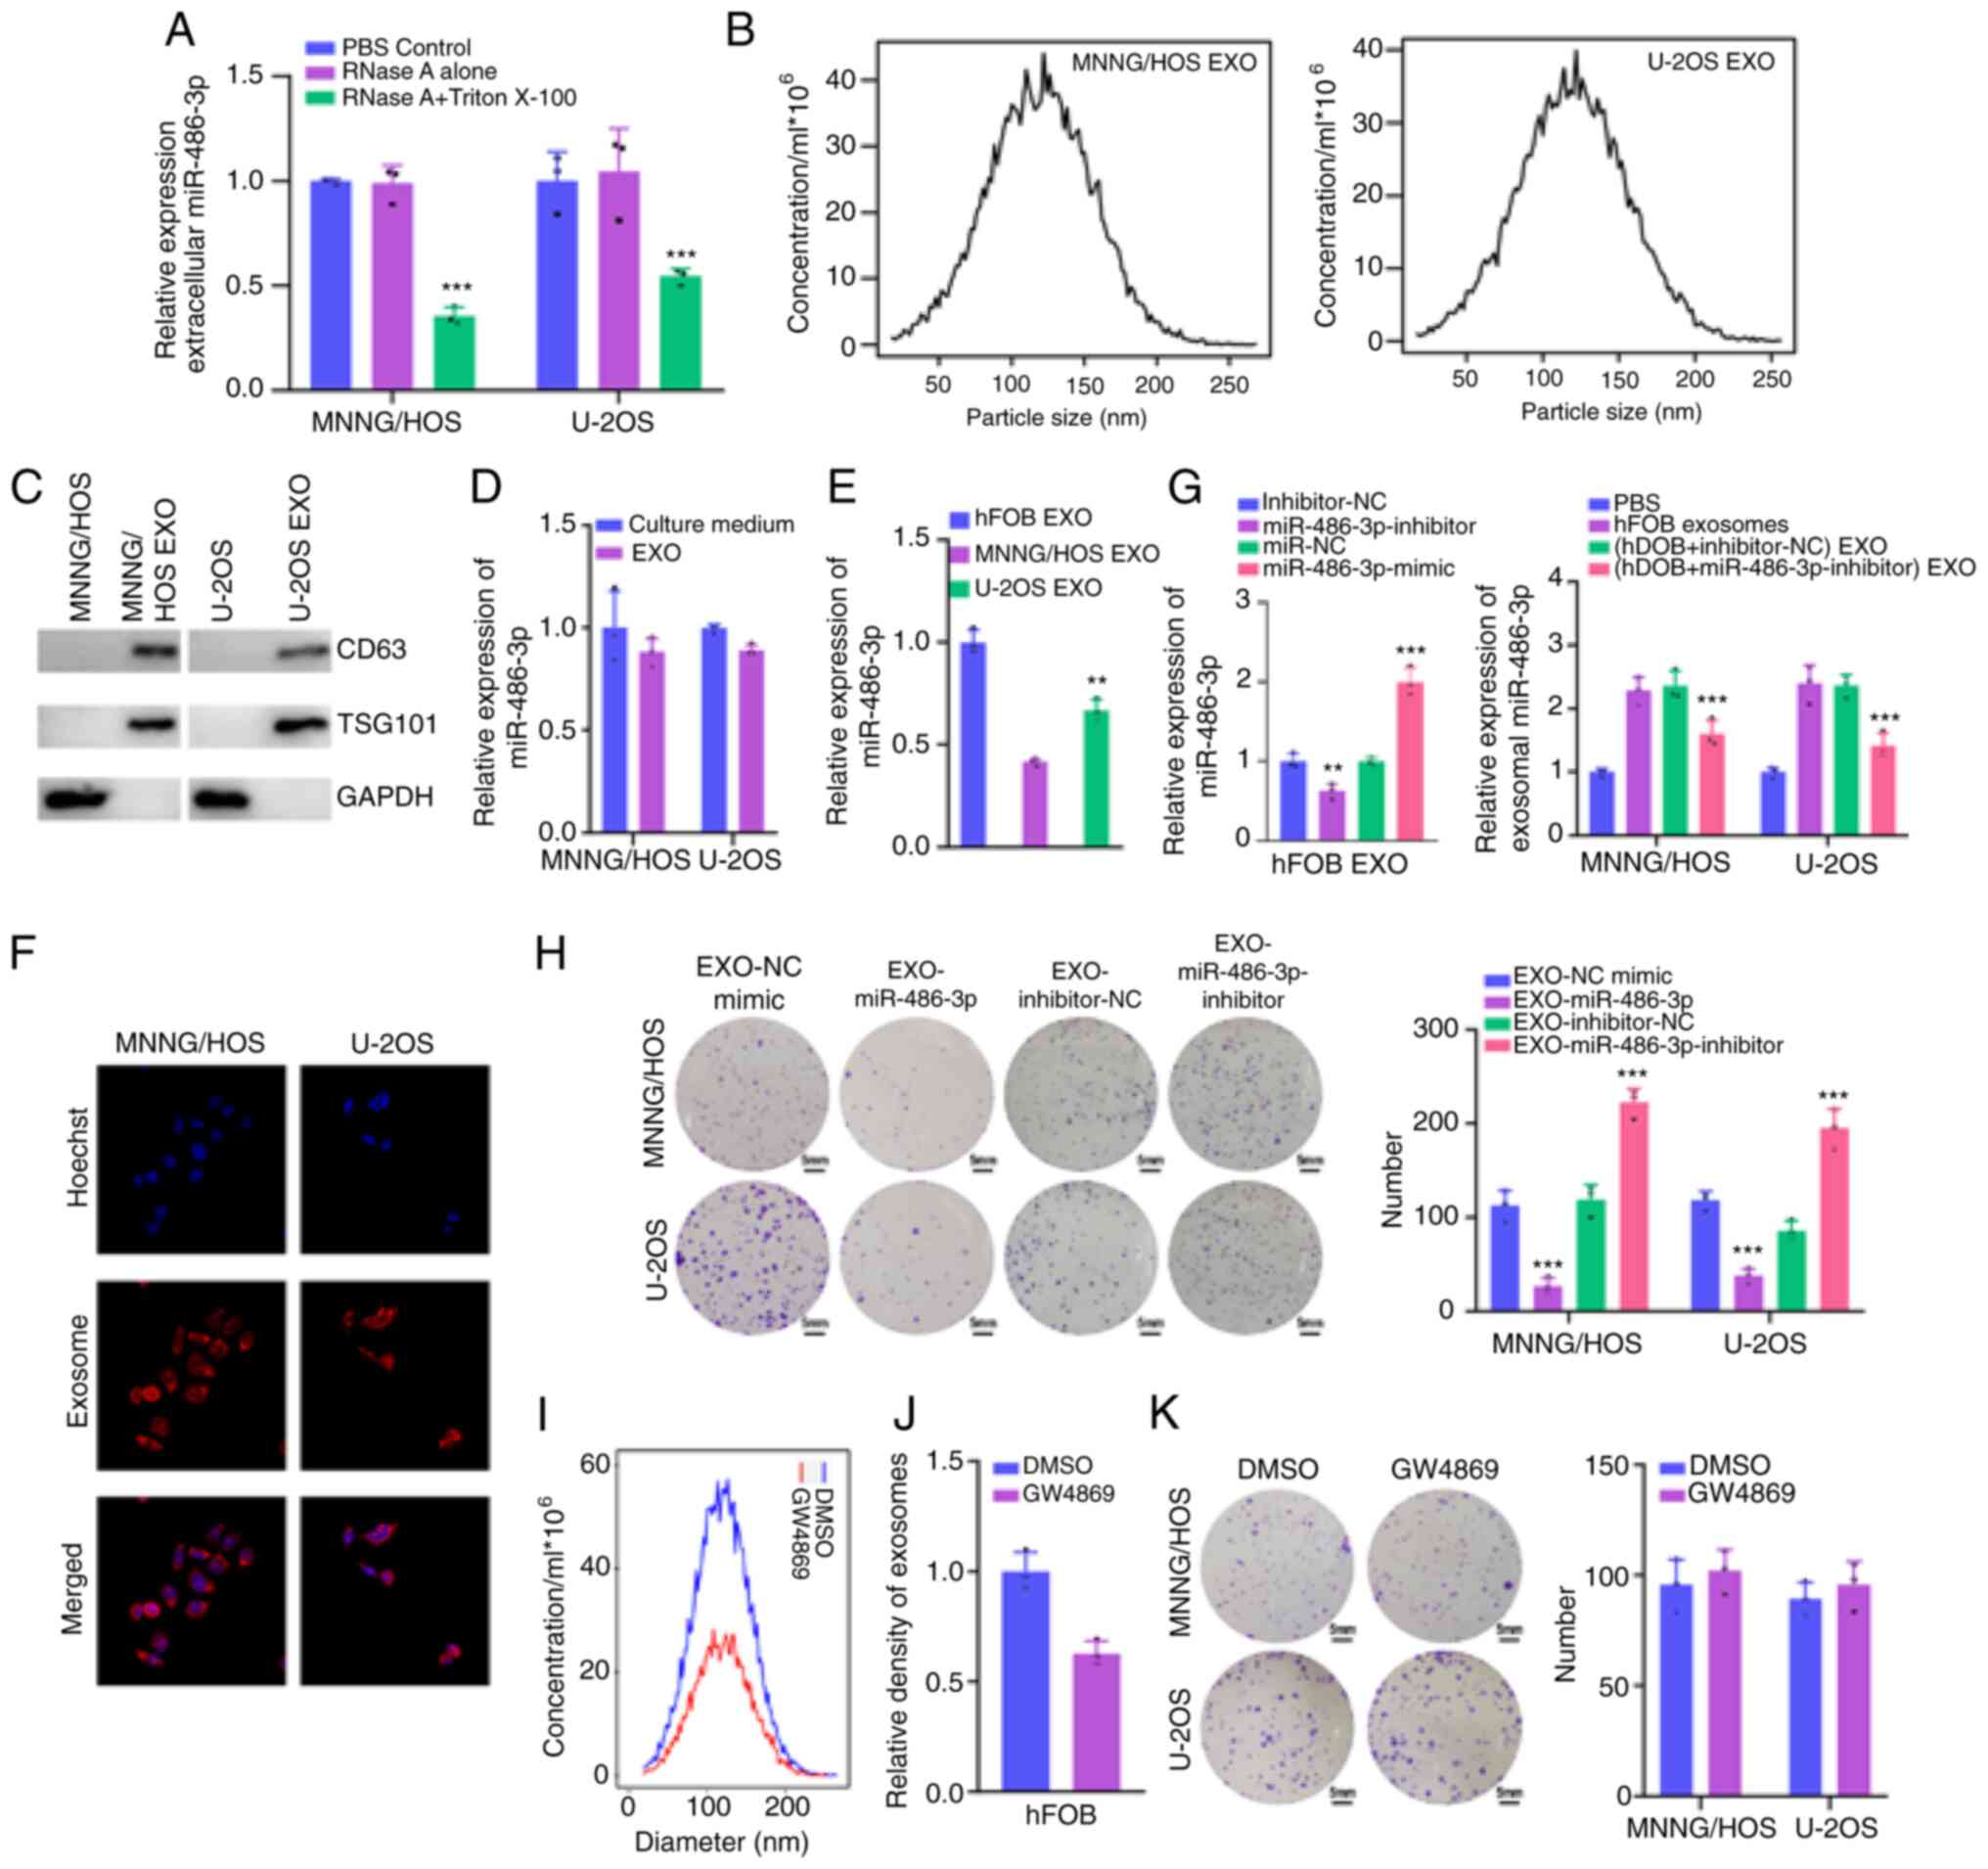
The presence mode of extracellular miR-486-3p was
examined to explore whether extracellular miR-486-3p regulates the
progression of OS by packing into exosomes. The level of miR-486-3p
in the culture medium was not disturbed following RNase A treatment
but was significantly reduced when Triton 100 and RNase A were
treated simultaneously (Fig. 7A),
demonstrating that miR-486-3p was wrapped with extracellular
vesicles instead of being secreted directly. Next, exosomes were
extracted from culture medium to verify this hypothesis.
Nanoparticle tracking analysis revealed that the size of exosomes
was 30–200 nm (Fig. 7B). In
addition, exosome markers TSG101 and CD63 confirmed the identity of
exosomes (Fig. 7C). In addition,
the expression levels of extracellular miR-486-3p were almost
equivalent to that of exosomal miR-486-3p (Fig. 7D), suggesting that extracellular
miR-486-3p was mainly carried by exosomes. As revealed in Fig. 7E, exosomal miR-486-3p levels had a
mostly high expression in culture medium from hFOB cells and low
expression in culture medium from MNNG/HOS and U2OS cells. Next, it
was further explored whether miR-486-3p-bearing exosomes were taken
up by the recipient cells. First, exosomes were isolated from hFOB
cells, labeled with PKH26 dye, and incubated with MNNG/HOS and U2OS
cells for 48 h. A strong red signal in the recipient cells
presented in Fig. 7F indicated
exosome intake by recipient cells. miR-486-3p expression in
exosomes derived from hFOB cells decreased significantly following
transfection with miR-486-3p inhibitors (Fig. 7G). Following co-culture with
exosomes derived from hFOB cells transfected with miR-486-3p mimics
and inhibitors, the cell viability of MNNG/HOS and U2OS cells was
significantly decreased and enhanced, respectively (Fig. 7H). Finally, it was explored whether
exosomal miR-486-3p played a deterministic role. Exosome production
was blocked using GW4869 (Fig. 7I and
J). Incubation with culture medium from hFOB cells treated with
GW4869 failed to influence the cell viability of MNNG/HOS and U2OS
cells (Fig. 7K). In conclusion, the
extracellular miR-486-3p inhibited OS cell viability through
exosomes.
Discussion
OS is the most common primary malignancy of the
bone, and its treatment remains far from satisfactory due to its
high propensity for recurrence, local invasion and early metastasis
(33). Emerging evidence has
underscored the roles of mRNA-miRNA-circRNA network in
tumorigenesis and tumor development (17,34).
In the present study, a circRNA named circKEAP1 was found to be
significantly increased in OS tissues. A function assay showed that
circKEAP1 could act as a sponge for miR-486-3p to relieve the
suppression of this miRNA for its target gene, MARCH1, in OS
cells.
miRNAs play a major role in the pathogenesis of OS
and various other types of cancer (35,36).
Theoretically, mRNAs can bind to miRNAs and play a functional role
in a ceRNA pattern (37). Recently,
circRNAs acting as ceRNAs, have been reported to play important
roles in miRNA sponges (38). In
the present study, it was first shown that miR-486-3p was
downregulated in OS tissues when compared with para-cancerous
normal tissues. Similarly, miR-486-3p exhibited a low expression in
OS cell lines, indicating the potential role of miR-486-3p in OS
progression. Subsequent results indicated that the overexpression
of miR-486-3p significantly suppressed cell proliferation, invasion
and migration. An opposite trend was observed in OS cells with
miR-486-3p knockdown. miR-486-3p can block the progression of OS
cells and play a regulatory role in cancer growth, migration and
invasion (39–41). However, the mechanisms explaining
how miR-486-3p acts as a regulator during carcinogenesis and cancer
progression have not been fully elucidated. In the present study,
the bioinformatics analysis was used to search for the downstream
target of miR-486-3p, and the MARCH1 gene was finally screened out.
Dual-luciferase reporter gene assay also confirmed the binding
relationship between miR-486-3p and MARCH1.
MARCH1, as a member of the membrane-anchored E3
ubiquitin ligases (42), has been
reported to be overexpressed in ovarian cancer, hepatocellular
carcinoma and colorectal cancer, and its downregulation has been
reported to contribute to cancer treatment (43–45).
In addition, circRNA-6 has been shown to suppress bladder cancer
growth by sponging miR-653 to regulate MARCH1 levels (46). In the present study, it was found
that MARCH1 was highly expressed in OS cells. MARCH1 overexpression
promoted the proliferation, invasion and migration of OS cells.
More importantly, MARCH1 overexpression could reverse the tumor
inhibition effect mediated by overexpression of miR-486-3p, further
demonstrating that MARCH1 was an important target gene for
circKEAP1 and miR-486-3p.
It was confirmed that miRNAs could participate in
the occurrence and progression of tumors through the secretion of
exosomes (47). It was also
determined whether extracellular miR-486-3p exerts its roles
through incorporating into exosomes. miR-486-3p could be packed
into exosomes and, consistent with its intracellular expression,
the exosomal miR-486-3p expression of hFOB cells was higher than
that in other OS cell lines. Therefore, exosomes were extracted
from derived hFOB cells to conduct co-culture experiments for
increased exosomal miR-486-3p expression levels. The proliferation
ability of OS cells was suppressed following their treatment with
exosomes originating from hFOB cells. These results demonstrated
that miR-486-3p could be transmitted between cells through exosomes
to inhibit OS cell proliferation.
In conclusion, these data indicated that miR-486-3p
was downregulated in OS tissues and cells and acted as a tumor
suppressor to impede the malignant behaviors of OS cells.
Furthermore, circKEAP1 was highly expressed in OS tissue and cells.
Mechanistically, circKEAP1 effectively sponged miR-486-3p, and
subsequently increased MARCH1 expression to enhance the malignant
behaviors of OS cells. Therefore, the circKEAP1/miR-486-3p/MARCH1
pathway may be critical for regulating the development and
progression of OS and may serve as a therapeutic target for OS.
Supplementary Material
Supporting Data
Acknowledgements
Not applicable.
Funding
Funding: No funding was received.
Availability of data and materials
The datasets used and/or analyzed during the current
study are available from the corresponding author on reasonable
request.
Authors' contributions
YF and JJ were the administrators of the present
study. HY and CH performed data curation and wrote the manuscript.
CH, YF and JJ designed the experiments and analyzed data. HY, CH
and YF conducted investigation. CH, YF and JJ confirm the
authenticity of all the raw data. HY and JJ reviewed and edited the
manuscript. All authors have read and approved the final version of
the manuscript.
Ethics approval and consent to
participate
Not applicable.
Patient consent for publication
Not applicable.
Competing interests
The authors declare that they have no competing
interests.
References
|
1
|
Kansara M, Teng MW, Smyth MJ and Thomas
DM: Translational biology of osteosarcoma. Nat Rev Cancer.
14:722–735. 2014. View
Article : Google Scholar : PubMed/NCBI
|
|
2
|
Lussier DM, O'Neill L, Nieves LM, McAfee
MS, Holechek SA, Collins AW, Dickman P, Jacobsen J, Hingorani P and
Blattman JN: Enhanced T-cell immunity to osteosarcoma through
antibody blockade of PD-1/PD-L1 interactions. J Immunother.
38:96–106. 2015. View Article : Google Scholar : PubMed/NCBI
|
|
3
|
Zheng S, Jiang F, Ge D, Tang J, Chen H,
Yang J, Yao Y, Yan J, Qiu J, Yin Z, et al: LncRNA
SNHG3/miRNA-151a-3p/RAB22A axis regulates invasion and migration of
osteosarcoma. Biomed Pharmacother. 112:1086952019. View Article : Google Scholar : PubMed/NCBI
|
|
4
|
Awasthi R, Rathbone MJ, Hansbro PM, Bebawy
M and Dua K: Therapeutic prospects of microRNAs in cancer treatment
through nanotechnology. Drug Deliv Transl Res. 8:97–110. 2018.
View Article : Google Scholar : PubMed/NCBI
|
|
5
|
Lu TX and Rothenberg ME: MicroRNA. J
Allergy Clin Immunol. 141:1202–1207. 2018. View Article : Google Scholar : PubMed/NCBI
|
|
6
|
Petri BJ and Klinge CM: Regulation of
breast cancer metastasis signaling by miRNAs. Cancer Metastasis
Rev. 39:837–886. 2020. View Article : Google Scholar : PubMed/NCBI
|
|
7
|
Yang N, Ekanem NR, Sakyi CA and Ray SD:
Hepatocellular carcinoma and microRNA: New perspectives on
therapeutics and diagnostics. Adv Drug Deliv Rev. 81:62–74. 2015.
View Article : Google Scholar : PubMed/NCBI
|
|
8
|
Konoshenko MY, Bryzgunova OE and Laktionov
PP: miRNAs and radiotherapy response in prostate cancer. Andrology.
9:529–545. 2021. View Article : Google Scholar : PubMed/NCBI
|
|
9
|
Yang Y, Huang Y, Lin W, Liu J, Chen X,
Chen C, Yu X and Teng L: Host miRNAs-microbiota interactions in
gastric cancer. J Transl Med. 20:522022. View Article : Google Scholar : PubMed/NCBI
|
|
10
|
Hermansen SK and Kristensen BW: MicroRNA
biomarkers in glioblastoma. J Neurooncol. 114:13–23. 2013.
View Article : Google Scholar : PubMed/NCBI
|
|
11
|
Ali Syeda Z, Langden SSS, Munkhzul C, Lee
M and Song SJ: Regulatory mechanism of microRNA expression in
cancer. Int J Mol Sci. 21:17232020. View Article : Google Scholar : PubMed/NCBI
|
|
12
|
Fridrichova I and Zmetakova I: MicroRNAs
contribute to breast cancer invasiveness. Cells. 8:13612019.
View Article : Google Scholar : PubMed/NCBI
|
|
13
|
He B, Zhao Z, Cai Q, Zhang Y, Zhang P, Shi
S, Xie H, Peng X, Yin W, Tao Y and Wang X: miRNA-based biomarkers,
therapies, and resistance in cancer. Int J Biol Sci. 16:2628–2647.
2020. View Article : Google Scholar : PubMed/NCBI
|
|
14
|
Xin X, Kumar V, Lin F, Kumar V, Bhattarai
R, Bhatt VR, Tan C and Mahato RI: Redox-responsive nanoplatform for
codelivery of miR-519c and gemcitabine for pancreatic cancer
therapy. Sci Adv. 6:eabd67642020. View Article : Google Scholar : PubMed/NCBI
|
|
15
|
Ren D, Yang Q, Dai Y, Guo W, Du H, Song L
and Peng X: Oncogenic miR-210-3p promotes prostate cancer cell EMT
and bone metastasis via NF-κB signaling pathway. Mol Cancer.
16:1172017. View Article : Google Scholar : PubMed/NCBI
|
|
16
|
Tang L, Chen HY, Hao NB, Tang B, Guo H,
Yong X, Dong H and Yang SM: microRNA inhibitors: Natural and
artificial sequestration of microRNA. Cancer Lett. 407:139–147.
2017. View Article : Google Scholar : PubMed/NCBI
|
|
17
|
Qi X, Zhang DH, Wu N, Xiao JH, Wang X and
Ma W: ceRNA in cancer: Possible functions and clinical
implications. J Med Genet. 52:710–718. 2015. View Article : Google Scholar : PubMed/NCBI
|
|
18
|
Huang G, Liang M, Liu H, Huang J, Li P,
Wang C, Zhang Y, Lin Y and Jiang X: CircRNA hsa_circRNA_104348
promotes hepatocellular carcinoma progression through modulating
miR-187-3p/RTKN2 axis and activating Wnt/β-catenin pathway. Cell
Death Dis. 11:10652020. View Article : Google Scholar : PubMed/NCBI
|
|
19
|
Zhao M, Feng J and Tang L: Competing
endogenous RNAs in lung cancer. Cancer Biol Med. 18:1–20. 2021.
View Article : Google Scholar : PubMed/NCBI
|
|
20
|
Ye J, Li J and Zhao P: Roles of ncRNAs as
ceRNAs in gastric cancer. Genes (Basel). 12:10362021. View Article : Google Scholar : PubMed/NCBI
|
|
21
|
He Y, Zhou H, Wang W, Xu H and Cheng H:
Construction of a circRNA-miRNA-mRNA regulatory network reveals
potential mechanism and treatment options for osteosarcoma. Front
Genet. 12:6323592021. View Article : Google Scholar : PubMed/NCBI
|
|
22
|
Hill KE, Kelly AD, Kuijjer ML, Barry W,
Rattani A, Garbutt CC, Kissick H, Janeway K, Perez-Atayde A,
Goldsmith J, et al: An imprinted non-coding genomic cluster at
14q32 defines clinically relevant molecular subtypes in
osteosarcoma across multiple independent datasets. J Hematol Oncol.
10:1072017. View Article : Google Scholar : PubMed/NCBI
|
|
23
|
Pan Y, Lu L, Chen J, Zhong Y and Dai Z:
Identification of potential crucial genes and construction of
microRNA-mRNA negative regulatory networks in osteosarcoma.
Hereditas. 155:212018. View Article : Google Scholar : PubMed/NCBI
|
|
24
|
Wang J, Wu Z, Zheng M, Yu S, Zhang X and
Xu X: CD146 is closely associated with the prognosis and molecular
features of osteosarcoma: Guidance for personalized clinical
treatment. Front Genet. 13:10253062022. View Article : Google Scholar : PubMed/NCBI
|
|
25
|
Han D, Wang M, Yu Z, Yin L, Liu C, Wang J,
Liu Y, Jiang S, Ren Z and Yin J: FGF5 promotes osteosarcoma cells
proliferation via activating MAPK signaling pathway. Cancer Manag
Res. 11:6457–6466. 2019. View Article : Google Scholar : PubMed/NCBI
|
|
26
|
Diboun I, Wernisch L, Orengo CA and
Koltzenburg M: Microarray analysis after RNA amplification can
detect pronounced differences in gene expression using limma. BMC
Genomics. 7:2522006. View Article : Google Scholar : PubMed/NCBI
|
|
27
|
Varet H, Brillet-Guéguen L, Coppee JY and
Dillies MA: SARTools: A DESeq2- and EdgeR-Based R pipeline for
comprehensive differential analysis of RNA-Seq data. PLoS One.
11:e01570222016. View Article : Google Scholar : PubMed/NCBI
|
|
28
|
Livak KJ and Schmittgen TD: Analysis of
relative gene expression data using real-time quantitative PCR and
the 2(−Delta Delta C(T)) method. Methods. 25:402–408. 2001.
View Article : Google Scholar : PubMed/NCBI
|
|
29
|
John B, Enright AJ, Aravin A, Tuschl T,
Sander C and Marks DS: Human MicroRNA targets. PLoS Biol.
2:e3632004. View Article : Google Scholar : PubMed/NCBI
|
|
30
|
Agarwal V, Bell GW, Nam JW and Bartel DP:
Predicting effective microRNA target sites in mammalian mRNAs.
Elife. 4:e050052015. View Article : Google Scholar : PubMed/NCBI
|
|
31
|
Wong N and Wang X: miRDB: An online
resource for microRNA target prediction and functional annotations.
Nucleic Acids Res. 43:D146–D152. 2015. View Article : Google Scholar : PubMed/NCBI
|
|
32
|
Betel D, Wilson M, Gabow A, Marks DS and
Sander C: The microRNA.org resource: Targets and expression.
Nucleic Acids Res. 36:D149–D153. 2008. View Article : Google Scholar : PubMed/NCBI
|
|
33
|
Chen C, Xie L, Ren T, Huang Y, Xu J and
Guo W: Immunotherapy for osteosarcoma: Fundamental mechanism,
rationale, and recent breakthroughs. Cancer Lett. 500:1–10. 2021.
View Article : Google Scholar : PubMed/NCBI
|
|
34
|
Li X, Ding J, Wang X, Cheng Z and Zhu Q:
NUDT21 regulates circRNA cyclization and ceRNA crosstalk in
hepatocellular carcinoma. Oncogene. 39:891–904. 2020. View Article : Google Scholar : PubMed/NCBI
|
|
35
|
Xu N, Yang W, Liu Y, Yan F and Yu Z:
MicroRNA-411 promoted the osteosarcoma progression by suppressing
MTSS1 expression. Environ Sci Pollut Res Int. 25:12064–12071. 2018.
View Article : Google Scholar : PubMed/NCBI
|
|
36
|
Lee YS and Dutta A: MicroRNAs in cancer.
Annu Rev Pathol. 4:199–227. 2009. View Article : Google Scholar : PubMed/NCBI
|
|
37
|
Chan JJ and Tay Y: Noncoding RNA: RNA
regulatory networks in cancer. Int J Mol Sci. 19:13102018.
View Article : Google Scholar : PubMed/NCBI
|
|
38
|
Misir S, Hepokur C, Aliyazicioglu Y and
Enguita FJ: Circular RNAs serve as miRNA sponges in breast cancer.
Breast Cancer. 27:1048–1057. 2020. View Article : Google Scholar : PubMed/NCBI
|
|
39
|
He M, Wang G, Jiang L, Qiu C, Li B, Wang J
and Fu Y: miR-486 suppresses the development of osteosarcoma by
regulating PKC-δ pathway. Int J Oncol. 50:1590–1600. 2017.
View Article : Google Scholar : PubMed/NCBI
|
|
40
|
Liu Y, Zhang J, Xing C, Wei S, Guo N and
Wang Y: miR-486 inhibited osteosarcoma cells invasion and
epithelial-mesenchymal transition by targeting PIM1. Cancer
Biomark. 23:269–277. 2018. View Article : Google Scholar : PubMed/NCBI
|
|
41
|
Namløs HM, Skårn M, Ahmed D, Grad I,
Andresen K, Kresse SH, Munthe E, Serra M, Scotlandi K,
Llombart-Bosch A, et al: miR-486-5p expression is regulated by DNA
methylation in osteosarcoma. BMC Genomics. 23:1422022. View Article : Google Scholar : PubMed/NCBI
|
|
42
|
Wu J, Xia L, Yao X, Yu X, Tumas KC, Sun W,
Cheng Y, He X, Peng YC, Singh BK, et al: The E3 ubiquitin ligase
MARCH1 regulates antimalaria immunity through interferon signaling
and T cell activation. Proc Natl Acad Sci USA. 117:16567–16578.
2020. View Article : Google Scholar : PubMed/NCBI
|
|
43
|
Meng Y, Hu J, Chen Y, Yu T and Hu L:
Silencing MARCH1 suppresses proliferation, migration and invasion
of ovarian cancer SKOV3 cells via downregulation of NF-κB and
Wnt/β-catenin pathways. Oncol Rep. 36:2463–2470. 2016. View Article : Google Scholar : PubMed/NCBI
|
|
44
|
Yang W, Su J, Li M, Li T, Wang X, Zhao M
and Hu X: Myricetin induces autophagy and cell cycle arrest of HCC
by inhibiting MARCH1-regulated Stat3 and p38 MAPK signaling
pathways. Front Pharmacol. 12:7095262021. View Article : Google Scholar : PubMed/NCBI
|
|
45
|
Wang N, Yang L, Dai J, Wu Y, Zhang R, Jia
X and Liu C: 5-FU inhibits migration and invasion of CRC cells
through PI3K/AKT pathway regulated by MARCH1. Cell Biol Int.
45:368–381. 2021. View Article : Google Scholar : PubMed/NCBI
|
|
46
|
Su Y, Feng W, Zhong G, Ya Y, Du Z, Shi J,
Chen L, Dong W and Lin T: ciRs-6 upregulates March1 to suppress
bladder cancer growth by sponging miR-653. Aging (Albany NY).
11:11202–11223. 2019. View Article : Google Scholar : PubMed/NCBI
|
|
47
|
Boelens MC, Wu TJ, Nabet BY, Xu B, Qiu Y,
Yoon T, Azzam DJ, Twyman-Saint Victor C, Wiemann BZ, Ishwaran H, et
al: Exosome transfer from stromal to breast cancer cells regulates
therapy resistance pathways. Cell. 159:499–513. 2014. View Article : Google Scholar : PubMed/NCBI
|