Introduction
The incidence and mortality rates of lung cancer
surpass those of all other malignant tumors, accounting for ~20% of
cancer-related deaths worldwide (1). Early diagnosis and treatment are
pivotal in improving the prognosis and survival rates of lung
cancer patients. In the 2021 WHO classification (2), adenocarcinoma in situ (AIS) has
been reclassified as a glandular precursor lesion (GPL) along with
adenomatous hyperplasia (AAH), while the subcategories of lung
cancer now include minimally invasive adenocarcinoma (MIA) and
invasive adenocarcinoma (IAC). This classification update
necessitates corresponding adjustments to clinical diagnosis and
treatment protocols. Currently, management follow-up strategies
predominantly apply to AAH and AIS, whereas MIA warrants prompt
surgical intervention (3,4). Furthermore, although some studies have
indicated comparable long-term efficacy and 5-year survival rates
between AAH, AIS and MIA surgeries, others have found that MIA
exhibits higher Ki67 levels and EGFR mutation rates compared with
AIS (5). Therefore, achieving
precise discrimination of MIA from GPL during management follow-up
and pre-surgical stages provides important insights for determining
optimal clinical intervention timing, implementing surgical
protocols and assessing prognosis.
Previous studies have demonstrated that
high-resolution low-dose computed tomography (CT) is currently the
most effective screening tool, reducing lung cancer mortality by
20% (6). Over 90% of these cases
represent early-stage lung cancer, with pulmonary ground glass
nodules (GGNs) being the primary manifestation on CT scans. While
pathological biopsy serves as the gold standard for diagnosing lung
cancer types, frozen section analysis has emerged as a valuable
method for rapid intraoperative assessment of nodules,
distinguishing between benign and malignant lesions and determining
histological subtypes. This information plays a crucial role in
guiding surgical strategies for lung nodules (7,8).
However, due to the small size and low density of lung nodules,
sampling often yields suboptimal results, resulting in a
concordance rate of only ~68% between intraoperative frozen section
analysis and postoperative paraffin pathology (8). Some researchers have explored the use
of traditional CT imaging features (such as nodule size, density
and solid component proportion) to differentiate between MIA and
GPL (9,10). However, these features exhibit
significant overlap across different nodule subtypes, leading to
low diagnostic efficacy (11).
Moreover, the extraction of these features heavily relies on the
subjective interpretation skills and clinical experience of the
radiologist (8). In addition,
traditional techniques often struggle to identify nodules with
smaller volumes and mixed densities. The increasing prevalence of
GGNs with diameters <10 mm, detected through low-dose CT
screening for early lung cancer, presents new challenges in
clinical diagnosis. Some studies have proposed a critical value of
10 mm diameter for distinguishing between glandular precursor
lesions and invasive lesions (9,10,12).
Nevertheless, clinical practice has revealed numerous GGNs ≤10mm
confirmed as MIA or IAC (10),
leading to continuing debates about the management strategies for
GGNs of this size (13).
Consequently, there is an urgent need for innovative and accurate
techniques to enable the precise preoperative diagnosis of MIA and
GPL.
Radiomics is a powerful technique that enables the
extraction and analysis of numerous radiomics features from medical
imaging data with high efficiency. This approach holds significant
promise in distinguishing between different pathological
subcategories of lung nodules, assessing the extent of infiltration
and evaluating prognostic outcomes (14). Texture analysis, on the other hand,
involves the extraction and quantitative analysis of
non-macroscopic and deep-level CT image features that reflect the
tumor's heterogeneity to some extent. It has demonstrated utility
in various aspects, including tumor differential diagnosis,
prognostic evaluation, treatment response prediction and monitoring
(15–17). CT texture analysis is widely
utilized for identifying benign and malignant solitary lung nodules
and evaluating invasiveness, exhibiting exceptional performance
(18,19). To date, there have been no reports
on the application of texture analysis for the identification of
MIA and GPL in sub-centimeter GGNs. Therefore, the present study
aimed to develop and validate a nomogram based on CT quantitative
parameters and texture features for improving the ability to
discriminate MIA from AAH/AIS, thereby providing important guidance
for formulating clinical treatment plans and optimizing the timing
of surgical interventions.
Materials and methods
Patient and nodule selection
The present retrospective study received approval
from the ethics committee and written informed consent was waived.
Patients with sub-centimeter GGNs who underwent high-resolution CT
(HRCT) were enrolled at the First People's Hospital of Foshan
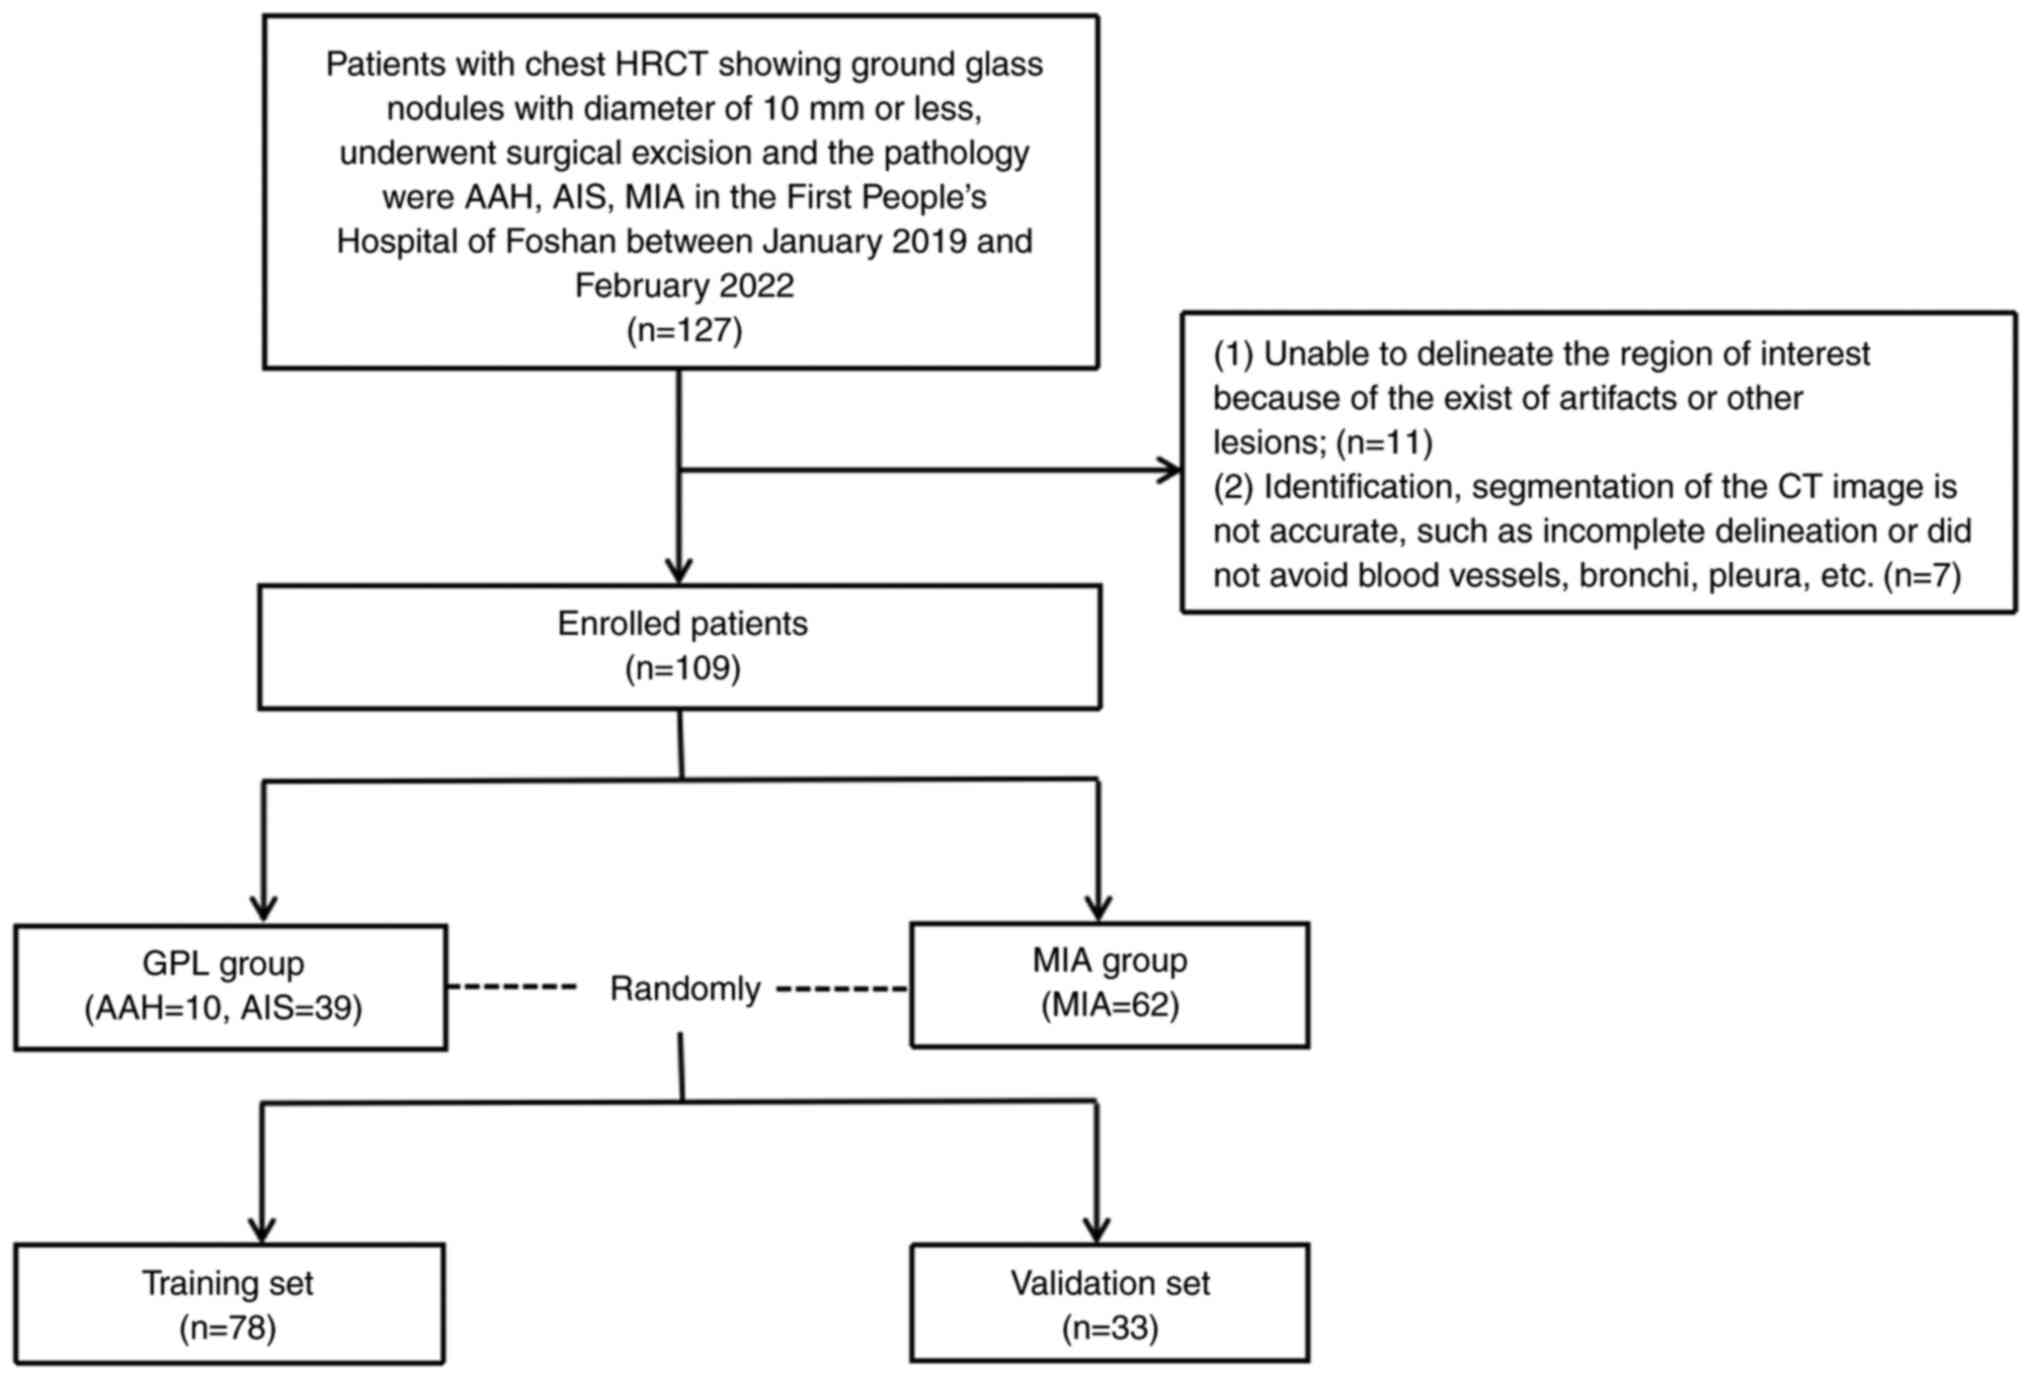
between January 2019 and February 2022. The flowchart illustrating
patient inclusion and exclusion is shown in Fig. 1, which was in accordance with
previous studies (17,19,20).
The inclusion criteria were as follows: i) GGNs with a maximum
diameter ≤10 mm, evaluated using lung window settings [level: −600
Hounsfield units (HU); width: 1,500 HU]; ii) confirmation of AAH,
AIS or MIA through surgical excision and pathology examination
referring to the 2021 WHO classification (2); iii) availability of chest HRCT
examination conducted within one month prior to surgical treatment;
iv) absence of prior history of puncture, chemotherapy, or
radiotherapy; v) absence of lung cancer or other malignant tumors.
The exclusion criteria consisted of: i) inability to accurately
delineate the region of interest due to the presence of artifacts
or other lesions; ii) inaccurate identification or segmentation of
CT images, including incomplete delineation or failure to avoid
blood vessels, bronchi, pleura and other structures. The final
selected cases were divided into two groups: 49 cases with AAH/AIS
and 62 cases with MIA. The recruited patients were randomly
assigned to a training set (78 nodules) and a validation set (33
nodules) at a ratio of 7:3.
CT image acquisition
The CT examinations for all patients included in the
study were conducted using Philips CT scanners: the Philips
Ingenuity 64-slice CT scanner (Philips Medical Systems, Inc.) and
the Philips Brilliance iCT 256-slice CT scanner (Philips
Ultrasound, Inc.). The patients were positioned in the supine
(lying face-up) posture and the scanning range extended from the
apex to the base of the lungs. Scans were performed at the end of a
deep inspiration, followed by breath-holding to ensure stability. A
tube voltage of 120 kV was used and the tube current employed
automatic milliamp-second technology. The pitch value was set to
1.0, the collimation was 0.625×1.25 mm and the field of view (FOV)
was set to 350×350 mm, with a pixel size of 512×512. The acquired
images were reconstructed using both the standard algorithm and the
high-resolution algorithm. The reconstructed slices had a thickness
of 1 mm and a spacing of 1 mm.
CT image segmentation and feature
extraction
The CT images in DICOM format were imported into the
uAI-ChestCare software (version 0130; Shanghai United Imaging
Healthcare Co., Ltd.), which was used for image segmentation and
extraction of texture features (20,21).
This software facilitated the automatic delineation of the complete
3D region of interest (ROI) for the identified lesions by outlining
the tumor boundary on consecutive axial lung window images (with a
window width of 1,500 HU and a window level of −600 HU).
Subsequently, various quantitative and texture features were
computed, encompassing maximum diameter (MD), solid volume (SV),
solid volume rate (SVR), solid quality (SQ), solid quality rate
(SQR), maximum computed tomography attenuation (CTmax),
minimum computed tomography attenuation (CTmin), mean
computed tomography attenuation (CTmean), median
computed tomography attenuation (CTmedian), variance,
kurtosis, skewness and entropy. To evaluate the accuracy of the
software's automated nodule delineation, two radiologists with over
10 years of experience in thoracic imaging diagnosis independently
assessed the results. They excluded cases where the nodule contour
was incomplete or where blood vessels, bronchi, pleura and similar
structures were not properly avoided. In instances where
disagreements arose regarding the exclusion of certain cases, they
negotiated to precisely delineate nodule boundaries while avoiding
the inclusion of bronchi, large vessels, vacuole and normal tissue
beyond the pleura in accordance with previous studies (22,23). A
senior physician with 15 years of experience in thoracic imaging
diagnosis verified the preceding two radiologists' segmentation
results and provided the final confirmation of the results
(19). The CT quantitative and
texture features extraction of AIS (Fig. 2A) and MIA (Fig. 2B) were taken as examples.
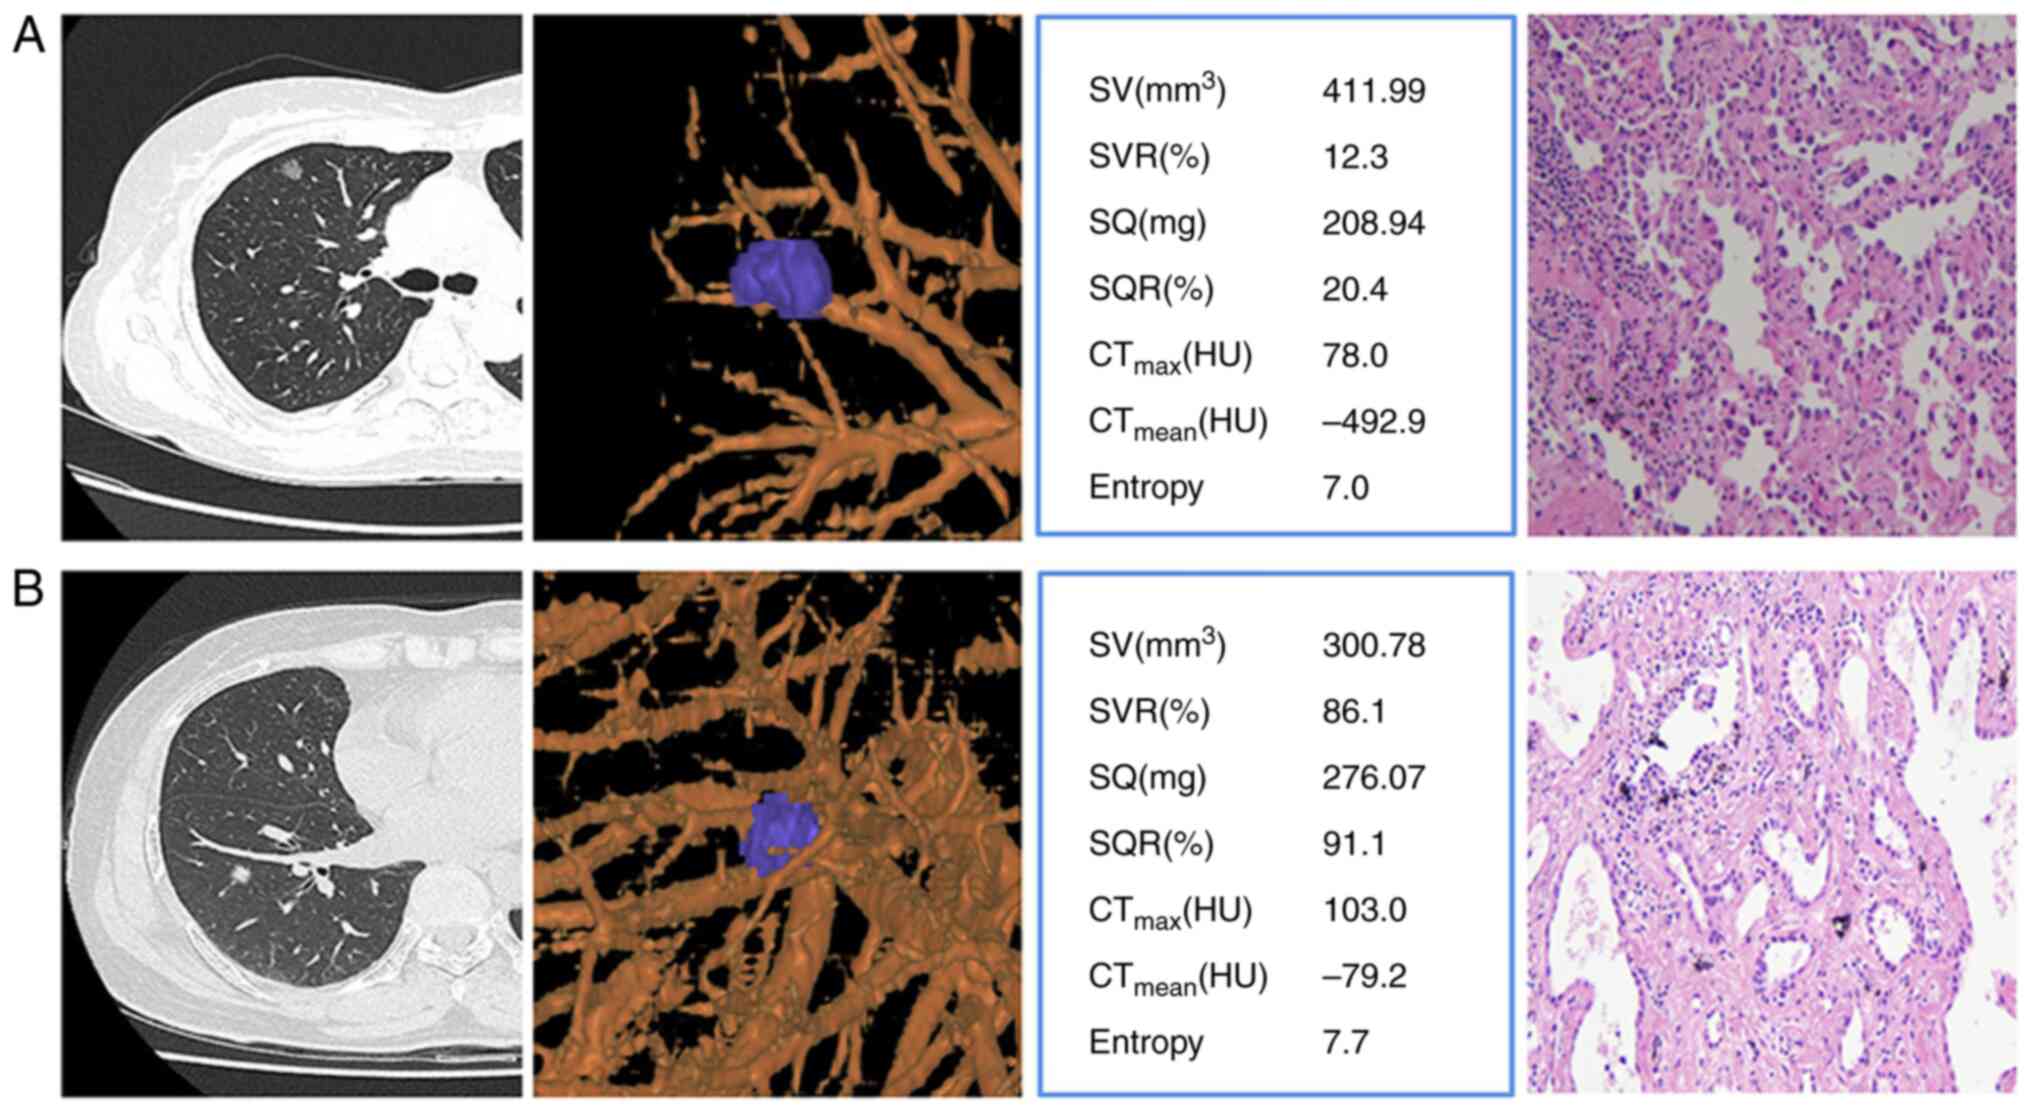 | Figure 2.CT images were used for accurate
nodule delineation and quantitative texture feature extraction,
complemented by corresponding hematoxylin-eosin stained
pathological images at ×40 magnification. (A) In the first case, a
69-year-old female had a 10×8 mm GGN in the upper lobe of the right
lung with limited solid features. (B) In the second case, a
63-year-old female had a 9×7 mm GGN in the lower lobe of the right
lung, mainly solid. CT, computed tomography; GGN, ground glass
nodules; SV, solid volume; SVR, solid volume rate; SQ, solid
quality; SQR, solid quality rate; CTmax, maximum
computed tomography attenuation; CTmean, mean computed
tomography attenuation; HU, Hounsfield units. |
Nomogram model building
The clinical, CT quantitative and texture features
of both the training and validation groups were subjected to
analysis using the Mann-Whitney U test to identify the effective
distinguishing features. Subsequently, binary logistic regression
analysis was employed to develop both a single-parameter model and
a combined multi-parameter nomogram model. The diagnostic
performance of these prediction models was assessed through the
construction of receiver operating characteristic (ROC) curves
(24) and the comparison of area
under the curve (AUC) of ROC curves was performed using DeLong's
test (25). Furthermore, the
construction of the nomogram was accomplished using the rms package
in the R software (version 4.0, R Foundation; http://www.Rproject.org). To evaluate the diagnostic
performance of the nomogram prediction model, a calibration curve
was employed.
Statistical analysis
The statistical analysis was conducted using SPSS
version 20 software (IBM Corp.). Continuous variables were
summarized as mean ± standard deviation (SD) or median with the
full range. Categorical variables were presented as frequencies and
percentages. Differences in age and sex between the two groups were
assessed using the independent sample t-test and the χ2
test, respectively. To identify significant variables as predictive
indicators of MIA the Mann-Whitney U test was applied based on the
CT quantitative and texture features. Variables with a significance
level of P<0.05 were selected as significant predictors for
constructing both single-parameter and combined multi-parameter
prediction models through binary logistic regression analysis. The
diagnostic performance of each model was then evaluated by
comparing the AUC, specificity and sensitivity of the ROC curve.
AUC values greater than 0.5 were considered predictive. The
significance of differences between ROC curves was determined using
DeLong's test. Furthermore, the nomogram was constructed using the
rms package in the R software. To verify the diagnostic performance
of the nomogram prediction model, a calibration curve was employed.
P<0.05 was considered to indicate a statistically significant
difference.
Results
Patient characteristics
A total of 109 patients with 111 GGNs were
ultimately included in the present study. The cohort consisted of
35 males and 74 females, with ages ranging 19–78 years. Among these
patients, 49 GGNs in 47 patients were classified as GPL (AAH/AIS),
with a mean age of (54.26±12.24) years. Additionally, 62 GGNs in 62
patients were categorized as MIA, with a mean age of (52.84±11.47)
years. There were no significant differences observed in terms of
sex (P=0.564) or age (P=0.522) between the two groups. Utilizing
stratified random sampling, the training set consisted of 78 cases
(34 AAH/AIS and 44 MIA), while the validation set included 33 cases
(15 AAH/AIS and 18 MIA).
CT quantitative parameters and texture
feature extraction
The results of patient characteristics, CT
quantitative parameters and texture features were conducted using
the Mann-Whitney U test and the results are presented in Table I. Notably, significant statistical
differences (P<0.05) were observed between the two groups in
seven parameters, including SV, SVR, SQ, SQR, CTmax,
CTmean and entropy.
 | Table I.Clinical characteristics, CT
quantitative parameters and texture features between GPL and MIA
groups. |
Table I.
Clinical characteristics, CT
quantitative parameters and texture features between GPL and MIA
groups.
| Clinical
characteristic | AAH/AIS (n=49) | MIA (n=62) | P-value |
|---|
| Age, years, mean
(SD) | 54.26 (12.24) | 52.84 (11.47) | 0.646a |
| Sex |
|
| 0.521b |
| Female,
n (%) | 33 (70.2) | 41 (66.1) |
|
| Male, n
(%) | 14 (29.8) | 21 (33.9) |
|
| MD, mm, median
(range)c | 7.60
(5.02–10.00)c | 8.20
(4.24–9.87) | 0.080 |
| SV, mm3,
median (range)c | 59.00
(11.00–128.00) | 87.00
(0.00–156.00) |
<0.001d |
| SVR, %, median
(range)c | 38.00
(8.00–66.00) | 45.00
(0.00–68.00) | 0.021d |
| SQ, mg, median
(range)c | 49.00
(7.00–110.00) | 72.00
(0.00–128.00) | 0.001d |
| SQR, %, median
(range)c | 29.00
(6.00–66.00) | 47.00
(0.00–66.00) | 0.001d |
| CTmax,
HU, median (range)c | −151.50
(−270.00–102.00) | −111.00
(−282.00–62.00) | 0.034d |
| CTmin,
HU, median (range)c | −784.50
(−915.00–558.00) | −788.0
(−1007.00–582.00) | 0.935 |
| CTmean,
HU, median (range)c | −584.50
(−709.00–348.00) | −530.00
(−737.00–399.00) | 0.002d |
|
CTmedian, HU, median
(range)c | −588.50
(−710.00–368.00) | −546.00
(−730.00–419.00) | 0.091 |
| Variance, median
(range)c | 137.00
(92.00–187.00) | 139.00
(84.00–194.00) | 0.429 |
| Kurtosis, median
(range)c | 3.50
(2.00–4.80) | 3.30
(1.90–4.90) | 0.797 |
| Skewness, median
(range)c | 0.39
(−0.19–0.86) | 0.48
(−0.40–0.78) | 0.327 |
| Entropy, median
(range)c | 5.50
(3.60–7.30) | 6.30 (3.20,
8.00) |
<0.001d |
Model construction and diagnostic
validation based on CT quantitative parameters and texture
features
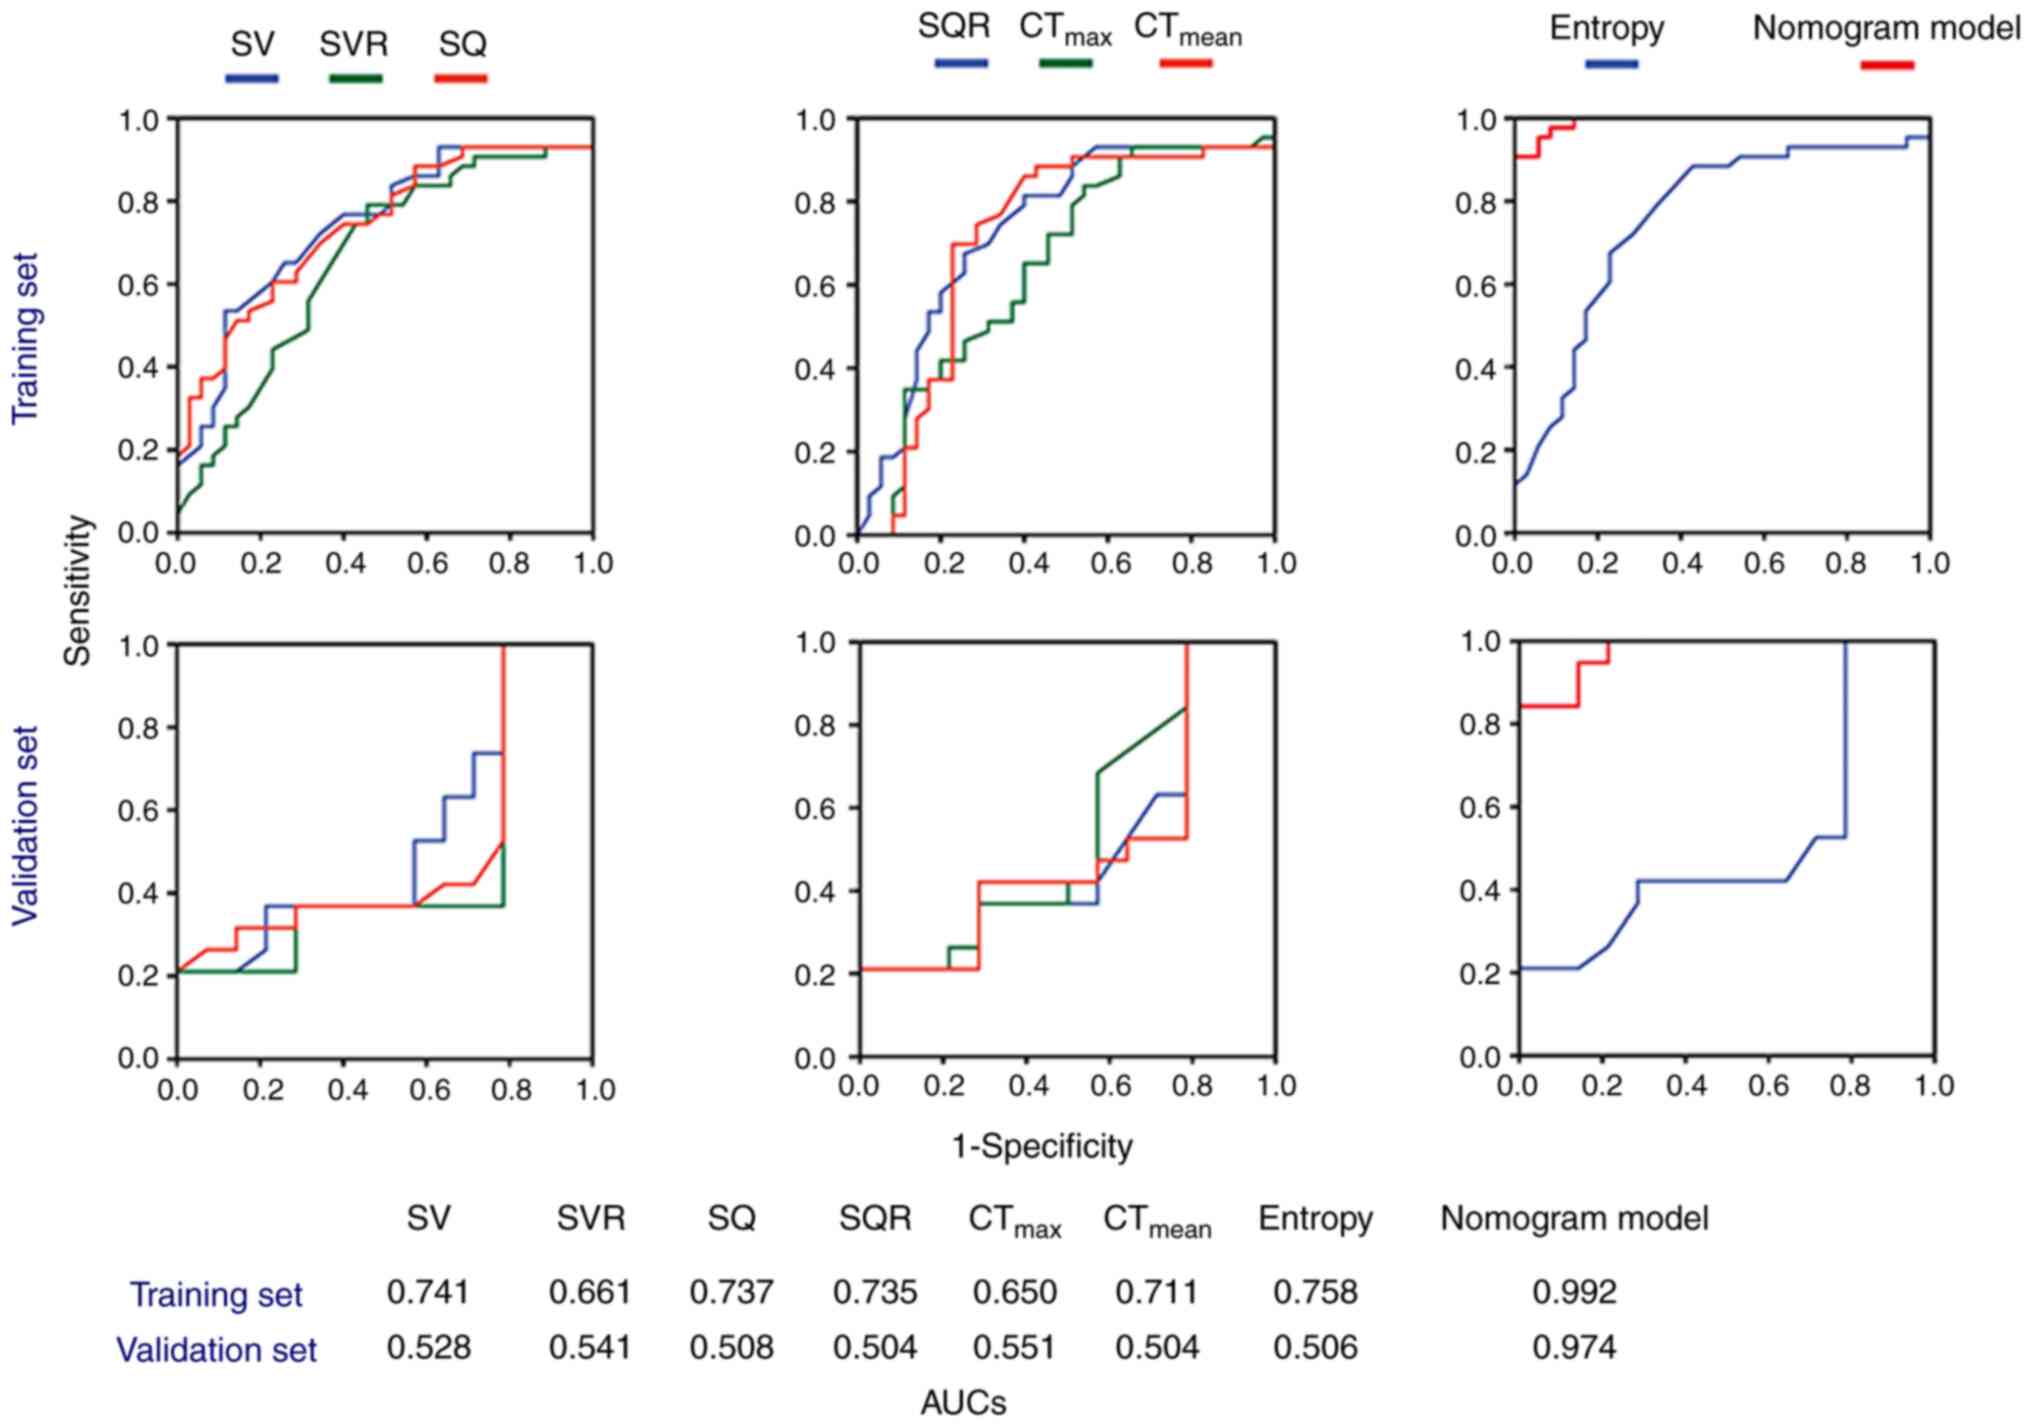
The diagnostic models were constructed and the
corresponding ROC curves are displayed in Fig. 3. Notably, the combined
multi-parameter model exhibited superior predictive ability
compared with each individual single-parameter model. The
performance of the nomogram prediction model is illustrated in
Table II for the training set and
Table III for the validation set.
In the training set, the nomogram achieved an AUC of 0.992 (95% CI:
0.980–1.000), a sensitivity of 0.907, a specificity of 1.000 and an
accuracy of 0.948. For the validation set, the AUC was 0.975 (95%
CI: 0.935–1.000), with a sensitivity of 0.842, a specificity of
0.941 and an accuracy of 0.912. The results of DeLong's test
demonstrated significant statistical differences in AUCs between
the nomogram and single-parameter models (P<0.001).
| Table II.The AUC values for each prediction
model were calculated and evaluated on both the training and
validation set. |
Table II.
The AUC values for each prediction
model were calculated and evaluated on both the training and
validation set.
|
| Training set | Validation set |
|---|
|
|
|
|
|---|
| Clinical
characteristic | AUC (95% CI) | P-value | AUC (95% CI) | P-value |
|---|
| SV,
mm3) | 0.735
(0.622–0.848) |
<0.001a | 0.547
(0.347–0.748) | 0.640 |
| SVR, %) | 0.654
(0.529–0.779) | 0.021a | 0.540
(0.331–0.750) | 0.690 |
| SQ, mg | 0.732
(0.620–0.843) | 0.001a | 0.509
(0.303–0.715) | 0.931 |
| SQR, % | 0.729
(0.611–0.847) | 0.001a | 0.523
(0.321–0.725) | 0.822 |
| CTmax,
HU | 0.641
(0.513–0.769) | 0.034a | 0.575
(0.376–0.775) | 0.456 |
| CTmean,
HU | 0.706
(0.577–0.834) | 0.002a | 0.509
(0.305–0.721) | 0.931 |
| entropy | 0.752
(0.640–0.866) |
<0.001a | 0.521
(0.318–0.724) | 0.835 |
| nomogram | 0.992
(0.980–1.000) |
<0.001a | 0.975
(0.935–1.000) |
<0.001a |
| Table III.Performance of nomogram model on the
training and validation set. |
Table III.
Performance of nomogram model on the
training and validation set.
| Set | AUC | 95% CI | Sensitivity | Specificity | Accuracy |
|---|
| Training | 0.992 | 0.980–1.000 | 0.907 | 1.000 | 0.948 |
| Validation | 0.975 | 0.935–1.000 | 0.842 | 0.941 | 0.912 |
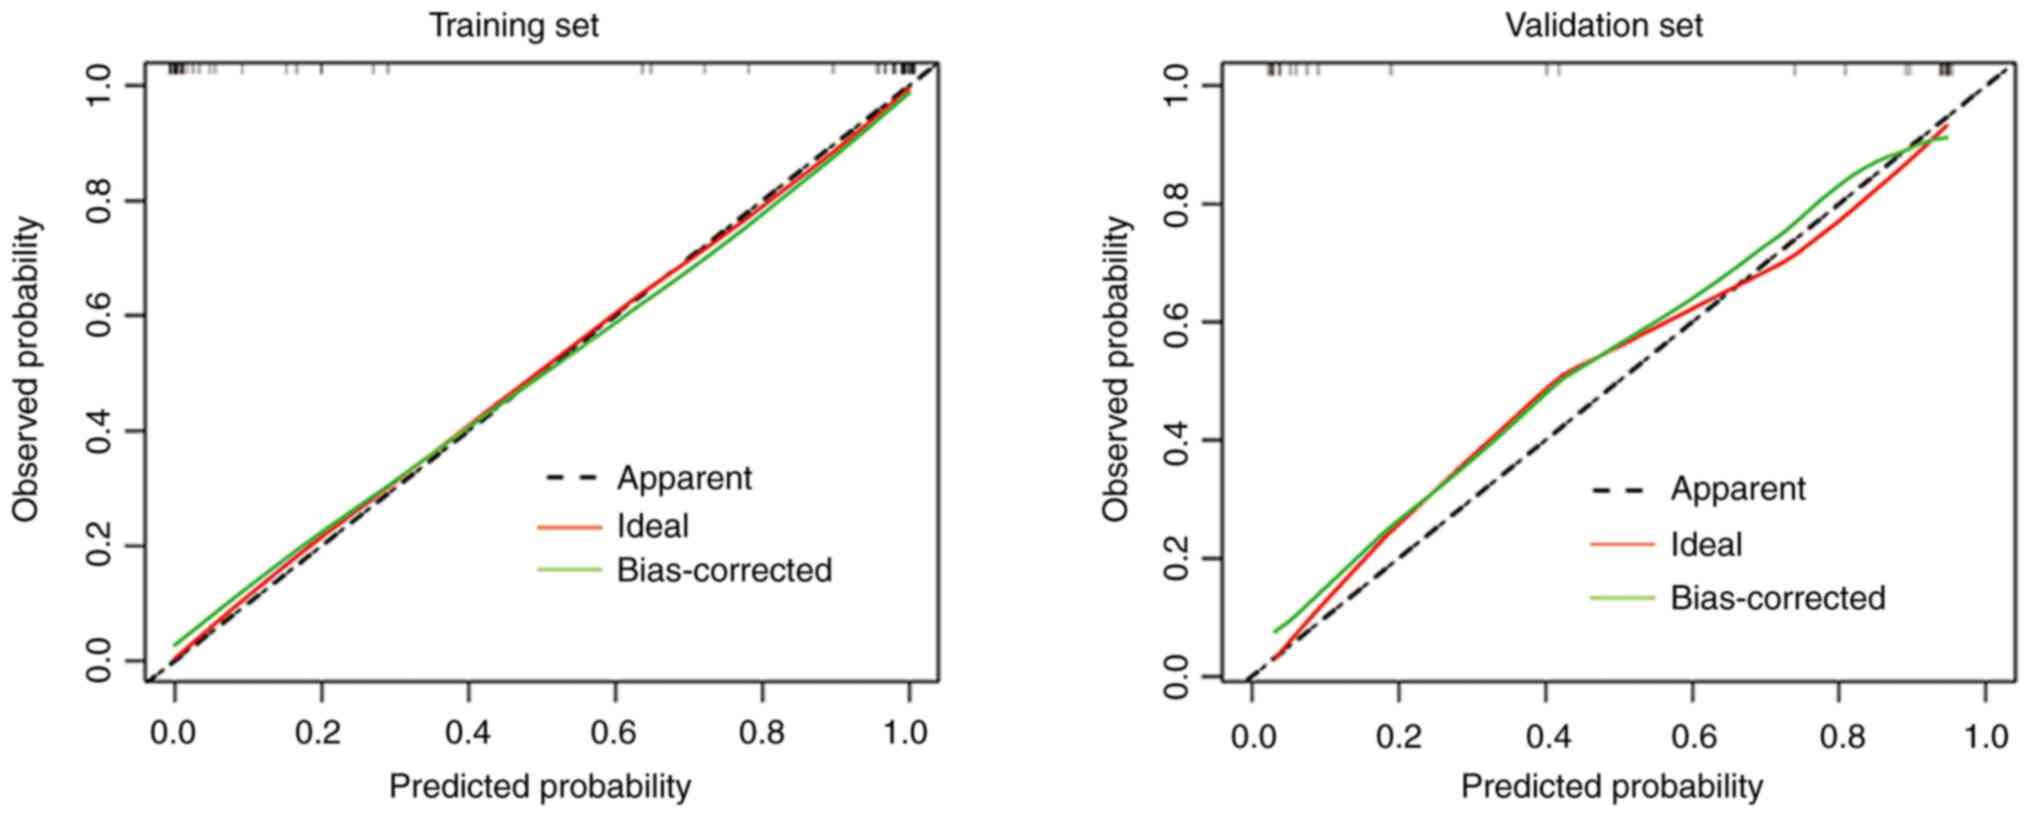
Nomogram and calibration curve
A nomogram (Fig. 4A)
was constructed utilizing five parameters (SV, SVR,
CTmax, CTmean and entropy). The model formula
was derived as follows: Total Points=0.576 × SV −1.131 × SVR -
0.162× CTmax - 0.136 × CTmean + 21.533 ×
entropy. Each parameter in the nomogram corresponds to a specific
score on the top ‘Points’ axis. The cumulative sum of these scores
corresponds to the values displayed on the bottom ‘Total Points’
axis, representing the diagnostic probability of MIA: Two cases of
AIS and MIA (Fig. 4B and C)
provided illustrative examples from the collected database. The
calibration curve (Fig. 5)
demonstrates a favorable agreement between the predicted model and
the observed data, as the scatter plot closely aligns with the
ideal curve.
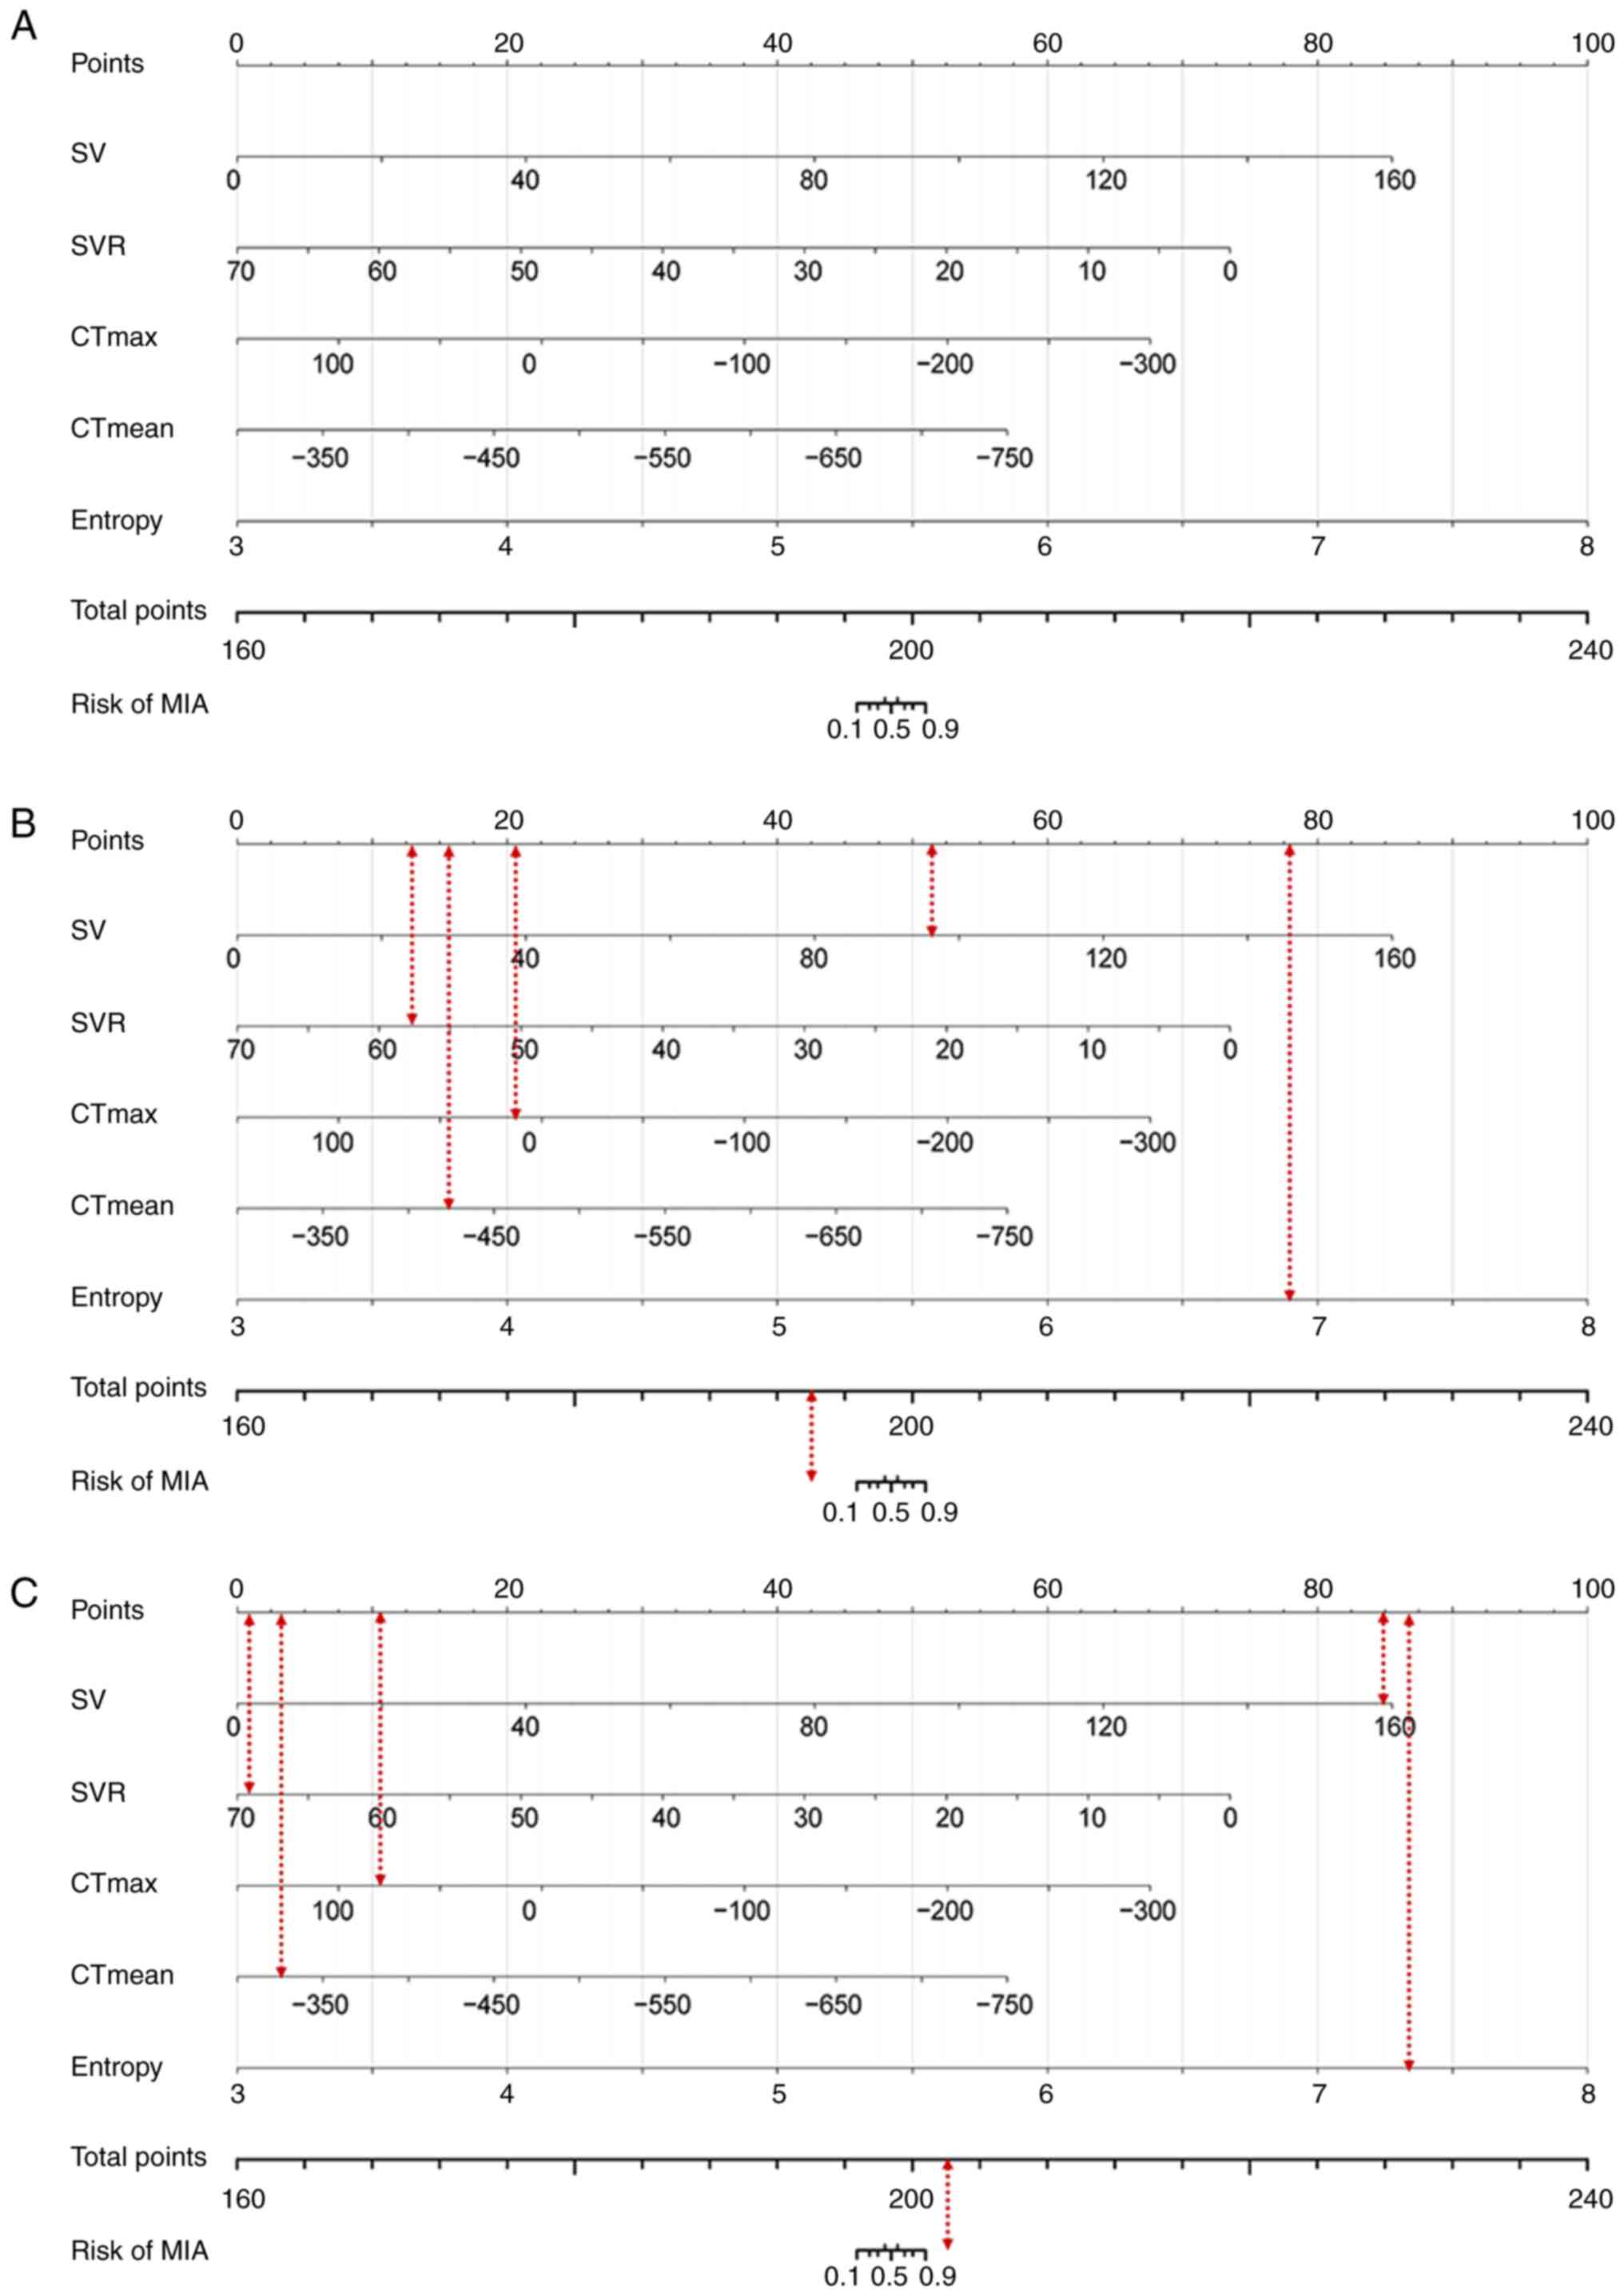 | Figure 4.The nomogram helps differentiate MIA
from AIS/AAH. (A) The ‘Total Points’ on the nomogram predicts the
chance of MIA. (B) An AIS case had a ‘Total Points’ value of
193.588, meaning a MIA probability less than 0.1. (C) An MIA case
has a ‘Total Points’ value of 202.369, corresponding to a MIA
probability greater than 0.9. MIA, minimally invasive
adenocarcinoma; AIS, adenocarcinoma in situ; AAH,
adenomatous hyperplasia; SV, solid volume; SVR, solid volume rate;
SQ, solid quality; SQR, solid quality rate; CTmax,
maximum computed tomography attenuation; CTmean, mean
computed tomography attenuation. |
Discussion
The present study retrospectively collected
surgically resected and pathologically confirmed cases of GPL and
MIA that presented as sub-centimeter GGNs on CT images, then
extracted and analyzed their CT quantitative and texture features.
Subsequently, a nomogram model incorporating the five most
informative identification indicators (SV, SVR, CTmax,
CTmean and entropy) was developed to accurately
differentiate MIA from GPL. The ROC curve revealed high predictive
accuracy in distinguishing between MIA and GPL, with an AUC values
of 0.992 and 0.975 for the training set and validation set,
respectively. Early-stage lung cancers predominantly present as
solitary GGNs, posing challenges in distinguishing benign nodules
from malignant ones due to the diverse manifestations and
overlapping features observed on CT images. In line with previous
studies by Wu et al (9,10), who
extensively analyzed the CT imaging features of sub-centimeter pure
GGNs, the present study identified relevant morphological features
such as lesion size, vessel changes and tumor-lung interface, which
reflect the invasiveness of GGNs. Moreover, previous investigations
(26–28) have established a close association
between the size of the solid component and the average CT
attenuation of GGNs with their invasiveness and pathology. The
findings of the present study corroborated these conclusions,
demonstrating significant differences in SV, SVR, SQ, SQR,
CTmax and CTmean between GPL and MIA.
Notably, the values of these variables were consistently higher in
the MIA group compared with the GPL group. These results confirm
the importance of the solid component in predicting the behavior of
GGNs. To summarize, the present study retrospectively analyzed
surgically resected GGNs, extracting and analyzing their CT
quantitative and texture features and achieved high predictive
performance in discriminating between MIA and GPL through the
development of a nomogram model incorporating five informative
identification indicators. The challenges associated with
differentiating benign and malignant nodules in early-stage lung
cancers were underscored, emphasizing the significance of
considering the presence and characteristics of the solid component
in predicting invasiveness and pathological behavior of GGNs.
Texture analysis plays a crucial role in efficiently
and accurately extracting biological information that reflects
tumor heterogeneity, which may not be discernible by visual
examination of images alone. It enables quantitative assessment of
subtle changes in image pixel values and their arrangement. As a
result, it holds great value in qualitative diagnosis, invasiveness
assessment, prognostic prediction of tumors and informed clinical
management. Qiu et al (17)
demonstrated the independent prognostic significance of mean CT
attenuation and entropy in evaluating the invasiveness of 428 cases
of clinical stage IA lung adenocarcinoma. Zhu et al
(19) employed the ANOVA test and
the least absolute shrinkage and selection operator algorithm to
identify 18 CT texture features, including entropy. They
successfully developed a diagnostic model capable of distinguishing
MIA from GPL presenting as pure GGNs, achieving high identification
performance with an AUC of 0.884 in the training set and 0.872 in
the validation set. In the present study, there was a statistically
significant difference in entropy between GPL and MIA, which is
consistent with previous findings. Moreover, the combined
multi-parameter model exhibited superior predictive performance,
with AUC values of 0.992 in the training set and 0.975 in the
validation set, surpassing the research conducted by Zhu et
al (19). This disparity may be
attributed to differences in the composition of enrolled cases. The
present study encompassed not only pure vitreous nodules but also
mixed-density nodules. Previous studies (26,28)
have indicated the diagnostic relevance of the solid component
within GGNs. Another study (29)
employed machine learning and deep learning methods to evaluate
benign and malignant pulmonary nodules, revealing AUC values of
0.763 for the support vector machine (SVM) model and 0.723 for the
convolutional neural networks (CNN) model in distinguishing GPL
from MIA. Notably, the predictive performance of both SVM and CNN
models was lower than that of the nomogram model established in the
present study. These findings suggest that CT texture analysis may
offer greater assistance and efficiency in achieving this
objective. The patients in the present study were sourced from a
single center, resulting in a relatively small sample size, but the
parameters and quality of these CT images were highly standardized
and homogenized. Conversely, in a previous multicenter study
(29), although the sample size was
larger, challenges related to CT image homogenization may have
persisted. This discrepancy could explain the superior diagnostic
effectiveness of the constructed model. Consequently, future
studies should focus on expanding the sample size and analyzing
data from different centers to obtain a more accurate and efficient
predictive model.
Nomogram models are graphical representations
employed to illustrate analytical outcomes derived from
multifactorial logistic regression models or Cox proportional
hazards models. These models use a set of parallel,
non-intersecting lines within a coordinate plane to portray the
quantitative analysis diagram, depicting the functional
relationship between multiple variables. By employing intuitive
symbols, nomograms facilitate the calculation of disease occurrence
probability, recurrence risk and prognosis. Consequently, they find
extensive application in clinical research pertaining to pulmonary
GGNs (30). In the present study, a
nomogram model for the identification of precursor lesions and MIA
was established, based on five CT quantitative and texture
features, namely SV, SVR, CTmax, CTmean and
entropy. This model serves as an effective and intuitive reference
standard, enabling radiologists to achieve accurate and prompt
diagnoses.
In conclusion, the use of CT quantitative and
texture features offered significant utility in the differentiation
of MIA from GPL. The nomogram model developed demonstrated superior
discriminatory capabilities. This model's diagnostic efficacy,
combined with its graphical representation, facilitates the precise
classification of GGN types by radiologists, thereby aiding
clinicians in making informed decisions regarding treatment and
follow-up strategies for GGNs. Nonetheless, the present study has
certain limitations that require acknowledgment. It was a
retrospective, single-center study with a small sample size, which
may introduce selection bias and potentially affect the precision
and applicability of the model. In the future, efforts should be
made to enhance the model's robustness and applicability by
increasing the sample size, conducting multi-center studies and
incorporating external test sets.
Acknowledgements
Not applicable.
Funding
The present study was supported by Project of Foshan Science and
Technology Bureau (grant no. 2220001003972), the Science Innovative
Project of Foshan (grant no. FSOAA-KJ218-1301-0021), the Foshan
14th Five-Year Plan Key Discipline Foundation (grant no.
FSGSP145036), the Medical Research Subject of Foshan Health Bureau
(grant no. 20230027), the Medical Research Foundation of Guangdong
Province (grant nos. A2021493 and A2022330) and the Natural Science
Foundation of Guangdong Province (grant no. 2021A1515220032).
Availability of data and materials
The datasets used and/or analyzed during the current
study are available from the corresponding author on reasonable
request.
Authors' contributions
CL and ZX participated in the design of the study.
YJ and QD performed data analysis and prepared the figures. YY, RD
and JZ participated in the analysis of the figures and data. CL and
YJ prepared and revised the manuscript. AP, MG and ZX reviewed the
results and revised the manuscript. CL, AP, MG and ZX confirm the
authenticity of all the raw data. All authors have read and
approved the final version of this manuscript.
Ethics approval and consent to
participate
The present study was approved by the Institutional
Research Ethics Committee of the First Peoples' Hospital of Foshan
(approval no. 2021.02) and was conducted in accordance with the
ethical principles of the Declaration of Helsinki and the ethical
laws and regulations established in China. Written informed consent
was waived.
Patient consent for publication
Not applicable.
Use of artificial intelligence tools
The uAI-ChestCare software is an artificial
intelligence (AI) software based on deep learning method,
specifically designed for applications related to chest or
pulmonary care and have achieved good results in prior research
endeavors. In the present study, CT lung window images, configured
with a window width of 1,500 Hounsfield Units (HU) and a window
level of −600 HU in DICOM format, were input into the uAI-ChestCare
software. Subsequently, the software autonomously delineated the
entire 3D ROI for identified lesions by outlining the tumor
boundaries across consecutive axial slices. Following this, an
array of quantitative and textural features were computed,
encompassing parameters such as MD, SV, SVR, SQ, SQR, maximum
computed tomography attenuation CTmax, CTmin,
CTmean, CTmedian), variance, kurtosis,
skewness and entropy.
Competing interests
The authors declare that they have no competing
interests.
References
|
1
|
Hyldgaard C, Trolle C, Harders SMW,
Engberg H, Rasmussen TR and Møller H: Increased use of diagnostic
CT imaging increases the detection of stage IA lung cancer:
Pathways and patient characteristics. BMC Cancer. 22:4642022.
View Article : Google Scholar : PubMed/NCBI
|
|
2
|
Walter JE, Heuvelmans MA, Bock GH,
Yousaf-Khan U, Groen HJM, Aalst CMV, Nackaerts K, Ooijen PMAV,
Koning HJ, Vliegenthart R and Oudkerk M: Characteristics of new
solid nodules detected in incidence screening rounds of low-dose CT
lung cancer screening: The NELSON study. Thorax. 73:741–747. 2018.
View Article : Google Scholar : PubMed/NCBI
|
|
3
|
Tammemagi MC and Lam S: Screening for lung
cancer using low dose computed tomography. BMJ. 348:g22532014.
View Article : Google Scholar : PubMed/NCBI
|
|
4
|
Nicholson AG, Tsao MS, Beasley MB, Borczuk
AC, Brambilla E, Cooper WA, Dacic S, Jain D, Kerr KM, Lantuejoul S,
et al: The 2021 WHO classification of lung tumors: Impact of
advances since 2015. J Thorac Oncol. 17:362–387. 2022. View Article : Google Scholar : PubMed/NCBI
|
|
5
|
Lantuejoul S, Rouquette I, Brambilla E and
Travis WD: New WHO classification of lung adenocarcinoma and
preneoplasia. Ann Pathol. 36:5–14. 2016.(In French). View Article : Google Scholar : PubMed/NCBI
|
|
6
|
Yankelevitz DF, Yip R, Smith JP, Liang M,
Liu Y, Xu DM, Salvatore MM, Wolf AS, Flores RM and Henschke CI;
International Early Lung Cancer Action Program Investigators Group,
: CT screening for lung cancer: Nonsolid nodules in baseline and
annual repeat rounds. Radiology. 277:555–564. 2015. View Article : Google Scholar : PubMed/NCBI
|
|
7
|
Nie X, Li L, Huang J, Zhang P, Shi H,
Cheng G and Zhang YQ: From focal pulmonary pure ground-glass
opacity nodule detected by low-dose computed tomography into
invasive lung adenocarcinoma: A growth pattern analysis in the
elderly. Thorac Cancer. 9:1361–1365. 2018. View Article : Google Scholar : PubMed/NCBI
|
|
8
|
Yamagami T, Yoshimatsu R, Miura H, Yamada
K, Takahata A, Matsumoto T and Hasebe T: Diagnostic performance of
percutaneous lung biopsy using automated biopsy needles under
CT-fluoroscopic guidance for ground-glass opacity lesions. Br J
Radiol. 86:201204472013. View Article : Google Scholar : PubMed/NCBI
|
|
9
|
Wu F, Tian SP, Jin X, Jing R, Yang YQ, Jin
M and Zhao SH: CT and histopathologic characteristics of lung
adenocarcinoma with pure ground-glass nodules 10 mm or less in
diameter. Eur Radiol. 27:4037–4043. 2017. View Article : Google Scholar : PubMed/NCBI
|
|
10
|
Wu F, Cai ZL, Tian SP, Jin X, Jing R, Yang
YQ, Li Y and Zhao SH: Analysis of histopathologic subtypes and CT
characteristics of lung adenocarcinomas presenting as pure
ground-glass nodule of 1 cm or less in maximal diameter. Chin J
Radiol. 50:260–264. 2016.
|
|
11
|
Jia M, Yu S, Cao L, Sun PL and Gao H:
Clinicopathologic Features and genetic alterations in
adenocarcinoma in situ and minimally invasive adenocarcinoma of the
lung: Long-term follow-up study of 121 Asian patients. Ann Surg
Oncol. 27:3052–3063. 2020. View Article : Google Scholar : PubMed/NCBI
|
|
12
|
Zhao W, Xu Y, Yang Z, Sun Y, Li C, Jin L,
Gao P, He W, Wang P, Shi H, et al: Development and validation of a
radiomics nomogram for identifying invasiveness of pulmonary
adenocarcinomas appearing as subcentimeter ground-glass opacity
nodules. Eur J Radiol. 112:161–168. 2019. View Article : Google Scholar : PubMed/NCBI
|
|
13
|
Chae HD, Park CM, Park SJ, Lee SM, Kim KG
and Goo JM: Computerized texture analysis of persistent part-solid
ground-glass nodules: Differentiation of preinvasive lesions from
invasive pulmonary adenocarcinomas. Radiology. 273:285–293. 2014.
View Article : Google Scholar : PubMed/NCBI
|
|
14
|
Raman SP, Schroeder JL, Huang P, Chen Y,
Coquia SF, Kawamoto S and Fishman EK: Preliminary data using
computed tomography texture analysis for the classification of
hypervascular liver lesions: Generation of a predictive model on
the basis of quantitative spatial frequency measurements-a work in
progress. J Comput Assist Tomogr. 39:383–395. 2015.PubMed/NCBI
|
|
15
|
Ng F, Ganeshan B, Kozarski R, Miles KA and
Goh V: Assessment of primary colorectal cancer heterogeneity by
using whole-tumor texture analysis: Contrast-enhanced CT texture as
a biomarker of 5-year survival. Radiology. 266:177–184. 2013.
View Article : Google Scholar : PubMed/NCBI
|
|
16
|
Jiang Y, Che S, Ma S, Liu X, Guo Y, Liu A,
Li G and Li Z: Radiomic signature based on CT imaging to
distinguish invasive adenocarcinoma from minimally invasive
adenocarcinoma in pure ground-glass nodules with pleural contact.
Cancer Imaging. 21:12021. View Article : Google Scholar : PubMed/NCBI
|
|
17
|
Qiu ZB, Zhang C, Chu XP, Cai FY, Yang XN,
Wu YL and Zhong WZ: Quantifying invasiveness of clinical stage IA
lung adenocarcinoma with computed tomography texture features. J
Thorac Cardiovasc Surg. 163:805–815. 2022. View Article : Google Scholar : PubMed/NCBI
|
|
18
|
Moon Y, Sung SW, Lee KY, Sim SB and Park
JK: Pure ground-glass opacity on chest computed tomography:
Predictive factors for invasive adenocarcinoma. J Thorac Dis.
8:1561–1570. 2016. View Article : Google Scholar : PubMed/NCBI
|
|
19
|
Zhu YQ, Liu C, Mo Y, Dong H, Huang C, Duan
YN, Tang LL, Chu YY and Qin J: Radiomics for differentiating
minimally invasive adenocarcinoma from precursor lesions in pure
ground-glass opacities on chest computed tomography. Br J Radiol.
95:202107682022. View Article : Google Scholar : PubMed/NCBI
|
|
20
|
Liu J, Yang X, Li Y, Xu H, He C, Qing H,
Ren J and Zhou P: Development and validation of qualitative and
quantitative models to predict invasiveness of lung adenocarcinomas
manifesting as pure ground-glass nodules based on low-dose computed
tomography during lung cancer screening. Quant Imaging Med Surg.
12:2917–2931. 2022. View Article : Google Scholar : PubMed/NCBI
|
|
21
|
Xie Y, Zhang J and Xia Y: Semi-supervised
adversarial model for benign-malignant lung nodule classification
on chest CT. Med Image Anal. 57:237–248. 2019. View Article : Google Scholar : PubMed/NCBI
|
|
22
|
Wu L, Gao C, Xiang P, Zheng S, Pang P and
Xu M: CT-imaging based analysis of invasive lung adenocarcinoma
presenting as ground glass nodules using peri- and intra-nodular
radiomic features. Front Oncol. 10:8382020. View Article : Google Scholar : PubMed/NCBI
|
|
23
|
Xu F, Zhu W, Shen Y, Wang J, Xu R, Outesh
C, Song L, Gan Y, Pu C and Hu H: Radiomic-based quantitative CT
analysis of pure ground-glass nodules to predict the invasiveness
of lung adenocarcinoma. Front Oncol. 10:8722020. View Article : Google Scholar : PubMed/NCBI
|
|
24
|
Mishra P: Practical explainable AI using
python: Artificial intelligence model explanations using
pythonbased libraries, extensions, and frameworks. Apress Media;
New York, NY: 2021
|
|
25
|
DeLong ER, DeLong DM and Clarke-Pearson
DL: Comparing the areas under two or more correlated receiver
operating characteristic curves: A nonparametric approach.
Biometrics. 44:837–845. 1988. View
Article : Google Scholar : PubMed/NCBI
|
|
26
|
Lee KH, Goo JM, Park SJ, Wi JY, Chung DH,
Go H, Park HS, Park CM and Lee SM: Correlation between the size of
the solid component on thin-section CT and the invasive component
on pathology in small lung adenocarcinomas manifesting as
ground-glass nodules. J Thorac Oncol. 9:74–82. 2014. View Article : Google Scholar : PubMed/NCBI
|
|
27
|
Fang W, Zhang G, Yu Y, Chen H and Liu H:
Identification of pathological subtypes of early lung
adenocarcinoma based on artificial intelligence parameters and CT
signs. Biosci Rep. 42:BSR202124162022. View Article : Google Scholar : PubMed/NCBI
|
|
28
|
Wang X, Wang L, Zhang W, Zhao H and Li F:
Can we differentiate minimally invasive adenocarcinoma and
non-invasive neoplasms based on high-resolution computed tomography
features of pure ground glass nodules? PLoS One.
12:e1805022017.
|
|
29
|
Ashraf SF, Yin K, Meng CX, Wang Q, Wang Q,
Pu J and Dhupar R: Predicting benign, preinvasive, and invasive
lung nodules on computed tomography scans using machine learning. J
Thorac Cardiovasc Surg. 163:1496–1505.e10. 2022. View Article : Google Scholar : PubMed/NCBI
|
|
30
|
Meng F, Guo Y, Li M, Lu X, Wang S, Zhang L
and Zhang H: Radiomics nomogram: A noninvasive tool for
preoperative evaluation of the invasiveness of pulmonary
adenocarcinomas manifesting as ground-glass nodules. Transl Oncol.
14:1009362021. View Article : Google Scholar : PubMed/NCBI
|