Introduction
Immunotherapy is effective in patients with various
neoplasms. Currently, the greatest number of biomarkers are being
investigated as potential predictors of immune checkpoint
inhibitors (ICIs), such as programmed death-1 (PD-1) or PD ligand-1
(PD-L1) antibodies. However, the majority of biomarkers have
limited capability to predict the efficacy of ICIs. Certain genetic
mutations, such as epidermal growth factor receptor (EGFR)
mutations, can affect the efficacy of ICIs. A previous report
identified EGFR mutation as a negative predictor in ICIs
therapy in patients with non-small cell lung cancer (NSCLC)
(1). The patient's ethnicity may
affect the efficacy of ICIs, because of different incidence between
Asian and Caucasian population. Therefore, there is an urgent need
to identify novel biomarkers for the clinical application of
appropriate treatments. NSCLC is a potential candidate for ICI
treatment. Although an increasing number of patients with advanced
NSCLC have been receiving PD-1 blockade, PD-L1 expression within
tumor specimens alone is clinically utilized rather than tumor
mutation burden (TMB), tumor infiltrative lymphocytes (TILs), or
peripheral blood mononuclear cells (PBMC) (2–4).
Conventionally, convenient modalities, such as blood testing or
radiographic imaging, are acceptable for clinical application as
useful predictors for any therapeutic agent.
Recently, we reported several studies on the
relationship between 2-deoxy-2-[fluorine-18]-fluoro-d-glucose
(18F-FDG) uptake on positron emission tomography (PET)
and the prognostic significance of PD-1 blockade (5–8). Our
previous studies indicated that metabolic tumor activity on PET
before immunotherapy effectively predicts tumor outcome, but cannot
predict the objective response to PD-1 blockade (5–8). The
maximum standardized uptake value (SUVmax), metabolic
tumor volume (MTV), and total lesion glycolysis (TLG) are generally
used to assess 18F-FDG uptake within tumor specimens,
reflecting tumor glucose metabolism (5,6). Based
on previous evidence, we hypothesized that instead of
SUVmax, MTV or TLG could be utilized as prognostic
predictors of PD-1 blockade (5–10).
However, identifying a novel prognostic predictor after ICI
treatment using metabolic tumor activity alone on PET remains
difficult.
Generally, routinely collected blood parameters,
such as white blood cells, leukocytes, lymphocytes, albumin, and
C-reactive protein (CRP), as well as body mass index (BMI) are
useful, convenient, and economical if these biomarkers are
established as novel predictors for immunotherapy. Several recent
studies have demonstrated that inflammatory and nutritional indices
in blood samples are important markers for predicting the outcome
of PD-1 blockade therapy (11,12).
By combining these inflammatory and nutritional markers, possible
therapeutic prediction for immunotherapy can be explored, and
future challenges are expected. Glycolysis is a nutritional index,
in addition to amino and fatty acids, and a high accumulation of
18F-FDG is observed at inflammatory sites, described as
a false-positive finding (13). A
recent study demonstrated a close relationship between
18F-FDG uptake and inflammatory indices in patients with
NSCLC (14). However, the
prognostic value of combining 18F-FDG uptake with
inflammatory or nutritional indices following immunotherapy remains
unclear.
Based on this evidence, we investigated the
association between metabolic tumor activity via 18F-FDG
uptake and inflammatory/nutrition indices and the prognostic impact
of PD-1 blockade treatment by combining these markers based on
previous studies (4–6,8).
Materials and methods
Patients
Between April 2018 and March 2021, 186 patients with
advanced NSCLC who received PD-1 blockade monotherapy and underwent
18F-FDG PET immediately before the initial treatment at
our institution were included in this study. These cases have been
reported in our previous studies (4–6,8).
Clinical data were extracted from medical records. This study was
approved by the Institutional Ethics Committee of the International
Medical Center of Saitama Medical University (approval no. 19-075).
The requirement for written informed consent was waived by the
Ethics Committee of Saitama Medical University due to the
retrospective nature of the study (15).
Treatment and evaluation
All patients were treated with PD-1 blockade
monotherapy and combined chemotherapy with anti-PD-1/PD-L1
antibodies. IMpower 150 (atezolizumab 1,200 mg, bevacizumab 15
mg/kg, area under the concentration-time curve of 5 mg/ml per min
carboplatin, and 175 mg/m paclitaxel), keynote 189 (carboplatin
area under the plasma concentration-time curve 5 mg/ml min,
pemetrexed 500 mg/m2 · and pembrolizumab 200 mg), and
keynote 407 (carboplatin area under the plasma concentration-time
curve 5 mg/ml · min, nab-paclitaxel 100 mg/m2, and
pembrolizumab 200 mg) were intravenously administered (16–18).
Physical examination, complete blood count, biochemical testing,
and adverse event assessment were performed by a chief physician.
Toxicity was graded based on the Common Terminology Criteria for
Adverse Events, version 4.0. Tumor response was examined using the
Response Evaluation Criteria in Solid Tumors (RECIST) version 1.1
(19).
Assessment of inflammatory and
nutrition index
Clinical and biological data, such as total protein
(TP), albumin, white blood cell (WBC), neutrophil, platelet,
lymphocyte, C-reactive protein (CRP), height, and weight, were
extracted from medical records before analysis. Six indices
reflecting the systemic inflammatory and nutritional statuses,
based on previous studies (11),
were calculated at baseline within 1 week of the first treatment
cycle, as follows: 1) neutrophil-to-lymphocyte ratio
(NLR)=neutrophil count/lymphocyte count (12,20):
2) platelet-to-lymphocyte ration (PLR)=platelet count/lymphocyte
count (12,21); 3) systemic immune inflammation index
(SII)=platelet count × neutrophil count/lymphocyte count (12,22);
4) prognostic nutritional index (PNI)=10 × albumin + 0.005 ×
lymphocyte count (10); 5) advanced
lung cancer inflammation index (ALI)=body mass index (BMI) +
albumin/NLR (23); and 6) Glasgow
prognostic score (GPS)=CRP >10, albumin <3.5 (total points:
0, good; 1, intermediate; 2, poor) (20). GPS values of 0 and 1/2 were defined
as low and high, respectively.
PET imaging and data analysis
The patients fasted for at least 6 h before
18F-FDG administration for PET, which was performed
using a PET/computed tomography (CT) scanner. Three-dimensional
data acquisition was initiated 60 min after the FDG injection.
Eight bed positions were selected based on the imaging range. The
attenuation-corrected transverse images obtained using
18F-FDG were reconstructed using an ordered subset
expectation-maximization algorithm based on the point-spread
function into 168×168 matrices with a slice thickness of 2.00
mm.
For semi-quantitative analysis, the standardized
uptake value (SUV) was examined based on the injected dosage of
18F-FDG, the patient's body weight, and the
cross-calibration factor between the PET and the dose calibrator.
The SUV was defined as follows: SUV=radioactive concentration in
the volume of interest (VOI) (MBq/g)/injected dose (MBq)/patient's
body weight (g). CT for initial staging was performed using
intravenous contrast medium, and board-certified radiologists
interpreted the images. We used RAVAT software (Nihon Medi-physics
Co. Ltd., Japan) on a Windows workstation to semi-automatically
calculate the maximum SUV (SUVmax), MTV, and TLG,
defined as MTV multiplied by SUVmean, of each lesion
using the SUV thresholds obtained by the SUV in the liver VOI. Each
threshold was defined as the average of 1.5 × SUV
(SUVmean) plus 2 × standard deviations of SUV in the
liver. These SUV thresholds were the optimum values for generating
a three-dimensional VOI in which the entire tumor mass was enclosed
in all cases, using the CT image as the reference. Regions of
activity other than tumors, including the myocardium,
gastrointestinal tract, kidneys, and urinary tract, were manually
eliminated according to the orientation provided by a
board-certified nuclear medicine physician.
Statistical analysis
Statistical significance was set at
P<0.05. Fisher's exact test was used to examine the
association between two categorical variables. Correlations between
SUVmax, MTV, TLG, and 18F-FDG uptake were
analyzed using Pearson's rank test. Progression-free survival (PFS)
was defined as the time from initial treatment to disease
progression or death. Overall survival (OS) was defined as the time
from initial treatment to death from any cause. The Kaplan-Meier
method was used to estimate survival as a function of time, and
survival differences were analyzed using the log-rank test.
Univariate and multivariate analyses of the variables were
performed using logistic regression. The optimal cut-off values of
NLR, PLR, SII, PNI, ALI, SUVmax, MTV, and TLG for
18F-FDG uptake were determined using receiver operating
characteristic (ROC) curve analysis. Sensitivity and specificity
were calculated to determine the optimal cutoff value for
differentiating responders from non-responders using ROC curves.
Responders were defined as those with a PFS >12 months. Factors
with a value greater than the cutoff value were defined as highly
expressed. All statistical analyses were performed using GraphPad
Prism (v.7.0; GraphPad Software, San Diego, CA, USA) and JMP Pro
6.0 (SAS Institute Inc., Cary, North Carolina, USA).
Results
Patient demographics
The patient characteristics are shown in Table I. The median values for NLR, PLR,
SII, PNI, ALI, SUVmax, MTV, and TLG before immunotherapy
were 3.6 (range 0.9-73.3), 200.7 (range 67.1-167,2.7), 987,654
(range 164,252-17455,680), 43.0 (range 20.2-59.4), 21.0 (range
0.8-90.8), 7.8 (range 2.9-113.3), 48.1 (range 1.1-1,400.7), and
212.6 (range 3.9-7,473.0), respectively. The optimal cutoff values
for NLR, PLR, SII, PNI, ALI, SUVmax, MTV, and TLG as
determined using ROC curve analysis were 2.7 (sensitivity: 43.7%;
specificity: 77.1%), 200 (sensitivity: 64.1%; specificity: 56.5%),
589,934 (sensitivity: 39.0%; specificity: 82.7%), 46.5
(sensitivity: 48.4%; specificity: 74.5%), 29.6 (sensitivity: 48.4%;
specificity: 72.1%), 4.4 (sensitivity: 18.7%; specificity: 90.9%),
123 cm3/ml (sensitivity: 81.2%; specificity: 36.8%), and
537 cm3/ml (sensitivity: 79.6%; specificity: 36.1%),
respectively. The areas under the ROC curve were 0.628 for NLR,
0.616 for PLR, 0.617 for SII, 0.627 for PNI, 0.622 for ALI, 0.498
for SUVmax, 0.580 for MTV, and 0.572 for MTV. High
expression of NLR, PLR, SII, PNI, ALI, SUVmax, MTV, and
TLG was observed in 69.9, 50.5, 75.3, 31.2, 31.2, 87.6, 30.6, and
31.7% of patients, respectively.
 | Table I.Demographics of the patients
(n=186). |
Table I.
Demographics of the patients
(n=186).
| Variables | N | % |
|---|
| Age, years |
|
|
|
≤69 | 109 | 58.6 |
|
>69 | 77 | 41.4 |
| Sex |
|
|
|
Male | 149 | 78.8 |
|
Female | 37 | 21.2 |
| ECOG PS |
|
|
| 0 | 65 | 34.9 |
| 1 | 88 | 47.3 |
| 2 | 23 | 12.4 |
| 3 | 10 | 5.4 |
| Smoking
history |
|
|
|
Yes | 162 | 87.1 |
| No | 24 | 12.9 |
| Histology |
|
|
| AC | 105 | 56.5 |
|
Non-AC | 81 | 43.5 |
| Disease stage |
|
|
|
III | 29 | 15.6 |
| IV | 154 | 82.8 |
| Ope
rec. | 3 | 1.6 |
| PD-L1 (TPS)
(%) |
|
|
|
<1% | 34 | 18.3 |
|
1–49% | 35 | 18.9 |
|
50–100% | 66 | 35.4 |
|
Unknown | 51 | 27.4 |
| Treatment line |
|
|
|
1st line | 98 | 52.7 |
|
2nd or more
line | 88 | 47.3 |
| Tumor response |
|
|
| CR | 6 | 3.2 |
| PR | 69 | 37.1 |
| SD | 52 | 27.9 |
| PD | 48 | 25.8 |
| NE | 11 | 6.0 |
| PD-1 blockade |
|
|
|
Nivolumab | 83 | 44.6 |
|
Pembrolizumab | 94 | 50.6 |
|
Atezolizumab | 9 | 4.8 |
| Grade 3/4 irAE |
|
|
|
Yes | 40 | 21.5 |
| No | 146 | 78.5 |
| Therapeutic
regimen |
|
|
|
Monotherapy | 141 | 75.8 |
|
Chemoimmunotherapy | 45 | 24.2 |
| NLR |
|
|
|
High | 130 | 69.9 |
|
Low | 56 | 30.1 |
| PLR |
|
|
|
High | 94 | 50.5 |
|
Low | 92 | 49.5 |
| SII |
|
|
|
High | 140 | 75.3 |
|
Low | 46 | 24.7 |
| PNI |
|
|
|
High | 58 | 31.2 |
|
Low | 128 | 68.2 |
| ALI |
|
|
|
High | 58 | 31.2 |
|
Low | 128 | 68.2 |
| GPS |
|
|
| 0 | 98 | 52.7 |
| 1 | 36 | 19.4 |
| 2 | 52 | 27.9 |
|
SUVmax |
|
|
|
High | 163 | 87.6 |
|
Low | 23 | 12.4 |
| MTV |
|
|
|
High | 57 | 30.6 |
|
Low | 129 | 69.4 |
| TLG |
|
|
|
High | 59 | 31.7 |
|
Low | 127 | 68.3 |
Next, we analyzed the relationship between
drug-induced lung injury and high levels of these markers (NLR,
PLR, SII, PNI, ALI, GPS, SUVmax, MTV, and TLG) and
between grade 3 or 4 immune-related adverse events (irAEs) and
these markers (Table SI). However,
drug-induced lung injury and grade 3 or 4 irAEs were not
significantly associated with high levels of these biomarkers. Our
patients did not receive any prednisolone and antibiotics which
affected the therapeutic efficacy of immunotherapy before
treatment.
Correlation of inflammatory and
nutrition index with 18F-FDG accumulation
Table II shows the
correlations between inflammatory and nutritional markers and
18F-FDG uptake. The amount of 18F-FDG uptake
based on SUVmax, MTV, and TLG was significantly
correlated with PLR, SII, PNI, and ALI, but SUVmax and
NLR were not significantly correlated (Table II). As individual markers, the
levels of albumin, LDH, CRP, WBC, neutrophils, lymphocytes, and BMI
closely correlated with the accumulation of 18F-FDG
based on MTV and TLG (Table
II).
| Table II.Correlation between glycolytic
metabolism and other variables. |
Table II.
Correlation between glycolytic
metabolism and other variables.
|
| Pearson r value
(95% CI) |
|---|
|
|
|
|---|
| Different
variables |
SUVmax | MTV | TLG |
|---|
| TP | −0.047
(0.190-0.096) | 0.517 | −0.142
(0.280-0.001) | 0.052 | −0.118
(0.257-0.026) | 0.108 |
| Albumin | −0.235
(−0.366-0.094) | 0.001 | −0.444
(−0.552-0.321) | <0.001 | −0.429
(−0.540-0.304) | <0.001 |
| LDH | 0.231
(0.090-0.363) | 0.001 | 0.343
(0.209-0.464) | <0.001 | 0.362
(0.231-0.481) | <0.001 |
| CRP | 0.291
(0.153-0.417) | <0.001 | 0.438
(0.314-0.547) | <0.001 | 0.425
(0.299-0.536) | <0.001 |
| WBC | 0.191
(0.048-0.326) | 0.009 | 0.388
(0.259-0.504) | <0.001 | 0.402
(0.273-0.516) | <0.001 |
| Neutrophil | 0.212
(0.071-0.345) | 0.003 | 0.416
(0.289-0.528) | <0.001 | 0.437
(0.313-0.547) | <0.001 |
| Lymphocyte | −0041
(−0.184-0.102) | 0.570 | −0.154
(−0.292-0.011) | 0.035 | −0.145
(−0.283-0.001) | 0.047 |
| Platelet | 0.169
(0.026-0.305) | 0.021 | 0.107
(0.036-0.247) | 0.143 | 0.131
(−0.012-0.270) | 0.073 |
| BMI | −0.091
(−0.231-0.053) | 0.218 | −0.151
(−0.288-0.007) | 0.039 | −0.151
(−0.288-0.007) | 0.039 |
| NLR | 0.098
(−0.046-0.238) | 0.181 | 0.275
(0.136-0.403) | <0.001 | 0.270
(0.131-0.398) | <0.001 |
| PLR | 0.151
(0.007-0.289) | 0.039 | 0.280
(0.142-0.407) | <0.001 | 0.277
(0.139-0.405) | <0.001 |
| SII | 0.203
(0.061-0.337) | 0.005 | 0.373
(0.242-0.491) | <0.001 | 0.424
(0.298-0.535) | <0.001 |
| PNI | −0.218
(−0.351-0.076) | 0.002 | −0.442
(−0.551-0.318) | <0.001 | −0.426
(−0.537-0.301) | <0.001 |
| ALI | −0.219
(−0.352-0.078) | 0.002 | −0.382
(−0.498-0.252) | <0.001 | −0.359
(−0.478-0.226) | <0.001 |
Therapeutic response and influence to
survival rate according to different variables
Inflammatory and nutritional indices were analyzed
according to different objective responses. No significant
differences were observed in these indices between the complete
response (CR)/partial response (PR) and stable disease
(SD)/progressive disease (PD) groups. The PNI and PLR values were
significantly different between patients with and without PD.
Of the 186 patients, 151 experienced disease
recurrence after the initial PD-1 blockade and 148 died because of
disease progression. The median PFS and OS of all the patients were
198 and 613 days, respectively. The 6-month and 1-, 2-, 3-, and
4-year PFS rates were 51.1, 33.8, 25.2, 20.4, and 20.4%,
respectively. The 1-, 2-, 3-, 4-, and 5-year OS rates were 64.5,
44.5, 28.5, 22.5, and 15.7%, respectively. Inflammatory and
nutritional indices were compared according to survival rates
(Fig. 1). NLR, PLR, and SII were
significantly higher and PNI and ALI were significantly lower in
patients with <1-year OS than in those with ≥1-year OS (Fig. 1). However, there was no significant
difference between <3 and ≥2-year OS. A significant difference
was observed between the <6-month and <1-year PFS rates for
NLR, the <1-year and <2-year PFS rates for SII and ALI, and
the <6-month and <2-year PFS rates for PNI (Fig. 1). MTV and TLG on 18F-FDG
uptake, but not SUVmax, were significantly different
between <1-year and <2-year PFS and OS (Fig. 1).
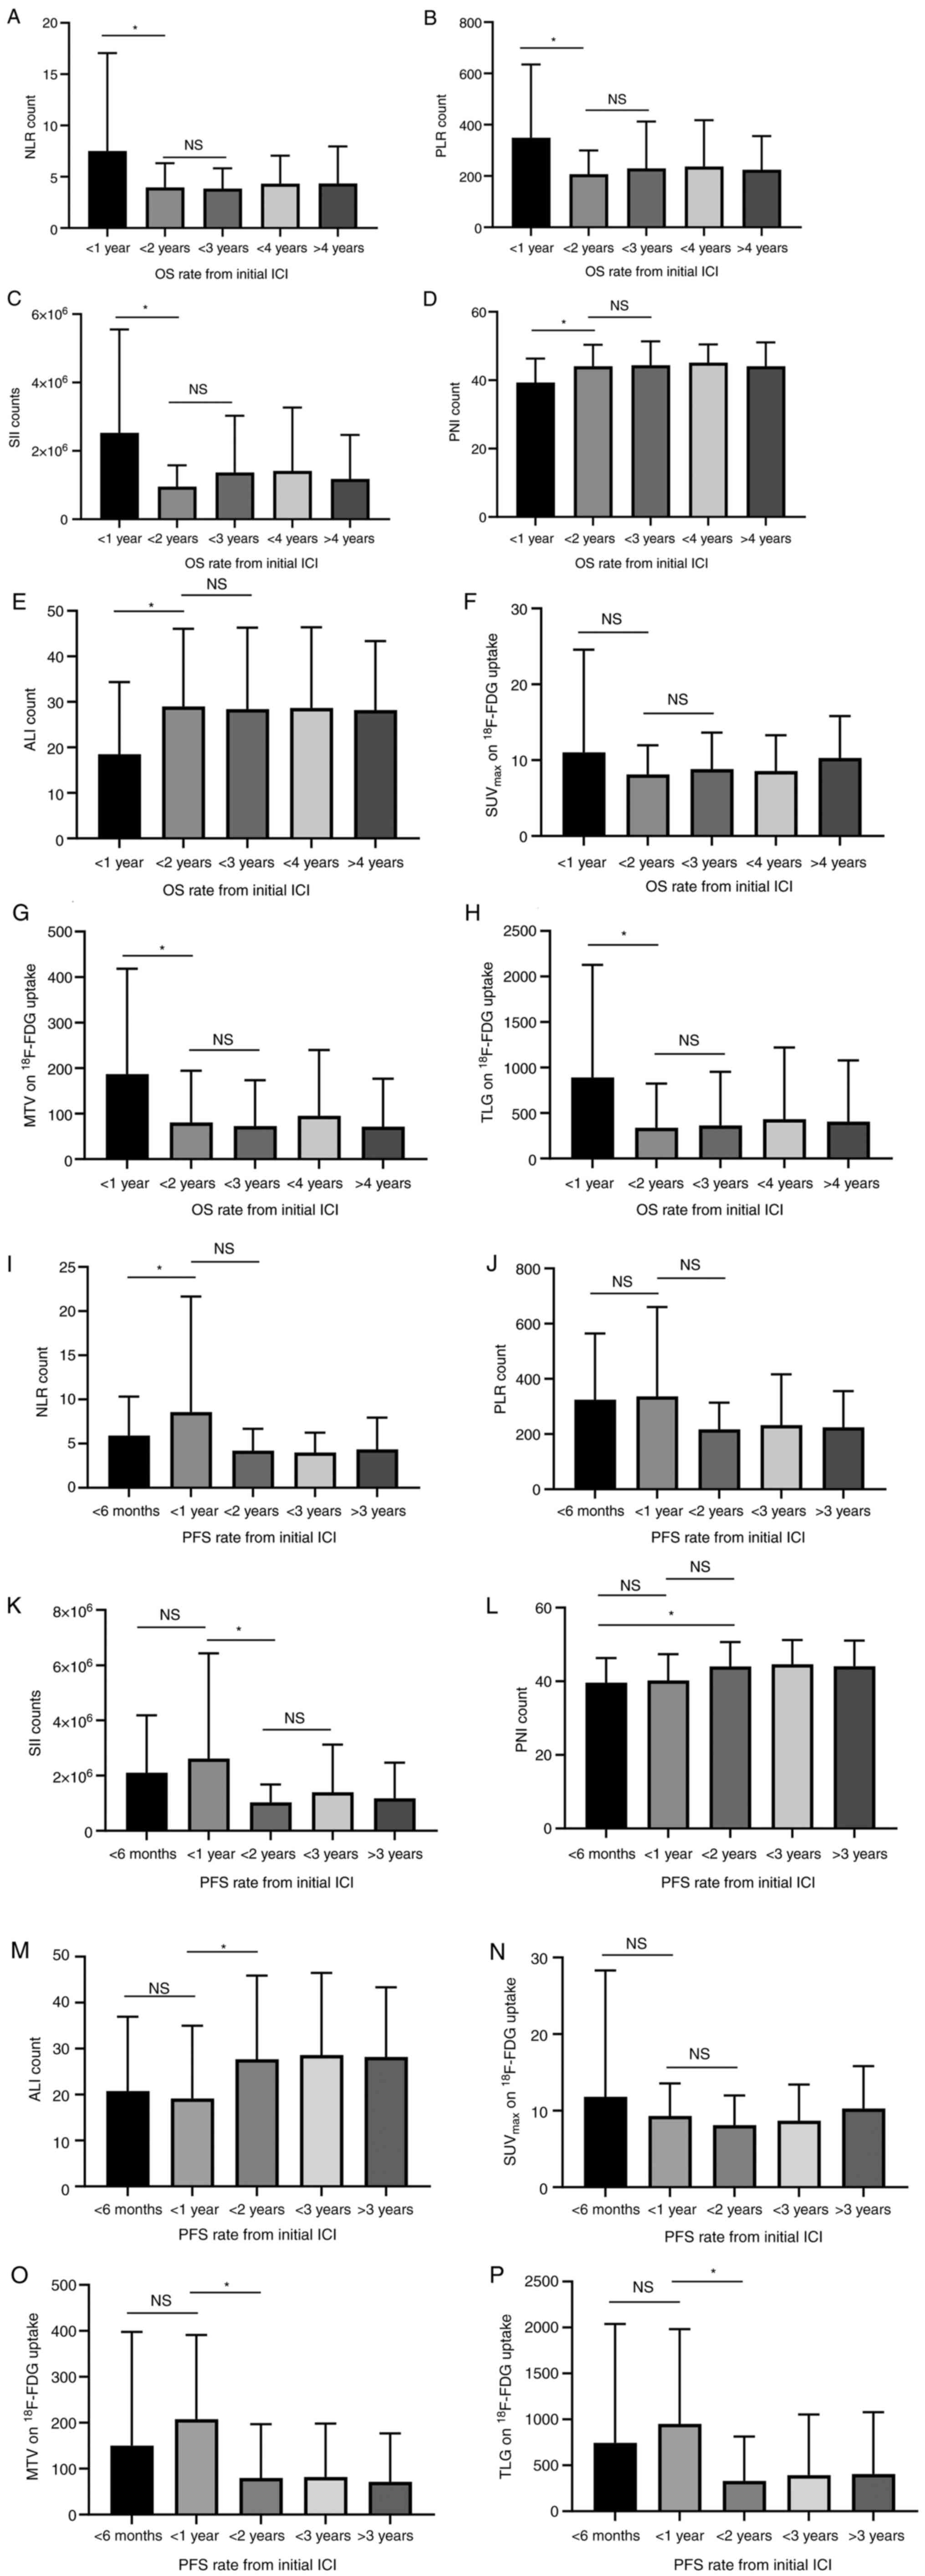 | Figure 1.Counting amount of inflammatory and
nutrition index was compared according to different survival rates.
The comparable assessment of (A) NLR, (B) PLR, (C) SII, (D) PNI,
(E) ALI, (F) SUVmax, (G) MTV and (H) TLG in the group of
<1, <2, <3, <4 and ≥4 years OS rate from the initial
treatment with ICIs was shown. A significant difference in the OS
was observed between the group of <1 and 2 years for NLR, PLR,
SII, PNI, ALI, MTV and TLG, but not between <2 and <3 years
for all groups. The assessment of (I) NLR, (J) PLR, (K) SII, (L)
PNI, (M) ALI, (N) SUVmax, (O) MTV and (P) TLG in the
group of <6 months and <1, <2, <3 and ≥3 years PFS rate
from initial treatment with ICIs was observed. There was
significantly different PFS between <6 months and <1 year for
NLR; between <1 and <2 years for SII, ALI, MTV and TLG; and
between <6 months and <2 years for PNI. *P<0.05. NS, not
significant; ICI, immune checkpoint inhibitor; OS, overall
survival; PFS, progression-free survival; NLR, neutrophil to
lymphocyte ratio; PLR, platelet to lymphocyte ratio; SII, systemic
immune inflammation index; PNI, prognostic nutrition index; ALI,
advanced lung cancer inflammation index; SUVmax, the
maximum of standardized uptake value; MTV, metabolic tumor volume;
TLG, total lesion glycolysis. |
Survival analysis in inflammatory and
nutrition index based on 18F-FDG uptake
Table III shows
the PFS and OS based on different variables in the univariate
analysis. PS, PNI, MTV, and TLG were significant predictors of PFS
in all patients, whereas PS, PLR, PNI, GPS, MTV, and TLG were
significantly associated with poor OS. PS, PNI, GPS, MTV, and TLG
were significant predictors of PFS and OS in patients who received
first-line therapy, whereas PS, PNI, and MTV were significant
predictors of PFS and OS in patients who received second-line
therapy.
| Table III.Progression-free and overall survival
according to different variables. |
Table III.
Progression-free and overall survival
according to different variables.
|
|
| Progression-free
survival [MST, days (P-value)] | Overall survival
[MST, days (P-value)] |
|---|
|
|
|
|
|
|---|
| Variables | Groups | Total therapy
(n=186) | First-line
(n=98) | Second or more
lines (n=88) | Total therapy
(n=186) | First-line
(n=98) | Second or more
lines (n=88) |
|---|
| Age | ≤69/>69
years | 165/201
(0.781) | 198/247
(0.607) | 121/199
(0.233) | 701/569
(0.567) | 599/428
(0.081) | 717/774
(0.494) |
| Sex | Male/Female | 200/125
(0.058) | 238/185
(0.090) | 181/75 (0.426) | 693/436
(0.225) | 564/468
(0.321) | 730/436
(0.468) |
| PS | 0-1/2 | 202/85 (0.011) | 255/164
(0.018) | 172/40 (0.025) | 710/165
(<0.001) | 613/208
(0.012) | 743/115
(0.022) |
| Histology | AC/non-AC | 199/164
(0.381) | 281/164
(0.085) | 146/161
(0.731) | 730/435
(0.186) | 699/362
(0.035) | 737/710
(0.871) |
| NLR | High/Low | 142/299
(0.089) | 204/203
(0.551) | 76/377 (0.041) | 499/837
(0.051) | 477/689
(0.299) | 518/917
(0.080) |
| PLR | High/Low | 139/204
(0.099) | 172/255
(0.389) | 94/204 (0.075) | 433/732
(0.047) | 468/613
(0.292) | 382/837
(0.088) |
| SII | High/Low | 176/299
(0.217) | 204/198
(0.408) | 125/372
(0.166) | 518/842
(0.094) | 486/727
(0.301) | 539/848
(0.235) |
| PNI | High/Low | 324/160
(0.001) | 544/172
(0.009) | 205/94 (0.035) | 890/440
(<0.001) | 908/412
(0.003) | 890/539
(0.039) |
| ALI | High/Low | 220/161
(0.320) | 449/198
(0.261) | 202/76 (0.341) | 837/468
(0.080) | 727/468
(0.203) | 856/476
(0.261) |
| GPS | High/Low | 139/202
(0.276) | 139/370
(0.006) | 149/161
(0.374) | 370/796
(0.030) | 307/789
(0.001) | 487/796
(0.742) |
|
SUVmax | High/Low | 191/382
(0.154) | 203/NR (0.268) | 129/382
(0.189) | 569/848
(0.176) | 534/NR (0.283) | 693/848
(0.406) |
| MTV | High/Low | 116/205
(0.003) | 164/320
(0.022) | 46/199
(<0.001) | 264/793
(<0.001) | 311/707
(0.005) | 144/833
(<0.001) |
| TLG | High/Low | 129/204
(0.042) | 136/314
(0.022) | 54/181 (0.223) | 303/730
(0.004) | 307/707
(0.007) | 210/793
(0.306) |
Next, the prognostic roles of the inflammatory and
nutritional indices according to 18F-FDG uptake were
analyzed (Tables IV and V). Overall, a high MTV was significantly
associated with poor PFS in patients with high NLR, PLR, SII, and
GPS, and low PNI and ALI (Table
IV). In first-line therapy, high MTV was closely associated
with poor PFS in the group with high PLR, high SII, and low ALI;
high TLG was also related to the outcome in patients with high SII
and low ALI (Table IV). In
second-line therapy or beyond, a high MTV was closely associated
with poor outcomes regardless of the PLR, SII, ALI, or GPS in the
group with a high NLR and low PNI (Table IV). In contrast, a high MTV yielded
a significantly poorer OS in the group with a high SII and GPS and
low PNI and ALI, regardless of the NLR and PLR in patients
receiving total therapy, and a high TLG was closely associated with
poor OS in patients with a high NLR and SII and low ALI (Table V). In first-line therapy, high MTV
was associated with significantly poor OS in patients with high
NLR, PLR, and SII, and low ALI, and high TLG was closely related to
poor OS in patients with high PLR and SII and low ALI (Table V). In second-line therapy or beyond,
high MTV was closely associated with poor OS regardless of NLR,
PLR, PNI, ALI, or GPS, except in the group with a high SII
(Table V).
| Table IV.Progression-free survival in
inflammatory and nutrition index according to different glucose
metabolic activity. |
Table IV.
Progression-free survival in
inflammatory and nutrition index according to different glucose
metabolic activity.
|
| Total therapy
(n=186) [MST, days (P-value)] | First-line (n=98)
[MST, days (P-value)] | Second or more
lines (n=88) [MST, days (P-value)] |
|---|
|
|
|
|
|
|---|
| Variables | n |
SUVmax, | MTV | TLG | n |
SUVmax | MTV | TLG | n |
SUVmax | MTV | TLG |
|---|
| NLR |
|
|
|
|
|
|
|
|
|
|
|
|
|
High | 130 | 146/125
(0.636) | 108/191
(0.034) | 116/181
(0.125) | 60 | 172/185
(0.185) | 134/320
(0.078) | 132/296
(0.137) | 58 | 75/143 (0.590) | 46/146 (0.001) | 52/127 (0.457) |
|
Low | 56 | 204/479
(0.457) | 198/372
(0.265) | 198/377
(0.710) | 38 | 203/NR (0.405) | 291/203
(0.708) | 194/294
(0.342) | 30 | 215/479
(0.793) | 89/382 (0.140) | 1079/377
(0.595) |
| PLR |
|
|
|
|
|
|
|
|
|
|
|
|
|
High | 94 | 138/161
(0.359) | 108/190
(0.017) | 129/172
(0.172) | 55 | 168/172
(0.196) | 136/320
(0.031) | 136/285
(0.064) | 39 | 75/142 (0.591) | 46/146 (0.001) | 52/127 (0.457) |
|
Low | 82 | 204/401
(0.412) | 191/220
(0.416) | 153/240
(0.523) | 43 | 281/160
(0.727) | 198/305
(0.563) | 153/356
(0.372) | 49 | 200/420
(0.346) | 59/205 (0.023) | 144/205
(0.830) |
| SII |
|
|
|
|
|
|
|
|
|
|
|
|
|
High | 14 | 181/161
(0.288) | 122/203
(0.016) | 129/202
(0.092) | 83 | 203/204
(0.195) | 151/320
(0.023) | 134/314
(0.022) | 57 | 102/143
(0.452) | 40/164
(<0.001) | 53/146 (0.476) |
|
Low | 46 | 213/401
(0.863) | 89/382 (0.432) | 143/377
(0.803) | 15 | 371/160
(0.941) | 198/352
(0.984) | 198/352
(0.984) | 31 | 213/420
(0.805) | 68/382 (0.035) | 89/377 (0.665) |
| PNI |
|
|
|
|
|
|
|
|
|
|
|
|
|
High | 58 | 234/NR (0.204) | 203/361
(0.847) | 148/361
(0.853) | 29 | 519/NR (0.445) | 308/621
(0.876) | 98/621 (0.637) | 29 | 202/822
(0.173) | 89/212 (0.214) | 199/212
(0.873) |
|
Low | 128 | 146/161
(0.716) | 116/181
(0.029) | 129/172
(0.210) | 69 | 178/160
(0.618) | 151/202
(0.148) | 138/200
(0.192) | 59 | 72/161 (0.984) | 45/161
(<0.001) | 49/149 (0.274) |
| ALI |
|
|
|
|
|
|
|
|
|
|
|
|
|
High | 63 | 204/401
(0.580) | 385/212
(0.909) | 482/220
(0.521) | 21 | 472/160
(0.893) | 765/326
(0.510) | 765/417
(0.756) | 42 | 200/400
(0.442) | 68/212 (0.015) | 199/204
(0.638) |
|
Low | 123 | 162/161
(0.297) | 116/205
(0.006) | 116/200
(0.033) | 77 | 194/198
(0.196) | 136/320
(0.013) | 134/296
(0.024) | 46 | 73/143 (0.426) | 40/135
(<0.001) | 48/113 (0.092) |
| GPS |
|
|
|
|
|
|
|
|
|
|
|
|
|
High | 88 | 152/47 (0.017) | 108/247
(0.002) | 116/204
(0.056) | 52 | 139/139
(>0.999) | 130/221
(0.098) | 130/200
(0.156) | 36 | 212/47 (0.037) | 37/360
(<0.001) | 52/220 (0.231) |
|
Low | 98 | 200/420
(0.100) | 237/201
(0.867) | 198/204
(0.788) | 46 | 370/NR (0.538) | 308/449
(0.889) | 371/417
(0.774) | 52 | 114/420
(0.007) | 61/172 (0.002) | 82/162 (0.417) |
| Table V.Overall survival in inflammatory and
nutrition index according to different glucose metabolic
activity. |
Table V.
Overall survival in inflammatory and
nutrition index according to different glucose metabolic
activity.
|
| Total therapy
(n=186) [MST, days (P-value)] | First-line (n=98)
[MST, days (P-value)] | Second or more
lines (n=88) [MST, days (P-value)] |
|---|
|
|
|
|
|
|---|
| Variables | n |
SUVmax | MTV | TLG | n |
SUVmax | MTV | TLG | n |
SUVmax | MTV | TLG |
|---|
| NLR |
|
|
|
|
|
|
|
|
|
|
|
|
|
High | 130 | 513/452
(0.381) | 237/685
(0.001) | 264/589
(0.016) | 60 | 431/449
(0.187) | 277/870
(0.035) | 270/711
(0.054) | 58 | 346/731
(0.644) | 177/730
(0.002) | 210/476
(0.651) |
|
Low | 56 | 768/869
(0.712) | 444/865
(0.014) | 764/837
(0.957) | 38 | 689/NR (0.548) | 590/689
(0.335) | 557/717
(0.235) | 30 | 1034/869
(0.753) | 140/945
(<0.001) | 1611/877
(0.248) |
| PLR |
|
|
|
|
|
|
|
|
|
|
|
|
|
High | 94 | 411/1027
(0.273) | 270/711
(0.002) | 303/660
(0.068) | 55 | 449/468
(0.196) | 307/711
(0.027) | 307/711
(0.036) | 39 | 346/731
(0.644) | 177/730
(0.002) | 210/476
(0.651) |
|
Low | 82 | 711/842
(0.597) | 198/830
(0.031) | 321/796
(0.277) | 43 | 642/412
(0.831) | 444/689
(0.217) | 613/613
(>0.999) | 49 | 796/848
(0.696) | 131/848
(<0.001) | 584/837
(0.911) |
| SII |
|
|
|
|
|
|
|
|
|
|
|
|
|
High | 14 | 516/1027
(0.201) | 237/711
(<0.001) | 277/660
(0.007) | 83 | 477/486
(0.208) | 307/671
(0.004) | 303/685
(0.006) | 57 | 539/731
(0.433) | 135/730
(<0.001) | 208/589
(0.461) |
|
Low | 46 | 832/842
(0.782) | 724/848
(0.619) | 843/842
(0.640) | 15 | 844/412
(0.921) | 962/717
(0.849) | 962/717
(0.849) | 31 | 832/848
(0.848) | 432/865
(0.055) | 724/856
(0.771) |
| PNI |
|
|
|
|
|
|
|
|
|
|
|
|
|
High | 58 | 853/NR (0.352) | 593/903
(0.626) | 865/890
(0.889) | 29 | 817/NR (0.630) | 701/908
(0.811) | 701/908
(0.896) | 29 | 914/890
(0.326) | 140/959
(<0.001) | 1029/869
(0.814) |
|
Low | 128 | 435/710
(0.926) | 210/693
(<0.001) | 264/589
(0.025) | 69 | 419/412
(0.715) | 290/559
(0.059) | 277/564
(0.058) | 59 | 520/773
(0.801) | 149/713
(<0.001) | 208/693
(0.359) |
| ALI |
|
|
|
|
|
|
|
|
|
|
|
|
|
High | 63 | 799/842
(0.985) | 737/837
(0.868) | 943/830
(0.196) | 21 | 732/412
(0.850) | 857/642
(0.550) | 857/670
(0.631) | 42 | 865/848
(0.991) | 432/877
(0.049) | 1029/848
(0.247) |
|
Low | 123 | 456/1027
(0.189) | 209/711
(<0.001) | 210/683
(0.001) | 77 | 456/468
(0.203) | 290/711
(0.004) | 277/707
(0.007) | 46 | 453/731
(0.400) | 135/648
(<0.001) | 177/560
(0.072) |
| GPS |
|
|
|
|
|
|
|
|
|
|
|
|
|
High | 88 | 399/170
(0.139) | 160/614
(<0.001) | 206/559
(0.013) | 52 | 307/307
(>0.999) | 236/536
(0.067) | 236/536
(0.072) | 36 | 627/170
(0.091) | 115/797
(<0.001) | 149/716
(0.264) |
|
Low | 98 | 727/890
(0.224) | 701/837
(0.364) | 712/814
(0.932) | 46 | 789/NR (0.662) | 737/870
(0.678) | 771/803
(0.797) | 52 | 693/890
(0.112) | 278/833
(0.003) | 535/814
(0.798) |
Discussion
Metabolic tumor activity, based on
18F-FDG uptake within tumor tissues, is closely
correlated with inflammatory and nutritional status. As our
enrolled samples included the population receiving first- and
second-line therapies or beyond, previous treatment may have
affected the inflammatory and nutritional status. In the survival
analysis, PNI was identified as a poor outcome regardless of the
different therapeutic lines; however, GPS was related to poor
outcomes in the first-line therapy, and NLR and PLR showed a weak
relationship with poor outcomes in our population. Generally,
systemic inflammation and nutrition play crucial roles in cancer
development, therapeutic effects, and cancer cachexia (24). A comparison of different types of
inflammatory and nutritional markers in lung cancer identified ALI
as the most suitable predictor of the outcome (25). However, a previous study indicated
that systemic inflammation or nutritional status is prognostic and
independent of immunotherapy (11).
Similarly, the results of the present study suggest that these
markers are prognostic, but not predictive of immunotherapy for
advanced NSCLC (11). In this
study, systemic inflammatory and nutritional indices partially
exhibited a prognostic role in the clinical course after PD-1
blockade treatment, whereas MTV or TLG on 18F-FDG uptake
were confirmed to be prognostic after administration, which is
consistent with our previous reports (5,6,8). Our
study focused on the prognostic significance of PD-1 blockade in
systemic inflammatory and nutritional indices based on different
glucose metabolic activities. Resistance to immunotherapy may occur
when metabolic tumor activity is markedly increased in environments
with high inflammation and low nutrition. This phenomenon was
observed in patients who received PD-1 blockade not as a
second-line therapy, but as a first-line setting. Systemic
chemotherapy and radiotherapy can affect the tumor environment
(26). We hypothesized that prior
chemotherapy could potentially affect the inflammatory and
nutritional environments in the same way. Further large-scale
studies are warranted to elucidate which combination of
inflammatory and nutritional environments and tumor glycolytic
metabolism is best for predicting ICIs.
Based on our survival data, high MTV with high PLR
and SII and low ALI in the first-line setting seemed to be more
predictive of ICI treatment than other combinations. In the
second-line setting or beyond, the prognostic relationship between
metabolic tumor glycolysis and the inflammatory or nutritional
environment remains unclear. Dolan et al reported that
elevated tumor metabolic activity determined by TLG was associated
with greater nutritional risk (GPS) and systemic inflammatory
response (NLR) in patients with NSCLC (14). As a plausible mechanism, tumor
hypoxia with necrosis arising from metabolic tumor activity
stimulates the production of proinflammatory cytokines such as
interleukin-6 and CRP (24,27). Furthermore, the systemic
inflammatory response reflects tumor immune cytokine activity and
decreased nutritional status, such as appetite loss or fatigue
(28,29). Thus, tumor hypoxia and a tumor
environment with inflammatory infiltration may induce disorders in
tumor immune cells, contributing to resistance to immunotherapy.
The association between tumor metabolic glycolysis measured by MTV
and inflammatory/nutritional indices measured by PLR, SII, PNI, and
ALI remains unclear. Although indices that can accurately reflect
the inflammatory or nutritional status related to immunotherapy are
known, many challenges must be addressed before the discovery of
established biomarkers for immunotherapy.
Our study suggests that metabolic tumor glycolysis
under different inflammatory and nutritional conditions has
different effects on the outcome after ICI treatment between first-
and second-line settings or beyond. Currently, most candidates for
ICI treatment undergo first-line immunotherapy and have not been
treated previously. Evidence to explain this discrepancy is
insufficient, but the influence of prior chemotherapy on the
inflammatory or nutritional status can be speculated.
In the present study, we found that drug-induced
lung injury and grade 3 or 4 irAEs were not significantly
associated with high levels of inflammatory or nutritional markers
or 18F-FDG uptake. Previous reports have shown that
drug-induced lung injury caused by ICIs worsens the prognosis of
patients with NSCLC (30,31). Furthermore, drug-induced lung injury
occurs more frequently in groups with high CRP, SUVmax,
or GPS (32–34). However, these studies had small
sample sizes, which may have biased the relationship between CRP
level, SUVmax, or GPS and the frequency of drug-induced
lung injury. Patients with irAEs experience survival benefits from
PD-1 blocker (35). The close
relationship between irAEs and inflammatory and nutritional markers
in patients with NSCLC remains unclear.
Our study has several limitations. First, sample
collection was based on our previous approach. Therefore, the
heterogeneous population might have biased the results. Second, the
assessment of 18F-FDG uptake was inconsistent among all
enrolled patients because of the pooled analysis of different
studies (5,6,8).
Furthermore, CRP and neutrophil levels are increased, and albumin
and lymphocyte levels are decreased in several complications, such
as obstructive pneumonia, thrombosis, and interstitial pneumonia,
in addition to lung cancer. Thus, the influence of these
complications may be the reason why inflammatory markers could not
predict the therapeutic response in our study. Finally, the optimal
index reflecting the inflammatory and nutritional status remains
unclear. A previous study evaluated several types of scores for
inflammatory and nutritional status; however, it was difficult to
determine the appropriate index.
In conclusion, metabolic tumor glycolysis determined
by MTV on 18F-FDG uptake was identified as a promising
predictor of the outcome of PD-1 blockade under conditions of
increased inflammation and decreased nutritional status,
particularly in the first-line setting. A high MTV under high PLR
and SII and low ALI in the first-line setting could be more
predictive of ICI treatment than other combinations. Further
investigation is warranted to confirm the results of this
prospective study.
Supplementary Material
Supporting Data
Acknowledgements
The authors would like to thank Ms Kozue Watanabe,
Ms Chieko Ono, Ms Saki Toita, Ms Hiroko Noguchi, Mr. Joji Shiotani
and Ms Koko Kodaira in Saitama Medical University (Hidaka, Japan)
for assistance in preparing the manuscript.
Funding
Funding: No funding was received.
Availability of data and materials
The datasets generated and/or analyzed during the
present study are available from the corresponding author upon
reasonable request.
Authors' contributions
KI, KH and KKa conceived and designed the study, and
prepared the manuscript. HI, AM, AS, YM, HK and OY contributed to
acquisition of data. KH, KKo, HK and IK performed analysis and
interpretation of data. KI, KKa, KH, KKo, IK and HK revised the
manuscript. KI, KH and KKa confirm the authenticity of all the raw
data. All authors deeply contributed and agreed with the content of
the manuscript.
Ethics approval and consent to
participate
This study was approved by the Institutional Ethics
Committee of the International Medical Center at Saitama Medical
University. The requirement for written informed consent was waived
by the Ethics Committee of Saitama Medical University because of
the retrospective nature of the study
Patient consent for publication
Not applicable.
Competing interests
KKa has received a speaker honorarium from Ono
Pharmaceutical Co., Ltd., Chugai Pharmaceutical Co., Ltd. and
AstraZeneca, and received research grants from AstraZeneca. AM and
OY have received a speaker honorarium from Chugai Pharmaceutical
Co., Ltd. and AstraZeneca. HK has received research grants and a
speaker honorarium from Ono Pharmaceutical Co., Ltd., Bristol-Myers
Squibb, Boehringer Ingelheim, Merck Sharp and Dohme, Chugai
Pharmaceutical Co., Ltd. and AstraZeneca. KKo has received research
grants and a speaker honorarium from AstraZeneca, and Bristol-Myers
Squibb.
References
|
1
|
Hastings K, Yu HA, Wei W, Sanchez-Vega F,
DeVeaux M, Choi J, Rizvi H, Lisberg A, Truini A, Lydon CA, et al:
EGFR mutation subtypes and response to immune checkpoint blockade
treatment in non-small-cell lung cancer. Ann Oncol. 30:1311–1320.
2019. View Article : Google Scholar : PubMed/NCBI
|
|
2
|
Ready N, Hellmann MD, Awad MM, Otterson
GA, Gutierrez M, Gainor JF, Borghaei H, Jolivet J, Horn L, Mates M,
et al: First-line nivolumab plus ipilimumab in advanced
non-small-cell lung cancer (CheckMate 568): Outcome by programmed
death ligand 1 and tumor mutational burden as biomarkers. J Clin
Oncol. 37:992–1000. 2019. View Article : Google Scholar : PubMed/NCBI
|
|
3
|
Kagamu H, Kitano S, Yamaguchi O, Yoshimura
K, Horimoto K, Kitazawa M, Fukui K, Shiono A, Mouri A, Nishihara F,
et al: CD4+ T-cell immunity in the peripheral blood
correlates with response to anti-PD-1 therapy. Cancer Immunol Res.
8:334–344. 2020. View Article : Google Scholar : PubMed/NCBI
|
|
4
|
Kaira K, Yamaguchi O, Kawasaki T,
Hashimoto K, Miura Y, Shiono A, Mouri A, Imai H, Kobayashi K,
Yasuda M, et al: Prognostic significance of tumor infiltrating
lymphocytes on first–line pembrolizumab efficacy in advanced
non–small cell lung cancer. Discov Oncol. 14:62023. View Article : Google Scholar : PubMed/NCBI
|
|
5
|
Yamaguchi O, Kaira K, Hashimoto K, Mouri
A, Shiono A, Miura Y, Murayama Y, Kobayashi K, Kagamu H and Kuji I:
Tumor metabolic volume by 18F-FDG-PET as a prognostic
predictor of first-line pembrolizumab for NSCLC patients with
PD-L1≧50. Sci Rep. 10:149902020. View Article : Google Scholar : PubMed/NCBI
|
|
6
|
Hashimoto K, Kaira K, Yamaguchi O, Mouri
A, Shiono A, Miura Y, Murayama Y, Kobayashi K, Kagamu H and Kuji I:
Potential of FDG-PET as prognostic significance after anti-PD-1
antibody against patients with previously treated non-small cell
lung cancer. J Clin Med. 9:7252020. View Article : Google Scholar : PubMed/NCBI
|
|
7
|
Kaira K, Kuji I and Kagamu H: Value of
F-FDG-PET to predict PD-L1 expression and outcomes of PD-1
inhibition therapy in human cancers. Cancer Imaging. 21:112021.
View Article : Google Scholar : PubMed/NCBI
|
|
8
|
Hashimoto K, Kaira K, Imai H, Mouri A,
Shiono A, Miura Y, Yamaguchi O, Kobayashi K, Kagamu H and Kuji I:
Prognostic potential of metabolic activity on 18 F–FDG Accumulation
in advanced NSCLC receiving combining chemotherapy plus PD–1
Blockade. J Immunother. 45:349–357. 2022. View Article : Google Scholar : PubMed/NCBI
|
|
9
|
Umeda Y, Morikawa M, Anzai M, Ameshima S,
Kadowaki M, Waseda Y, Shigemi H, Tsujikawa T, Kiyono Y, Okazawa H
and Ishizuka T: Predictive value of integrated 18F-FDG
PET/MRI in the early response to nivolumab in patients with
previously treated non-small cell lung cancer. J Immunother Cancer.
8:e0003492020. View Article : Google Scholar : PubMed/NCBI
|
|
10
|
Kaira K, Higuchi T, Naruse I, Arisaka Y,
Tokue A, Altan B, Suda S, Mogi A, Shimizu K, Sunaga N, et al:
Metabolic activity by 18F-FDG-PET/CT is predictive of
early response after nivolumab in previously treated NSCLC. Eur J
Nucl Med Mol Imaging. 45:56–66. 2018. View Article : Google Scholar : PubMed/NCBI
|
|
11
|
Mahiat C, Bihin B, Duplaquet F, Stanciu
Pop C, Dupont M, Vander Borght T, Rondelet B, Vanderick J, André B,
Pirard L, et al: Systemic inflammation/nutrition status scores are
prognostic but not predictive in metastatic non-small-cell lung
cancer treated with first-line immune checkpoint inhibitors. Int J
Mol Sci. 24:36182023. View Article : Google Scholar : PubMed/NCBI
|
|
12
|
Seban RD, Assie JB, Giroux-Leprieur E,
Massiani MA, Bonardel G, Chouaid C, Deleval N, Richard C, Mezquita
L, Girard N, et al: Prognostic value of inflammatory response
biomarkers using peripheral blood and [18F]-FDG PET/CT in advanced
NSCLC patients treated with first-line chemo- or immunotherapy.
Lung Cancer. 159:45–55. 2021. View Article : Google Scholar : PubMed/NCBI
|
|
13
|
Kaira K, Oriuchi N, Otani Y, Yanagitani N,
Sunaga N, Hisada T, Ishizuka T, Endo K and Mori M: Diagnostic
usefulness of fluorine-18-alpha-methyltyrosine positron emission
tomography in combination with 18F-fluorodeoxyglucose in
sarcoidosis patients. Chest. 131:1019–1027. 2007. View Article : Google Scholar : PubMed/NCBI
|
|
14
|
Dolan RD, Maclay JD, Abbass T, Colville D,
Buali F, MacLeod N, McSorley ST, Horgan PG and McMillan DC: The
relationship between 18F-FDG-PET CT-derived tumour
metabolic activity, nutritional risk, body composition, systemic
inflammation and survival in patients with lung cancer. Sci Rep.
10:208192020. View Article : Google Scholar : PubMed/NCBI
|
|
15
|
Eba J and Nakamura K: Overview of the
ethical guidelines for medical and biological research involving
human subjects in Japan. Jpn J Clin Oncol. 52:539–544. 2022.
View Article : Google Scholar : PubMed/NCBI
|
|
16
|
Gandhi L, Rodríguez–Abreu D, Gadgeel S,
Esteban E, Felip E, De Angelis F, Domine M, Clingan P, Hochmair MJ,
Powell SF, et al: Pembrolizumab plus chemotherapy in metastatic
non-small-cell lung cancer. N Engl J Med. 378:2078–2092. 2018.
View Article : Google Scholar : PubMed/NCBI
|
|
17
|
Paz-Ares L, Luft A, Vicente D, Tafreshi A,
Gümüş M, Mazières J, Hermes B, Çay Şenler F, Csőszi T, Fülöp A, et
al: Pembrolizumab plus chemotherapy for squamous non-small-cell
lung cancer. N Engl J Med. 379:2040–2051. 2018. View Article : Google Scholar : PubMed/NCBI
|
|
18
|
Socinski MA, Jotte RM, Cappuzzo F, Orlandi
F, Stroyakovskiy D, Nogami N, Rodríguez-Abreu D, Moro-Sibilot D,
Thomas CA, Barlesi F, et al: Atezolizumab for first-line treatment
of metastatic nonsquamous NSCLC. N Engl J Med. 378:2288–2301. 2018.
View Article : Google Scholar : PubMed/NCBI
|
|
19
|
Eisenhauer EA, Therasse P, Bogaerts J,
Schwartz LH, Sargent D, Ford R, Dancey J, Arbuck S, Gwyther S,
Mooney M, et al: New response evaluation criteria in solid tumour:
Revised RECIST guideline (version 1.1). Eur J Cancer. 45:228–247.
2009. View Article : Google Scholar : PubMed/NCBI
|
|
20
|
Imai H, Kishikawa T, Minemura H, Yamada Y,
Ibe T, Yamaguchi O, Mouri A, Hamamoto Y, Kanazawa K, Kasai T, et
al: Pretreatment Glasgow prognostic score predicts survival among
patients with high PD-L1 expression administered first-line
pembrolizumab monotherapy for non-small cell lung cancer. Cancer
Med. 10:6971–6984. 2021. View Article : Google Scholar : PubMed/NCBI
|
|
21
|
Platini H, Ferdinand E, Kohar K, Prayogo
SA, Amirah S, Komariah M and Maulana S: Neutrophil-to-Lymphocyte
ratio and Platelet-to-Lymphocyte ratio as prognostic markers for
advanced non-small-cell lung cancer treated with immunotherapy: A
systemic review and meta-analysis. Medicina (Kanuas). 58:10692022.
View Article : Google Scholar
|
|
22
|
Hu B, Yang XR, Xu Y, Sun YF, Sun C, Guo W,
Zhang X, Wang WM, Qiu SJ, Zhou J and Fan J: Systemic
immune-inflammation index predicts prognosis of patients after
curative resection for hepatocellular carcinoma. Clin Cancer Res.
20:6212–6222. 2014. View Article : Google Scholar : PubMed/NCBI
|
|
23
|
Jafri SH, Shi R and Mills G: Advance lung
cancer inflammation index (ALI) at diagnosis is a prognostic marker
in patients with metastatic non-small cell lung cancer (NSCLC): A
retrospective review. BMC Cancer. 13:1582013. View Article : Google Scholar : PubMed/NCBI
|
|
24
|
Guthrie GJ, Roxburgh CS, Richards CH,
Horgan PG and McMillan DC: Circulating IL-6 concentrations link
tumour necrosis and systemic and local inflammatory responses in
patients undergoing resection for colorectal cancer. Br J Cancer.
109:131–137. 2013. View Article : Google Scholar : PubMed/NCBI
|
|
25
|
Song M, Zhang Q, Song C, Liu T, Zhang X,
Ruan G, Tang M, Xie H, Zhang H, Ge Y, et al: The advanced lung
cancer inflammation index is the optimal inflammatory biomarker of
overall survival in patients with lung cancer. J Cachexia
Sarcopenia Muscle. 13:2504–2514. 2022. View Article : Google Scholar : PubMed/NCBI
|
|
26
|
Wang X, Teng F, Kong L and Yu J: PD-L1
expression in human cancers and its association with clinical
ouctomes. Onco Targets Ther. 9:5023–5039. 2016. View Article : Google Scholar : PubMed/NCBI
|
|
27
|
O'Callaghan DS, O'Donnell D, O'Connell F
and O'Byrne KJ: The role of inflammation in the pathogenesis of
non-small cell lung cancer. J Thorac Oncol. 5:2024–2036. 2010.
View Article : Google Scholar : PubMed/NCBI
|
|
28
|
Diakos CI, Charless KA, McMillan DC and
Clarke SJ: Cancer-related inflammation and treatment effectiveness.
Lancet Oncol. 15:e495–503. 2014. View Article : Google Scholar
|
|
29
|
Laird BJA, Fallon M, Hjermstad MJ, Tuck S,
Kaasa S, Klepstad P and McMillan DC: Quality of life in patients
with advanced cancer: Different association with performance status
and systemic inflammatory response. J Clin Oncol. 34:2769–2775.
2016. View Article : Google Scholar : PubMed/NCBI
|
|
30
|
Suresh K, Psoter KJ, Voong KR, Shankar B,
Forde PM, Ettinger DS, Marrone KA, Kelly RJ, Hann CL, Levy B, et
al: Impact of checkpoint inhibitor pneumonitis on survival in NSCLC
patients receiving immune checkpoint immunotherapy. J Thorac Oncol.
14:494–502. 2019. View Article : Google Scholar : PubMed/NCBI
|
|
31
|
Gomatou G, Tzilas V, Kotteas E, Syrigos K
and Bouros D: Immune checkpoint inhibitor-related pneumonitis.
Respiration. 99:932–942. 2020. View Article : Google Scholar : PubMed/NCBI
|
|
32
|
Minegishi Y, Takenaka K, Mizutani H, Sudoh
J, Noro R, Okano T, Azuma A, Yoshimura A, Ando M, Tsuboi E, et al:
Exacerbation of idiopathic interstitial pneumonias associated with
lung cancer therapy. Intern Med. 48:665–672. 2009. View Article : Google Scholar : PubMed/NCBI
|
|
33
|
Akaike K, Saruwatari K, Oda S, Shiraishi
S, Takehashi H, Hamada S, Iyama S, Horio Y, Yusuke T, Saeki S, et
al: Predictive value of 18F-FDG PET/CT for acute
exacerbation of interstitial lung disease in patients with lung
cancer and interstitial lung disease treated with chemotherapy. Int
J Clin Oncol. 25:681–690. 2020. View Article : Google Scholar : PubMed/NCBI
|
|
34
|
Kikuch R, Takoi H, Tsuji T, Nagatomo Y,
Tanake A, Kinoshita H, Ono M, Ishiwari M, Kazutoshi T, Kono Y, et
al: Glasgow prognostic score predicts chemotherapy-triggered acute
exacerbation-interstitial lung disease in patients with non-small
cell lung cancer. Thorac Cancer. 12:667–675. 2021. View Article : Google Scholar : PubMed/NCBI
|
|
35
|
Haratani K, Hayashi H, Chiba Y, Kudo K,
Yonesaka K, Kato R, Kaneda H, Hasegawa Y, Tanaka K, Takeda M and
Nakagawa K: Association of Immune-related adverse events with
nivolumab efficacy in non-small-cell lung cancer. JAMA Oncol.
4:378. 2018. View Article : Google Scholar
|


