Introduction
Soft tissue sarcoma (STS) constitutes a rare group
of heterogenous tumors, accounting for ~1% of all adult
malignancies globally (1). STS
often originates from mesenchymal tissues and displays multifarious
clinical behaviors (2). In a
previous study, elderly patients with STS exhibited a 5-year
relative survival rate of <50%, indicating a high risk of death
(3). At present, surgery remains
the first option for STS treatment (4); however, STS is often diagnosed
following pathological assessment of tissues in resection surgery,
and late diagnosis may impact STS treatment. In addition, STS
exhibits a high susceptibility to distant metastasis and
recurrence. The results of a previous study demonstrated that ~50%
of patients with localized STS experienced distant metastasis,
predominantly affecting the lungs, which resulted in a poor
prognosis (5). Thus, the
identification of novel therapeutic targets, as well as dependable
diagnostic and prognostic factors, is crucial to achieve effective
and personalized treatment.
The extracellular matrix (ECM) serves as a crucial
anchor for healthy epithelial cells, while also providing essential
signals for maintaining cell integrity, including the promotion of
proliferation, differentiation and apoptosis. Following detachment
from the ECM, cells undergo anoikis, a type of caspase-mediated
apoptosis. Cells may exhibit a broad range of responses to a loss
of adhesion, and these include diverse signaling and apoptotic
pathways, such as the MAPK/ERK, PI3K/Akt and JNK signaling
pathways, the death receptor pathways and the mitochondrial
pathways (6,7). Following detachment from the cancer
primary lesion, malignant cells undergo anoikis and are eliminated;
however, a small subset of cells may evade anoikis through
reprogramming intrinsic signals, enabling them to survive the
invasion, recycling and extravasation stages, which are
collectively referred to as anchorage-independent growth. This
process ultimately leads to the formation of distant metastases
(8). The development of anoikis
resistance in aggressive tumor cells is recognized as a key factor
contributing to tumor progression (9–11). The
results of a previous study on osteosarcoma demonstrated an
association between anoikis-related genes (ARGs) and prognosis and
the immune landscape. However, to the best of our knowledge, the
specific association between anoikis and STS has yet to be fully
understood.
In mammalian cells, CASP8 and FADD-like apoptosis
regulator (CFLAR), also known as c-Flip, is an important regulatory
protein in the extrinsic apoptotic pathway (12). Several transcript variants encoding
different isoforms have previously been reported. The short form,
CFLAR, contains two N-terminal death effector domains, whereas the
long form, CFLARL, contains an additional pseudo-caspase domain, in
which the active center cysteine residue that confers the
proteolytic activity of caspases is substituted by a tyrosine
residue (13). CFLAR serves a
critical role in fundamental intracellular processes, such as
inflammation and apoptosis (14,15).
CFLAR has also been regarded as a potential therapeutic target in
various types of cancer (16). The
results of a previous study detected elevated protein expression
levels of CFLAR in lung metastatic osteosarcoma compared with those
in primary tumors (17). However,
the protein expression profile and mechanism of action of CFLAR in
STS are poorly understood, and further investigations are
required.
The present study employed three machine learning
algorithms, namely, Least Absolute Shrinkage and Selection Operator
(LASSO), Support Vector Machine (SVM) and Random Forest (RF), to
identify CFLAR from genes associated with STS (ARGs). The aim of
the study was to explore the diagnostic and prognostic value of
CFLAR in STS and to investigate the effects of CFLAR on the STS
tumor microenvironment (TME). Through these approaches, we seek to
deepen our understanding of the role of CFLAR in the progression of
STS and to provide new insights into the diagnosis and treatment of
STS.
Materials and methods
Raw data
The Cancer Genome Atlas (TCGA)-SARC RNA sequencing
(RNA-seq) data from 265 cases of STS (healthy samples, 2 cases;
tumor samples, 263 cases), corresponding data on the clinical
characteristics of 256 cases (those with complete data) from TCGA,
and RNA-seq data from 911 healthy cases (healthy muscle and adipose
tissue) from the Genotype-Tissue Expression (GTEx) database were
downloaded from UCSC Xena database (https://xenabrowser.net/datapages/). Notably, the two
aforementioned datasets were merged into one dataset for subsequent
experiments, referred to as GTEx~TCGA-SARC. RNA-seq and clinical
data from 24 liposarcoma cases and 16 malignant peripheral nerve
sheath tumor cases in GSE17118 (18), RNA-seq data from 149 liposarcoma
cases and 9 healthy cases in GSE21124 (19) and single cell RNA-Seq data of 16,872
cells from 12 human synovial sarcoma cases in GSE131309 (20) were obtained from the Gene Expression
Omnibus (GEO) database (https://www.ncbi.nlm.nih.gov/geo/).
Differential expression analysis and
acquisition of ARGs
GTEx~TCGA-SARC was used for the differential
analysis of STS and healthy tissue samples. The analysis was
conducted using the ‘limma’ R Package (https://bioconductor.org/packages/release/bioc/html/limma.html)
(21) following normalization, and
a filter was applied to obtain significantly differentially
expressed genes (|log fold change|>1 and adjusted P<0.05). In
addition, a list of ARGs was obtained from GeneCards (https://www.genecards.org/) and Harmonizome
(https://maayanlab.cloud/Harmonizome/).
Identification and validation of
diagnostic markers that distinguish between healthy tissue and
STS
To identify novel biomarkers for STS in the
GTEx~TCGA-SARC dataset, three different machine learning
algorithms, LASSO, RF and SVM, were utilized (22–24).
LASSO logistic regression with low lambda was conducted using the
‘glmnet’ package in R statistical software (https://CRAN.R-project.org/package=glmnet) (25), and the RF analysis was performed
using the ‘randomForest’ package (https://CRAN.R-project.org/package=randomForest)
(26). The SVM classifier was
created using the ‘e1071’ package (https://CRAN.R-project.org/package=e1071) (27). The overlapping genes of the three
models were subsequently identified. The Gini coefficient method in
RF was used to determine the significance index of genetic
variables. To evaluate the effectiveness of the significant
biomarkers, the validation set GSE21124 was utilized, and receiver
operating characteristic (ROC) curve analyses were conducted. The
predictive ability of the algorithm was assessed through measuring
the area under the curve (AUC). P<0.05 was considered to
indicate a statistically significant difference.
Cox regression analysis
In the analysis of the TCGA-SARC dataset, a total of
132 patients with complete clinical information were selected. The
‘survival’ package in R statistical software was employed to
perform both univariate and multivariate Cox regression analyses
(https://CRAN.R-project.org/package=survival) (28). Univariate Cox regression analysis
was used to identify the potential association between ARGs and STS
prognosis, and the multivariate Cox regression analysis was used to
determine the potential independent prognostic significance of
CFLAR in STS. In addition, all variables included in the
multivariate Cox regression analysis met the assumption of
proportional hazards.
Survival analysis and time-ROC
Survival analysis was conducted using the
‘Survminer’ package in R statistical software (https://CRAN.R-project.org/package=survminer)
(29). The data sets used were
TCGA-SARC and GSE17118. The Kaplan-Meier (KM) method was used to
generate a survival curve and the log-rank test was applied to
assess the statistical significance. P<0.05 was considered to
indicate a statistically significant difference. Time-ROC was
conducted using the ‘timeROC’ package in R statistical software
(https://CRAN.R-project.org/package=timeROC) (30). Notably, 1-, 3- and 5-year ROC curves
were plotted, and the corresponding AUCs were calculated. Curves of
AUC over time were also plotted.
Immune infiltration and function
analysis
Using CIBERSORTx analysis (https://cibersortx.stanford.edu/index.php) with a
‘PERM’ parameter set to 1,000 and a P-value cut-off of <0.05,
the level of immune cell infiltration was measured in STS samples
of TCGA-SARC. The samples were stratified into high and low CFLAR
expression groups based on the median CFLAR expression value in the
TCGA-SARC cohort. The relative proportions of individual immune
cell types were calculated within the samples. Subsequently, a
boxplot of 22 immune cell abundances was generated using the
‘ggpubr’ package (https://CRAN.R-project.org/package=ggpubr) (31). Spearman's rank correlation
coefficient was performed to determine the potential association
between immune cell infiltration and CFLAR expression, and dot-line
and lollipop charts were generated accordingly. Single sample gene
set enrichment analysis implemented in the R statistical software
package ‘GSVA’ was used to calculate the immune function score in
the TCGA-SARC cohort (https://bioconductor.org/packages/release/bioc/html/GSVA.html)
(32), and the results are
displayed in a boxplot. The independent sample t-test was used to
compare differences between two groups.
TME score
The ‘estimate’ package in R was used to calculate
the ‘StromalScore’, ‘ImmuneScore’ and ‘ESTIMATEScore’ between STS
samples with high and low CFLAR expression in TCGA-SARC dataset
(https://bioconductor.org/packages/release/bioc/html/estimate.html)
(33). The results are displayed in
a boxplot. The independent sample t-test was used to compare
differences between two groups.
Efficacy analysis of immune checkpoint
inhibitors (ICIs) in STS
The correlation (Spearman's analysis) between
established ICI targets and CFLAR expression was analyzed.
Subsequently, a correlation heatmap was generated to determine the
potential role of CFLAR in ICI efficacy in STS. The aforementioned
analysis applied the TCGA-SARC data set.
Pathway and functional enrichment
analysis, and protein-protein interaction (PPI) network
generation
The Gene Ontology (GO) analysis utilized the
enrichGO function in the R package ‘clusterProfiler’ (https://bioconductor.org/packages/release/bioc/html/clusterProfiler.html)
(34) and incorporated genome-wide
annotations provided by the Bioconductor project (https://www.bioconductor.org/) (35). Based on the GO analysis, the
specific functions of CFLAR co-upregulated genes were explored. A
PPI network was generated using the STRING database (https://cn.string-db.org/), based on the protein
interactions between CFLAR co-upregulated genes. The aforementioned
analysis applied the TCGA-SARC data set.
Single-cell quality control, dimension
reduction and cell type annotation
The complete single-cell sequencing data analysis
utilized the ‘Seurat’ package in R statistical software, applied to
the dataset GSE131309 (https://CRAN.R-project.org/package=Seurat) (36). Cells expressing between 50 and 9,000
genes were identified, with a mitochondrial gene cut-off of 5% for
further filtration. Following the identification of 1,500
hypervariable genes, 20 principal components were adjusted to
generate cell clusters. Subsequently, uniform manifold
approximation and projection (UMAP) dimensionality reduction was
performed using the data, and 20 clusters were generated.
CellMarker 2.0 (http://bio-bigdata.hrbmu.edu.cn/CellMarker/) was used
to manually annotate the single-cell sequencing data and eight cell
types were annotated (37,38). The expression distribution of CFLAR
was explored in single-cell sequencing data.
Human tissue specimens and reverse
transcription-quantitative (RT-q)PCR
In this study, 45 STS tumor tissues and 18 frozen
surgically resected para-carcinoma tissues, all obtained from the
Sample Bank of the National Cancer Center/National Clinical
Research Center for Cancer/Cancer Hospital, Chinese Academy of
Medical Sciences and Peking Union Medical College (Beijing, China),
were analyzed. These samples represented a cohort of 45 patients,
with a mean age of 42.3 years (ranging from 32 to 52 years), and a
nearly balanced sex ratio of 23 males to 22 females. Total RNA was
extracted from tissues using TRIzol® reagent
(Invitrogen; Thermo Fisher Scientific, Inc.). Primers for CFLAR and
GAPDH were diluted in ddH2O with SYBR Green PCR Master
Mix (Wuhan Servicebio Technology Co., Ltd.). The primer sequences
were as follows: CFLAR forward, 5′-AGAGTGAGGCGATTTGACCTG-3′ and
reverse, 5′-GTCCGAAACAAGGTGAGGGTT-3′; and GAPDH forward,
5′-GGAAGCTTGTCATCAATGGAAATC-3′ and reverse,
5′-TGATGACCCTTTTGGCTCCC-3′. The reverse transcription was performed
using the SweScript All-in-One First-Strand cDNA Synthesis SuperMix
for qPCR (One-Step gDNA Remover) from Wuhan Servicebio Technology
Co., Ltd. The reverse transcription process involved the following
temperature steps: 25°C for 5 min, 42°C for 30 min and 85°C for 5
sec. qPCR Thermocycling Conditions were as follows: Initial
denaturation at 95°C for 30 sec, denaturation at 95°C for 15 sec
and annealing/extension at 60°C for 30 sec. For the melting curve
stage, the temperature was raised from 65°C to 95°C, with
fluorescence collection at every 0.5°C increase. Each sample was
assessed in triplicate. CFLAR mRNA expression levels were
quantified using the 2−ΔΔCq method and were normalized
to the internal reference gene GAPDH (39).
Multiplex immunofluorescence
(mIF)
For the multiplex immunofluorescence (mIF) staining,
tissue samples from leiomyosarcoma and fibrosarcoma tumors were
used. These samples were obtained from two individual patients.
This was done to ensure a diverse representation of STS subtypes in
the analysis. The CFLAR mouse antibody was obtained from Santa Cruz
Biotechnology, Inc. (cat. no. sc-5276). Briefly, 4-µm
paraffin-embedded sections were dewaxed, and then underwent antigen
retrieval, endogenous peroxidase blocking and serum blocking. The
fixation information for paraffin-embedded sections is as follows:
The fixative used was absolute ethanol. Tissue sections were fixed
at room temperature for 24 h. Antigen retrieval was carried out
using citrate antigen retrieval solution (pH 6.0; Wuhan Saiwei
Biotechnology Co., Ltd.), with medium heat for 8 min in citric
acid, no heat for 8 min and medium-low heat for 7 min. Anjie
Hi-tech 3% hydrogen peroxide was used to block endogenous
peroxidase, and samples were incubated at room temperature in the
dark for 25 min. Bovine serum albumin (BSA; Wuhan Saier
Biotechnology Co., Ltd.) was used for serum blocking (cat. no.
GC305010) at room temperature for 30 min. Subsequently, the
sections were incubated with the primary antibody overnight at 4°C.
This incubation was performed three times with different
antibodies: CFLAR Mouse Antibody (1:1,000; cat. no. sc-5276; Santa
Cruz Biotechnology, Inc.), CD8 Rabbit Antibody (1:200; cat. no.
GB12068; Wuhan Servicebio Technology Co., Ltd.) and INOS Mouse
Antibody (1:200; cat. no. GB11119; Wuhan Servicebio Technology Co.,
Ltd.). A horseradish peroxidase-conjugated secondary antibody
(HRP-conjugated Goat Anti-Mouse IgG, cat. no. GB23301;
CY3-conjugated Goat Anti-Mouse IgG, cat. no. GB21301 and Alexa
Fluor 488-conjugated Goat Anti-Rabbit IgG, cat. no. GB25303; all
Wuhan Servicebio Technology Co., Ltd.) was applied at room
temperature for 50 min, before fluorescent dye detection and
microwave treatment to remove the bound antibodies. Finally, the
slides were counterstained with DAPI and mounted in anti-fade
solution. Imaging was performed using a Nikon Eclipse C1 upright
fluorescence microscope.
Statistical analysis
All statistical analyses were performed using R
statistical software (version 4.2.3). Independent samples t-test
was used for comparisons between gene expression levels, and
Spearman's rank correlation coefficient was carried out to assess
the potential association between CFLAR expression and the
infiltration of various immune-related cells. In addition, ROC
curve analysis was conducted to determine the discriminatory value
of marker genes. P<0.05 was considered to indicate a
statistically significant difference.
Results
Differentially expressed ARGs (DEARGs)
obtained from GTEx~TCGA-SARC
The design of the present study is shown in Fig. 1. In total, 640 ARGs were obtained
from GeneCards and Harmonizome. The aforementioned genes were
included in the differential expression analysis between STS and
healthy tissues in GTEx~TCGA-SARC, and 86 DEARGs were obtained. The
results of the differential expression analysis are displayed in
heat and volcano maps (Fig. 2A and
B).
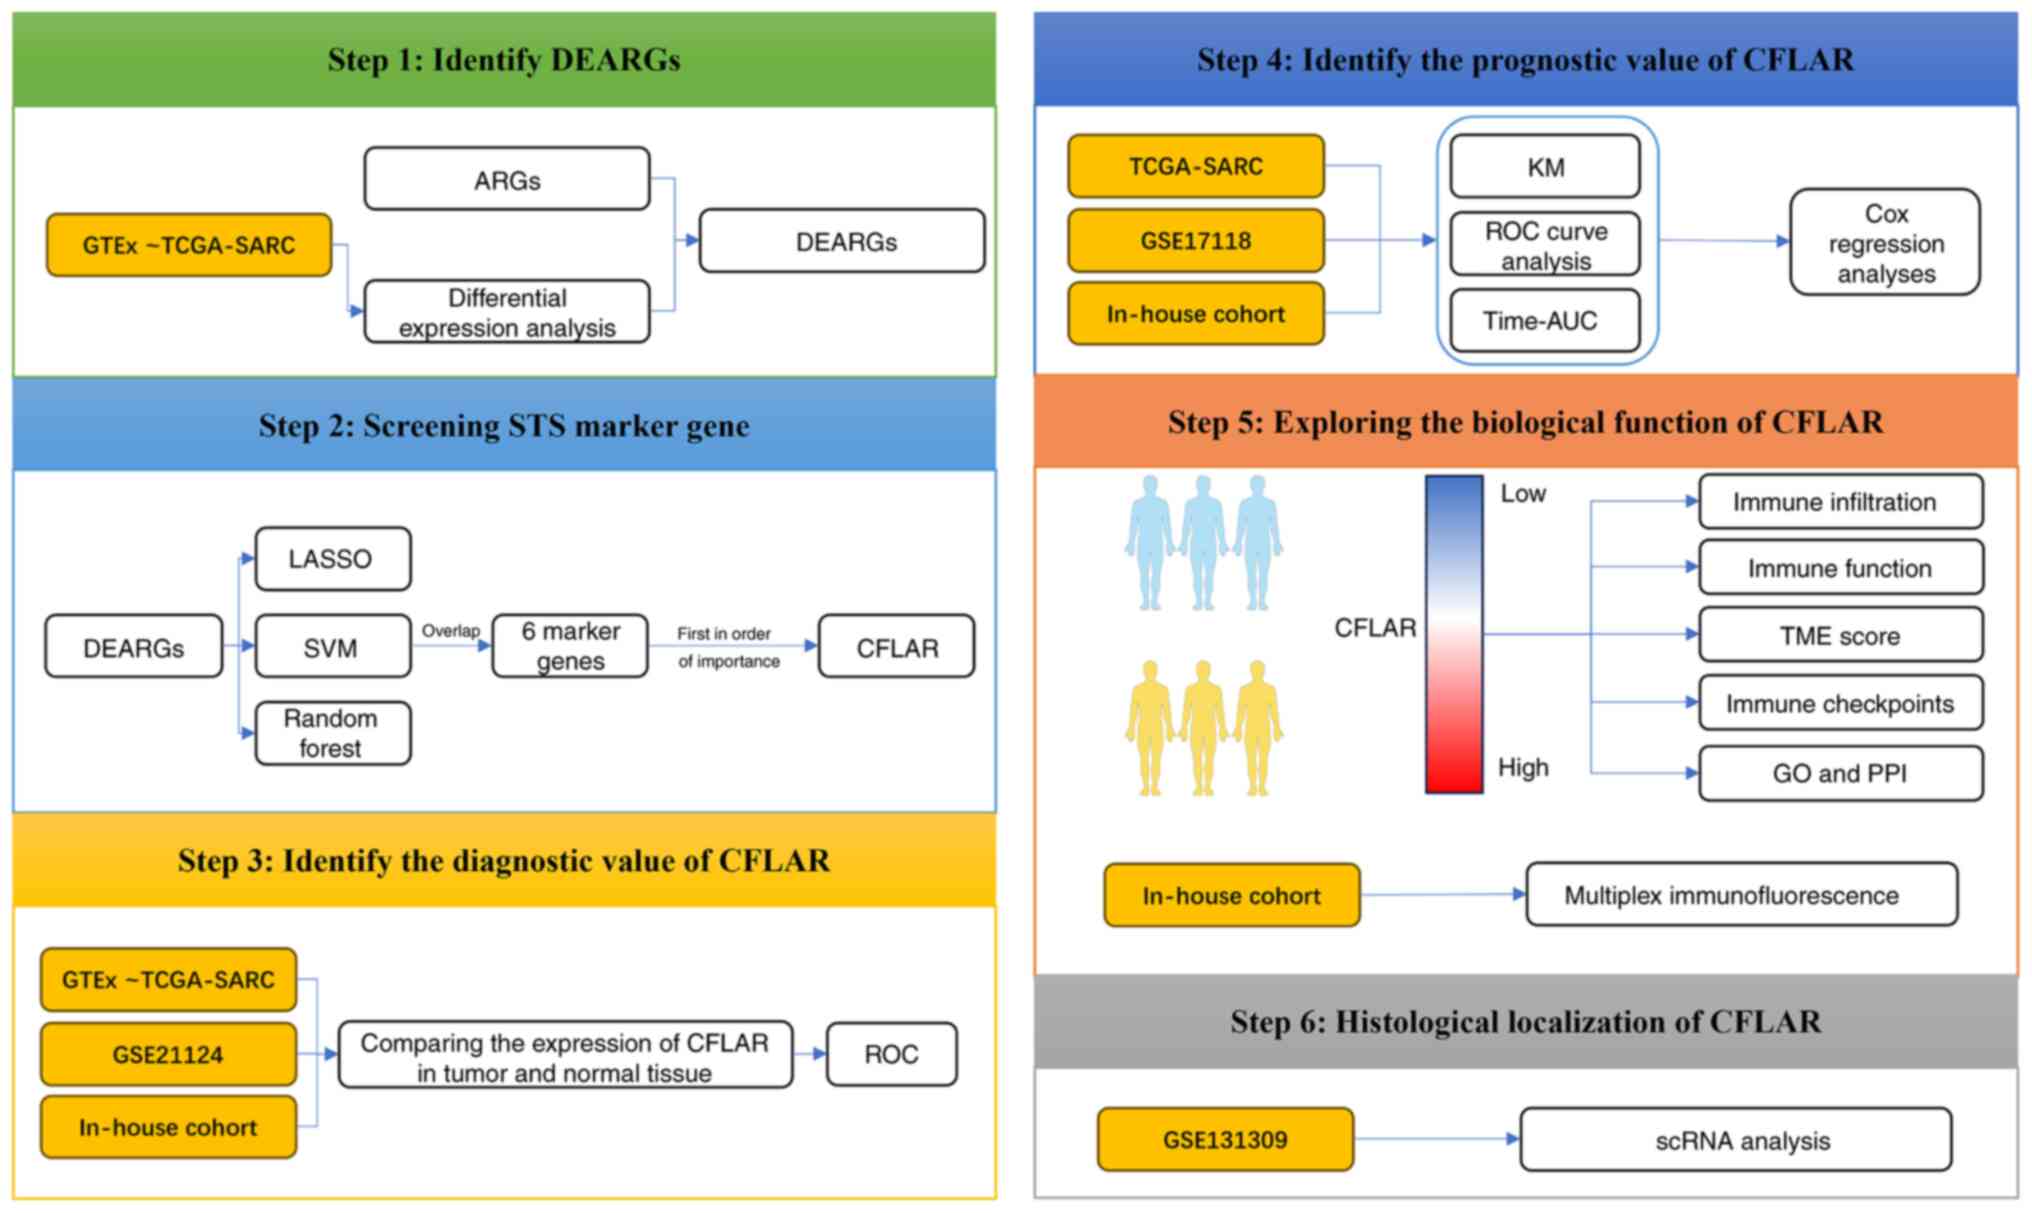 | Figure 1.Flow chart of the study design. ARGs,
anoikis-related genes; AUC, area under the curve; CFLAR, CASP8 and
FADD-like apoptosis regulator; DEARGs, differentially expressed
ARGs; GO, Gene Ontology; GTEx, Genotype-Tissue Expression; KM,
Kaplan-Meier; LASSO, Least Absolute Shrinkage and Selection
Operator; PPI, protein-protein interaction; ROC, receiver operating
characteristic; scRNA, single cell RNA; STS, soft tissue sarcoma;
SVM, Support Vector Machine; TCGA, The Cancer Genome Atlas; TME,
tissue microenvironment. The human figure outline in this figure
was sourced from Smart Servier Medical Art (https://smart.servier.com/). Smart Servier Medical
Art provides images that are free to use and do not require
permission for their usage. |
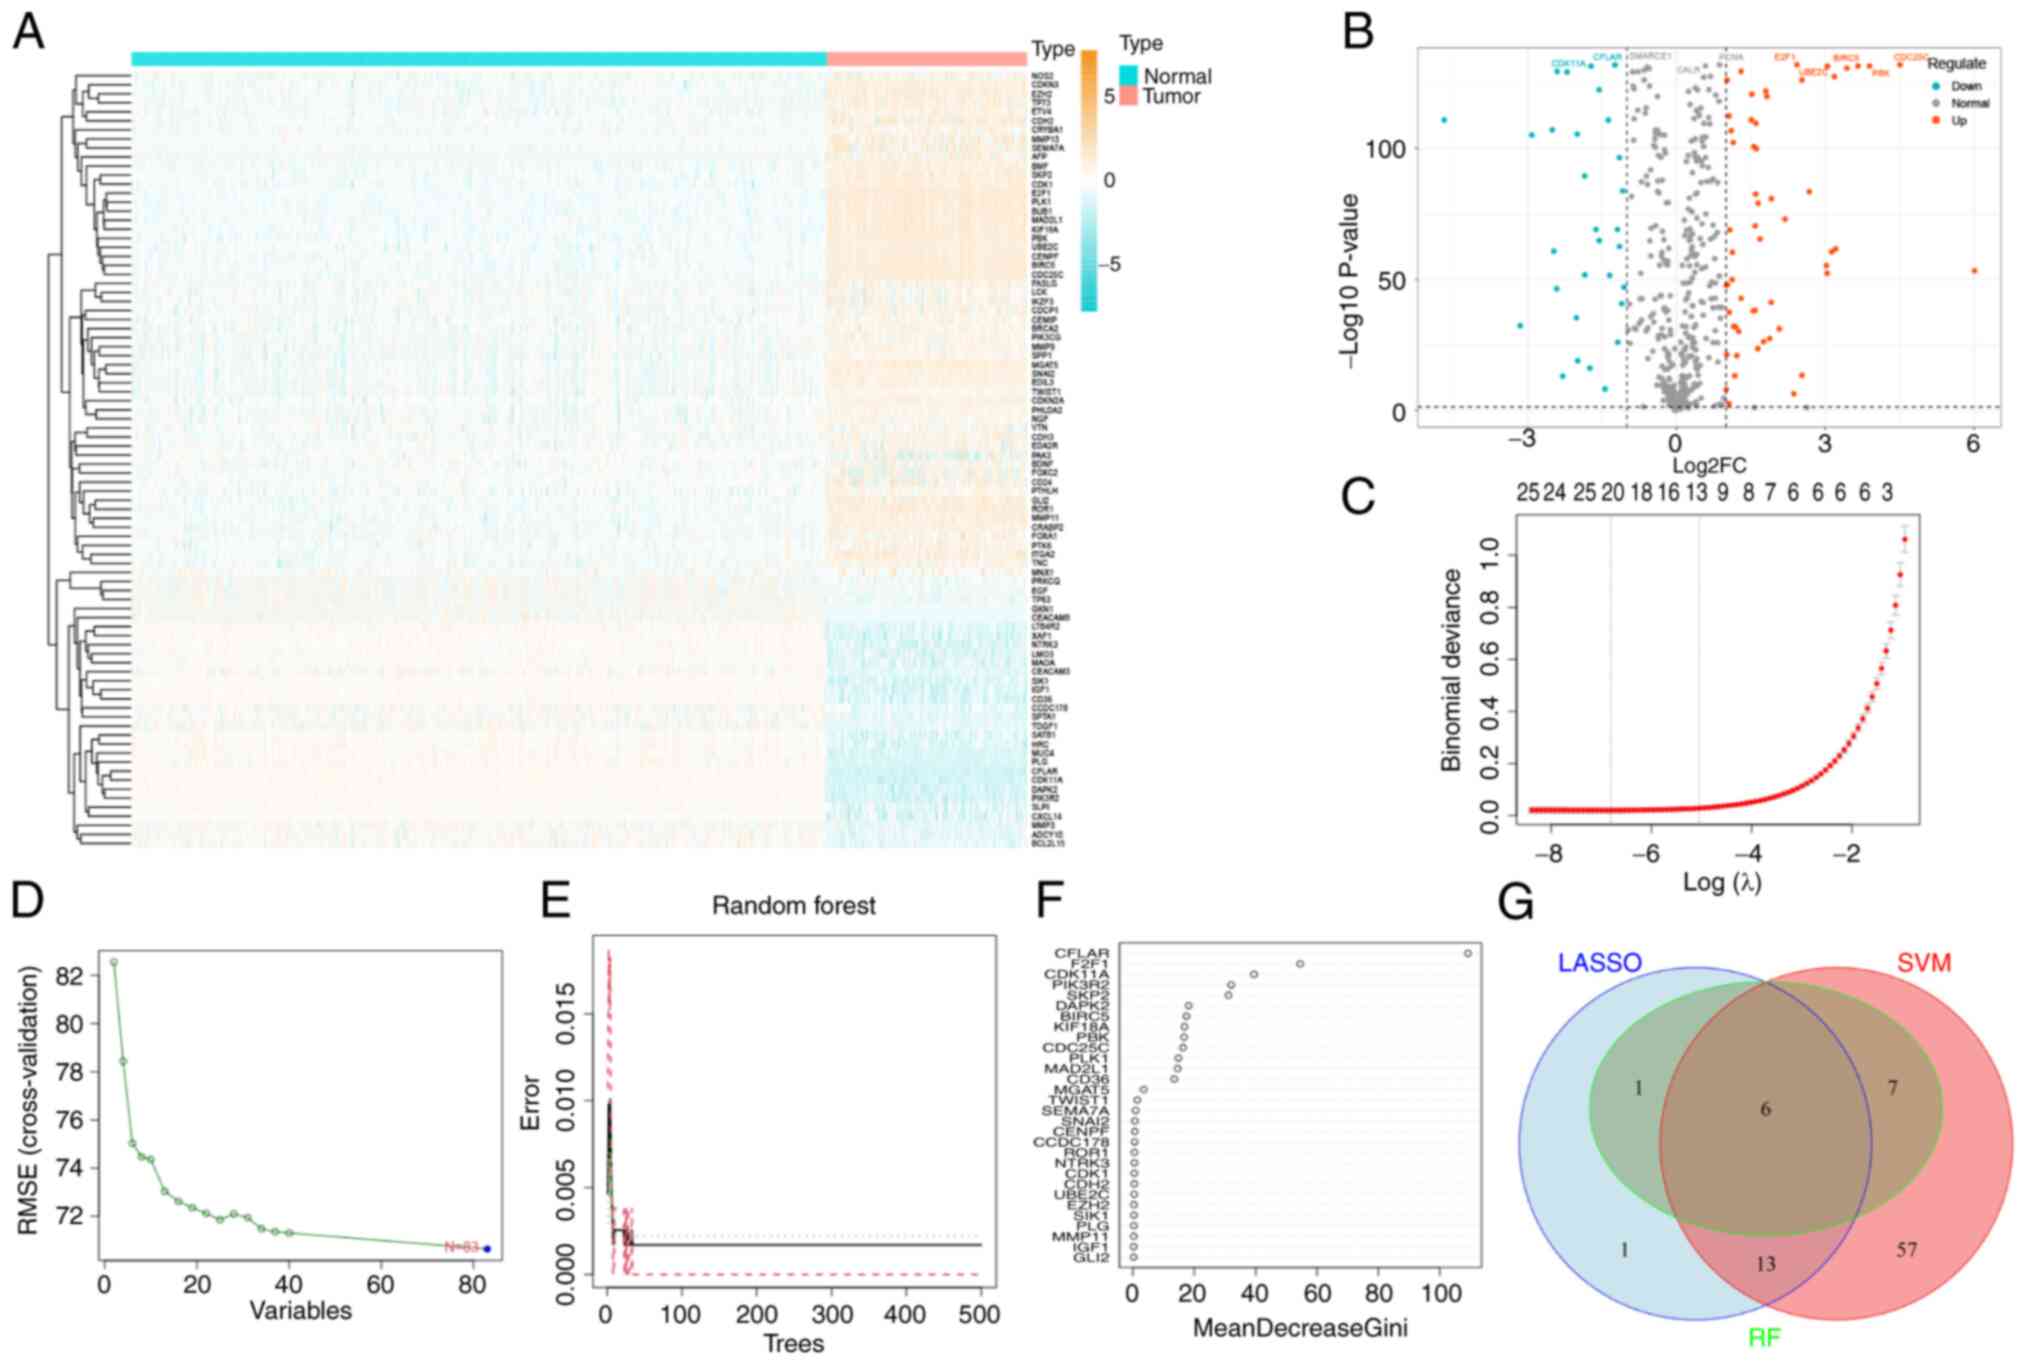 | Figure 2.Differential expression analysis and
three machine learning algorithms were used to screen STS
biomarkers. (A) DEARG expression heatmap. (B) DEARG expression
volcano map. (C) LASSO regression model was used to identify
potential markers for STS. The coefficient value is displayed on
the y-axis, the logarithmic value of l is displayed on the lower
end of the x-axis, and the number of non-zero coefficients present
in the model are displayed on the upper end of the x-axis. (D) A
chart was used to demonstrate the process of selecting biomarkers
through the SVM-recursive feature elimination technique. (E) A
chart was used to illustrate how the number of decision trees
affects the error rate. The x-axis displays the number of decision
trees and the y-axis demonstrates the error rate. As the number of
decision trees increases, the error rate initially decreases. When
~100 decision trees are used, the error rate remains stable. (F)
The Gini coefficient method was used to determine the significance
index of genetic variables. The y-axis of the chart represents the
genetic variables and the x-axis demonstrates the corresponding
significance index. (G) Venn diagram of the intersection of three
machine learning algorithms. DEARGs, differentially expressed
anoikis-related genes; LASSO, Least Absolute Shrinkage and
Selection Operator; l, lamda; RF, Random Forest; STS, soft tissue
sarcoma; SVM, Support Vector Machine. |
Identification of diagnostic markers
in STS
In total, 21 STS feature genes (those with potential
to serve as diagnostic markers for STS) were obtained from DEARGs
using LASSO logistic regression, 83 STS feature genes were obtained
from DEARGs using SVM-REF, and 14 STS feature genes were obtained
from DEARGs using RF (Fig. 2C-E).
In addition, the importance of the 14 Feature genes obtained using
RF was ranked (Fig. 2F).
Subsequently, an intersection diagram between the Feature genes
obtained using the three algorithms was generated, and six marker
genes were obtained (Fig. 2G).
Notably, CFLAR was the gene with the highest ranking of importance
in RF, and this was selected for use in subsequent studies. The
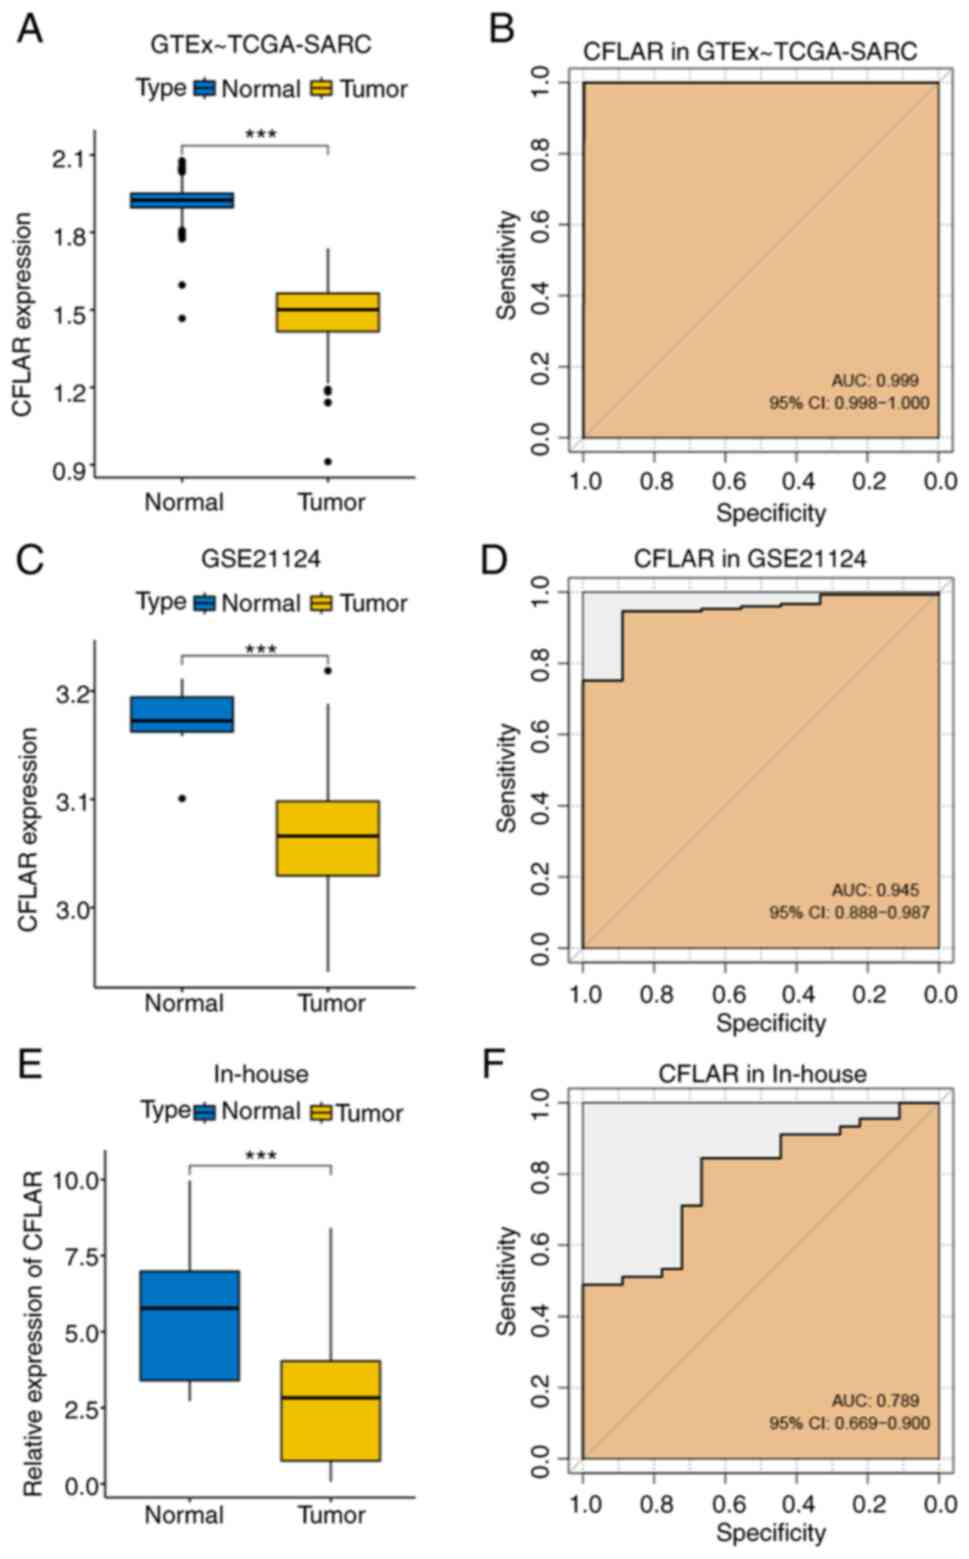
expression levels of CFLAR were compared between STS and healthy
tissues obtained from two public datasets, GTEx~TCGA-SARC and
GSE21124. The results of the present study demonstrated that the
expression levels of CFLAR were significantly lower in STS tissues
compared with those in healthy tissues, and the AUCs were 0.999 and
0.945, respectively (Fig. 3A-D).
Subsequently, RT-qPCR was carried out to determine the relative
expression levels of CFLAR in 45 tumor and 18 adjacent healthy
tissues. Notably, these results were consistent with the results
obtained using the public databases. The expression levels of CFLAR
were significantly lower in tumor tissues compared with those in
adjacent healthy tissues, and the AUC was 0.789 (Fig. 3E and F). Thus, CFLAR exhibits
potential as a diagnostic marker in STS.
CFLAR is a prognostic factor in
STS
The present study aimed to explore whether CFLAR
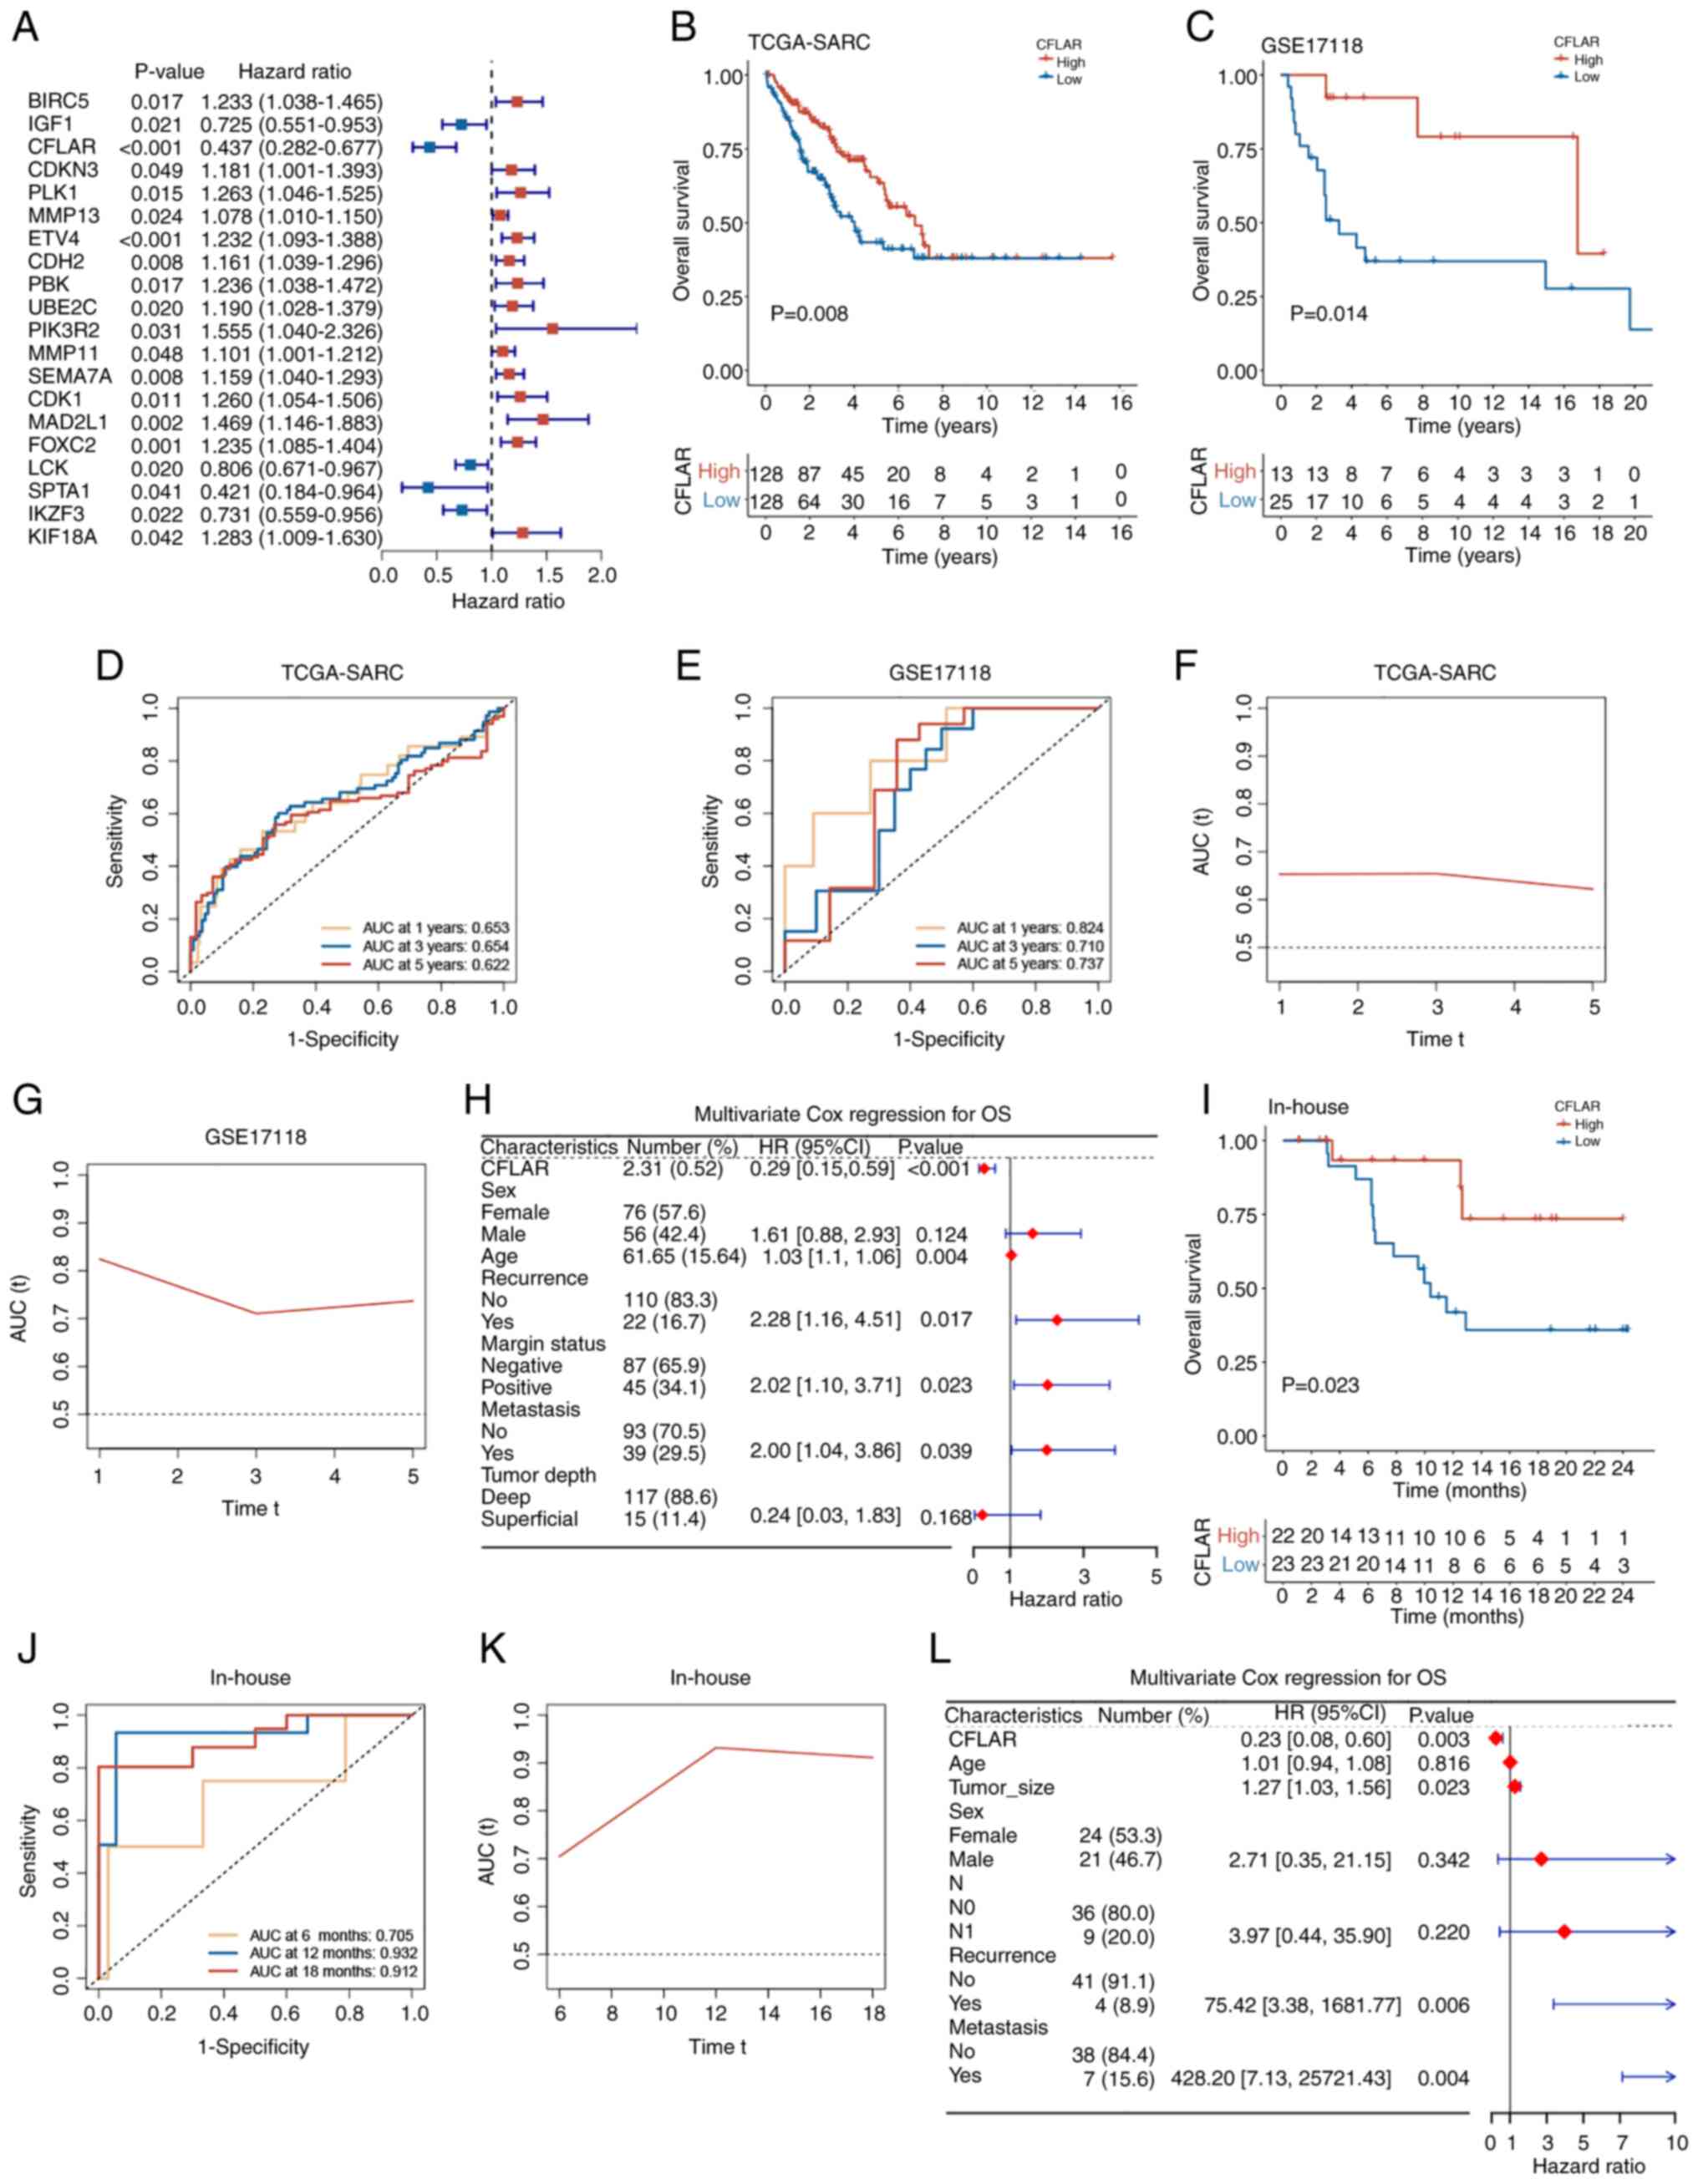
plays a role in the prognosis of STS. The results of the univariate
Cox regression analysis demonstrated that CFLAR was a prognostic
factor for STS (Fig. 4A).
Subsequently, survival analysis was conducted using the TCGA-SARC
and GSE17118 datasets. Using the median CFLAR expression value in
TCGA-SARC, the samples were stratified into high and low CFLAR
expression groups, with the high expression group consisting of 128
samples and the low expression group also comprising 128 samples in
TCGA-SARC. In the GSE17118 dataset, the high expression group
included 12 samples, while the low expression group contained 25
samples. Kaplan-Meier survival curves were then generated for these
groups (Fig. 4B and C). The results
of the present study demonstrated that the overall survival (OS)
rate of the CFLAR high expression group was significantly higher
than that of the CFLAR low expression group, and the time-dependent
AUC of OS was calculated (Fig. 4D and
E). In TCGA-SARC, the AUC values at 1, 3 and 5 years were
0.653, 0.654 and 0.622, respectively. In the GSE17118 dataset, the
AUC values at 1, 3 and 5 years were 0.824, 0.710 and 0.737,
respectively. The AUC over time was plotted, and the results
demonstrated that over 5 years, the AUC remained stable. Notably,
the AUC was >0.6 in TCGA-SARC cohort and >0.7 in the GSE17118
cohort (Fig. 4F and G).
Subsequently, 132 patients with complete clinical information were
selected from the TCGA-SARC dataset. This selection was based on
the availability of comprehensive clinical data necessary for a
robust multivariate Cox regression analysis. CFLAR expression was
then included as a clinical feature in this analysis. The results
of the present study demonstrated that CFLAR was an independent
factor for the prognosis of STS (P<0.001; HR, 0.29; 95% CI,
0.15–0.59; Fig. 4H). Subsequently,
the median CFLAR expression was used as a cut-off value in the
in-house cohort, samples were divided into CFLAR high and low
expression groups, and KM survival curves were plotted (Fig. 4I). Notably, the results were
consistent with those obtained using public databases, and the
time-dependent AUC of OS was calculated (Fig. 4J). The AUC values at 6, 12 and 18
months were 0.705, 0.932 and 0.912, respectively. The AUC over time
demonstrated that over 1.5 years, the AUC remained stable, and was
>0.7 in the in-house cohort (Fig.
4K). Subsequently, a multivariate Cox regression analysis was
performed, and the clinical characteristics of the in-house cohort
were incorporated. The results of the present study demonstrated
that CFLAR was an independent prognostic factor for STS (P=0.003;
HR, 0.23; 95% CI, 0.08–0.60; Fig.
4L). Collectively, the results of the present study
demonstrated that CFLAR may exhibit potential as an independent
prognostic factor for STS.
Immune cell infiltration, immune
function, TME score and ICI analysis
To further explore the role of high CFLAR expression
in improving prognosis, immune cell infiltration analysis was
performed using CIBERSORTx. The results of the present study
demonstrated that the infiltration of CD8+ T cells,
monocytes and M1 macrophages was significantly higher in the CFLAR
high expression group than that in the low expression group,
whereas M0 macrophage infiltration was significantly lower in the
CFLAR high expression group than that in the low expression group.
In addition, the γδT cells in the CFLAR high expression group were
higher than those in the low expression group (Fig. 5A).
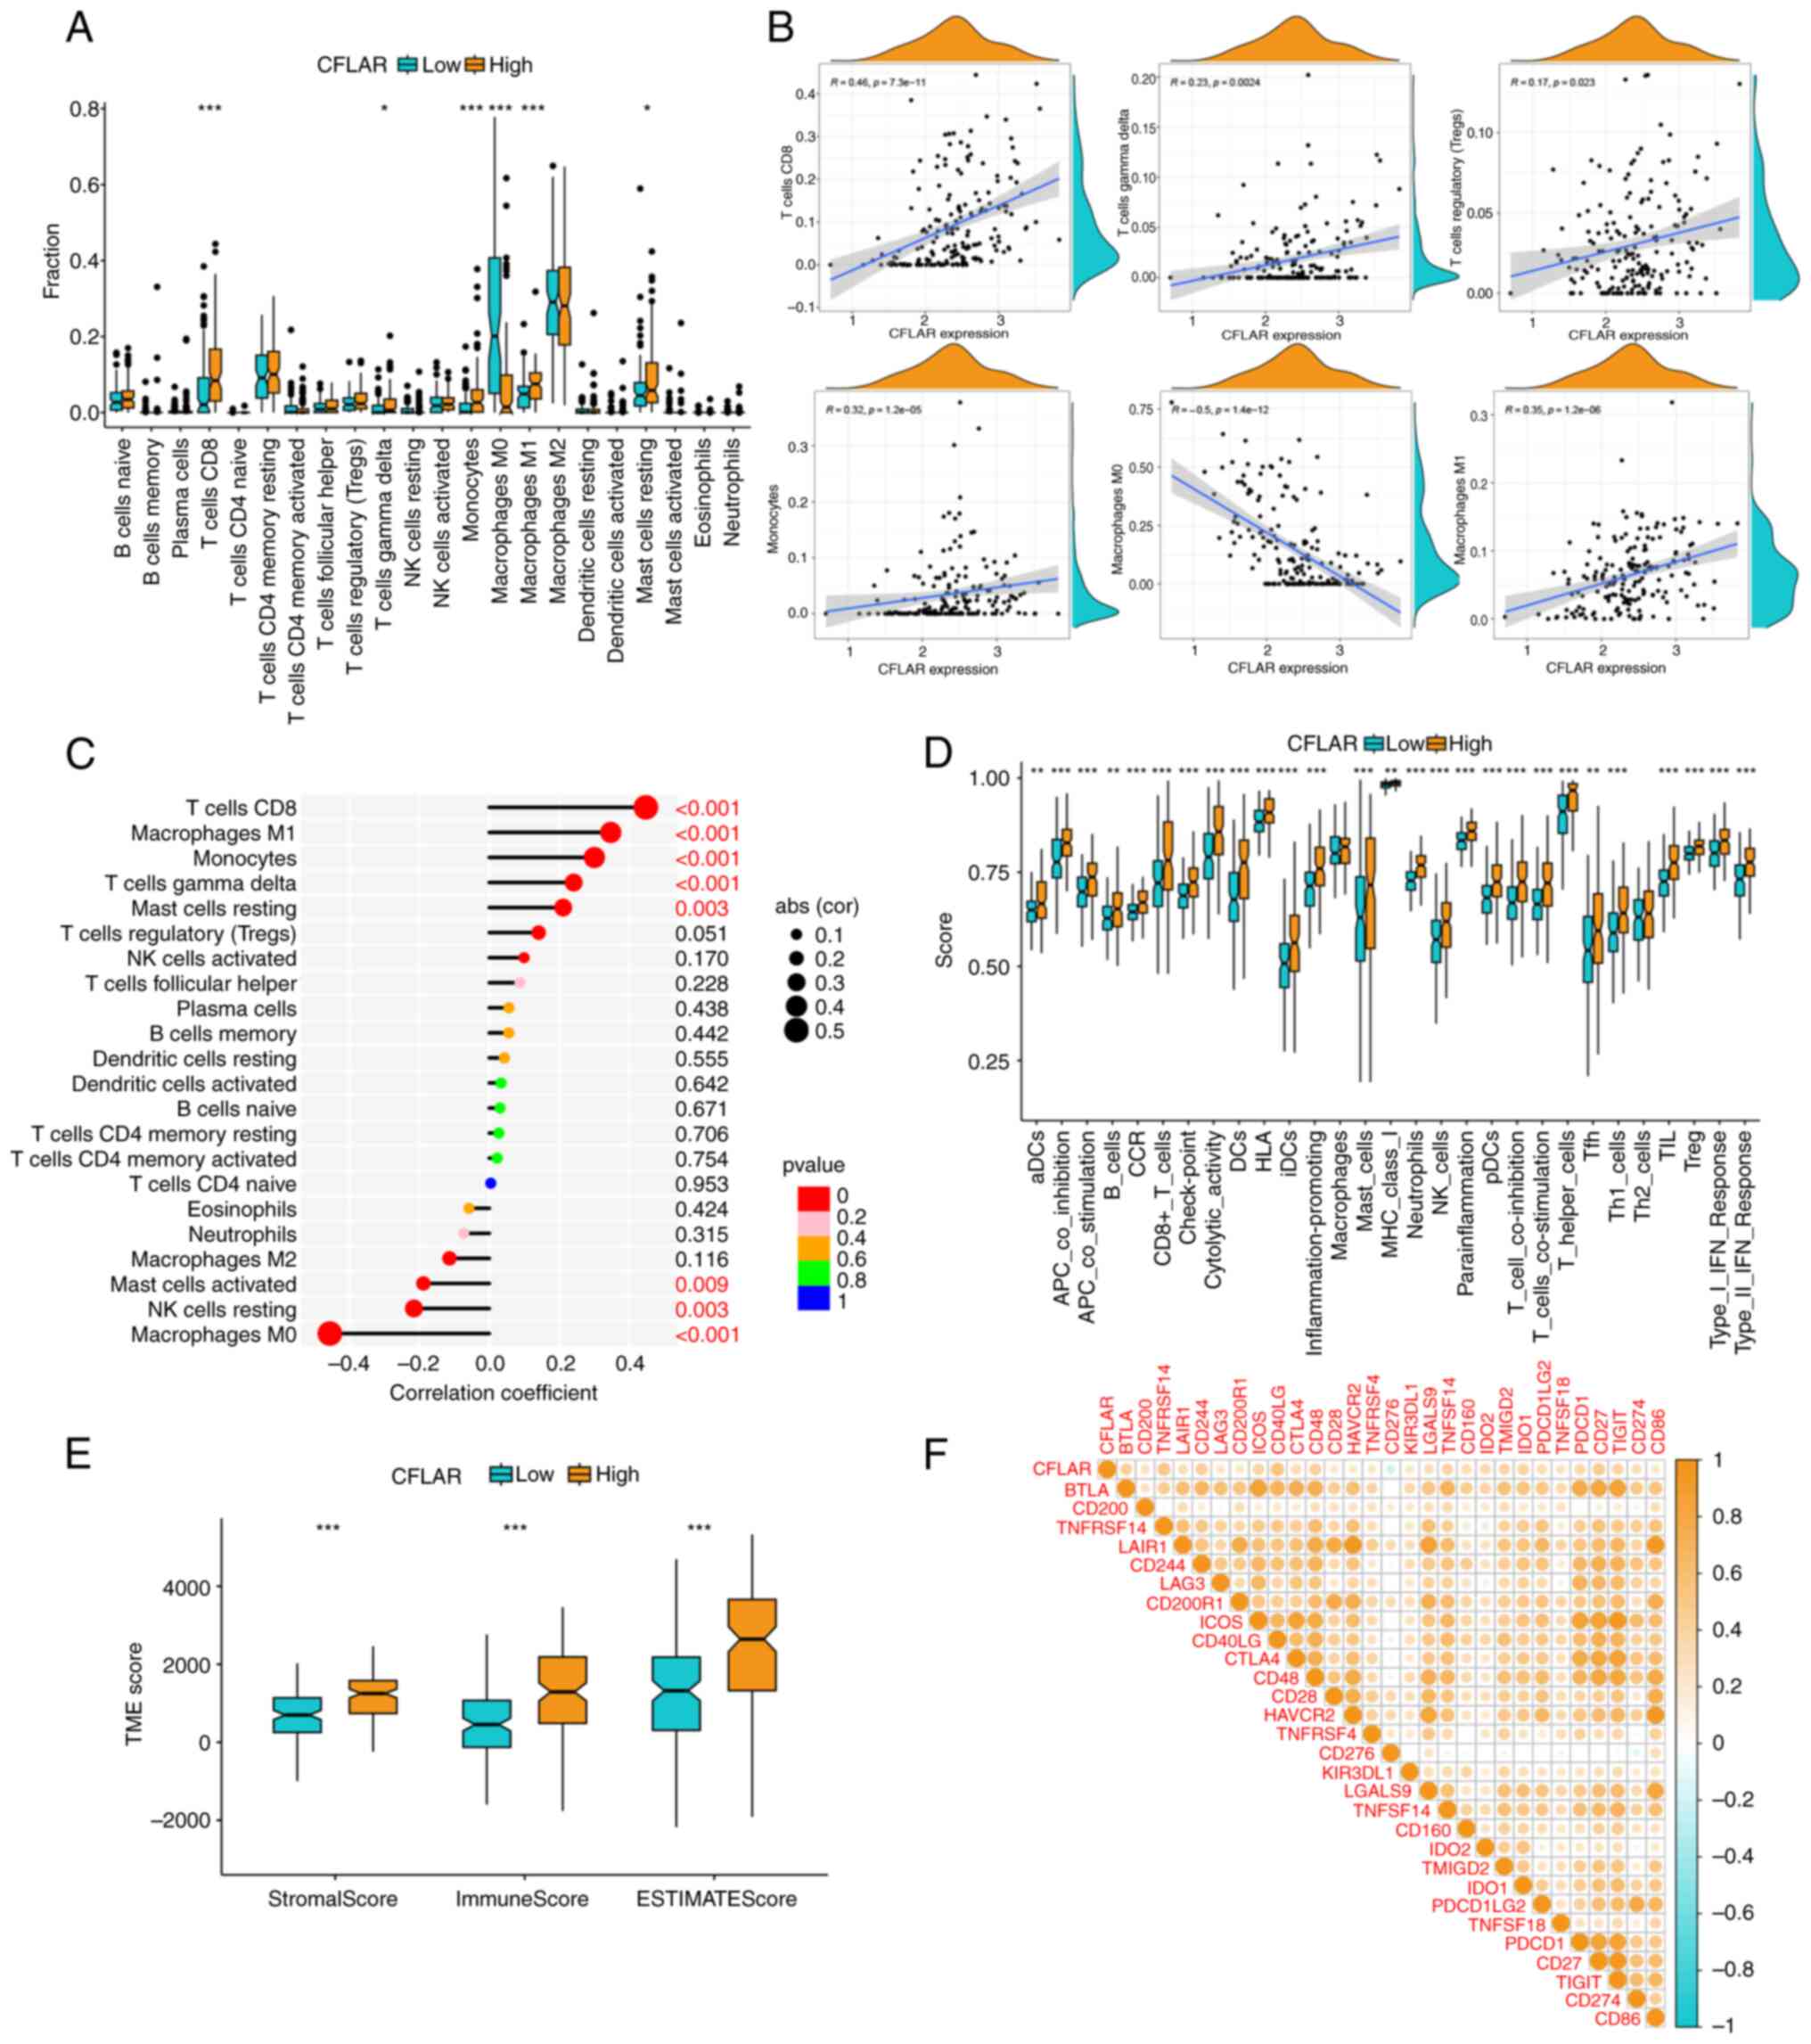 | Figure 5.Immune cell infiltration, immune
function, TME score and ICI correlation analysis. (A) A boxplot
illustrating the proportion of 22 types of immune cells in CFLAR
high and low expression groups. (B) Correlation analysis between
CFLAR expression and infiltration of CD8+ T cells, γδT
cells, M1 macrophages, M0 macrophages, monocytes and Treg. (C) A
lollipop chart showing the correlation coefficient and significance
of CFLAR expression and immune cell infiltration. (D) A boxplot
illustrating the immune function scores in the CFLAR high and low
expression groups. (E) A boxplot illustrating the TME scores in
CFLAR high and low expression groups. (F) Correlation heatmap
between CFLAR and 29 ICIs. *P<0.05, **P<0.01, ***P<0.001.
CFLAR, CASP8 and FADD-like apoptosis regulator; ICI, immune
checkpoint inhibitor; NK, natural killer; TME, tumor
microenvironment. |
Correlation analysis of immune cell infiltration
demonstrated that CFLAR expression was most notably and positively
correlated with CD8+ T cells, M1 macrophages and
monocytes, and negatively correlated with M0 macrophages. While a
positive correlation was also observed with γδT cells and Tregs,
these associations were characterized by a lower r-value (<0.3),
indicating a weaker relationship (Fig.
5B). The correlation, correlation coefficient and P-value of
CFLAR expression and immune cell infiltration are summarized in a
lollipop chart (Fig. 5C). Thus, it
was hypothesized that CFLAR may promote the infiltration of
CD8+ T cells and the polarization of M1 macrophages in
the STS TME.
The results of the immune function analysis
demonstrated that the majority of immune function scores were
significantly higher in the CFLAR high expression group than those
in the CFLAR low expression group (Fig.
5D). The results of the TME analysis demonstrated that the
StromalScore, ImmuneScore and ESTIMATEScore in the CFLAR high
expression group were significantly higher than those in the CFLAR
low expression group (Fig. 5E).
Moreover, to explore the role of CFLAR in predicting the
therapeutic efficacy of ICIs, the correlation of CFLAR expression
with 29 ICI targets was determined. The results are displayed in a
heatmap (Fig. 5F). The results
showed that CFLAR was positively correlated with most ICIs and
negatively correlated with CD274. Notably, CFLAR expression may
exhibit potential in guiding the immunotherapy of STS.
Functional analysis of CFLAR
co-upregulated genes
To further explore how CFLAR induces the TME
activation of STS, differential expression analysis was performed
using both high and low CFLAR expression groups. The results of the
present study demonstrated that the majority of CFLAR
co-upregulated genes were highly associated with immune response,
and were positive regulators of immune cell activation, immune
receptor activation and immune pathway activation (Fig. 6A). Subsequently, the PPI network of
CFLAR co-upregulated genes was generated (Fig. 6B). The results of the present study
demonstrated that all hub genes in the PPI network were
immune-related genes, and these were associated with immune cell
activation and antigen presentation.
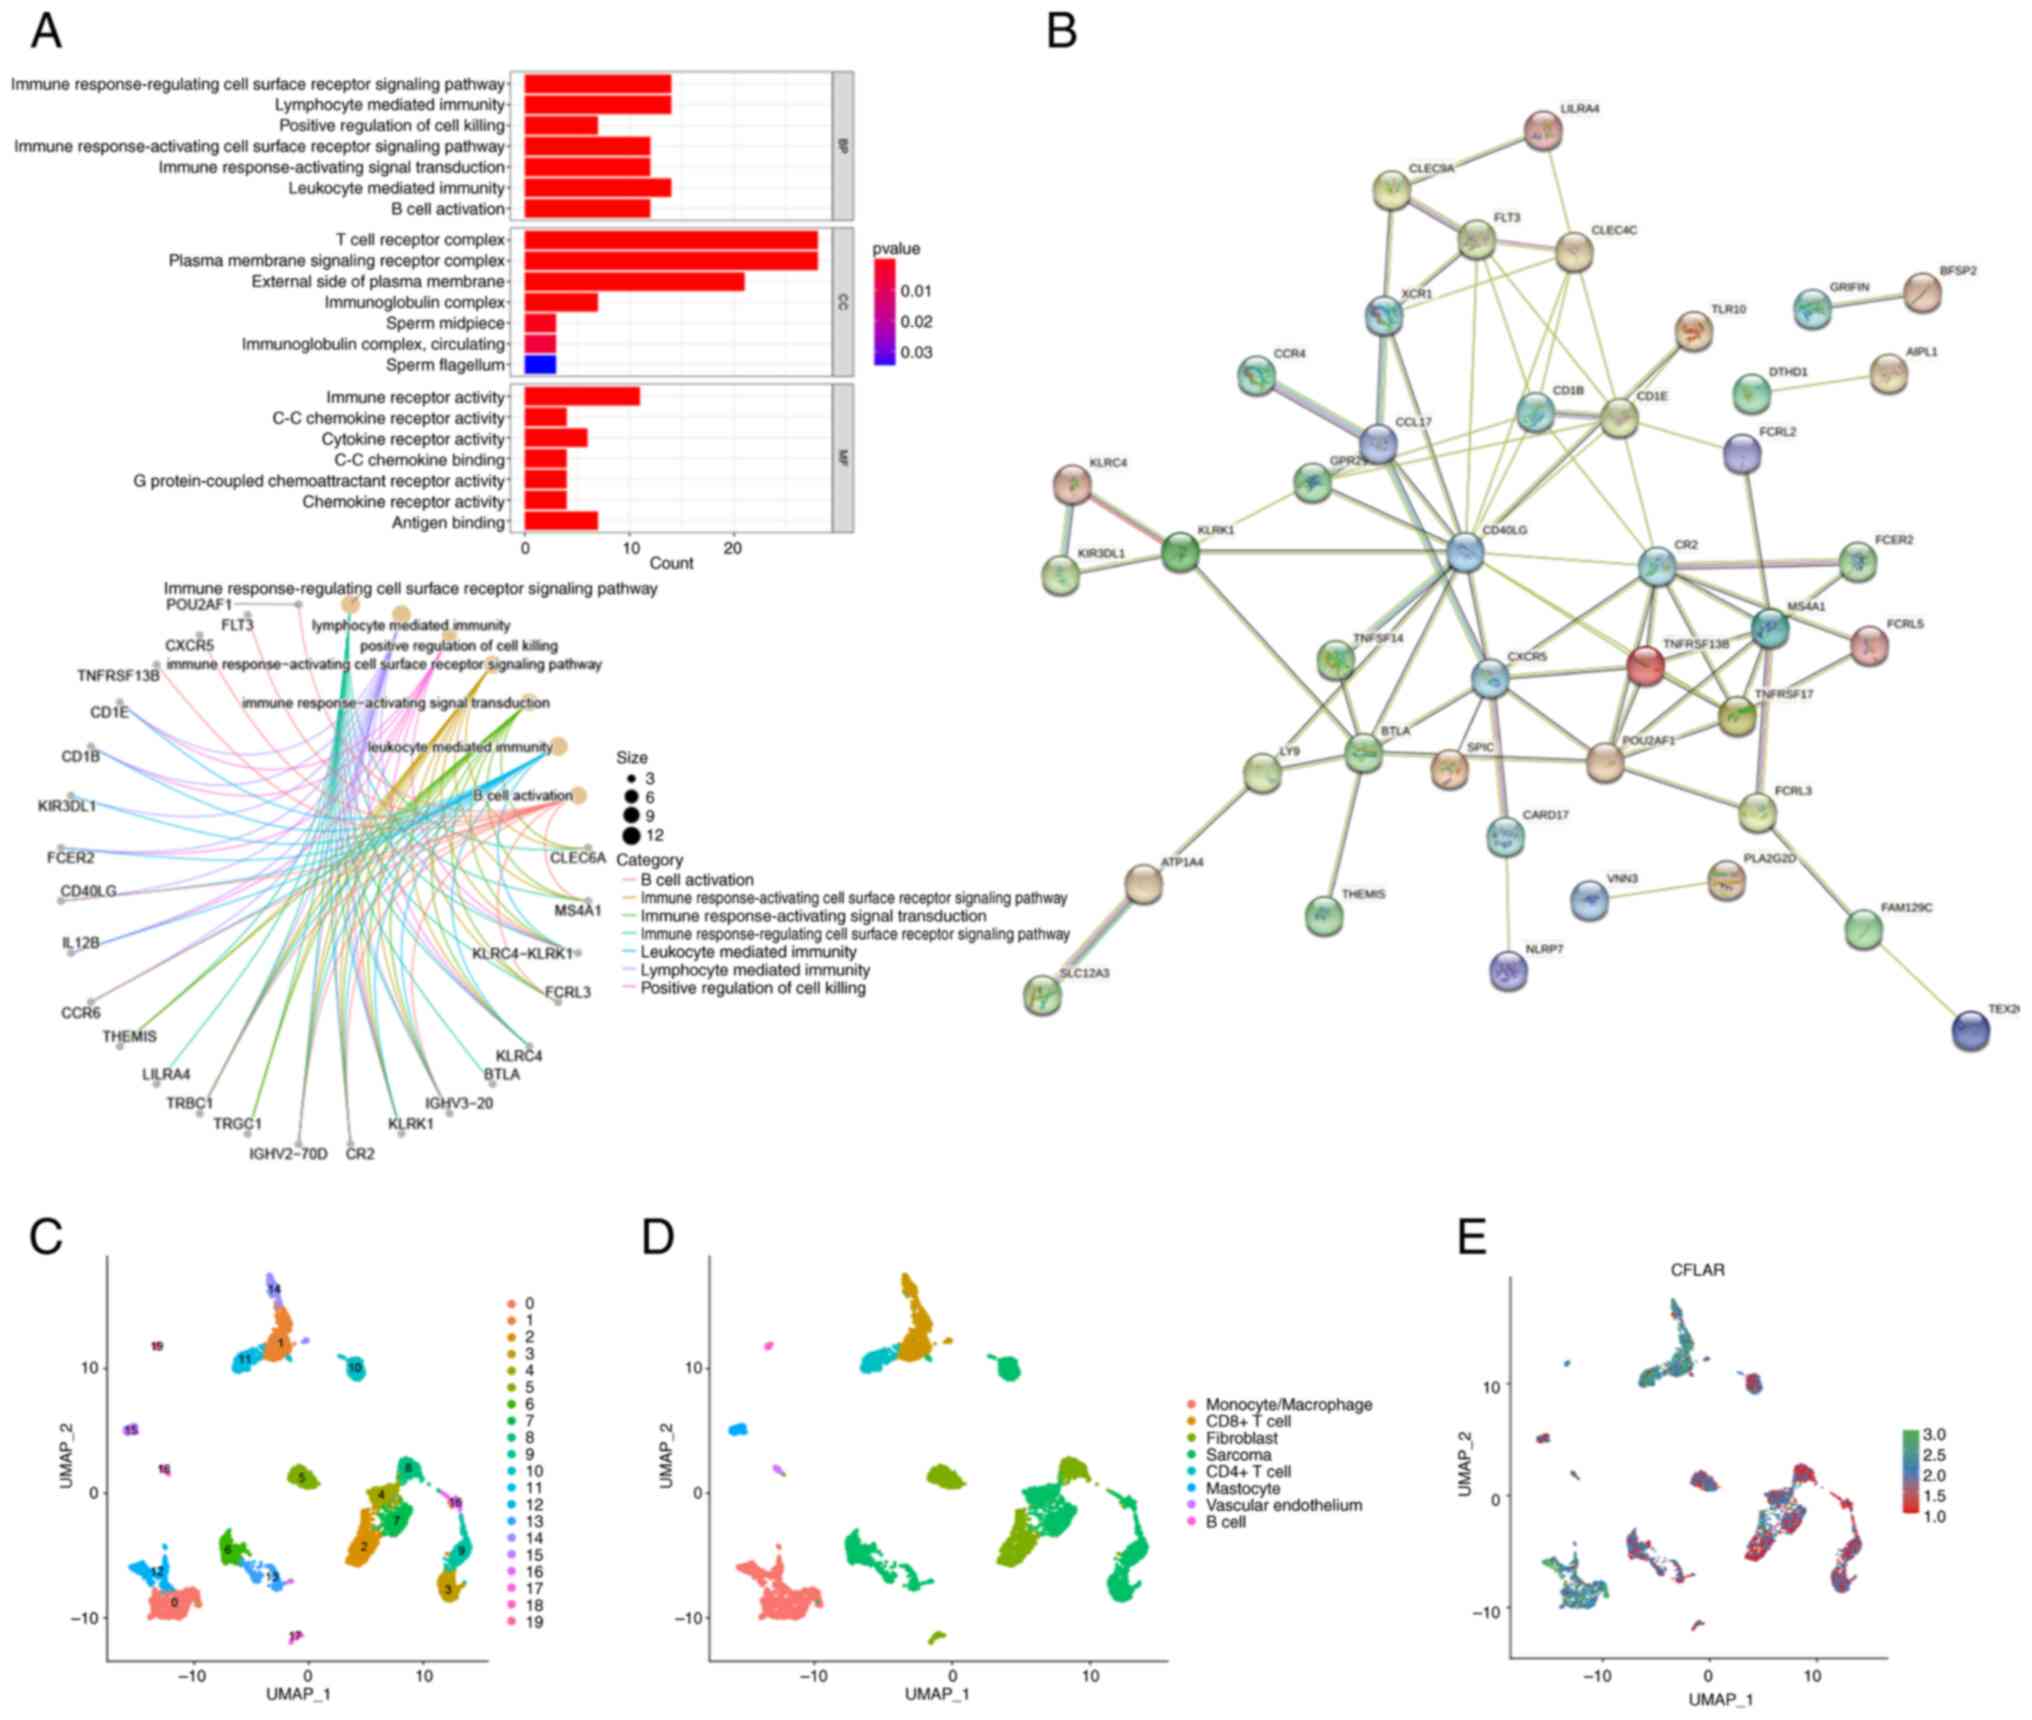 | Figure 6.GO, PPI and single-cell sequencing
analysis. (A) GO enrichment analysis for CFLAR co-upregulated
genes. (B) PPI network of CFLAR co-upregulated genes. (C)
Dimensionality reduction map of cells in the GSE131309 dataset was
divided into 20 clusters using UMAP. (D) Cells in the GSE131309
dataset were annotated as follows: Monocytes/macrophages,
CD8+ T cells, CD4+ T cells, B cells,
fibroblasts, sarcoma cells, vascular endothelial cells and
mastocytes. (E) CFLAR was mainly expressed in T cells and
monocytes/macrophages in the STS TME. CFLAR, CASP8 and FADD-like
apoptosis regulator; GO, Gene Ontology; PPI, protein-protein
interaction; STS, soft tissue sarcoma; TME, tumor microenvironment;
UMAP, uniform manifold approximation and projection. |
Single-cell sequencing analysis and
CFLAR expression distribution
Following quality control of the GSE131309
single-cell sequencing dataset, data dimensionality reduction was
performed using the UMAP method, and all cells were divided into 20
clusters (Fig. 6C). In addition,
results of the cell annotation demonstrated that annotated cell
types were monocytes/macrophages, CD8+ T cells,
CD4+ T cells, B cells, fibroblasts, sarcoma cells,
vascular endothelial cells and mastocytes (Fig. 6D). The results of the present study
also demonstrated that CFLAR expression was higher in non-tumor
tissues than in tumor tissues, and CFLAR was mainly expressed in T
cells and monocytes/macrophages (Fig.
6E). Thus, the results obtained using RNA-seq data were further
verified at the single-cell level.
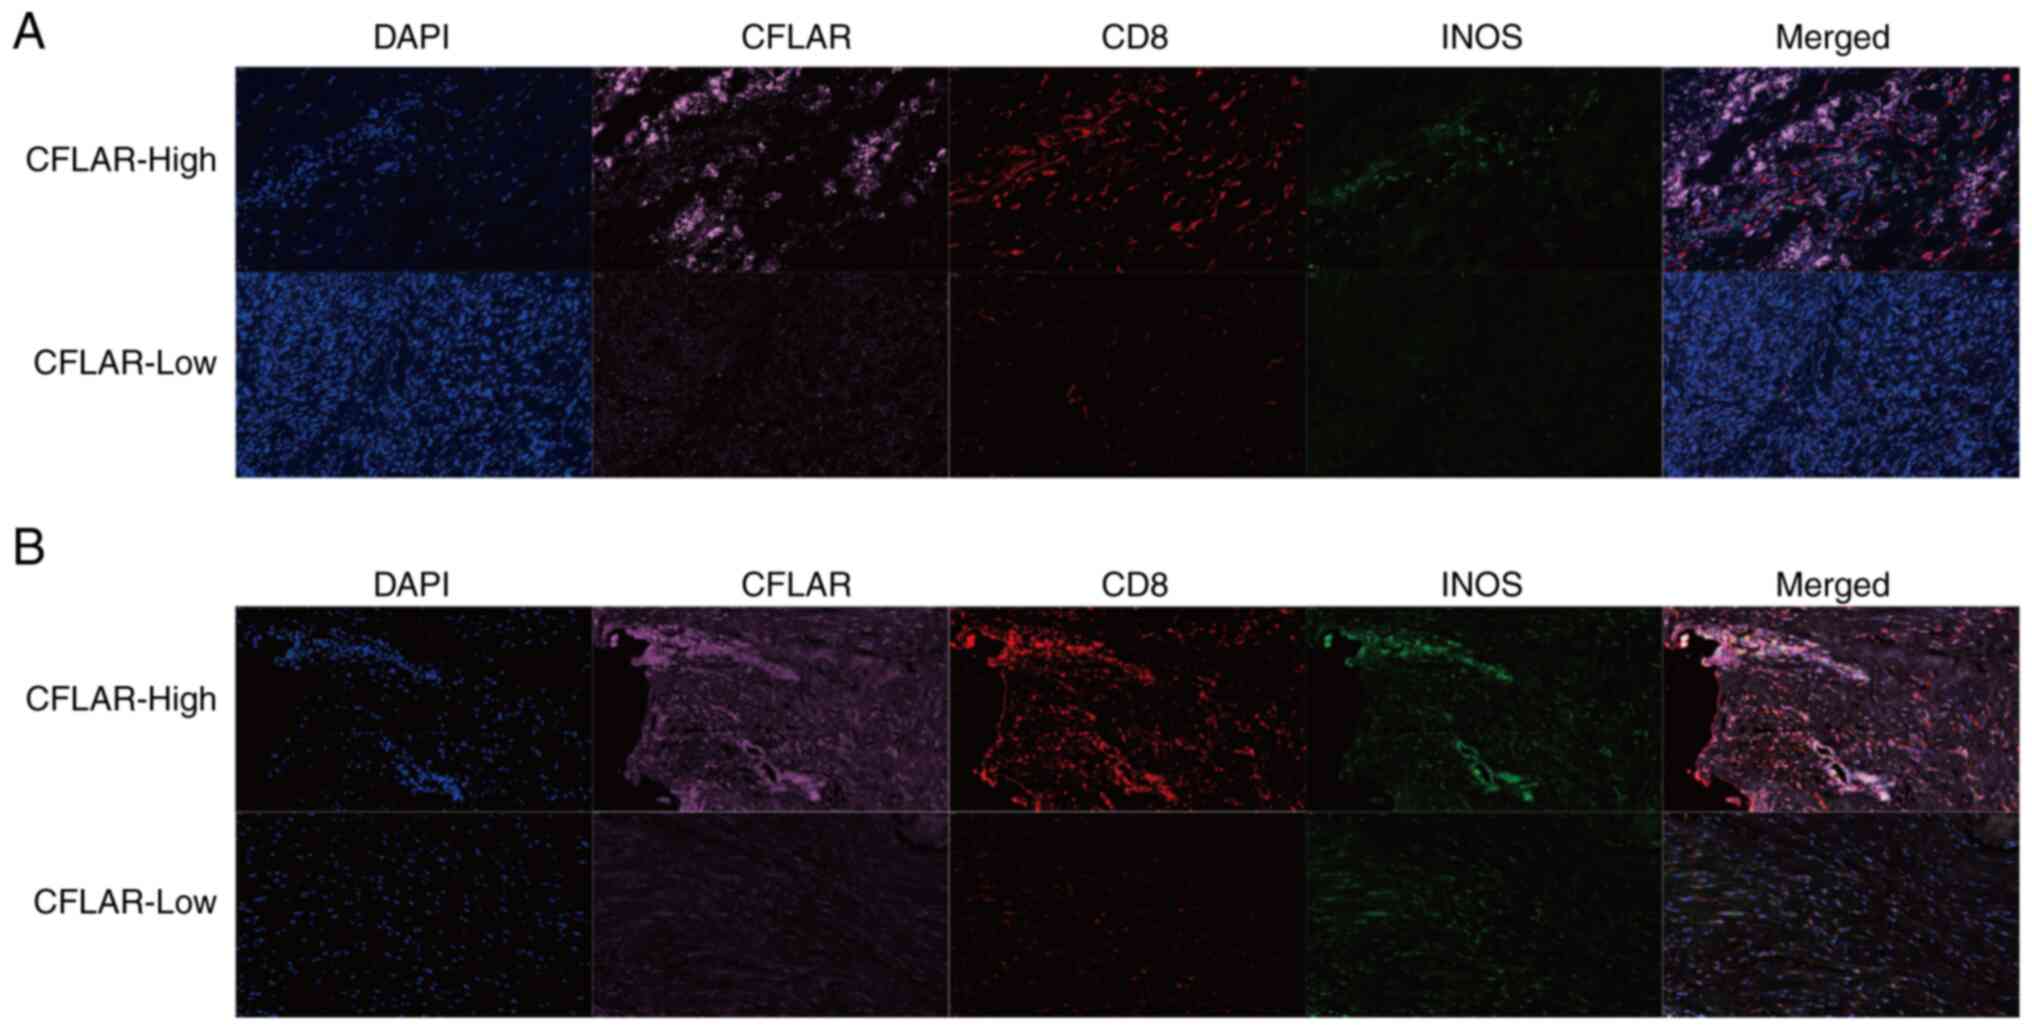
CFLAR promotes infiltration of
CD8+ T cells and M1 macrophages
To further verify the results of the immune cell
infiltration analysis, mIF staining was performed using tumor
tissues of patients with STS. The results of the present study
demonstrated that the infiltration of CD8+ T cells and
M1 macrophages was markedly increased in tumor tissues when CFLAR
expression was high (Fig. 7A and
B). Collectively, the results of the present study highlighted
that CFLAR was associated with the infiltration of CD8+
T cells and the polarization of M1 macrophages.
Discussion
Anoikis was initially used to describe a particular
phenomenon that occurs when a cell undergoes apoptotic cell death
as a result of inadequate interactions with the ECM (40,41).
Subsequently, it was discovered that this distinct form of cell
death serves a crucial role in tumor angiogenesis and metastasis,
and exerts a significant impact on tumor prognosis (40–42).
Healthy epithelial and endothelial cells detach and undergo anoikis
to prevent the growth of cells that have been oncogenically
transformed. However, tumor cells may acquire resistance to this
process, which allows them to migrate to other sites in the body
and form metastatic tumors. This ability to evade anoikis is a key
factor in the progression of cancer (42). Therefore, clarifying the molecular
mechanisms of anoikis and exploring novel targets for tumor
treatment are required.
At present, research is focused on the molecular
mechanisms of anoikis in various types of cancer, including
osteosarcoma; however, studies focused on the role of anoikis in
STS are rare (11,43,44).
Therefore, the present study aimed to explore the diagnostic and
prognostic value of ARGs in STS, and to explore their regulatory
effect on the TME of STS.
Using three machine learning algorithms, LASSO, RF
and SVM, STS Feature genes with the highest importance were
screened from DEARGs. CFLAR, which is also referred to as c-FLIP,
Casper, iFLICE, FLAME-1, CASJ, CLARP, MRIT or usurpin, has a
significant role as a negative regulator of the apoptotic pathway
(45). The results of a previous
study demonstrated that recruitment of CFLAR to either the
death-inducing signaling complex or complex II prevents
procaspase-8 dimerization and activation. As a result, the
activation of the apoptotic cascade is blocked, which may protect
the cell from ligand-mediated death (16).
The results of cell line studies demonstrated that
levels of CFLAR are higher in various types of cancer, including
colorectal carcinoma, gastric adenocarcinoma, pancreatic carcinoma,
melanoma, ovarian carcinoma and prostate carcinoma (46–51).
However, the results of the present study demonstrated that the
expression levels of CFLAR in STS were significantly lower than
those in healthy tissues.
Moreover, the results of a previous study
demonstrated that high CFLAR expression may induce anti-apoptotic
effects in tumor cells, thereby leading to their avoidance of
apoptosis and tumor development (52). Therefore, the association between
CFLAR and STS prognosis was examined; the present study
demonstrated that low CFLAR expression in STS was associated with a
poor prognosis, which differs from the results obtained in
different cancer types (53–57).
The present study aimed to explore the role of CFLAR
expression in STS tissues, and the association between high CFLAR
expression and prognosis. The results of the present study
demonstrated that high CFLAR expression could promote immune cell
infiltration and immune response in the STS TME. The majority of
the genes co-upregulated with CFLAR were enriched in immune-related
functions, and hub genes, such as TNFRSF13B, CXCR5, CD40LG, CR2,
MS4A1, TNFRSF17, POU2AF1, CD1E, CD1B, CCL17 and FLT3, were
associated with immune cell activation and antigen presentation.
The results of the single-cell sequencing analysis demonstrated
that CFLAR was highly expressed in immune cells. Therefore, it was
hypothesized that CFLAR may be associated with immune response.
The results of previous studies have demonstrated
that CFLAR plays an important role in the regulation of T cells.
Notably, CFLAR is required for the survival and proliferation of T
cells, and the expansion of T cells in response to T-cell receptor
(TCR) stimulation (58,59). The presence of CFLAR not only
ensures the survival of T cells with or without TCR activation, but
also promotes the regular circulation of T cells upon stimulation
(58). The results of a previous
study also demonstrated that CFLAR exerts a significant effect on
the activation of T cells. Notably, Jurkat T cells overexpressing
CFLAR have been shown to produce higher levels of IL-2 following
TCR stimulation than wild-type Jurkat T cells. Examination of the
pathways that regulate IL-2 expression revealed that TCR-mediated
activation of NF-κB and mitogen-activated protein kinase
(MAPK)/extracellular-regulated protein kinase (ERK) was augmented
in the presence of increased CFLAR expression (60). Further investigations into these
pathways demonstrated that CFLAR is associated with tumor necrosis
factor receptor-associated factor (TRAF)1, TRAF2 and
receptor-interacting protein 1 (RIP1), which together promote NF-κB
activation. These proteins are also associated with RAF1, which
activates ERK through MAPK/ERK kinase (MEK)1 and MEK2 (59). In conclusion, CFLAR may promote the
activation of T cells, which in turn increases the immune response
in the STS TME.
The results of a previous study demonstrated that
monocytes undergo transformation into macrophages in the peripheral
blood. During this process, monocytes contain low levels of CFLAR
and are highly sensitive to CD95-induced cell death. By contrast,
macrophages express high levels of CFLAR and are resistant to
CD95-induced cell death, despite high levels of CD95 expression on
the cell surface (59). In
addition, it has been demonstrated that the activation of caspase-8
is required for blood monocytes to become macrophages. When primary
monocytes are exposed to macrophage colony-stimulating factor or
when U937 cells are exposed to tissue polypeptide antigen,
caspase-8 interacts with FADD, FLIP and RIP1. This multi-molecular
platform activates caspase-8, which results in the cleavage of
RIP1. The cleavage fragments of RIP1 may reduce the activity of
NF-κB, which leads to the differentiation of monocytes into
macrophages (61). Moreover, the
results of a previous study demonstrated that CFLAR protects
macrophages from lipopolysaccharide-induced pyroptosis via
inhibition of complex II formation (62). The aforementioned studies revealed
that CFLAR inhibits the apoptosis of macrophages through specific
mechanisms, which may explain the positive correlation between the
expression of CFLAR in the STS TME, and the infiltration of M1
macrophages and monocytes observed in the present study.
Notably, CFLAR is closely associated with the
activation of T cells and the maintenance of macrophage activity,
which increases the immune response in the STS TME. The role of
CFLAR in different cancer types remains unclear. On the one hand,
CFLAR may inhibit the apoptosis of tumor cells, and on the other
hand, CFLAR may promote the immune response in the STS TME.
Therefore, it was hypothesized that the main role of CFLAR may
differ between cancer types. For example, in other cancer types,
CFLAR mainly inhibits the apoptosis of tumor cells; however, it
does not significantly promote the immune response. By contrast,
the results of the present study demonstrated that CFLAR mainly
promoted the immune response in the STS TME, whereas the inhibition
of STS cell apoptosis was not observed. As a result, CFLAR
expression is often increased in other types of cancer tissues, and
the corresponding overexpression indicates a poor prognosis.
Notably, the opposite results were observed in STS, and further
investigations are required.
Collectively, the results of the present study
revealed the diagnostic and prognostic value of CFLAR in STS, and
explored the regulatory effects on the STS TME. However, the
present study has several limitations. As STS is rare, the sample
size included in the present study was limited. In addition,
patient survival was only followed up for 2 years, meaning that the
effects of CFLAR on the 5-year survival rate of patients were not
verified. In addition, immunohistochemical data for STS were
limited. Experiments involving cell lines, organoids and animals
were not conducted; thus, further in vivo and in
vitro investigations are required to determine the specific
mechanisms of action of CFLAR in STS.
In conclusion, CFLAR exhibits potential as a
biomarker for the prediction of STS progression and disease
outcomes. In addition, the results of the present study highlighted
that CFLAR may serve a crucial role in determining the immune
response to STS, as it enhances the infiltration of CD8+
T cells and M1 macrophages, which are key immune cells that aid in
the elimination of cancer cells. Collectively, the results of the
present study suggested that CFLAR may exhibit potential as a
therapeutic target in the treatment of STS.
Acknowledgements
The human figure outline in Fig. 1 was sourced from Smart Servier
Medical Art (https://smart.servier.com/), used under a Creative
Commons Attribution 3.0 Unported License (https://creativecommons.org/licenses/by/3.0/). No
modifications were made to the image.
Funding
This study was supported by the National Natural Science
Foundation of China (grant nos. 82002848 and 82272964); the CAMS
Innovation Fund for Medical Sciences (grant nos.
2021-I2M-C&T-B-054 and 2021-I2M-C&T-B-053); the Capital
Characterized Clinical Application Research Fund of Beijing
Municipal Science and Technology Commission of China (grant no.
Z171100001017210); the Fundamental Research Funds for the Central
Universities (grant no. 3332021097); and the Beijing Hope Run
Special Fund of Cancer Foundation of China (grant no.
LC2021A1).
Availability of data and materials
The data generated in the present study may be found
in TCGA, GTEx and GEO databases under accession numbers TCGA-SARC,
GSE17118, GSE21124 and GSE131309 or at the following URLs:
TCGA-SARC, http://xenabrowser.net/datapages/?cohort=GDC%20TCGA%20Sarcoma%20(SARC)&removeHub=https%3A%2F%2Fxena.treehouse.gi.ucsc.edu%3A443;
GTEx, https://xenabrowser.net/datapages/?cohort=GTEX&removeHub=https%3A%2F%2Fxena.treehouse.gi.ucsc.edu%3A443;
GSE17118, https://www.ncbi.nlm.nih.gov/geo/query/acc.cgi?acc=GSE17118;
GSE21124, https://www.ncbi.nlm.nih.gov/geo/query/acc.cgi?acc=GSE21124;
and GSE131309, https://www.ncbi.nlm.nih.gov/geo/query/acc.cgi?acc=GSE131309.
Authors' contributions
XuL analyzed the data, wrote and revised the
manuscript, and spearheaded the verification experiments. SY
conceptualized and oversaw the entire project. XuL and SY confirm
the authenticity of all the raw data. XiL provided project
supervision, participated in data analysis and discussion, and
contributed to manuscript revisions. All authors read and approved
the final manuscript.
Ethics approval and consent to
participate
All tissue samples used in the present study were
reviewed by the institutional ethics committee, and all patients
provided written informed consent. The ethics approval for the
present study was granted by the Institutional Review Board of
National Cancer Center/National Clinical Research Center for
Cancer/Cancer Hospital, Chinese Academy of Medical Sciences and
Peking Union Medical College (approval no. NCC2020C-341; Beijing,
China). All patients who provided specimens for this study gave
written informed consent for their participation.
Patient consent for publication
All patients who provided specimens for this study
gave written informed consent for the publication of results
derived from their specimens, in compliance with ethical standards
and respect for patient confidentiality and privacy.
Competing interests
The authors declare that they have no competing
interests.
Use of artificial intelligence tools
During the preparation of this work, the authors
used ChatGPT 3.5 in order to improve the readability and language
of the article. Subsequently, the authors revised and edited the
content produced by the AI tools as necessary, taking full
responsibility for the ultimate content of the present
manuscript.
Glossary
Abbreviations
Abbreviations:
|
STS
|
soft tissue sarcoma
|
|
CFLAR
|
CASP8 and FADD-like apoptosis
regulator
|
|
ARGs
|
anoikis-related genes
|
|
ECM
|
extracellular matrix
|
|
LASSO
|
Least Absolute Shrinkage and Selection
Operator
|
|
SVM
|
Support Vector Machine
|
|
RF
|
Random Forest
|
|
TME
|
tumor microenvironment
|
|
TCGA
|
The Cancer Genome Atlas
|
|
GTEx
|
Genotype-Tissue Expression
|
|
GEO
|
Gene Expression Omnibus
|
|
ROC
|
receiver operating characteristic
|
|
AUC
|
area under the curve
|
|
GO
|
Gene Ontology
|
|
PPI
|
protein-protein interaction
|
|
UMAP
|
uniform manifold approximation and
projection
|
|
RT-qPCR
|
reverse transcription-quantitative
PCR
|
|
mIF
|
multiplex immunofluorescence
|
|
DEARGs
|
differentially expressed ARGs
|
|
OS
|
overall survival
|
|
ICIs
|
immune checkpoint inhibitors
|
|
TCR
|
T-cell receptor
|
|
MAPK
|
mitogen-activated protein kinase
|
|
ERK
|
extracellular-regulated protein
kinase
|
|
RIP1
|
receptor-interacting protein 1
|
|
MEK1
|
MAPK/ERK kinase 1
|
|
MEK2
|
MAPK/ERK kinase 2
|
|
TRAF
|
tumor necrosis factor
receptor-associated factor
|
References
|
1
|
Gamboa AC, Gronchi A and Cardona K:
Soft-tissue sarcoma in adults: An update on the current state of
histiotype-specific management in an era of personalized medicine.
CA Cancer J Clin. 70:200–229. 2020. View Article : Google Scholar : PubMed/NCBI
|
|
2
|
Vilanova JC: WHO classification of soft
tissue tumors. Imaging of Soft Tissue Tumors. Vanhoenacker F,
Parizel P and Gielen J: 4th Edition. Springer; Cham, Switzerland:
pp. 187–196. 2017, View Article : Google Scholar
|
|
3
|
Hoven-Gondrie ML, Bastiaannet E, Ho VKY,
van Leeuwen BL, Liefers GJ, Hoekstra HJ and Suurmeijer AJ: Worse
survival in elderly patients with extremity soft-tissue sarcoma.
Ann Surg Oncol. 23:2577–2585. 2016. View Article : Google Scholar : PubMed/NCBI
|
|
4
|
Crago AM and Brennan MF: Principles in
management of soft tissue sarcoma. Adv Surg. 49:107–122. 2015.
View Article : Google Scholar : PubMed/NCBI
|
|
5
|
Navarria P, Ascolese AM, Cozzi L, Tomatis
S, D'Agostino GR, De Rose F, De Sanctis R, Marrari A, Santoro A,
Fogliata A, et al: Stereotactic body radiation therapy for lung
metastases from soft tissue sarcoma. Eur J Cancer. 51:668–674.
2015. View Article : Google Scholar : PubMed/NCBI
|
|
6
|
Sameer UK, Kaneez F and Fayaz M:
Understanding the cell survival mechanism of anoikis-resistant
cancer cells during different steps of metastasis. Clin Exp
Metastasis. 39:715–726. 2022. View Article : Google Scholar : PubMed/NCBI
|
|
7
|
Gilmore AP: Anoikis. Cell Death Differ.
12:1473–1477. 2005. View Article : Google Scholar : PubMed/NCBI
|
|
8
|
Weiss F, Lauffenburger D and Friedl P:
Towards targeting of shared mechanisms of cancer metastasis and
therapy resistance. Nat Rev Cancer. 22:157–173. 2022. View Article : Google Scholar : PubMed/NCBI
|
|
9
|
Berezovskaya O, Schimmer AD, Glinskii AB,
Pinilla C, Hoffman RM, Reed JC and Glinsky GV: Increased expression
of apoptosis inhibitor protein XIAP contributes to anoikis
resistance of circulating human prostate cancer metastasis
precursor cells. Cancer Res. 65:2378–2386. 2005. View Article : Google Scholar : PubMed/NCBI
|
|
10
|
Kim YN, Koo KH, Sung JY, Yun UJ and Kim H:
Anoikis resistance: An essential prerequisite for tumor metastasis.
Int J Cell Biol. 2012:3068792012. View Article : Google Scholar : PubMed/NCBI
|
|
11
|
Yu Y, Song Y, Cheng L, Chen L, Liu B, Lu
D, Li X, Li Y, Lv F and Xing Y: CircCEMIP promotes
anoikis-resistance by enhancing protective autophagy in prostate
cancer cells. J Exp Clin Cancer Res. 41:1882022. View Article : Google Scholar : PubMed/NCBI
|
|
12
|
Fulda S: Targeting c-FLICE-like inhibitory
protein (CFLAR) in cancer. Expert Opin Ther Targets. 17:195–201.
2013. View Article : Google Scholar : PubMed/NCBI
|
|
13
|
Irmler M, Thome M, Hahne M, Schneider P,
Hofmann K, Steiner V, Bodmer JL, Schröter M, Burns K, Mattmann C,
et al: Inhibition of death receptor signals by cellular FLIP.
Nature. 388:190–195. 1997. View
Article : Google Scholar : PubMed/NCBI
|
|
14
|
Xiaohong W, Jun Z, Hongmei G and Fan Q:
CFLAR is a critical regulator of cerebral ischaemia-reperfusion
injury through regulating inflammation and endoplasmic reticulum
(ER) stress. Biomed Pharmacother. 117:1091552019. View Article : Google Scholar : PubMed/NCBI
|
|
15
|
Xiao J, Moon M, Yan L, Nian M, Zhang Y,
Liu C, Lu J, Guan H, Chen M, Jiang D, et al: Cellular
FLICE-inhibitory protein protects against cardiac remodelling after
myocardial infarction. Basic Res Cardiol. 107:2392012. View Article : Google Scholar : PubMed/NCBI
|
|
16
|
Shirley S and Micheau O: Targeting c-FLIP
in cancer. Cancer Lett. 332:141–150. 2013. View Article : Google Scholar : PubMed/NCBI
|
|
17
|
Rao-Bindal K, Rao CK, Yu L and Kleinerman
ES: Expression of c-FLIP in pulmonary metastases in osteosarcoma
patients and human xenografts. Pediatr Blood Cancer. 60:575–579.
2013. View Article : Google Scholar : PubMed/NCBI
|
|
18
|
Lafferty-Whyte K, Bilsland A, Hoare SF,
Burns S, Zaffaroni N, Cairney CJ and Keith WN: TCEAL7 inhibition of
c-Myc activity in alternative lengthening of telomeres regulates
hTERT expression. Neoplasia. 12:405–414. 2010. View Article : Google Scholar : PubMed/NCBI
|
|
19
|
Barretina J, Taylor BS, Banerji S, Ramos
AH, Lagos-Quintana M, Decarolis PL, Shah K, Socci ND, Weir BA, Ho
A, et al: Subtype-specific genomic alterations define new targets
for soft-tissue sarcoma therapy. Nat Genet. 42:715–721. 2010.
View Article : Google Scholar : PubMed/NCBI
|
|
20
|
Jerby-Arnon L, Neftel C, Shore ME, Weisman
HR, Mathewson ND, McBride MJ, Haas B, Izar B, Volorio A, Boulay G,
et al: Opposing immune and genetic mechanisms shape oncogenic
programs in synovial sarcoma. Nat Med. 27:289–300. 2021. View Article : Google Scholar : PubMed/NCBI
|
|
21
|
Ritchie ME, Phipson B, Wu D, Hu Y, Law CW,
Shi W and Smyth GK: limma powers differential expression analyses
for RNA-sequencing and microarray studies. Nucleic Acids Res.
43:e472015. View Article : Google Scholar : PubMed/NCBI
|
|
22
|
Friedman J, Hastie T and Tibshirani R:
Regularization paths for generalized linear models via coordinate
descent. J Stat Softw. 33:1–22. 2010. View Article : Google Scholar : PubMed/NCBI
|
|
23
|
Wang H, Yang F and Luo Z: An experimental
study of the intrinsic stability of random forest variable
importance measures. BMC Bioinformatics. 17:602016. View Article : Google Scholar : PubMed/NCBI
|
|
24
|
Huang S, Cai N, Pacheco PP, Narrandes S,
Wang Y and Xu W: Applications of support vector machine (SVM)
learning in cancer genomics. Cancer Genomics Proteomics. 15:41–51.
2018.PubMed/NCBI
|
|
25
|
Tay JK, Narasimhan B and Hastie T: Elastic
net regularization paths for all generalized linear models. J Stat
Softw. 106:12023. View Article : Google Scholar : PubMed/NCBI
|
|
26
|
Liaw A and Wiener M: Classification and
regression by randomForest. R News. 2:18–22. 2002.
|
|
27
|
Meyer D, Dimitriadou E, Hornik K,
Weingessel A and Leisch F: e1071: Misc functions of the department
of statistics, probability theory group (Formerly: E1071), TU Wien.
R package version 1.7–13. 2023.
|
|
28
|
Therneau TM and Grambsch PM: Modeling
survival data: Extending the cox model. New York: Springer; 2000,
ISBN 0-387-98784-3. View Article : Google Scholar
|
|
29
|
Kassambara A, Kosinski M and Biecek P:
survminer: Drawing survival curves using ‘ggplot2’. R package
version 0.4.9. 2021.
|
|
30
|
Blanche P, Dartigues JF and Jacqmin-Gadda
H: Estimating and comparing time-dependent areas under receiver
operating characteristic curves for censored event times with
competing risks. Stat Med. 32:5381–5397. 2013. View Article : Google Scholar : PubMed/NCBI
|
|
31
|
Kassambara A: ggpubr: ‘ggplot2’ Based
Publication Ready Plots. R package version 0.6.0. 2023.
|
|
32
|
Hänzelmann S, Castelo R and Guinney A:
GSVA: Gene set variation analysis for microarray and RNA-seq data.
BMC Bioinformatics. 14:72013. View Article : Google Scholar : PubMed/NCBI
|
|
33
|
Yoshihara K, Kim H and Verhaak RG:
Estimate of stromal and immune cells in malignant tumor tissues
from expression data. R package version 1.0.13/r21. 2016.
|
|
34
|
Wu T, Hu E, Xu S, Chen M, Guo P, Dai Z,
Feng T, Zhou L, Tang W, Zhan L, et al: ClusterProfiler 4.0: A
universal enrichment tool for interpreting omics data. The
Innovation. 2:1001412021. View Article : Google Scholar : PubMed/NCBI
|
|
35
|
Gentleman RC, Carey VJ, Bates DM, Bolstad
B, Dettling M, Dudoit S, Ellis B, Gautier L, Ge Y, Gentry J, et al:
Bioconductor: Open software development for computational biology
and bioinformatics. Genome Biol. 5:R802005. View Article : Google Scholar
|
|
36
|
Stuart T, Butler A, Hoffman P, Hafemeister
C, Papalexi E, Mauck WM III, Hao Y, Stoeckius M, Smibert P and
Satija R: Comprehensive integration of single-cell data. Cell.
177:1888–1902. 2019. View Article : Google Scholar : PubMed/NCBI
|
|
37
|
Jerby-Arnon L, Neftel C, Shore ME, Weisman
HR, Mathewson ND, McBride MJ, Haas B, Izar B, Volorio A, Boulay G,
et al: Opposing immune and genetic mechanisms shape oncogenic
programs in synovial sarcoma. Nat Med. 27:289–300. 2021. View Article : Google Scholar : PubMed/NCBI
|
|
38
|
Hu C, Li T, Xu Y, Zhang X, Li F, Bai J,
Chen J, Jiang W, Yang K, Ou Q, et al: CellMarker 2.0: An updated
database of manually curated cell markers in human/mouse and web
tools based on scRNA-seq data. Nucleic Acids Res. 51:D870–D876.
2023. View Article : Google Scholar : PubMed/NCBI
|
|
39
|
Livak KJ and Schmittgen TD: Analysis of
relative gene expression data using real-time quantitative PCR and
the 2(−Delta Delta C(T)) method. Methods. 25:402–408. 2001.
View Article : Google Scholar : PubMed/NCBI
|
|
40
|
Frisch SM and Ruoslahti E: Integrins and
anoikis. Curr Opin Cell Biol. 9:701–706. 1997. View Article : Google Scholar : PubMed/NCBI
|
|
41
|
Frisch SM and Screaton RA: Anoikis
mechanisms. Curr Opin Cell Biol. 13:555–562. 2001. View Article : Google Scholar : PubMed/NCBI
|
|
42
|
Rennebeck G, Martelli M and Kyprianou N:
Anoikis and survival connections in the tumor microenvironment: Is
there a role in prostate cancer metastasis? Cancer Res.
65:11230–11235. 2005. View Article : Google Scholar : PubMed/NCBI
|
|
43
|
Chen Y, Huang W, Ouyang J, Wang J and Xie
Z: Identification of anoikis-related subgroups and prognosis model
in liver hepatocellular carcinoma. Int J Mol Sci. 24:28622023.
View Article : Google Scholar : PubMed/NCBI
|
|
44
|
Zhang Z, Zhu Z, Fu J, Liu X, Mi Z, Tao H
and Fan H: Anoikis patterns exhibit distinct prognostic and immune
landscapes in osteosarcoma. Int Immunopharmacol. 115:1096842023.
View Article : Google Scholar : PubMed/NCBI
|
|
45
|
Micheau O: Cellular FLICE-inhibitory
protein: An attractive therapeutic target? Expert Opin Ther
Targets. 7:559–573. 2003. View Article : Google Scholar : PubMed/NCBI
|
|
46
|
Hernandez A, Wang QD, Schwartz SA and
Evers BM: Sensitization of human colon cancer cells to
TRAIL-mediated apoptosis. J Gastrointest Surg. 5:56–65. 2001.
View Article : Google Scholar : PubMed/NCBI
|
|
47
|
Nam SY, Jung GA, Hur GC, Chung HY, Kim WH,
Seol DW and Lee BL: Upregulation of FLIP(S) by Akt, a possible
inhibition mechanism of TRAIL-induced apoptosis in human gastric
cancers. Cancer Sci. 94:1066–1073. 2003. View Article : Google Scholar : PubMed/NCBI
|
|
48
|
Elnemr A, Ohta T, Yachie A, Kayahara M,
Kitagawa H, Fujimura T, Ninomiya I, Fushida S, Nishimura GI,
Shimizu K and Miwa K: Human pancreatic cancer cells disable
function of Fas receptors at several levels in Fas signal
transduction pathway. Int J Oncol. 18:311–316. 2001.PubMed/NCBI
|
|
49
|
Griffith TS, Chin WA, Jackson GC, Lynch DH
and Kubin MZ: Intracellular regulation of TRAIL-induced apoptosis
in human melanoma cells. J Immunol. 161:2833–2840. 1998. View Article : Google Scholar : PubMed/NCBI
|
|
50
|
Xiao CW, Yan X, Li Y, Reddy SAG and Tsang
BK: Resistance of human ovarian cancer cells to tumor necrosis
factor alpha is a consequence of nuclear factor kappaB-mediated
induction of Fas-associated death domain-like
interleukin-1beta-converting enzyme-like inhibitory protein.
Endocrinology. 144:623–630. 2003. View Article : Google Scholar : PubMed/NCBI
|
|
51
|
Zhang X, Jin TG, Yang H, DeWolf WC,
Khosravi-Far R and Olumi AF: Persistent c-FLIP(L) expression is
necessary and sufficient to maintain resistance to tumor necrosis
factor-related apoptosis-inducing ligand-mediated apoptosis in
prostate cancer. Cancer Res. 64:7086–7091. 2004. View Article : Google Scholar : PubMed/NCBI
|
|
52
|
Wang L, Jin H, Jochems F, Wang S, Lieftink
C, Martinez IM, De Conti G, Edwards F, de Oliveira RL, Schepers A,
et al: cFLIP suppression and DR5 activation sensitize senescent
cancer cells to senolysis. Nat Cancer. 3:1284–1299. 2022.
View Article : Google Scholar : PubMed/NCBI
|
|
53
|
Ullenhag GJ, Mukherjee A, Watson NFS,
Al-Attar AH, Scholefield JH and Durrant LG: Overexpression of FLIPL
is an independent marker of poor prognosis in colorectal cancer
patients. Clin Cancer Res. 13:5070–5075. 2007. View Article : Google Scholar : PubMed/NCBI
|
|
54
|
Wang W, Wang S, Song X, Sima N, Xu X, Luo
A, Chen G, Deng D, Xu Q, Meng L, et al: The relationship between
c-FLIP expression and human papillomavirus E2 gene disruption in
cervical carcinogenesis. Gynecol Oncol. 105:571–577. 2007.
View Article : Google Scholar : PubMed/NCBI
|
|
55
|
Valnet-Rabier MB, Challier B, Thiebault S,
Angonin R, Margueritte G, Mougin C, Kantelip B, Deconinck E, Cahn
JY and Fest T: c-Flip protein expression in Burkitt's lymphomas is
associated with a poor clinical outcome. Br J Haematol.
128:767–773. 2005. View Article : Google Scholar : PubMed/NCBI
|
|
56
|
Valente G, Manfroi F, Peracchio C, Nicotra
G, Castino R, Nicosia G, Castino R, Nicosia G, Kerim S and Isidoro
C: cFLIP expression correlates with tumour progression and patient
outcome in non-Hodgkin lymphomas of low grade of malignancy. Br J
Haematol. 132:560–570. 2006. View Article : Google Scholar : PubMed/NCBI
|
|
57
|
Korkolopoulou P, Goudopoulou A, Voutsinas
G, Thomas-Tsagli E, Kapralos P, Patsouris E and Saetta AA: c-FLIP
expression in bladder urothelial carcinomas: Its role in resistance
to Fas-mediated apoptosis and clinicopathologic correlations.
Urology. 63:1198–1204. 2004. View Article : Google Scholar : PubMed/NCBI
|
|
58
|
Chau H, Wong V, Chen NJ, Huang HL, Lin WJ,
Mirtsos C, Elford AR, Bonnard M, Wakeham A, You-Ten AI, et al:
Cellular FLICE-inhibitory protein is required for T cell survival
and cycling. J Exp Med. 202:405–413. 2005. View Article : Google Scholar : PubMed/NCBI
|
|
59
|
Budd RC, Yeh WC and Tschopp J: cFLIP
regulation of lymphocyte activation and development. Nat Rev
Immunol. 6:196–204. 2006. View Article : Google Scholar : PubMed/NCBI
|
|
60
|
Kataoka T, Budd RC, Holler N, Thome M,
Martinon F, Irmler M, Burns K, Hahne M, Kennedy N, Kovacsovics M
and Tschopp J: The caspase-8 inhibitor FLIP promotes activation of
NF-kappaB and Erk signaling pathways. Curr Biol. 10:640–648. 2000.
View Article : Google Scholar : PubMed/NCBI
|
|
61
|
Rébé C, Cathelin S, Launay S, Filomenko R,
Prévotat L, L'Ollivier C, Gyan E, Micheau O, Grant S,
Dubart-Kupperschmitt A, et al: Caspase-8 prevents sustained
activation of NF-kappaB in monocytes undergoing macrophagic
differentiation. Blood. 109:1442–1450. 2007. View Article : Google Scholar : PubMed/NCBI
|
|
62
|
Muendlein HI, Jetton D, Connolly WM,
Eidell KP, Magri Z, Smirnova I and Poltorak A: cFLIPL protects
macrophages from LPS-induced pyroptosis via inhibition of complex
II formation. Science. 367:1379–1384. 2020. View Article : Google Scholar : PubMed/NCBI
|