Introduction
The second most frequent disease globally and the
fifth most common cause of cancer-related mortality in men is
prostate cancer (PCa) (1). Digital
rectal examination and serum prostate-specific antigen (PSA)
testing, followed by transrectal ultrasonography (TRUS)-guided
biopsy, have historically been used to identify PCa (2). Despite being the preferred approach
for PCa diagnosis, TRUS-guided biopsy has several inherent
drawbacks. A TRUS-guided biopsy may ignore abnormalities in the
anterior and apical prostate, producing false-negative findings in
addition to being an invasive treatment with a chance of
potentially life-threatening infections (3). As a result, it is critical to
investigate alternative strategies that may decrease the number of
needless prostate biopsies or perhaps completely replace puncture
biopsy to diagnose PCa (4,5).
A non-invasive diagnostic called multiparametric MRI
(mpMRI) has great potential for identifying and staging PCa
(6). The Prostate Imaging Reporting
and Data System version 2.1 (PI-RADS v2.1), the most recent version
of the structured reporting system for mpMRI, aims to improve
inter-reader agreement and streamline the evaluation of prostate
mpMRI using PI-RADS criteria (7).
Despite these developments, mpMRI also has numerous defects, such
as false-positive results (8) and
new histopathological patterns (9),
and alternative non-invasive diagnostic modalities still need to be
researched and used.
A type II transmembrane glycoprotein called
prostate-specific membrane antigen (PSMA) is overexpressed in
almost all cases of PCa (10–12).
However, the clinical use of the nuclide 68Ga has been
constrained by the cost, its short half-life and high electron
energy during synthesis. Specifically, producing 68Ga is
costly due to the need for specialized equipment. Its short
half-life requires rapid use, challenging for centers far from
production sites. The high electron energy needed for creating
68Ga compounds adds to the complexity and cost, limiting
its wider clinical use (13). The
most frequently utilized positron nuclide in clinical practice has
been 18F-DCFPyL, based on a glutamate-urea-lysine
structure. In contrast to 68Ga-PSMA-11,
18F-DCFPyL has excellent affinity, advantageous in
vivo pharmacokinetics, good solubility and the possibility for
a better rate of minor lesion detection. As a result, it performs
better and is more appropriate for broader usage in clinical
practice (14–16).
Only a few studies have evaluated the use of
18F-DCFPyL PET and 68Ga-PSMA PET/CT in the
diagnosis of patients with suspected PCa; most of this research
involved patients with biopsy-proven PCa. In the present study, a
meta-analysis was performed using previously published data to
acquire complete comprehension of the diagnostic performance of
18F-DCFPyL PET and 68Ga-PSMA PET/CT in
evaluating patients with suspected PCa.
Methods
Search strategy
The guidelines for preferred reporting items for
systematic reviews and meta-analyses (PRISMA) (17) were followed when conducting this
study. The protocol for this study was registered on the
International Platform of Registered Systematic Review and
Meta-analysis Protocols database on February 13, 2024
(INPLASY202420059) and is available in full on inplasy (https://doi.org/10.37766/inplasy2024.2.0059).
Using the PubMed (http://pubmed.ncbi.nlm.nih.gov/), Embase (www.embase.com) and Web of Science (https://www.webofscience.com/) databases, a
comprehensive search for literature up until September 2023 was
conducted. ‘Positron-Emission Tomography’ OR ‘PET’ OR ‘Positron
Emission Tomography Imaging’ OR ‘PET Scan’ OR ‘PET Imaging’ AND
‘Prostate Specific Membrane Antigen’ OR ‘PSMA’ AND ‘Prostate
Neoplasms’ OR ‘Prostatic Cancers’ OR ‘Prostatic Cancer’ OR
‘Prostatic Neoplasm’ OR ‘Prostate Neoplasm’ OR ‘Prostate tumor’
were the key words used (Table
SI). Two researchers (JG and LH) independently integrated
computer-generated search results with manual searches to ensure
diversity and prevent omitting pertinent literature. In addition,
the list of references included in the study was screened to find
any other articles that were left out in the initial search.
Inclusion and exclusion criteria
Studies were considered eligible for inclusion if
they met all of the following criteria: i) They involved untreated
patients with suspected PCa, which included individuals whose
prostates had abnormalities found during an abnormal PSA test, an
abnormal MRI scan or a digital rectal examination; ii) diagnostic
imaging was performed using an 18F-DCFPyL PET scan or a
68Ga-PSMA PET/CT scan; iii) the reference standard used
for comparison was histological biopsy and histopathology; and iv)
the number of subjects was ≥10.
The following exclusion criteria were applied: i)
Duplicate articles; ii) abstracts, editorial comments, letters,
case reports, reviews or meta-analyses; iii) titles and abstracts
that were clearly irrelevant; iv) insufficient data to perform
calculations; and v) articles not written in English.
Two researchers (JG and LH) meticulously assessed
the titles and abstracts of the retrieved papers whilst applying
the above-mentioned inclusion and exclusion criteria. Following
this initial screening procedure, the full-text versions of the
remaining articles were carefully examined to determine whether
they were appropriate for inclusion in the ensuing stage. The
researchers reached a consensus in a discussion with a third author
(ZJ) to resolve any disagreements during the evaluation.
Quality assessment and data
extraction
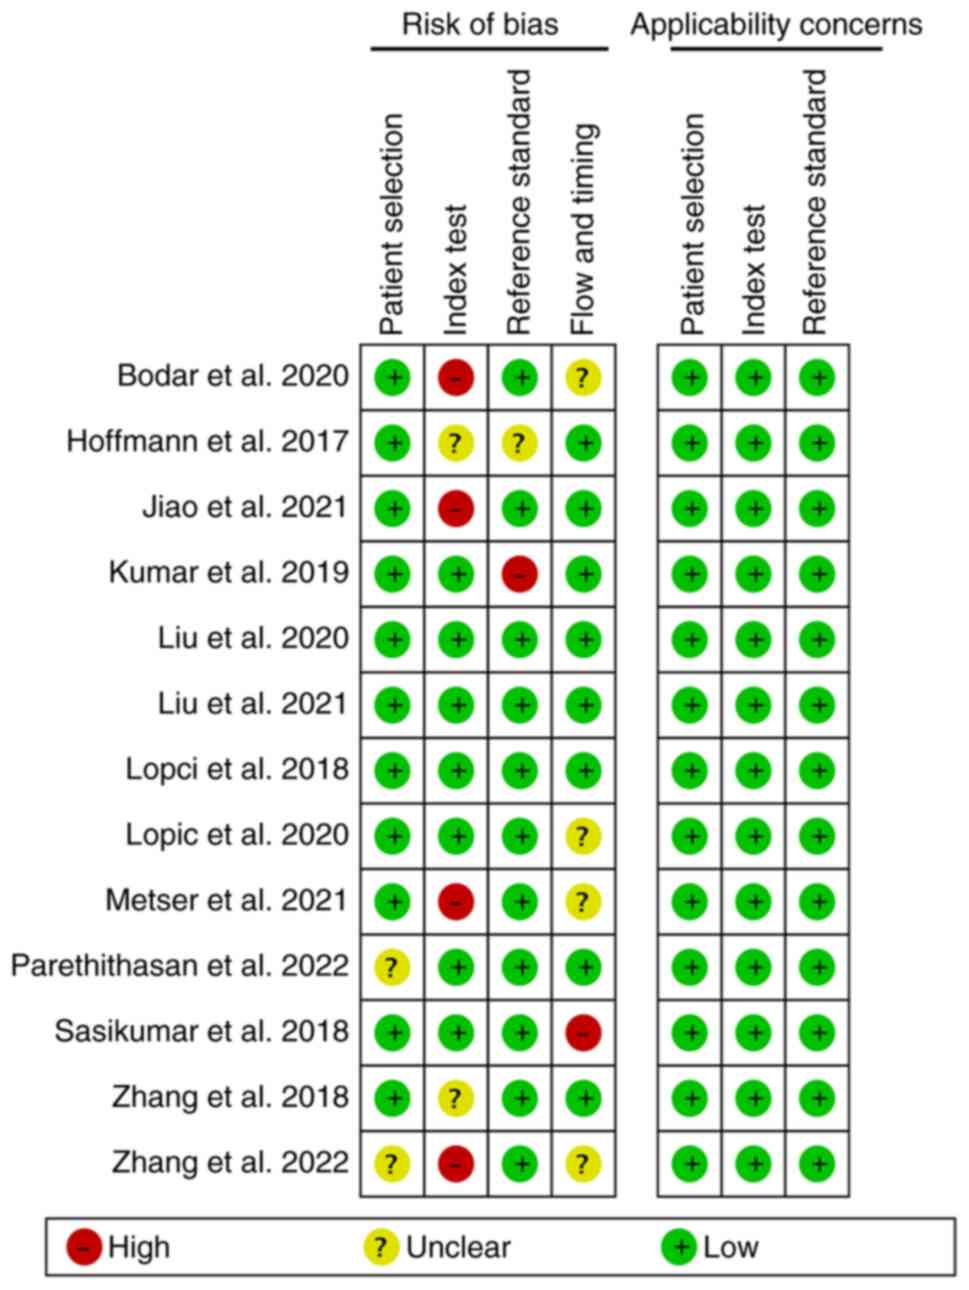
Using the Quality Assessment of Diagnostic
Performance Studies (QUADAS-2) method, two researchers (SY and BM)
independently assessed the quality of the included articles
(18). The following areas of each
study were evaluated: Patient selection, the index test, the
reference standard and the flow and timing of the study. These
domains were assessed for risk of bias and given a high, low or
unclear applicability rating. Discussions with a third reviewer
(ZJ) helped to settle any differences that came up.
For each study, two researchers independently
extracted the data. General information, characteristics of the
literature, demographic information regarding the patients,
technical information and outcomes related to the total number of
patients, as well as true positive (TP), false positive (FP), true
negative (TN) and false negative (FN) counts, were all included in
the data. These values were computed using test findings for
sensitivity, specificity, positive predictive value (PPV) and
negative predictive value (NPV) in cases where they weren't
expressly provided. The sensitivity was calculated as the ratio of
TP to the sum of TP and FN [sensitivity=TP/(TP + FN)], while
specificity was calculated as the ratio of TN to the sum of TN and
FP [specificity=TN/(TN + FP)]. The PPV was derived as the ratio of
TP to the sum of TP and FP [PPV=TP/(TP + FP)], and the NPV as the
ratio of TN to the sum of TN and FN [NPV=TN/(TN + FN)]. These
formulas allowed for a consistent and objective assessment of the
diagnostic performance across the included studies.
Statistical analysis
The best outcome was chosen for analysis when the
included publications provided a range of diagnostic performances
based on cut-off thresholds for classifying positive and negative
scans. Stata 16.0 (StataCorp LP) and Meta-Disc 1.4 (http://www.hrc.es/investigacion/metadisc_en.htm)
were used to examine the data of a four-grid table. As the
bivariate random-effects model can simultaneously adapt to the
inherent correlation between the sensitivity and specificity of
different studies, it also explains the heterogeneity between
studies (19). Using a bivariate
random random-effects model, the pooled sensitivity and specificity
for 18F-DCFPyL PET and 68Ga-PSMA PET/CT were
reported as estimates with 95% confidence intervals (CIs). In
addition, because the summary receiver operating characteristic
(SROC) model facilitates the interpretation of diagnostic test
accuracy in the presence of heterogeneity and varying threshold
effects, this model was used to generate the SROC curve and
determine the area under the curve (AUC) (19,20).
The difference of the pooled AUC between 18F-DCFPyL PET
and 68Ga-PSMA PET/CT was analyzed using Z test
statistics (21,22).
Using the I2 statistic, the heterogeneity
between the pooled studies was evaluated. Meta-regression analysis
was used to explore potential causes of heterogeneity when there
was significant heterogeneity (I2>50%) (23). The funnel plot test developed by
Deek was used to evaluate publication bias. Stata 16.0 and
Meta-Disc 1.4 were used for all statistical calculations.
Statistical significance was defined as P<0.05.
Results
Literature search and study
selection
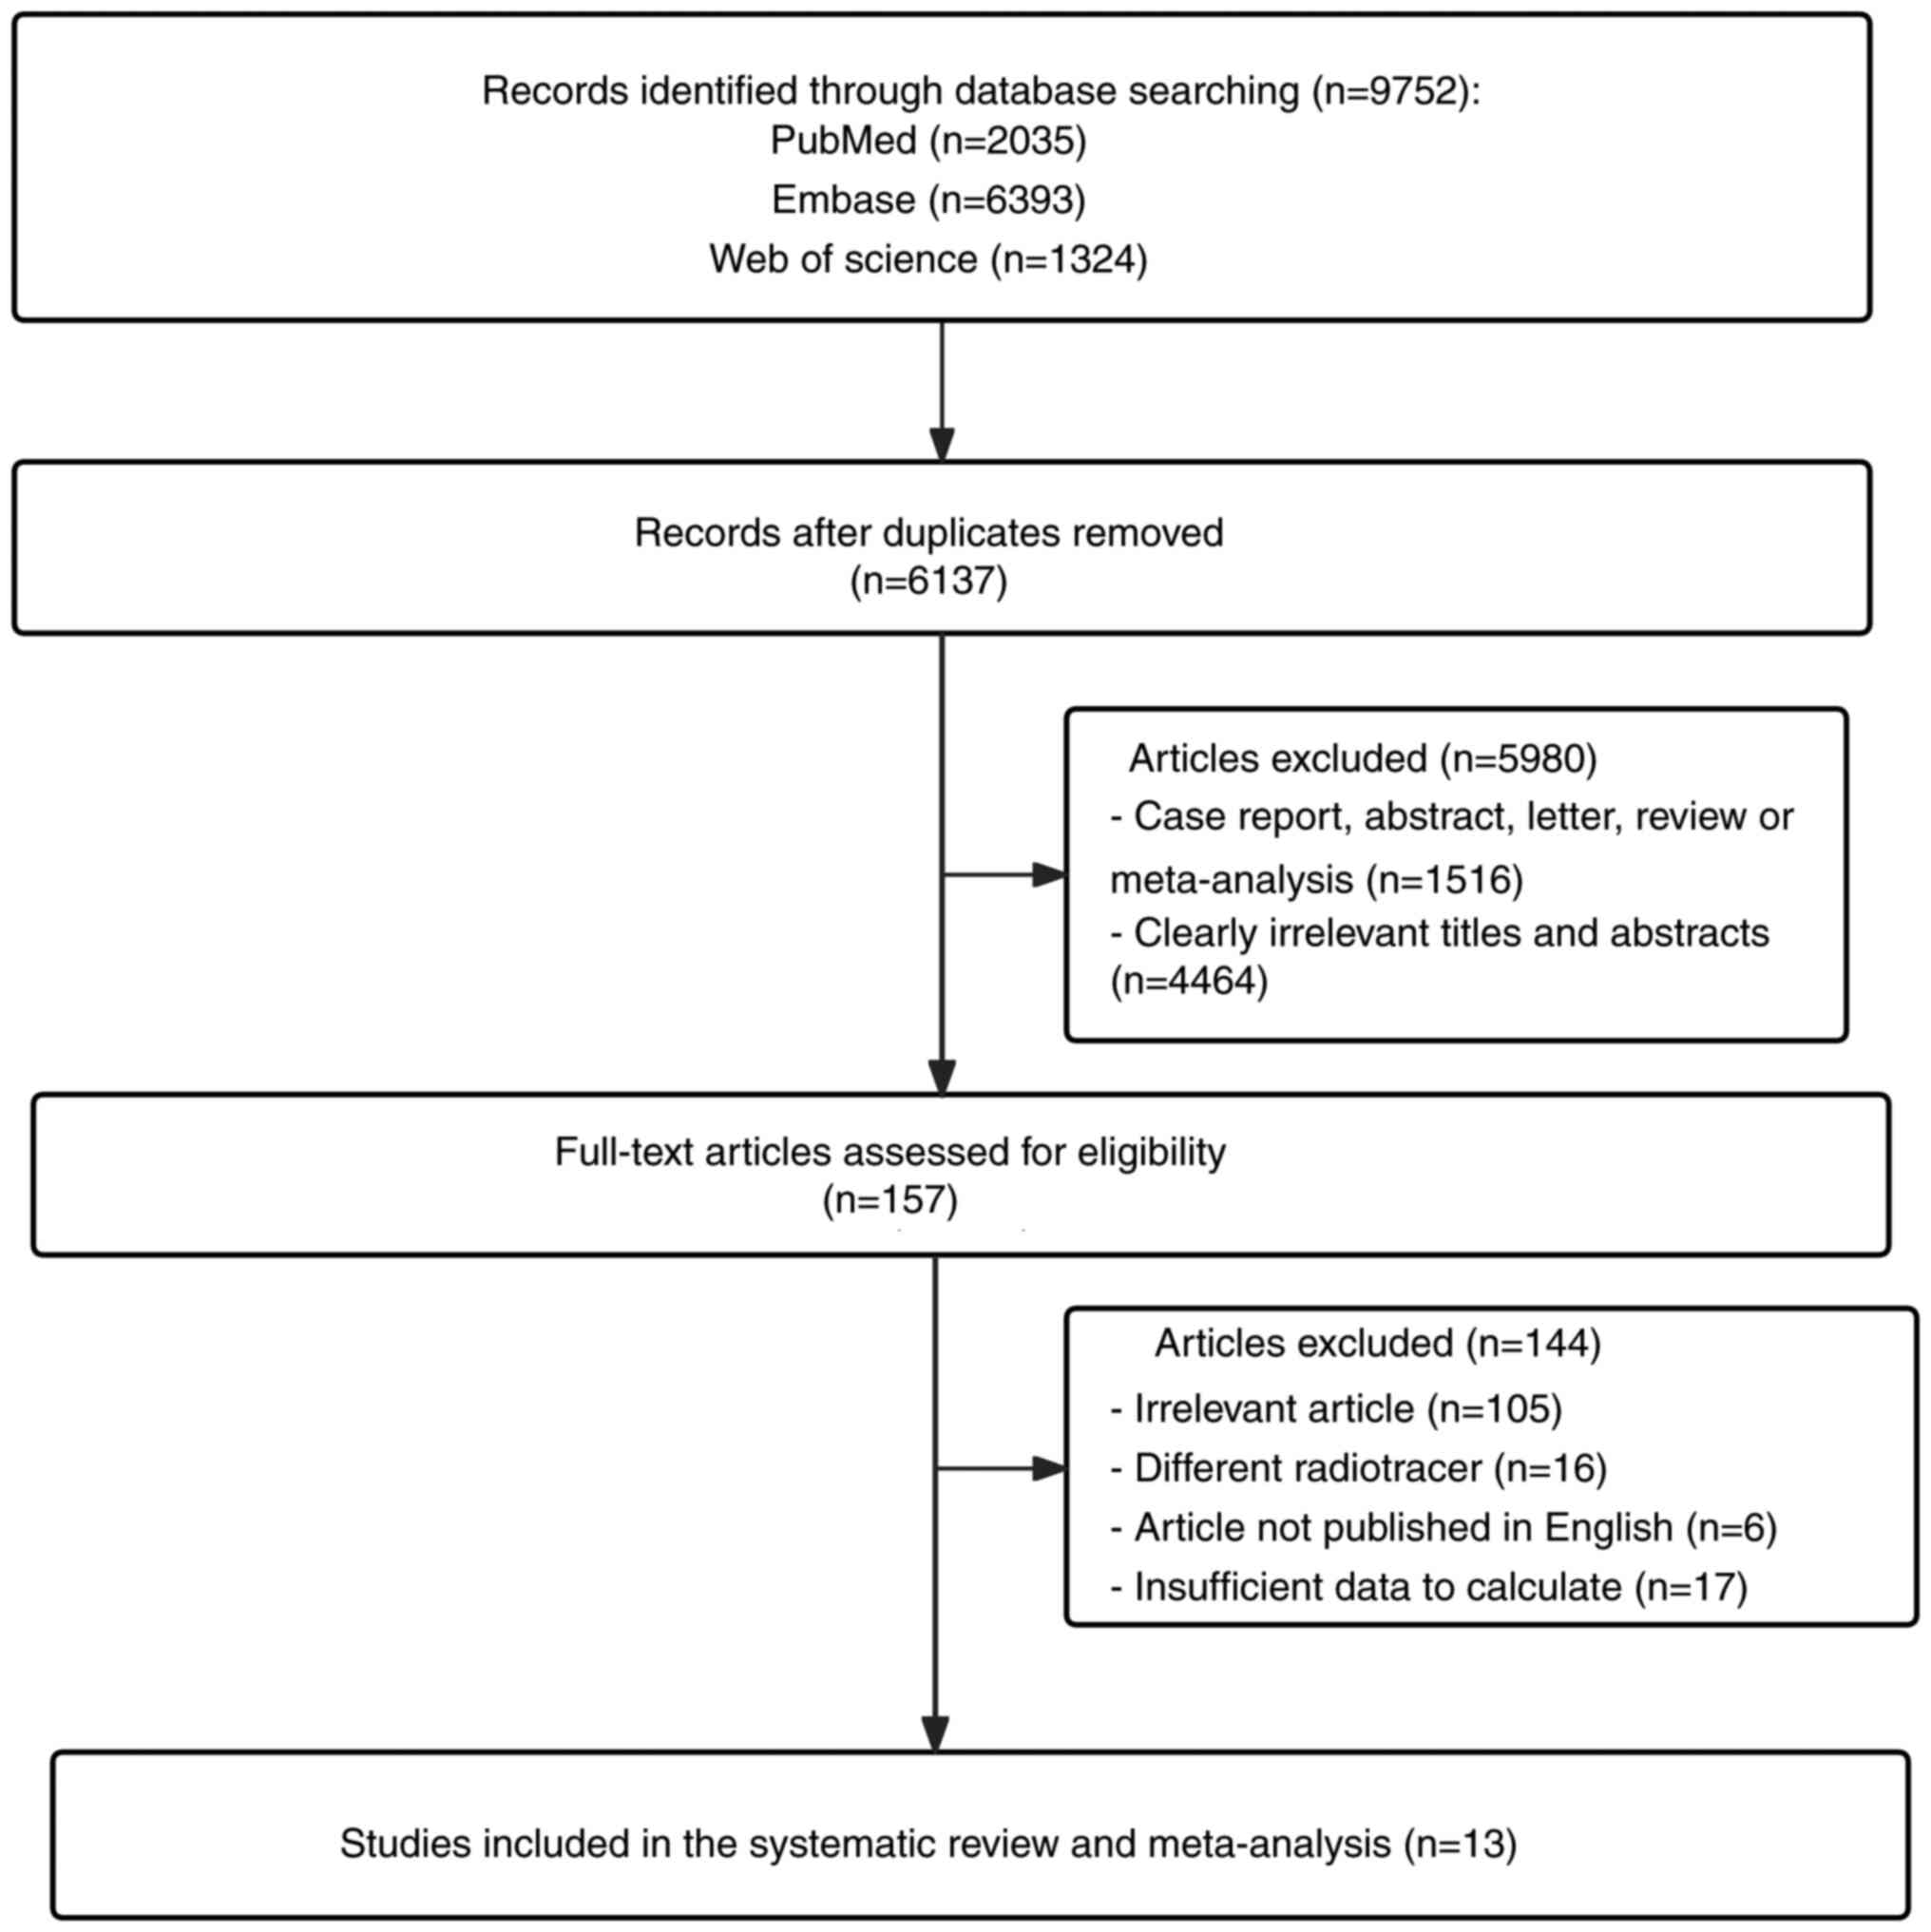
A total of 9,752 entries were found in the original
search and 3,615 duplicates were removed, leaving 6,137 articles
for further analysis. After examining the titles and abstracts,
5,980 items were deemed unrelated and discarded. The 105 unrelated
studies, 6 articles not published in English, 16 articles using
various radiotracers and 17 articles not providing sufficient data
for the computation were all eliminated after further study of the
remaining articles. Finally, 13 studies (24–36)
assessing the diagnostic performance of 18F-DCFPyL PET
or 68Ga-PSMA PET/CT were considered eligible for
meta-analysis. The study selection procedure is depicted by a
PRISMA flow diagram in Fig. 1.
Study description and quality
assessment
There were 1,178 patients with suspected PCa in the
13 qualifying studies. The mean of the median and mean ages of the
patients in the evaluable articles was 67.4 years (range, 43–90
years). The study and patient characteristics are listed in
Table I and the technical details
of 18F-DCFPyL PET and 68Ga-PSMA PET/CT are
provided in Table II.
 | Table I.Study and patient characteristics of
the included articles. |
Table I.
Study and patient characteristics of
the included articles.
|
|
| Study
characteristics | Patient
characteristics |
|
|---|
|
|
|
|
|
|
|---|
| Author(s),
year | Modality | Country | Study design | Analysis | Number of
patients | PSA level,
ng/ml | Age, years | Gleason score | (Refs.) |
|---|
| Metser et
al, 2021 |
18F-DCFPyL PET | Canada | Pro | PB | 55 | 8.8±5.3 | 65.1±7.2 | NA | (25) |
| Zhang et al,
2022 |
18F-DCFPyL PET | China | Retro | PB | 56 | 20.4
(1.9–1000) | Mean: 68 (43–83) | ≤7: 33.9%; ≥8:
55.3%; Unknown: 10.7% | (26) |
| Bodar et al,
2020 |
18F-DCFPyL PET | Netherlands | Pro | LB | 420 | Median: 11.1 | Mean: 68.5 | ≤7, 53.3%; ≥8,
46.7% | (24) |
| Liu et al,
2021 |
18F-DCFPyL PET | China | Retro | PB | 52 | 18.3±16.0 | Mean: 65
(48–79) | ≤7, 38.4%; ≥8,
61.6% | (27) |
| Parathithasan et
al, 2022 |
18F-DCFPyL PET | Australia | Retro | PB | 65 | 14.3±11.6 | Mean: 67 (44–80) | ≤7, 64.7%; ≥8,
35.3% | (28) |
| Hoffmann et
al, 2017 |
68Ga-PSMA PET/CT | Germany | Retro | PB | 25 | 20.4±33.5 | 67.0±8.1 | ≤7: 60%; ≥8:
40% | (29) |
| Lopci et al,
2018 |
68Ga-PSMA PET/CT | Italy | Pro | PB | 45 | Median: 7.24 | Median: 64 | NA | (30) |
| Sasikumar et
al, 2018 |
68Ga-PSMA PET/CT | India | Pro | PB | 66 | 11.56
(0.85–4156) | 67 (48–90) | ≤7: 72%; ≥8:
28% | (31) |
| Kumar et al,
2019 |
68Ga-PSMA PET/CT | India | Pro | PB | 15 | Mean: 9.9
(5.1–19.5) | Mean: 66.2
(57–73) | ≤7: 53%; ≥8: 7%;
Unknown: 40% | (32) |
| Zhang et al,
2018 |
68Ga-PSMA PET/CT | China | Retro | PB | 58 | 15.46
(1.31–49.07) | 70 (55–85) | ≤7: 69%; ≥8:
31% | (33) |
| Liu et al,
2020 |
68Ga-PSMA PET/CT | China | Pro | PB | 31 | 18
(5.48–49.77) | 65 (53–81) | NA | (34) |
| Lopci et al,
2020 |
68Ga-PSMA PET/CT | Italy | Pro | PB | 97 | 7.6
(1.86–32.6) | 74.7 (43–81) | ≤7: 92%; ≥8:
8% | (35) |
| Jiao et al,
2021 |
68Ga-PSMA PET/CT | China | Pro | PB | 193 | NA | 68.21±9.37 | ≤7: 29%; ≥8:
71% | (36) |
| Table II.Technical aspects of included
studies. |
Table II.
Technical aspects of included
studies.
| Author(s),
year | Scanner
modality | Ligand dose | Image analysis | TP | FP | FN | TN | Total | (Refs.) |
|---|
| Metser et
al, 2021 | Siemens Healthcare:
Biograph mMR; PET/MRI, Siemens Healthineers | 329.5 MBq/kg | Quantitative | 39 | 12 | 3 | 1 | 55 | (25) |
| Zhang et al,
2022 | Siemens Medical
Solutions: PET/CT, Siemens Healthineers | 4.44 MBq/kg | Quantitative | 45 | 0 | 5 | 6 | 56 | (26) |
| Bodar et al,
2020 | Philips
Healthcare®: PET/CT system | 313 MBq/kg | Quantitative | 103 | 9 | 19 | 289 | 420 | (24) |
| Liu et al,
2022 | Siemens Healthcare:
Biograph 64 PET/CT Biograph mMR; PET/MRI, Siemens Healthineers | NA | Quantitative | 40 | 2 | 3 | 7 | 52 | (27) |
| Parathithasan et
al, 2022 | General Electric
Medical Systems: PET/CT | 250 MBq/kg | Quantitative | 59 | 4 | 2 | 0 | 65 | (28) |
| Hoffmann et
al, 2017 | Siemens Healthcare:
Biograph 64, PET/CT scanner, Siemens Healthineers | 176 MBq/kg | Quantitative | 21 | 0 | 2 | 2 | 25 | (29) |
| Lopci et al,
2018 | Siemens Healthcare:
Biograph LSO 6 scanner; PET/CT, Siemens Healthineers | Range: 250–400
MBq/kg | Quantitative | 11 | 14 | 0 | 20 | 45 | (30) |
| Sasikumar et
al, 2018 | NA | 100 MBq/kg | Quantitative | 50 | 6 | 0 | 10 | 66 | (31) |
| Kumar et al,
2019 | Siemens Healthcare:
PET/CT, Siemens Healthineers | Range: 1.8–2.2
MBq/kg | Quantitative | 8 | 2 | 1 | 4 | 15 | (32) |
| Zhang et al,
2018 | Siemens Medical
Solutions: Biograph 40 system, PET/CT, Siemens Healthineers | 206.09 MBq/kg | Quantitative | 33 | 4 | 3 | 18 | 58 | (33) |
| Liu et al,
2020 | Philips Medical
Systems: PET/CT | 206.09 MBq/kg | Quantitative | 14 | 4 | 1 | 12 | 31 | (34) |
| Lopci et al,
2020 | Siemens Medical
Solutions: Biograph LSO 6 scanner, PET/CT, Siemens
Healthineers | Range: 250–400
MBq/kg | Quantitative | 23 | 41 | 0 | 33 | 97 | (35) |
| Jiao et al,
2021 | Siemens Medical
Solutions: Biograph 40 system, PET/CT, Siemens Healthineers | NA | Quantitative | 126 | 7 | 22 | 48 | 193 | (36) |
Fig. 2 shows the
results of the risk of bias assessment for these 13 studies, which
was performed using the QUADAS-2 technique. The included studies'
quality was deemed to be adequate.
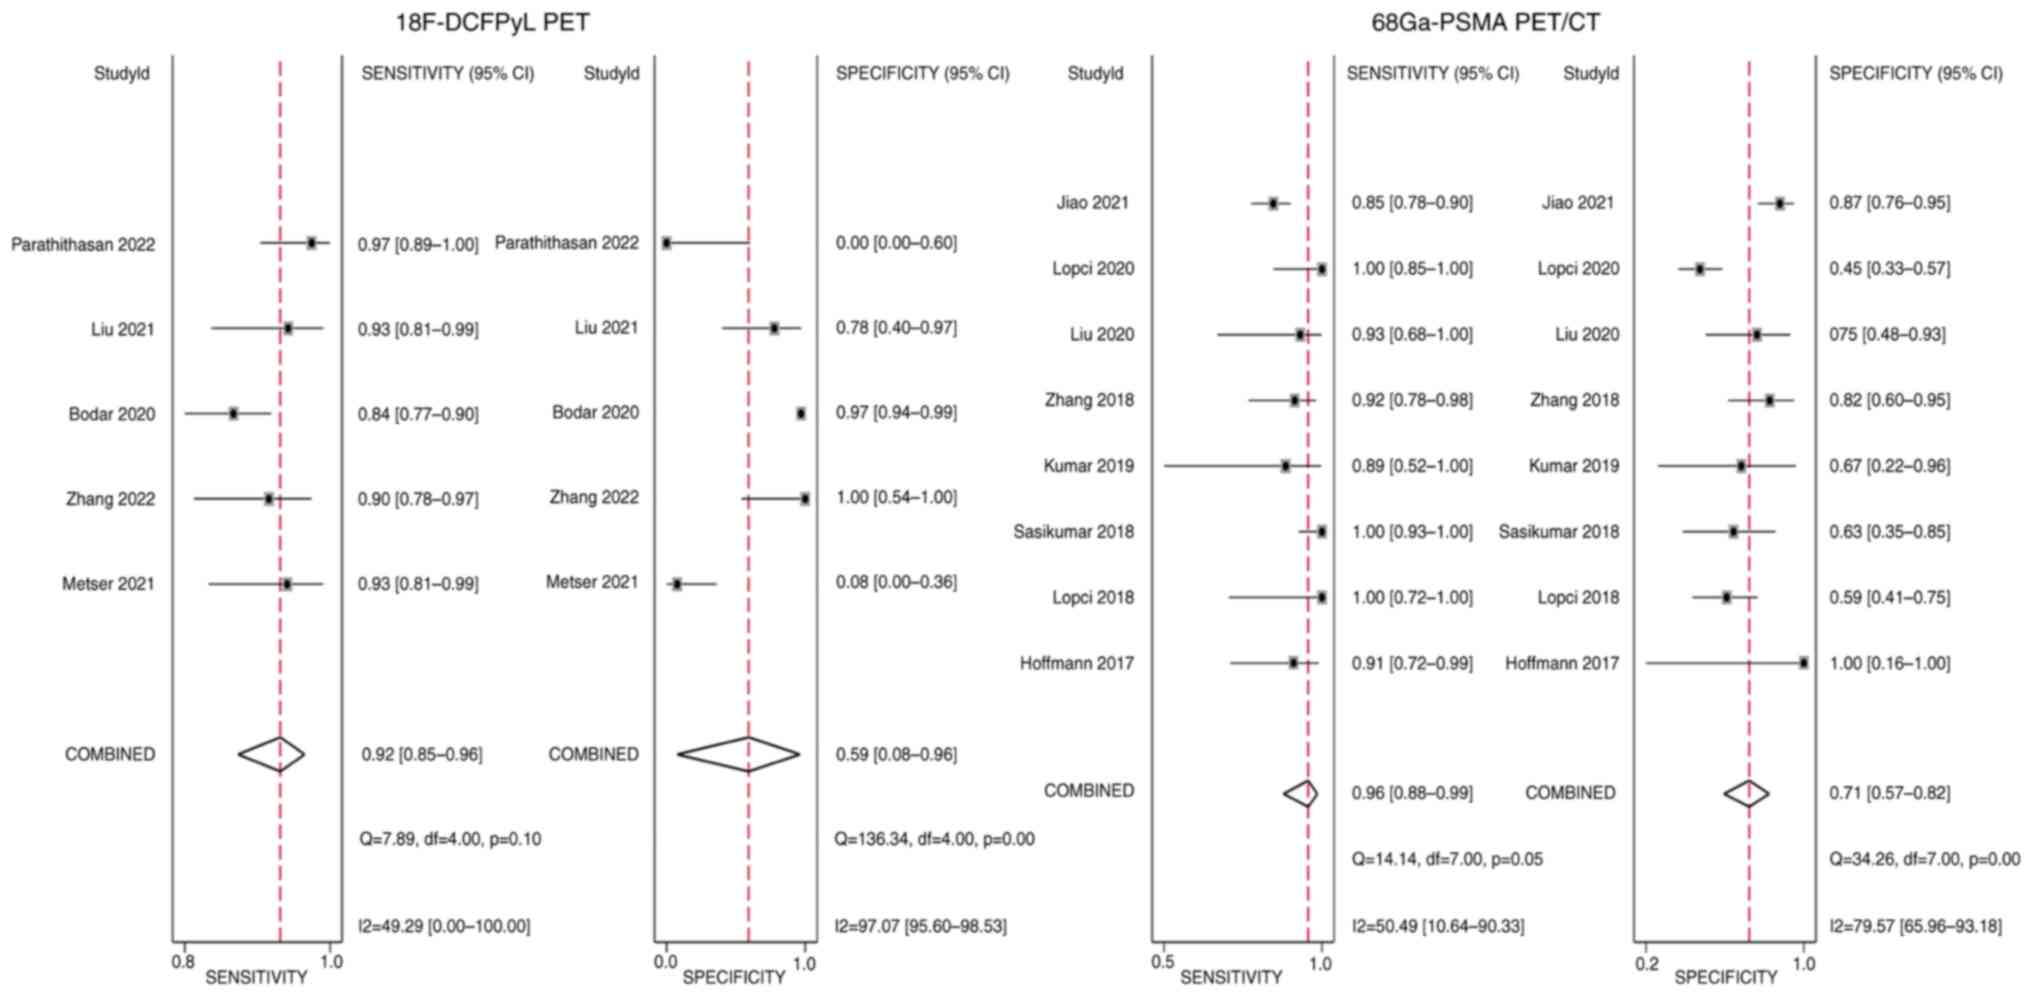
Quantitative synthesis
The analysis comprised a total of 13 trials with
1,178 patients. The pooled sensitivity and specificity of
18F-DCFPyL PET for suspected PCa were 0.92 (95% CI,
0.85–0.96) and 0.59 (95% CI, 0.08–0.96), respectively. The pooled
sensitivity and specificity for 68Ga-PSMA PET/CT were,
respectively, 0.96 (95% CI, 0.88–0.99) and 0.71 (95% CI, 0.57–0.82)
(Fig. 3).
In the SROC analysis, the AUC for
18F-DCFPyL PET and 68Ga-PSMA PET/CT were
calculated to be 0.92 (95% CI, 0.89–0.94) and 0.92 (95% CI,
0.89–0.94) and there was no statistically significant difference
according to Z-test statistics (Z<0.001, P<0.999) (Fig. 4).
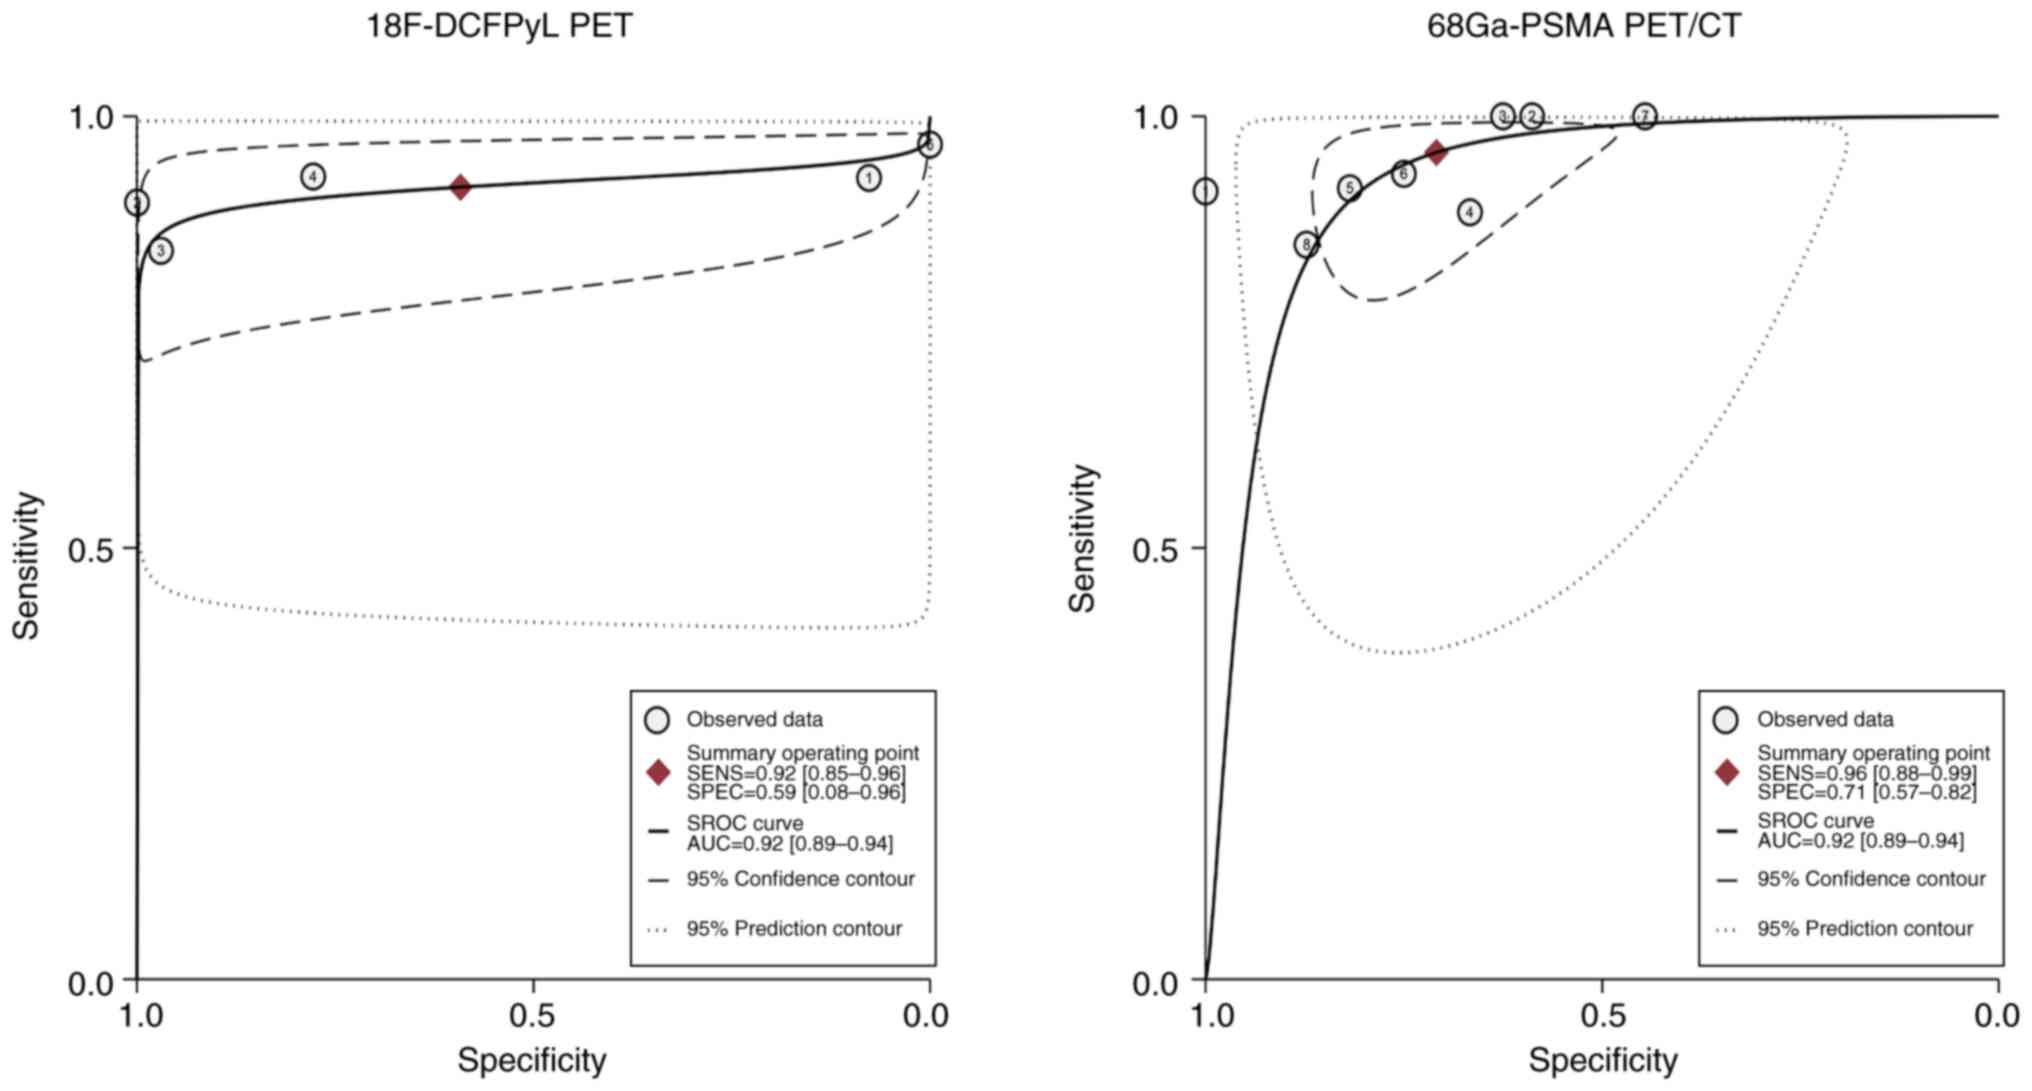 | Figure 4.SROC curve of the diagnostic
performance of 18F-DCFPyL PET and 68Ga-PSMA
PET/CT for detecting prostate cancer. SROC, summary receiver
operating characteristic; PSMA, prostate-specific membrane antigen;
PET, positron emission tomography; SENS, sensitivity; SPEC,
specificity; AUC, area under the curve. In the
18F-DCFPyL PET section: 1, Metser et al (25), 2021; 2, Zhang et al (26), 2022; 3, Bodar et al (24), 2020; 4, Liu et al (27), 2022; 5, Parathithasan et al
(28), 2022. In the
68Ga-PSMA PET/CT section: 1, Hoffmann et al
(29), 2017; 2, Lopci et al
(30), 2018; 3, Sasikumar et
al (31), 2018; 4, Kumar et
al (32), 2019; 5, Zhang et
al (33), 2018; 6, Liu et
al (34), 2020; 7, Lopci et
al (35), 2020; 8, Jiao et
al (36), 2021. |
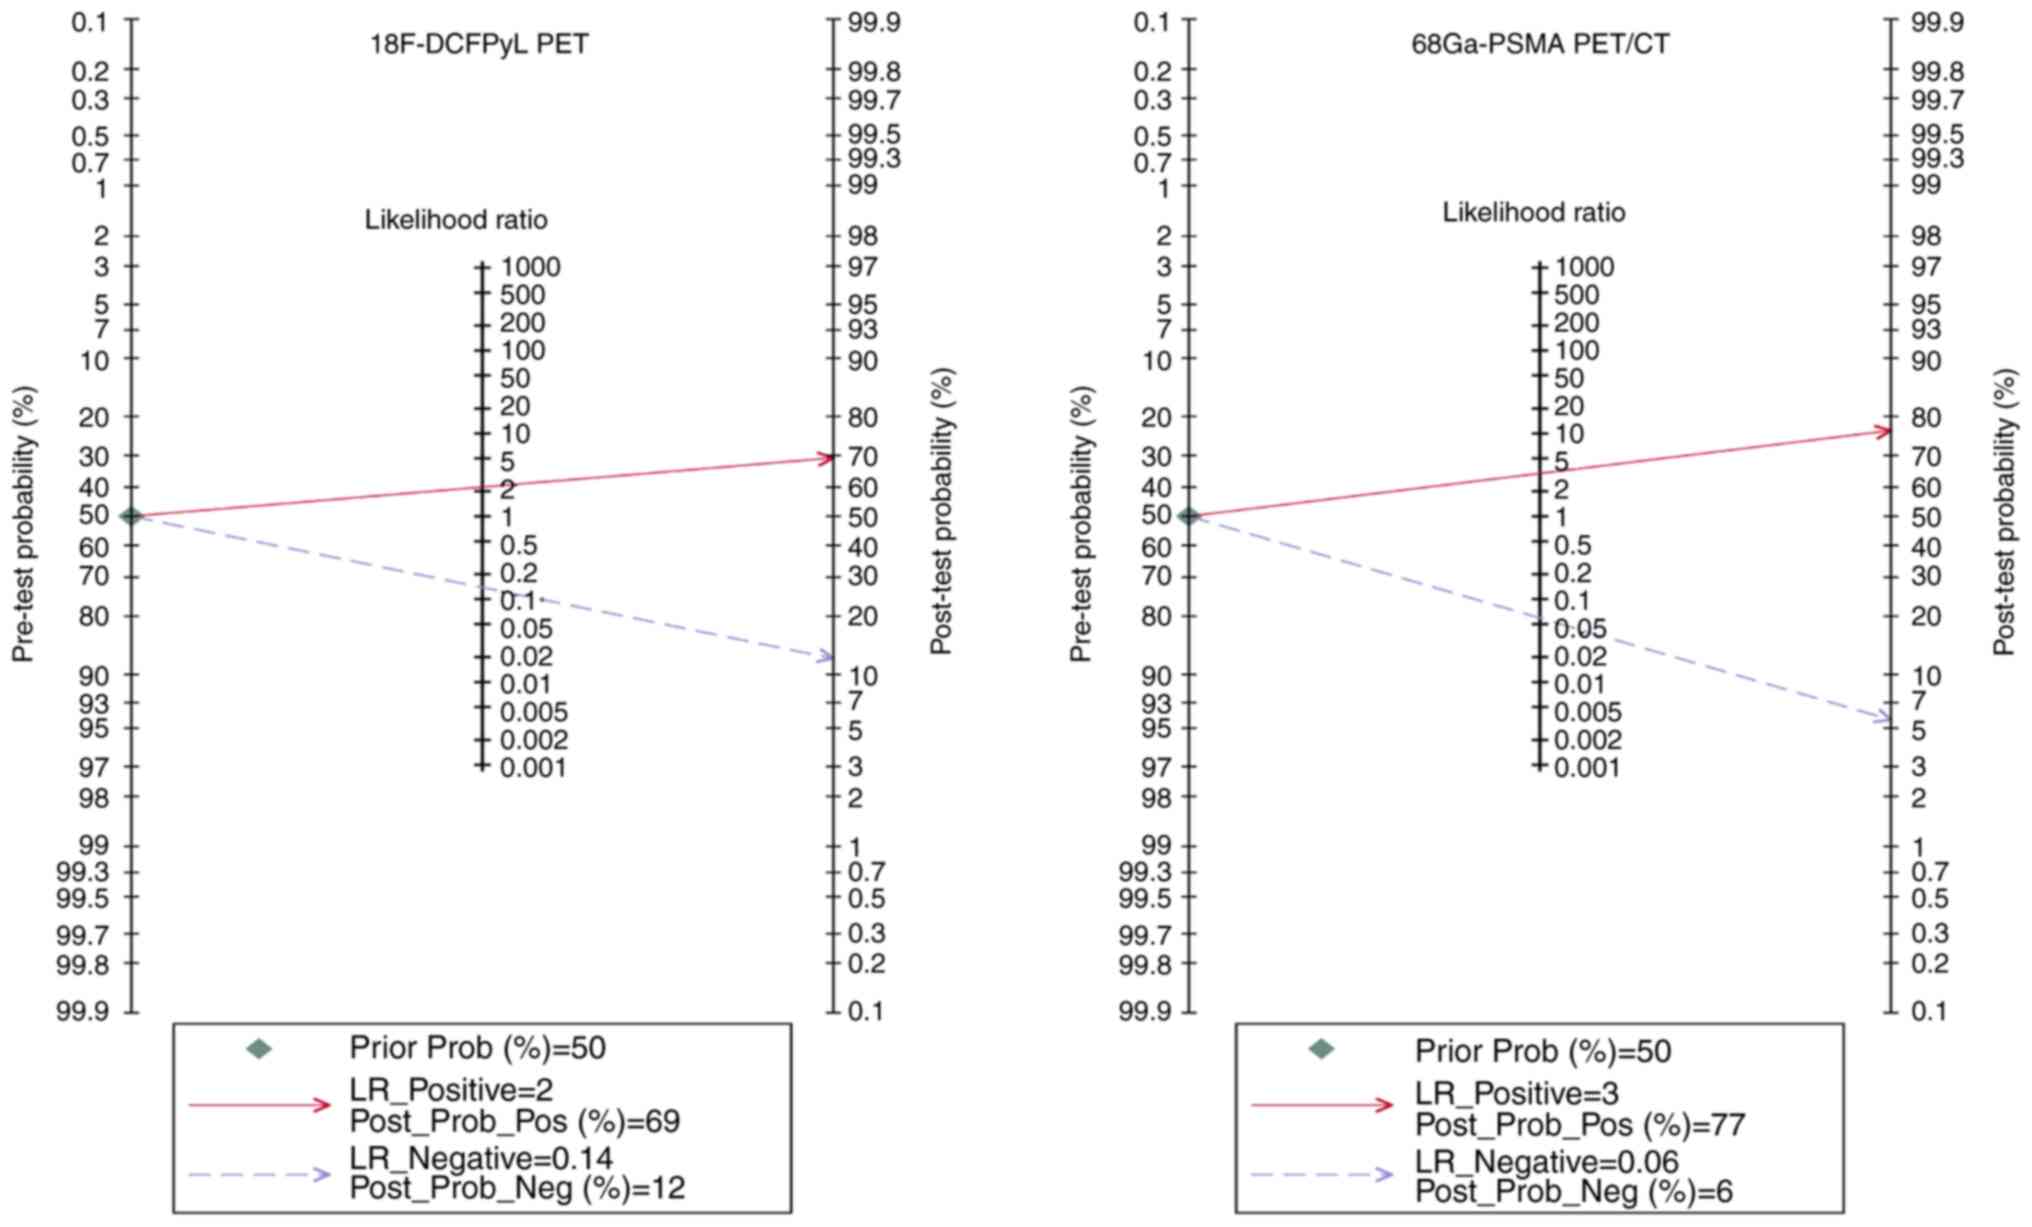
Furthermore, the Fagan nomogram in Fig. 5 showed that the post-test
probabilities for 18F-DCFPyL PET and
68Ga-PSMA PET/CT could rise to 69 and 77%, respectively,
when the pre-test probability was 50%.
Heterogeneity analysis
The I2 values for 18F-DCFPyL
PET's pooled sensitivity and specificity for primary cancer were
49.29 and 97.07%, respectively. The corresponding I2
values for 68Ga-PSMA PET/CT's heterogeneity were 50.49
and 79.57% (Fig. 3). It was
attempted to identify the cause of heterogeneity by using
meta-regression analysis. It demonstrated that diversities in
geographical region and study design were two potential causes of
heterogeneity for these two imaging agents (Tables III and IV).
| Table III.Meta-regression and subgroup analysis
of 18F-DCFPyL positron emission tomography. |
Table III.
Meta-regression and subgroup analysis
of 18F-DCFPyL positron emission tomography.
| Covariate | Studies, n | Sensitivity
(95%Cl) | P-value | Specificity (95%
CI) | P-value |
|---|
| Analysis |
|
| 0.48 |
| 0.13 |
|
Patient-based | 4 | 0.94
(0.90–0.97) |
| 0.42
(−0.28–1.00) |
|
|
Lesion-based | 1 | 0.84
(0.75–0.94) |
| 0.97
(0.83–1.00) |
|
| Region |
|
| 0.24 |
| 0.03 |
|
Western | 3 | 0.92
(0.87–0.98) |
| 0.24
(−0.47–0.95) |
|
|
Asian | 2 | 0.92
(0.84–0.99) |
| 0.95
(0.75–1.00) |
|
| Sample size |
|
| 0.48 |
| 0.13 |
|
≤60 | 4 | 0.94
(0.90–0.97) |
| 0.42
(−0.28–1.00) |
|
|
>60 | 1 | 0.84
(0.75–0.94) |
| 0.97
(0.83–1.00) |
|
| Study design |
|
| 0.02 |
| 0.80 |
|
Prospective | 2 | 0.89
(0.81–0.97) |
| 0.61
(−0.50–1.00) |
|
|
Retrospective | 3 | 0.94
(0.89–0.99) |
| 0.67
(−0.29–1.00) |
|
| Table IV.Meta-regression and subgroup analyses
of 68Ga-prostate-specific membrane antigen positron
emission tomography/CT. |
Table IV.
Meta-regression and subgroup analyses
of 68Ga-prostate-specific membrane antigen positron
emission tomography/CT.
| Covariate | Studies, n | Sensitivity
(95%Cl) | P-value | Specificity (95%
CI) | P-value |
|---|
| Year of
publication |
|
| 0.71 |
| 0.65 |
|
2017-2018 | 4 | 0.96
(0.92–1.00) |
| 0.72
(0.55–0.89) |
|
|
2019-2021 | 4 | 0.95
(0.87–1.00) |
| 0.71
(0.52–0.89) |
|
| Region |
|
| 0.42 |
| <0.001 |
|
Western | 5 | 0.97
(0.95–1.00) |
| 0.54
(0.41–0.67) |
|
|
Asian | 3 | 0.88
(0.80–0.95) |
| 0.83
(0.75–0.92) |
|
| Sample size |
|
| 0.85 |
| 0.93 |
|
≤60 | 5 | 0.95
(0.88–1.00) |
| 0.74
(0.59–0.89) |
|
|
>60 | 3 | 0.97
(0.92–1.00) |
| 0.66
(0.47–0.85) |
|
| Study design |
|
| 0.50 |
| 0.44 |
|
Prospective | 6 | 0.97
(0.92–1.00) |
| 0.67
(0.54–0.80) |
|
|
Retrospective | 2 | 0.92
(0.81–1.00) |
| 0.84
(0.65–1.00) |
|
In addition, Deek's funnel plot showed no evidence
of publishing bias for both imaging modalities, with P-values of
0.17 and 0.90 (Fig. 6).
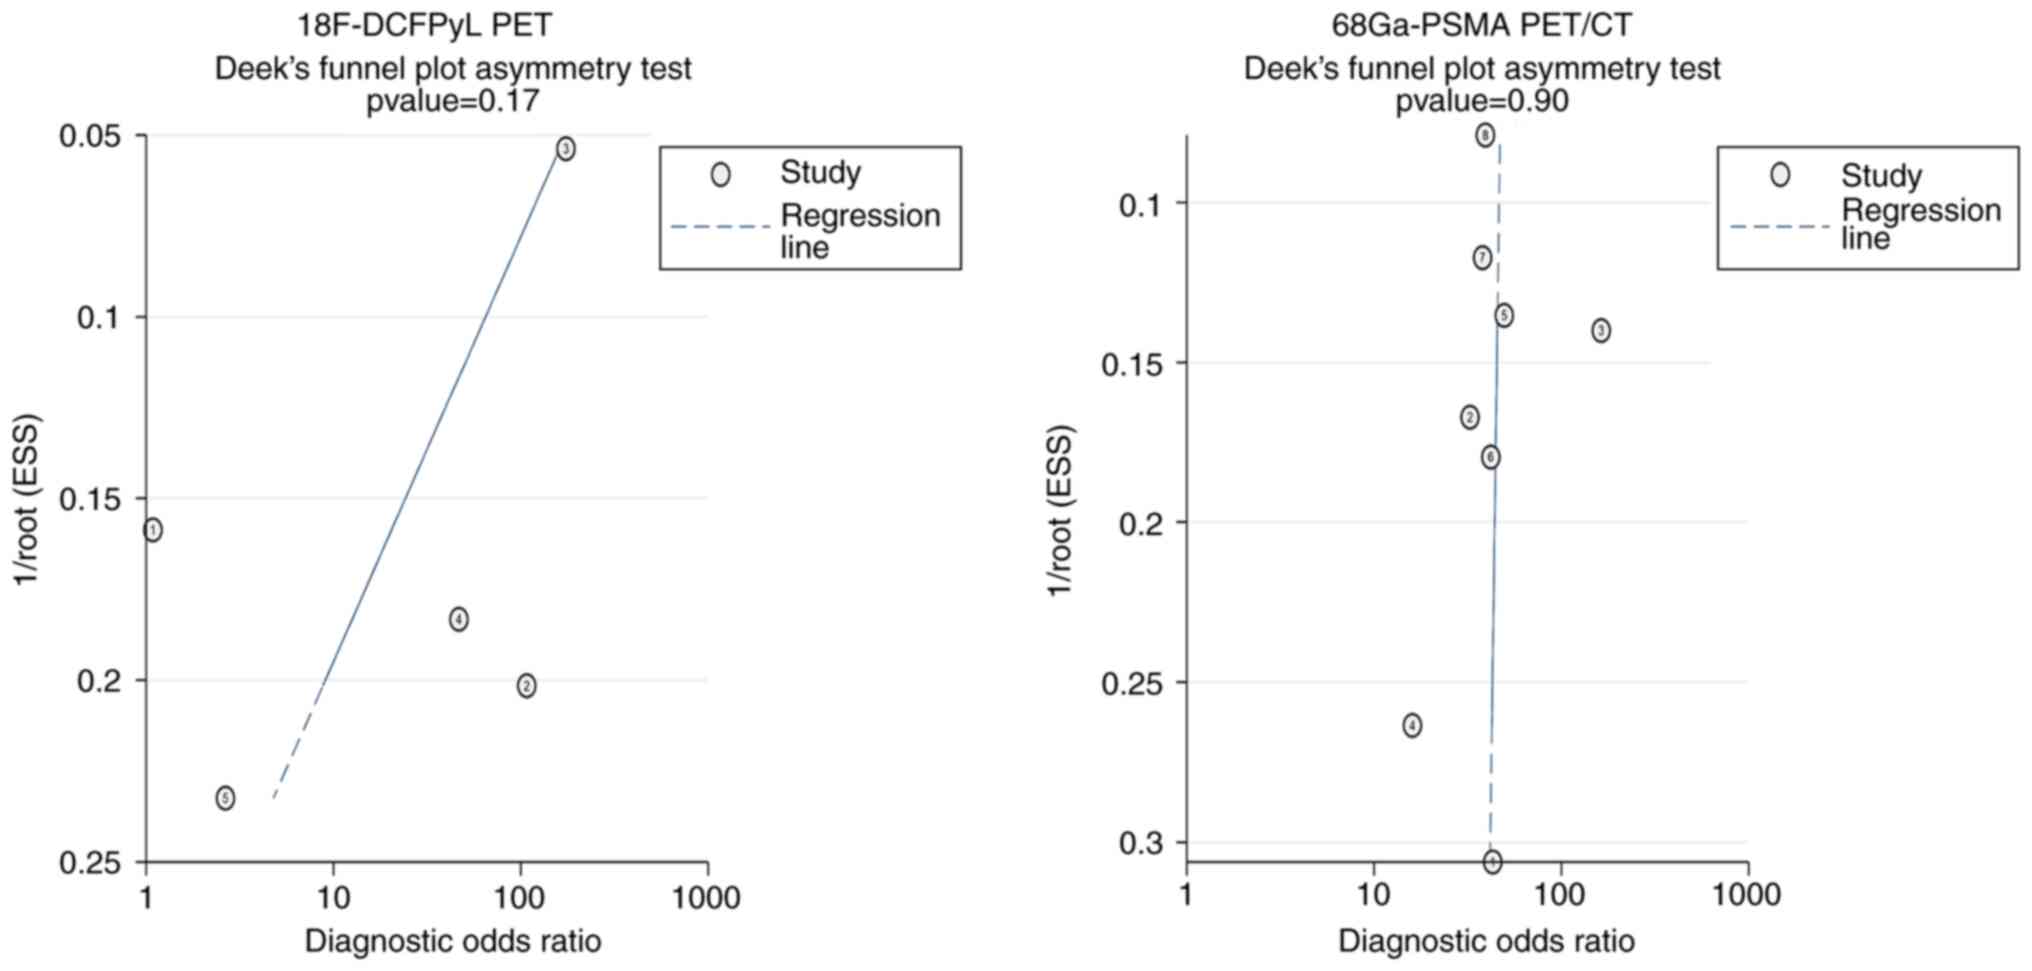 | Figure 6.Deeks' funnel plot tests for
18F-DCFPyL PET and 68Ga-PSMA PET/CT. PSMA,
prostate-specific membrane antigen; PET, positron emission
tomography. ESS, effective sample size. In the
18F-DCFPyL PET section: 1, Metser et al (25), 2021; 2, Zhang et al (26), 2022; 3, Bodar et al (24), 2020; 4, Liu et al (27), 2022; 5, Parathithasan et al
(28), 2022. In the
68Ga-PSMA PET/CT section: 1, Hoffmann et al
(29), 2017; 2, Lopci et al
(30), 2018; 3, Sasikumar et
al (31), 2018; 4, Kumar et
al (32), 2019; 5, Zhang et
al (33), 2018; 6, Liu et
al (34), 2020; 7, Lopci et
al (35), 2020; 8, Jiao et
al (36), 2021. |
Discussion
Currently, there is a scarcity of studies
investigating the application of 18F-DCFPyL PET and
68Ga-PSMA PET/CT in the diagnosis of suspected PCa. The
present study was the first meta-analysis on the comparative
efficacy of 18F-DCFPyL PET and 68Ga-PSMA
PET/CT in the detection of PCa in patients with a suspicion of the
disease. The purpose of the present study was to quantitatively
assess and evaluate the diagnostic accuracy of two different
diagnostic methods for patients with suspected PCa. Based on the
results, 18F-DCFPyL PET demonstrated a pooled
sensitivity, specificity and AUC of 0.92, 0.59 and 0.92,
respectively. 68Ga-PSMA PET/CT exhibited a pooled
sensitivity, specificity and AUC of 0.96, 0.71 and 0.92,
respectively. This suggests that both 18F-DCFPyL PET and
68Ga-PSMA PET/CT have the potential to serve as
‘rule-out’ tests for patients suspected of having PCa based on
clinical or biochemical evidence. Consequently, these tests can
help avoid unnecessary biopsies.
Numerous PCa cases progress slowly and typically do
not produce severe symptoms, thereby not necessitating immediate
active treatment or intervention (37,38).
Therefore, there is a strong emphasis on detecting clinically
relevant PCa at an early stage. Clinically relevant PCa often
refers to tumors with a Gleason score of 3+4 or higher (39). The present findings indicate that
both 18F-DCFPyL PET and 68Ga-PSMA PET/CT had
a high level of accuracy in detecting clinically significant
tumors. The pooled sensitivity for 18F-DCFPyL PET was
0.92, while that for 68Ga-PSMA PET/CT was 0.96. These
findings have the potential to impact the categorization of risk
and improve the decision-making process for treating such patients
(40).
In the present meta-analysis, a comprehensive
evaluation of the efficacy of two imaging methods in identifying
suspected PCa was performed. The AUC for 18F-DCFPyL PET
and 68Ga-PSMA PET/CT in identifying suspected PCa was
0.92 (95% CI: 0.89–0.94) for both. Although there was no
statistical difference by Z-test statistics (Z<0.001,
P<0.999), 68Ga-PSMA PET/CT was indicated to have
higher sensitivity, specificity and post-test probability compared
to 18F-DCFPyL PET. The present results indicated that
18F-DCFPyL and 68Ga-PSMA PET/CT have similar
diagnostic accuracy in detecting suspected PCa. Van Kalmthout et
al (41) discovered in their
earlier research that the diagnostic performance of both
18F-DCFPyL and 68Ga-PSMA PET/CT in the
setting of biochemical recurrence of PCa post-prostatectomy is
comparable. Perhaps the similarity in biodistribution patterns of
18F-DCFPyL and 68Ga-PSMA in normal tissues is
due to their comparable characteristics (42). In addition, it has been indicated
that 68Ga-PSMA PET/CT remains highly valuable due to its
accessibility and cost-effectiveness (43), although 18F-DCFPyL PET
may offer slight advantages in terms of imaging clarity and patient
safety in certain contexts (44).
However, the finding was derived from a limited sample size and
thus, the reliability of the results may be limited.
In the present study, papers that assessed the
diagnostic performance of 18F-DCFPyL PET and
68Ga-PSMA PET/CT for suspected PCa were analyzed using
various thresholds for detecting positive and negative scans. Of
note, a consensus on the precise diagnostic threshold choice for
different imaging techniques has yet to be obtained. Studies have
used measurements such as the standardized uptake value threshold
and the choline/creatinine ratio. The reported sensitivity and
specificity of the imaging technique may change depending on the
choice of diagnostic thresholds (45). In some of the included articles, ROC
curves were generated to assess diagnostic performance, and the
diagnostic threshold that produced the highest sensitivity and
specificity products was chosen. Although this method of
determining the ideal diagnostic threshold is frequently utilized,
it may only be suitable under certain circumstances, mainly when
there is a trade-off between sensitivity and specificity.
Therefore, additional research examining the ideal diagnostic
cutoff for 68Ga-PSMA PET/CT and 18F-DCFPyL
PET in patients with suspected PCa is necessary.
The identification of significant heterogeneity in
the present examination of 18F-DCFPyL PET and
68Ga-PSMA PET/CT, as evidenced by an I2-value
exceeding 50%, highlights the complex and diverse characteristics
of diagnostic accuracy research in this field. In the following
meta-regression analysis, it was attempted to find the underlying
factors that contribute to the observed heterogeneity. It was
indicated that the diversity in geographical region among the
research populations, as well as the combination of prospective and
retrospective study designs, were significant factors. However, it
is crucial to recognize that the observed heterogeneity can also be
attributed to methodological differences, such as variations in
imaging techniques, thresholds for determining positives and
discrepancies in the criteria used to choose patients among the
studies included. These factors indicate that, although specific
variables have a significant impact on heterogeneity, a wider range
of methodological and clinical factors should be considered when
interpreting the results of diagnostic accuracy meta-analyses in
PCa imaging.
The present study acknowledges several
methodological limitations that warrant careful consideration.
First, the relatively small sample size, with only 13 studies
included, restricts the statistical power and robustness of the
present findings. This limitation underscores the need for caution
when extrapolating the present results to broader populations.
Furthermore, the heterogeneity introduced by differing diagnostic
cutoffs and design of the included studies was a challenge. Such
heterogeneity may lead to biases in the synthesis of data,
particularly in deciding which results are emphasized, potentially
skewing the overall interpretation of diagnostic efficacy. In
addition, the study's selection criteria may have inadvertently
resulted in a narrow representation of geographical region. This
limitation is significant because the diagnostic performance of the
tests under review may vary across different regional groups,
thereby affecting the applicability of the conclusions across
diverse populations. Finally, the reliance on histology and
follow-up as the gold standard for confirming tumor recurrence is a
critical point for consideration. The fact that not all patients in
the included studies had accessible confirmatory pathology results
introduces an element of uncertainty regarding the diagnostic
precision of the imaging modalities evaluated. This limitation is
particularly pertinent, as it may compromise the reliability of the
current findings. Considering these limitations, the conclusions of
the present study should be interpreted with caution. The
identified weaknesses and sources of heterogeneity highlight the
need for additional, more comprehensive research to validate and
extend the current findings, ensuring their relevance and
applicability to a wide range of clinical contexts.
From the pooled data it was inferred that the
diagnostic performance of 18F-DCFPyL PET and
68Ga-PSMA PET/CT is comparable in patients with
suspected PCa. Although only a small number of studies have been
carried out thus far, it is significant to emphasize that the
comparative evidence in this field currently needs to be more
extensive. Therefore, subsequent studies concentrating on direct
head-to-head comparisons of these two radiotracers may produce
fresh and intriguing findings, offering new insight into the
diagnostic capacities of these imaging modalities.
In conclusion, comparable diagnostic performance is
seen for patients with suspected PCa using 18F-DCFPyL
PET and 68Ga-PSMA PET/CT. It is suggested that both
modalities can be valuable tools in the diagnostic arsenal against
this prevalent disease, underscoring the potential for flexibility
in clinical choices, based on availability and patient-specific
factors. However, given the modest sample sizes of the studies
included in the present meta-analysis, it is crucial to interpret
these results with caution. Further studies with larger, more
diverse populations are essential to solidify our understanding and
refine suspected PCa diagnostic protocols. Such research will also
help in addressing the limitations identified, ultimately
contributing to more effective and personalized patient care.
Supplementary Material
Supporting Data
Acknowledgements
Not applicable.
Funding
This work was supported by the University Student Innovation and
Entrepreneurship Training Program Project (grant no.
S202210541145), the Key Projects of Hunan Provincial Department of
Education (grant no. 21A0242) and the General Project of Hunan
Natural Science Foundation (grant no. 2021JJ30506).
Availability of data and materials
The data generated in the present study may be
requested from the corresponding author.
Authors' contributions
QT and ZJ conceived of and designed the study. JG,
SY and BM performed data acquisition, data analysis and manuscript
preparation. ZJ, JG, LH and SY assisted with data acquisition, data
analysis and statistical analysis. ZJ and BM confirm the
authenticity of all the raw data. All authors read and approved the
final manuscript.
Ethics approval and consent to
participate
Not applicable.
Patient consent for publication
Not applicable.
Competing interests
The authors declare that they have no competing
interests.
References
|
1
|
Bray F, Ferlay J, Soerjomataram I, Siegel
RL, Torre LA and Jemal A: Global cancer statistics 2018: GLOBOCAN
estimates of incidence and mortality worldwide for 36 cancers in
185 countries. CA Cancer J Clin. 68:394–424. 2018. View Article : Google Scholar : PubMed/NCBI
|
|
2
|
Descotes JL: Diagnosis of prostate cancer.
Asian J Urol. 6:129–136. 2019. View Article : Google Scholar : PubMed/NCBI
|
|
3
|
Lomas DJ and Ahmed HU: All change in the
prostate cancer diagnostic pathway. Nat Rev Clin Oncol. 17:372–381.
2020. View Article : Google Scholar : PubMed/NCBI
|
|
4
|
Stefanova V, Buckley R, Flax S, Spevack L,
Hajek D, Tunis A, Lai E and Loblaw A; Collaborators: Transperineal
prostate biopsies using local anesthesia: Experience with 1,287
patients. prostate cancer detection rate, complications and patient
tolerability. J Urol. 201:1121–1126. 2019. View Article : Google Scholar : PubMed/NCBI
|
|
5
|
Liss MA, Ehdaie B, Loeb S, Meng MV, Raman
JD, Spears V and Stroup SP: An update of the American urological
association white paper on the prevention and treatment of the more
common complications related to prostate biopsy. J Urol.
198:329–334. 2017. View Article : Google Scholar : PubMed/NCBI
|
|
6
|
Ghai S and Haider MA: Multiparametric-MRI
in diagnosis of prostate cancer. Indian J Urol. 31:194–201. 2015.
View Article : Google Scholar : PubMed/NCBI
|
|
7
|
Turkbey B, Rosenkrantz AB, Haider MA,
Padhani AR, Villeirs G, Macura KJ, Tempany CM, Choyke PL, Cornud F,
Margolis DJ, et al: Prostate Imaging reporting and data system
version 2.1: 2019 Update of prostate imaging reporting and data
system version 2. Eur Urol. 76:340–351. 2019. View Article : Google Scholar : PubMed/NCBI
|
|
8
|
Laudicella R, Rüschoff JH, Ferraro DA,
Brada MD, Hausmann D, Mebert I, Maurer A, Hermanns T, Eberli D,
Rupp NJ and Burger IA: Infiltrative growth pattern of prostate
cancer is associated with lower uptake on PSMA PET and reduced
diffusion restriction on mpMRI. Eur J Nucl Med Mol Imaging.
49:3917–3928. 2022. View Article : Google Scholar : PubMed/NCBI
|
|
9
|
Rüschoff JH, Ferraro DA, Muehlematter UJ,
Laudicella R, Hermanns T, Rodewald AK, Moch H, Eberli D, Burger IA
and Rupp NJ: What's behind 68Ga-PSMA-11 uptake in
primary prostate cancer PET? Investigation of histopathological
parameters and immunohistochemical PSMA expression patterns. Eur J
Nucl Med Mol Imaging. 48:4042–4053. 2021. View Article : Google Scholar : PubMed/NCBI
|
|
10
|
Wright GL Jr, Haley C, Beckett ML and
Schellhammer PF: Expression of prostate-specific membrane antigen
in normal, benign, and malignant prostate tissues. Urol Oncol.
1:18–28. 1995. View Article : Google Scholar : PubMed/NCBI
|
|
11
|
Silver DA, Pellicer I, Fair WR, Heston WD
and Cordon-Cardo C: Prostate-specific membrane antigen expression
in normal and malignant human tissues. Clin Cancer Res. 3:81–85.
1997.PubMed/NCBI
|
|
12
|
Ross JS, Sheehan CE, Fisher HA, Kaufman RP
Jr, Kaur P, Gray K, Webb I, Gray GS, Mosher R and Kallakury BV:
Correlation of primary tumor prostate-specific membrane antigen
expression with disease recurrence in prostate cancer. Clin Cancer
Res. 9:6357–6362. 2003.PubMed/NCBI
|
|
13
|
Evangelista L, Maurer T, van der Poel H,
Alongi F, Kunikowska J, Laudicella R, Fanti S and Hofman MS:
[68Ga]Ga-PSMA Versus [18F]PSMA positron
emission tomography/computed tomography in the staging of primary
and recurrent prostate cancer. A systematic review of the
literature. Eur Urol Oncol. 5:273–282. 2022. View Article : Google Scholar : PubMed/NCBI
|
|
14
|
Koerber SA, Utzinger MT, Kratochwil C,
Kesch C, Haefner MF, Katayama S, Mier W, Iagaru AH, Herfarth K,
Haberkorn U, et al: 68Ga-PSMA-11 PET/CT in newly
diagnosed carcinoma of the prostate: Correlation of intraprostatic
PSMA uptake with several clinical parameters. J Nucl Med.
58:1943–1948. 2017. View Article : Google Scholar : PubMed/NCBI
|
|
15
|
Rowe SP, Macura KJ, Mena E, Blackford AL,
Nadal R, Antonarakis ES, Eisenberger M, Carducci M, Fan H, Dannals
RF, et al: PSMA-based [(18)F]DCFPyL PET/CT is superior to
conventional imaging for lesion detection in patients with
metastatic prostate cancer. Mol Imaging Biol. 18:411–419. 2016.
View Article : Google Scholar : PubMed/NCBI
|
|
16
|
Rowe SP, Mana-Ay M, Javadi MS, Szabo Z,
Leal JP, Pomper MG, Pienta KJ, Ross AE and Gorin MA: PSMA-based
detection of prostate cancer bone lesions with
18F-DCFPyL PET/CT: A sensitive alternative to
(99m)Tc-MDP bone scan and Na18F PET/CT? Clin Genitourin
Cancer. 14:e115–e118. 2016. View Article : Google Scholar : PubMed/NCBI
|
|
17
|
Page MJ, McKenzie JE, Bossuyt PM, Boutron
I, Hoffmann TC, Mulrow CD, Shamseer L, Tetzlaff JM, Akl EA, Brennan
SE, et al: The PRISMA 2020 statement: An updated guideline for
reporting systematic reviews. BMJ. 372:n712021. View Article : Google Scholar : PubMed/NCBI
|
|
18
|
Whiting PF, Rutjes AW, Westwood ME,
Mallett S, Deeks JJ, Reitsma JB, Leeflang MM, Sterne JA and Bossuyt
PM; QUADAS-2 Group, : QUADAS-2: A revised tool for the quality
assessment of diagnostic accuracy studies. Ann Intern Med.
155:529–536. 2011. View Article : Google Scholar : PubMed/NCBI
|
|
19
|
Reitsma JB, Glas AS, Rutjes AW, Scholten
RJ, Bossuyt PM and Zwinderman AH: Bivariate analysis of sensitivity
and specificity produces informative summary measures in diagnostic
reviews. J Clin Epidemiol. 58:982–990. 2005. View Article : Google Scholar : PubMed/NCBI
|
|
20
|
Moses LE, Shapiro D and Littenberg B:
Combining independent studies of a diagnostic test into a summary
ROC curve: Data-analytic approaches and some additional
considerations. Stat Med. 12:1293–1316. 1993. View Article : Google Scholar : PubMed/NCBI
|
|
21
|
DeLong ER, DeLong DM and Clarke-Pearson
DL: Comparing the areas under two or more correlated receiver
operating characteristic curves: A nonparametric approach.
Biometrics. 44:837–845. 1988. View
Article : Google Scholar : PubMed/NCBI
|
|
22
|
Hanley JA and McNeil BJ: The meaning and
use of the area under a receiver operating characteristic (ROC)
curve. Radiology. 143:29–36. 1982. View Article : Google Scholar : PubMed/NCBI
|
|
23
|
Lin M, Li YR, Lan QW, Long LJ, Liu JQ,
Chen YW, Cao XJ, Wu GY, Li YP and Guo XG: Evaluation of GeneXpert
EV assay for the rapid diagnosis of enteroviral meningitis: A
systematic review and meta-analysis. Ann Clin Microbiol Antimicrob.
21:252022. View Article : Google Scholar : PubMed/NCBI
|
|
24
|
Bodar YJL, Jansen BHE, van der Voorn JP,
Zwezerijnen GJC, Meijer D, Nieuwenhuijzen JA, Boellaard R,
Hendrikse NH, Hoekstra OS, van Moorselaar RJA, et al: Detection of
prostate cancer with 18F-DCFPyL PET/CT compared to final
histopathology of radical prostatectomy specimens: Is PSMA-targeted
biopsy feasible? The DeTeCT trial. World J Urol. 39:2439–2446.
2021. View Article : Google Scholar : PubMed/NCBI
|
|
25
|
Metser U, Ortega C, Perlis N, Lechtman E,
Berlin A, Anconina R, Eshet Y, Chan R, Veit-Haibach P, van der
Kwast TH, et al: Detection of clinically significant prostate
cancer with 18F-DCFPyL PET/multiparametric MR. Eur J
Nucl Med Mol Imaging. 48:3702–3711. 2021. View Article : Google Scholar : PubMed/NCBI
|
|
26
|
Zhang T, Yang S, Lin L, Wang S, Xia D,
Chen D, Wang G, Zhao K and Su X: Role of 18F-DCFPyL
PET/CT in patients with suspected prostate cancer. Hell J Nucl Med.
25:11–18. 2022.PubMed/NCBI
|
|
27
|
Liu Y, Dong Y, Liu J, Zhang X, Lin M and
Xu B: Comparison between 18 F-DCFPyL PET and MRI for the
detection of transition zone prostate cancer. Prostate.
81:1329–1336. 2021. View Article : Google Scholar : PubMed/NCBI
|
|
28
|
Parathithasan N, Perry E, Taubman K,
Hegarty J, Talwar A, Wong LM and Sutherland T: Combination of MRI
prostate and 18F-DCFPyl PSMA PET/CT detects all clinically
significant prostate cancers in treatment-naive patients: An
international multicentre retrospective study. J Med Imaging Radiat
Oncol. 66:927–935. 2022. View Article : Google Scholar : PubMed/NCBI
|
|
29
|
Hoffmann MA, Miederer M, Wieler HJ, Ruf C,
Jakobs FM and Schreckenberger M: Diagnostic performance of
68Gallium-PSMA-11 PET/CT to detect significant prostate
cancer and comparison with 18FEC PET/CT. Oncotarget.
8:111073–111083. 2017. View Article : Google Scholar : PubMed/NCBI
|
|
30
|
Lopci E, Saita A, Lazzeri M, Lughezzani G,
Colombo P, Buffi NM, Hurle R, Marzo K, Peschechera R, Benetti A, et
al: 68Ga-PSMA positron emission tomography/computerized
tomography for primary diagnosis of prostate cancer in men with
contraindications to or negative multiparametric magnetic resonance
imaging: A prospective observational study. J Urol. 200:95–103.
2018. View Article : Google Scholar : PubMed/NCBI
|
|
31
|
Sasikumar A, Joy A, Pillai AMR, Oommen KE,
Somarajan S, Raman VK, Thomas R and Dinesh D: Gallium 68-PSMA
PET/CT for lesion characterization in suspected cases of prostate
carcinoma. Nucl Med Commun. 39:1013–1021. 2018. View Article : Google Scholar : PubMed/NCBI
|
|
32
|
Kumar N, Yadav S, Kumar S, Saurav K,
Prasad V and Vasudeva P: Comparison of percentage free PSA, MRI and
GaPSMA PET scan for diagnosing cancer prostate in men with PSA
between 4 and 20 ng/ml. Indian J Urol. 35:202–207. 2019. View Article : Google Scholar : PubMed/NCBI
|
|
33
|
Zhang J, Shao S, Wu P, Liu D, Yang B, Han
D, Li Y, Lin X, Song W, Cao M, et al: Diagnostic performance of
68Ga-PSMA PET/CT in the detection of prostate cancer
prior to initial biopsy: Comparison with cancer-predicting
nomograms. Eur J Nucl Med Mol Imaging. 46:908–920. 2019. View Article : Google Scholar : PubMed/NCBI
|
|
34
|
Liu C, Liu T, Zhang Z, Zhang N, Du P, Yang
Y, Liu Y, Yu W, Li N, Gorin MA, et al: 68Ga-PSMA PET/CT
combined with PET/ultrasound-guided prostate biopsy can diagnose
clinically significant prostate cancer in men with previous
negative biopsy results. J Nucl Med. 61:1314–1319. 2020. View Article : Google Scholar : PubMed/NCBI
|
|
35
|
Lopci E, Lughezzani G, Castello A, Saita
A, Colombo P, Hurle R, Peschechera R, Benetti A, Zandegiacomo S,
Pasini L, et al: Prospective evaluation of 68Ga-labeled
prostate-specific membrane antigen ligand positron emission
tomography/computed tomography in primary prostate cancer
diagnosis. Eur Urol Focus. 7:764–771. 2021. View Article : Google Scholar : PubMed/NCBI
|
|
36
|
Jiao J, Kang F, Zhang J, Quan Z, Wen W,
Zhao X, Ma S, Wu P, Yang F, Guo W, et al: Establishment and
prospective validation of an SUVmax cutoff value to
discriminate clinically significant prostate cancer from benign
prostate diseases in patients with suspected prostate cancer by
68Ga-PSMA PET/CT: A real-world study. Theranostics.
11:8396–8411. 2021. View Article : Google Scholar : PubMed/NCBI
|
|
37
|
Cooperberg MR, Broering JM and Carroll PR:
Time trends and local variation in primary treatment of localized
prostate cancer. J Clin Oncol. 28:1117–1123. 2010. View Article : Google Scholar : PubMed/NCBI
|
|
38
|
Esserman LJ, Thompson IM Jr and Reid B:
Overdiagnosis and overtreatment in cancer: An opportunity for
improvement. JAMA. 310:797–798. 2013. View Article : Google Scholar : PubMed/NCBI
|
|
39
|
Matoso A and Epstein JI: Defining
clinically significant prostate cancer on the basis of pathological
findings. Histopathology. 74:135–145. 2019. View Article : Google Scholar : PubMed/NCBI
|
|
40
|
Heidenreich A, Rieke M, Mahjoub S and
Pfister D: Management of positive lymph nodes following radical
prostatectomy. Arch Esp Urol. 72:182–191. 2019.PubMed/NCBI
|
|
41
|
Van Kalmthout L, Wondergem M, Jansen B, et
al: Comparison of 68Ga-PSMA-11 and 18F-DCFPyL in prostate cancer
patients with biochemical recurrence after prostatectomy. Eur J
Nucl Med Mol Imaging. 46:S3692019.PubMed/NCBI
|
|
42
|
Ferreira G, Iravani A, Hofman MS and Hicks
RJ: Intra-individual comparison of 68Ga-PSMA-11 and
18F-DCFPyL normal-organ biodistribution. Cancer Imaging.
19:232019. View Article : Google Scholar : PubMed/NCBI
|
|
43
|
van der Sar ECA, Keusters WR, van
Kalmthout LWM, Braat AJAT, de Keizer B, Frederix GWJ, Kooistra A,
Lavalaye J, Lam MGEH and van Melick HHE: Cost-effectiveness of the
implementation of [68Ga]Ga-PSMA-11 PET/CT at initial
prostate cancer staging. Insights Imaging. 13:1322022. View Article : Google Scholar : PubMed/NCBI
|
|
44
|
Dietlein M, Kobe C, Kuhnert G, Stockter S,
Fischer T, Schomäcker K, Schmidt M, Dietlein F, Zlatopolskiy BD,
Krapf P, et al: Comparison of [(18)F]DCFPyL and
[(68)Ga]Ga-PSMA-HBED-CC for PSMA-PET imaging in patients with
relapsed prostate cancer. Mol Imaging Biol. 17:575–584. 2015.
View Article : Google Scholar : PubMed/NCBI
|
|
45
|
Ertürk SA, Şalk İ, Yücel B, Ulaş Babacan Ö
and Hasbek Z: The relationship between the SUVmax value obtained in
Ga-68 PSMA PET/CT and lactate dehydrogenase and alkaline
phosphatase in prostate cancer. Arch Esp Urol. 75:552–558. 2022.
View Article : Google Scholar : PubMed/NCBI
|