Introduction
Predicting the recurrence or worsening disease
prognosis is clinically important in oncology. Our previous study
identified the trefoil factor family member 2 (Tff2) as a
candidate factor that is involved in intestinal tumor growth using
an ApcMin/+ mouse model of human colorectal
cancer (1). A xenograft model, in
which the stable expression strain of Tff2 was transplanted
into nude mice, demonstrated a significant increase in tumor
volume. Large tumors were associated with lymph node metastasis and
poor prognosis (2). Therefore, a
high TFF2 expression is potentially associated with
increased intestinal tumor size, tumor progression, and malignancy,
and may be utilized to predict the prognosis for malignant
transformation (3,4).
The TFF genes, TFF1–3, have
been characterized in humans and encode secreted proteins (7–13
kDa). TFF1 is expressed in gastric pit cells and surface
epithelial cells in the stomach, TFF2 in gastric mucosal
neck cells and Brunner's glands in the duodenum (not in the
intestinal tract), and TFF3 in goblet cells of the small and
large intestines (5). The secreted
protein TFF2 is attracting attention as a biopharmaceutical because
of its ability to inhibit and heal intestinal inflammation
(6). On the other hand, TFF2
is highly expressed in several cancers, including pancreatic
cancer, colon cancer, bile duct cancer, and other tumors, and is
expected to be a biomarker (7–10). The
conditions for TFF2 expression and whether high TFF2
expression promotes or inhibits tumor development remains unclear
(5,11).
Transcriptome analysis has reported that tumor
microenvironment affects the pattern of gene expression (12). In fact, gene expression in cultured
cells without a tumor microenvironment differs from that in
tissues. The differences in gene expression may have caused the
acquisition of treatment resistance. Chronic hypoxia in the tumor
microenvironment is reported to cause enhanced anaerobic
respiration and decreased pH due to the presence of lactic acid and
other factors. The pH in cancer tissues is approximately 6.2–6.9
(13). Studies reported the
involvement of the acidic environment within tumors in various
cellular processes and signaling pathways that underlie metastasis
and promote angiogenesis (3,4,14).
Additionally, highly malignant neoplastic tumor tissues exhibit
higher temperatures than normal tissue, which may be due to the
developing heat inside the cancer tissue (15,16).
This study, examined the effects of temperature and pH, which are
important factors that determine the cancer microenvironment, on
expression of TFF2.
Materials and methods
Cell culture and transfection
The cell lines used for this study were as follows:
the human colon cancer cell line DLD-1 [American Type Culture
Collection (ATCC) CCL 221, ATCC, Manassas, VA, USA], which was used
in a previous study on ApcMin/+ mice (1); Caco-2 (ATCC HTB-37), a human colon
cancer-derived cell line; HeLa (ATCC CCL-2), which has been used in
many previous studies as a general human cell model; the human
liver cancer cell line HepG2 (ATCC HB-8065), which expresses
various hydrolytic enzymes (lysosomal enzymes) that can function at
acidic pH. HepG2 was authenticated for their origin according to
the analysis service provider Promega (Promega Corporation,
Wisconsin, USA) using short tandem repeat (STR) DNA typing.
The human colon cancer cell line DLD-1 was cultured
in Roswell Park Memorial Institute 1640 Medium with GlutaMAX™-1
(1X; Thermo Fisher Scientific, Waltham, MA, USA,) supplemented with
10% fetal bovine serum (FBS; Biological Industries, Kibbutz Beit
Haemek, Israel) and 1% penicillin-streptomycin mixed solution at
final concentrations of 100 U/ml and 100 µg/ml, respectively
(Nacalai Tesque, Kyoto, Japan). The human colorectal adenocarcinoma
cell line Caco-2 was maintained in a minimum essential medium
(Thermo Fisher Scientific,) supplemented with 10% FBS (Biological
Industries) and 1% penicillin-streptomycin mixed solution (final
concentrations). We maintained the human cervical adenocarcinoma
cell line HeLa in minimum essential medium (Thermo Fisher
Scientific) supplemented with 1% non-essential amino acids, 10% FBS
(Biological Industries), and 1% penicillin-streptomycin mixed
solution (final concentrations). Finally, the human liver cancer
cell line HepG2 was cultured in Dulbecco's modified Eagle's medium
(Thermo Fisher Scientific) supplemented with 10% FBS (Biological
Industries) and a 1% penicillin-streptomycin mixed solution (final
concentrations).
DLD-1 cells, derived from human colon cancer, were
transiently transfected with the expression plasmid pcDNA
3.1−/c-(K)-DYK-TFF2 (Biotech Corporation, New
Jersey, USA). The transfection was performed using 1 µl of
Lipofectamine® 3000 (Life Technologies Invitrogen,
California, USA), in accordance with the protocol recommended by
the manufacturer. The purpose of this procedure was to set up a
positive control for immunohistochemistry experiments aimed at
targeting TFF2. Mock cells were prepared by transiently
transfecting DLD-1 cells with pcDNA
3.1−/c-(K)-DYK (empty vector) as a
control.
All but the cells used in the temperature experiment
were incubated at 37°C in a humidified atmosphere with 5%
CO2.
Cell culture temperature
DLD-1 cells were seeded onto 6-well plates at
1.2×10⁵ and 1.2×10⁵ cells/well densities,
cultured at 40°C, and collected after 24 and 48 h, respectively. We
used Opti-MEM (Reduced Serum Medium; Thermo Fisher Scientific)
culture medium to limit temperature-induced protein
denaturation.
Cell culture pH
DLD-1 cells were cultured under unusually acidic
conditions (pH 6.5 and 6.8).
4-(2-Hydroxyethyl)-1-piperazineethanesulfonic acid (HEPES; Dojindo;
PJ072, Osaka, Japan) was added to Opti-MEM medium (13), which was used to reduce protein
denaturation. DLD-1 cells were seeded onto 6-well plates at a
density of 2.0×10⁵ cells/well and cultured at pH of
either 6.5 or 6.8 for 48 h. Following the 48 h incubation period,
we conducted RNA extraction to facilitate microarray analysis of
gene expression under the specified acidic conditions (refer to
the Extraction of total RNA section for detailed
procedures). Caco-2, HeLa, and HepG2 cells were cultured under the
same conditions.
Measurement of cell count under pH
6.5
To assess the impact of low pH on cell viability, we
conducted a cell survival analysis. DLD-1 cells were seeded in 2
wells of a 4-well culture dish at a density of 1×10⁵
cells/well, and a total of 8 dishes were simultaneously prepared.
Upon confirming cell adhesion to the bottom, the media of 4 dishes
were exchanged with pH 6.5 (for detailed information, refer to the
Cell Culture pH section), while the remaining 4 dishes had
their media replaced with Opti-MEM. Subsequent to the media
exchange, cell numbers were determined using the EVE Automated Cell
Counter (AR BROWN Co., Ltd., Tokyo, Japan) at 24 h intervals.
Similar experiments were conducted on HeLa cells, known for their
challenges in surviving under acidic conditions. Cell counts were
performed twice for each well, and the experiment was repeated
twice to ensure robustness and reproducibility.
Reverse transcription-quantitative
polymerase chain reaction (RT-qPCR)
Total RNA was extracted by isopropanol precipitation
using TRIzol® Reagent (Thermo Fisher Scientific) with
chloroform. The RNA extract was treated with DNase (Nippon gene,
Tokyo, Japan) according to the manufacturer's instructions and
subsequently reverse-transcribed using the High-Capacity
RNA-to-cDNA Kit (Applied Biosystems, Foster City, CA, USA). RNA
purity was evaluated using 260/280 and 260/230 nm absorbance ratios
on a Nanodrop ND-1000 spectrophotometer (NanoDrop Technologies,
Inc. Wilmington, DE USA). RT-qPCR was performed using Fast SYBR
Green Master Mix (Applied Biosystems), according to the following
protocol. Thermocycling conditions were as follows: initial
denaturation at 95°C for 20 sec, followed by 40 cycles of
denaturation at 95°C for 1 sec, and annealing/extending at 60°C for
20 sec. The quantification method used was 2-ΔΔCq
(17). Each assay was performed in
quadruplicate. The primer sequences used were as follows: human
TFF1 (5´-AGACAGAGACGTGTACAGTGG-3′ and
5′-TAGGATAGAAGCACCAGGGGAC-3′), TFF2
(5′-CAAAGCAAGAGTCGGATCAG-3′ and 5′-CCAGGGCACTTCAAAGATG-3′),
TFF3 (5′-ATGAAGCGAGTCCTGAGCTG-3′ and
5′-GCTTGAAACACCAAGGCAC-3′), heat shock protein 90 α (HSP90α;
5′-CATAACGATGATGAGCAGTACGC-3′ and 5′-GACCCATAGGTTCACCTGTGT-3′),
pyruvate dehydrogenase kinase isozyme 4 (PDK4;
5′-TGTTCCTTCTCACCTCCATC-3′ and 5′-GCAAGCCGTAACCAAAACC-3′), and
glyceraldehyde-3-phosphate dehydrogenase (GAPDH;
5′-GAGTCAACGGATTTGGTCGT-3′ and 5′-TGGGATTTCCATTGATGACA-3′).
GAPDH was used as an endogenous control. We analyzed the
melting curve of each PCR amplicon to evaluate the specificity of
the primer sets.
Mice
In this study, a total of three
ApcMin/+ (C57BL/6J) mice were employed,
comprising two females and one male. The ApcMin/+
mice are heterozygous for a mutation in the Apc gene, whose
loss of heterozygosity (LOH) activates the Wnt pathway and
spontaneously induces tumors in the small and large intestine in
all individuals. These ApcMin/+ mice were sourced
from Jackson Laboratories (Bar Harbor, Maine, USA) and were
maintained under specific pathogen-free conditions, with a 12-h
light–dark cycle and ad libitum access to food and water.
The mice were dissected at ages ranging from 13 to 15 weeks. Tissue
collection took approximately 2 h, including the preparation of
anesthesia equipment (MK–A110D, Muromachi Kikai Co., Ltd, Tokyo,
Japan), collection of tissues while administering isoflurane via
inhalation to the mice (0.5 l/min, induction: 1.5% for 5 min,
maintenance: 1.5%), followed by carbon dioxide inhalation (30%
volume/min) for euthanasia, postmortem confirmation and subsequent
instrument washing. The mouse experiments strictly adhered to the
guidelines set by the Animal Experiments Committee at Nagasaki
International University (approval no. 168). To minimize stress,
the conditions within the cages were maintained as per the
committee's specifications. During the process of tumor collection,
anesthesia was administered using isoflurane, followed by the
inhalation of carbon dioxide gas. The health of the mice was
closely monitored, with checks conducted at least twice a week.
Mice identified as being in poor health were humanely euthanized
using a gentle administration of carbon dioxide gas. Postmortem
confirmation was based on the cessation of breathing and reflex
action, coupled with the onset of rigor mortis.
Western blot analysis
We examined the expression of Tff2 protein in
tissues (intestinal tract, stomach, and intestinal polyps) of
ApcMin/+ mice. Lysis solution (COSMO BIO Co.,
Ltd, Tokyo, Japan) supplemented with protein inhibitors (Merck
Millipore Ltd, Darmstadt, Germany) was used for protein extraction.
Extracted proteins (50 µg) were analyzed using 5–20% acrylamide
gradient gel and then transferred to polyvinylidene fluoride
membranes (Merck Millipore Ltd). The quantities of Tff2 and Gapdh
present in the cells are significantly different, resulting in
different exposure times required for detection. Therefore, the
membrane was cleaved with scissors after transfer. Western blot
analysis was performed overnight at 4°C using two membranes. The
primary antibody anti-Tff2 (1:500) was applied to one membrane,
while anti-Gapdh (Gene Tex, CA, USA, GTX100118, 1:5,000 dilution)
was used as the loading control on the other. Samples were
incubated at 25°C for 1 h with anti-rabbit horseradish-conjugated
secondary antibodies (1:2,000) and diluted all antibodies with 1%
skim milk. We obtained visual results through luminescence in the
ECL detection kit (PerkinElmer, Inc, Waltham, MA, USA) and imaged
the samples with the ChemiDoc Touch imaging system (BIO-RAD
Laboratories, Hercules, CA, USA).
Immunohistochemistry
Cells (4×10⁴ cells/well) were seeded onto
an 8-well slide chamber and incubated for 24 h. Cells were cultured
at pH 6.5 after 24 h (for details on the adjustment, refer to the
cell culture pH). Cells were then fixed with freshly prepared 4%
paraformaldehyde solution for 10 min and washed with
phosphate-buffered saline (PBS). The cells were permeabilized with
0.2% Triton X-100/PBS for 15 min. 1% BSA (New England Biolabs,
Ipswich, USA) was used for blocking. After 10 min of blocking, the
cells were incubated with the primary antibodies anti-TFF2 (Protein
tech, Rosemont, IL, USA, 13681-1-AP, 1:100 dilution) for 1 h at
25°C room temperature. Cells were washed three times with PBS and
further incubated them with anti-rabbit horseradish-conjugated
secondary antibodies (Dako, Glostrup, Denmark, 1:1,000 dilution)
for 30 min at room temperature. After washing with PBS, slides were
incubated with 3,3′-diaminobenzidine tetrahydrochloride (DAB;
Sigma-Aldrich) for 20 min and immediately washed them under tap
water. DAB was diluted by adding 50 mM Tris-HCl (pH 7.6) and 0.03%
hydrogen peroxide. We performed counterstaining using hematoxylin
and mounting agents with aqueous glycerin gelatin. Microscopy was
employed to capture four images of stained cellular regions, and
the stained areas were quantified in pixels using the image
analysis software ImageJ (https://imagej.nih.gov/ij/, Bethesda, Maryland,
USA).
Extraction of total RNA
After 48 h of cell culture, total RNA was extracted
using TRIZOL LS (Thermo Fisher Scientific) following the
manufacturer's protocol. RNA purity was evaluated using the 260/280
and 260/230 nm absorbance ratios on a Nanodrop ND-1000
spectrophotometer (NanoDrop Technologies, Inc. Wilmington, DE,
USA). We accepted the extracted RNA as ‘pure’ because it exhibited
a 260/280 nm ratio of ~2.0 and a 260/230 nm ratio of 2.0–2.2. Total
RNA was reverse-transcribed using a High-Capacity RNA-to-cDNA Kit
(Thermo Fisher Scientific).
Gene expression microarrays
The cDNA was amplified, labeled, and hybridized to
60 K Agilent 60-mer oligo microarrays following the manufacturer's
instructions. The Low Input Quick Amp Labeling Kit was used as the
labeling reagent, with SurePrint G3 Human Gene Expression
Microarray 8×60K as the microarray. All hybridized microarray
slides were scanned with an Agilent scanner. Both the relative
hybridization intensities and background hybridization values were
calculated using Agilent Feature Extraction Software (9.5.1.1).
Data analysis and filter criteria
Gene expression analysis was outsourced to an
analysis services provider (Cell Innovator Co., Ltd., Fukuoka,
Japan) using procedures recommended by Agilent. For the microarray
data analysis, raw signal intensities and flags for each probe were
calculated according to the method proposed by Miyahara et
al (18), and Z-scores were
subsequently computed. Z-scores ≥2.0 and ratios ≥1.5 for
upregulated genes, and Z-scores ≤-2.0 and ratios ≤0.66 for
down-regulated genes were set as the criteria. Based on the
microarray results, expressed genes were classified into functional
groups via Gene Ontology (GO) and gene pathway analysis using the
Database for Annotation, Visualization, and Integrated Discovery
(DAVID; http://david.ncifcrf.gov/).
Statistical analysis
The nonparametric Mann-Whitney U test was used to
compare pairs of groups. We performed analysis of variance,
followed by Dunnett's post hoc test to compare the control and
other groups. The GraphPad Prism 5 software (GraphPad Software
Inc., San Diego, CA, USA) was used for statistical analyses.
P<0.05 was considered statistically significant.
Results
Effect of temperature on TFF
expression
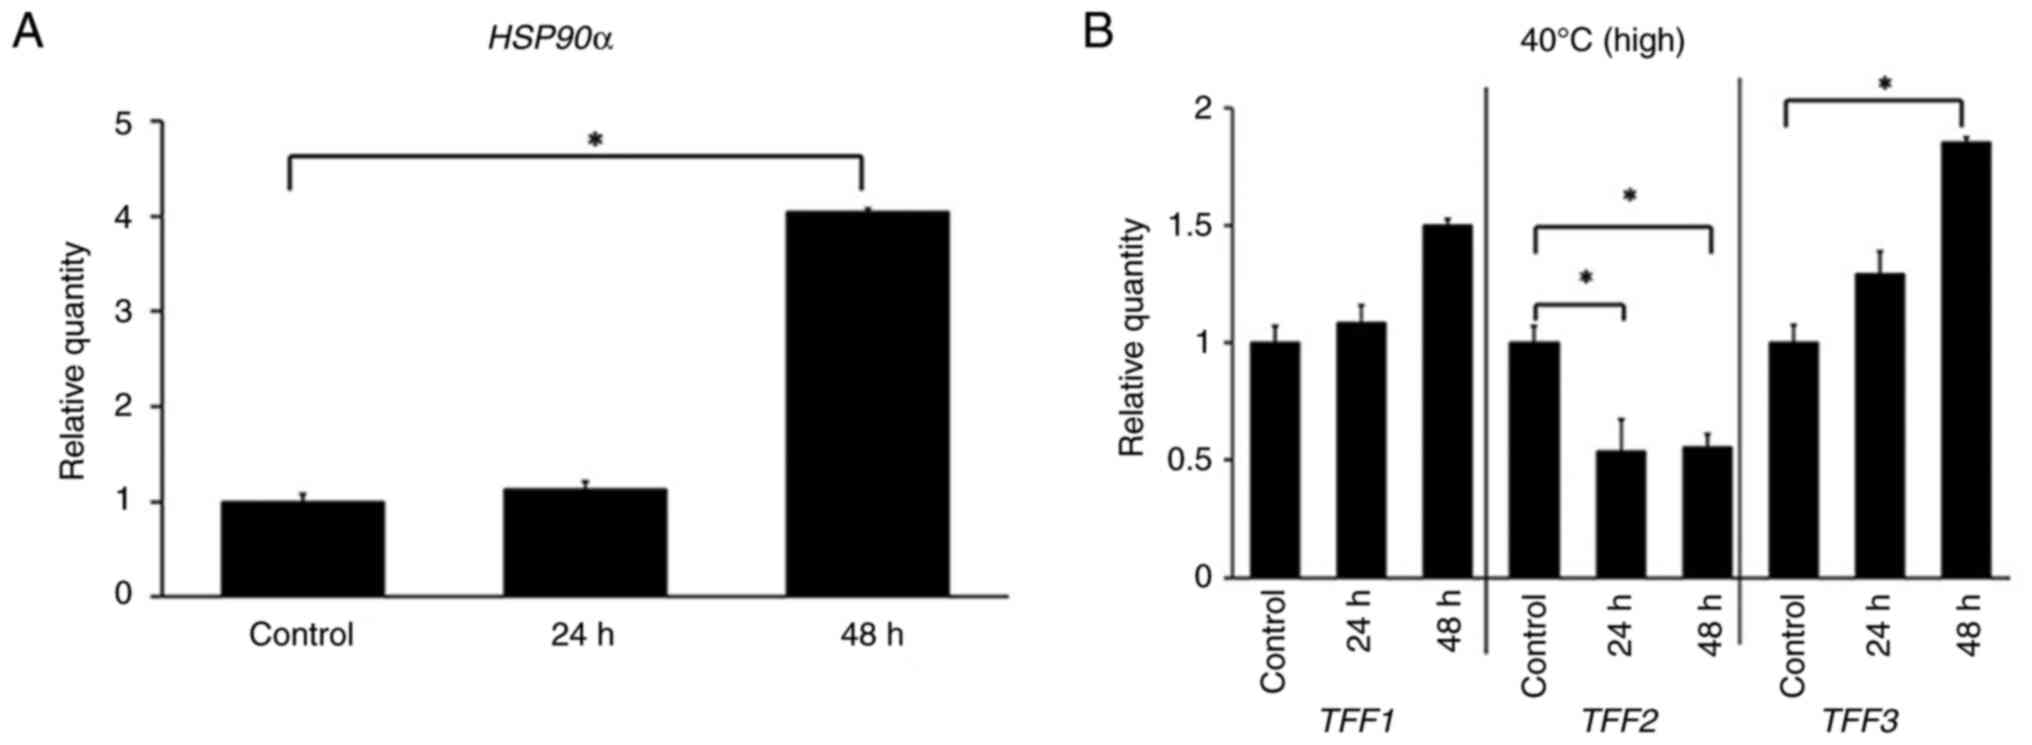
To mimic the cancer microenvironment, DLD-1 cells
were cultured at 40°C, and cells were collected and RNA was
extracted after 24 and 48 h for incubation, respectively. Fig. 1 illustrates the relative
quantification of each gene under temperature conditions at 40°C.
Each gene expression level is normalized to the expression value at
37°C. The GAPDH gene serving as the reference.
HSP90α, exhibited a significant (P<0.05) increased
expression at 40°C (Fig. 1A), as
expected (19). Expression of
TFF1 and TFF3 tended to increase after 24 and 48 h of
incubation at 40°C, whereas expression of TFF2 was not
increased (Fig. 1B).
Cell viability assessment under pH
6.5
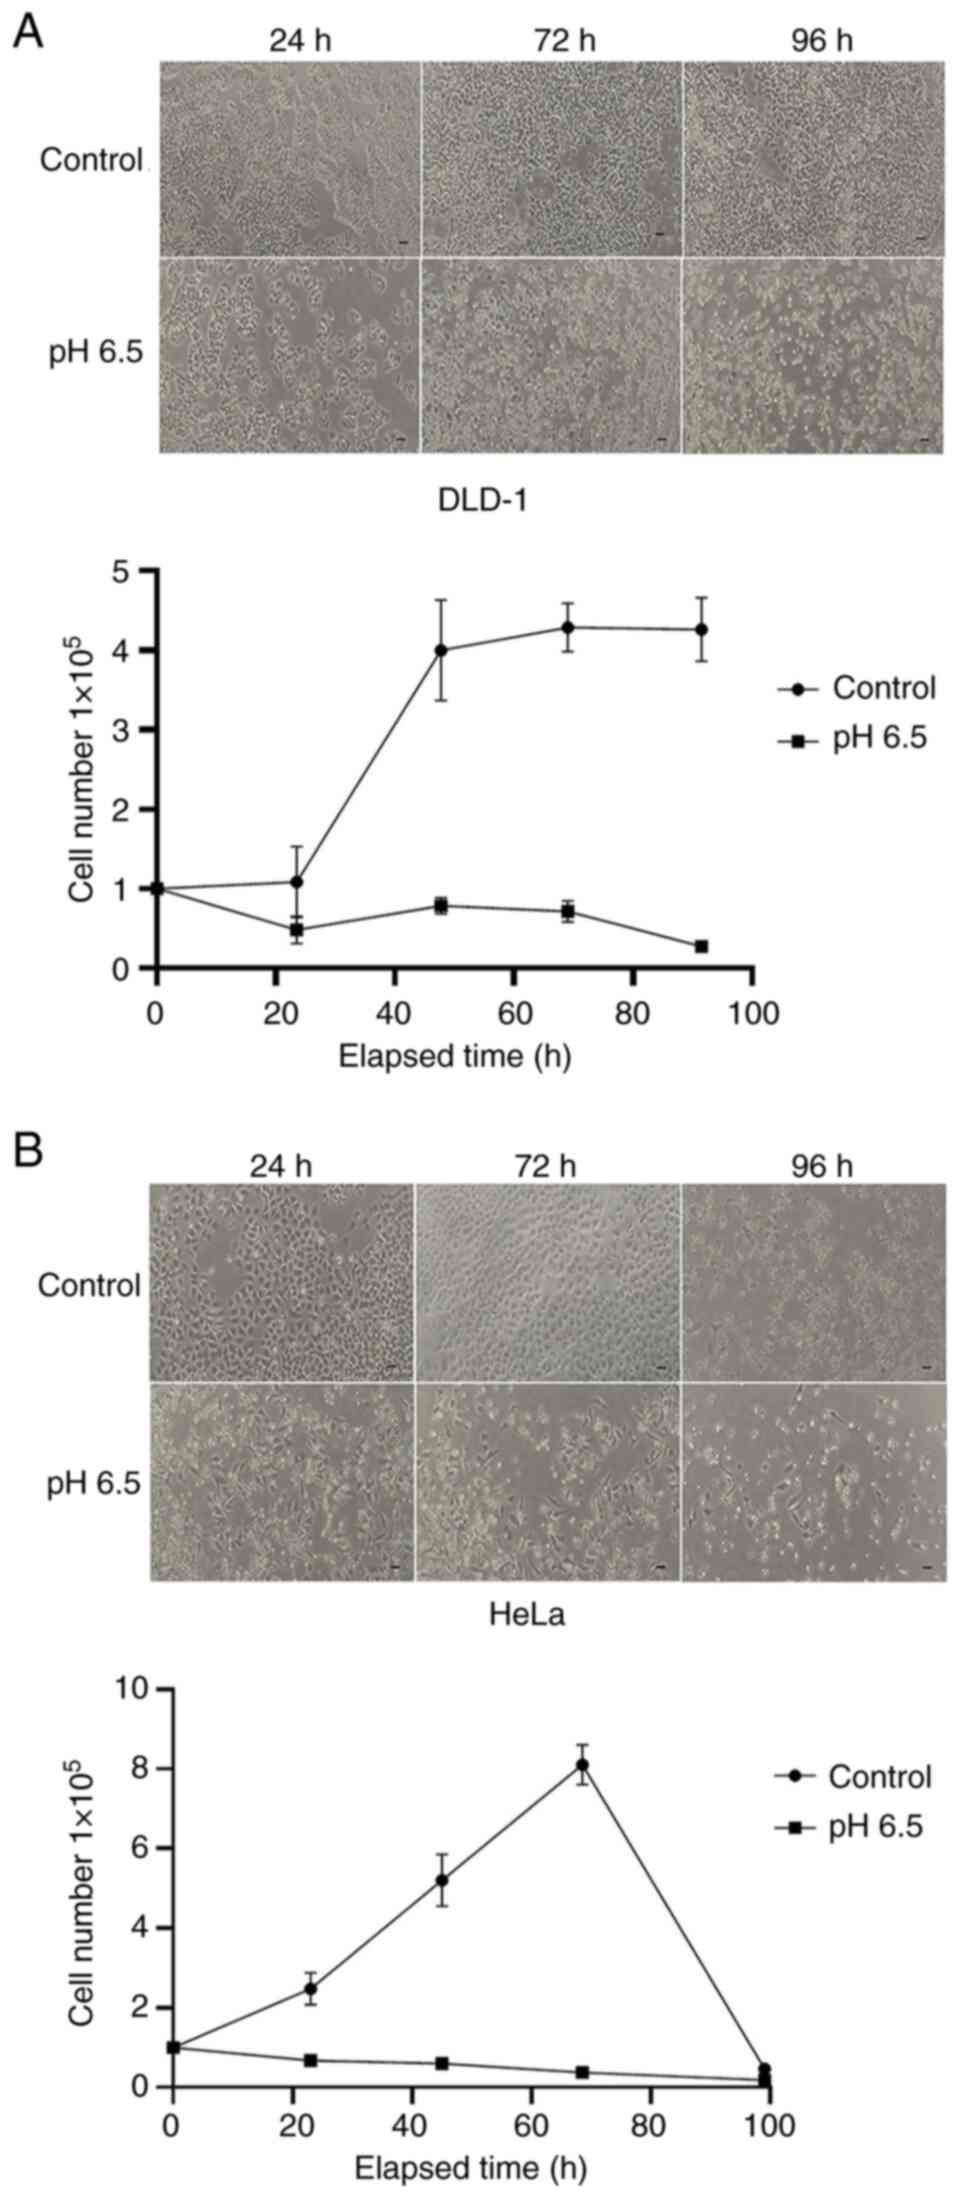
Herein, we investigated the effects of an acidic
environment (pH 6.5), which is commonly observed in in vivo
tumor microenvironments (pH range 6.2–6.9), on the survival of
DLD-1 and HeLa cells in vitro. After 24 h, the control group
showed a slight increase in cell count compared to the previous
day, whereas the group exposed to the acidic medium exhibited an
approximately 50% reduction. After 72 h, the control group
continued to proliferate (Fig. 2A).
In contrast, the HeLa cells in the control group experienced a
rapid decline after 72 h. However, in the acidic medium group,
there was no rapid decrease in cell number until 72 h, with only a
slight decrease persisting thereafter (Fig. 2B)
Effect of acidic pH on TFF expression
in DLD-1 cells
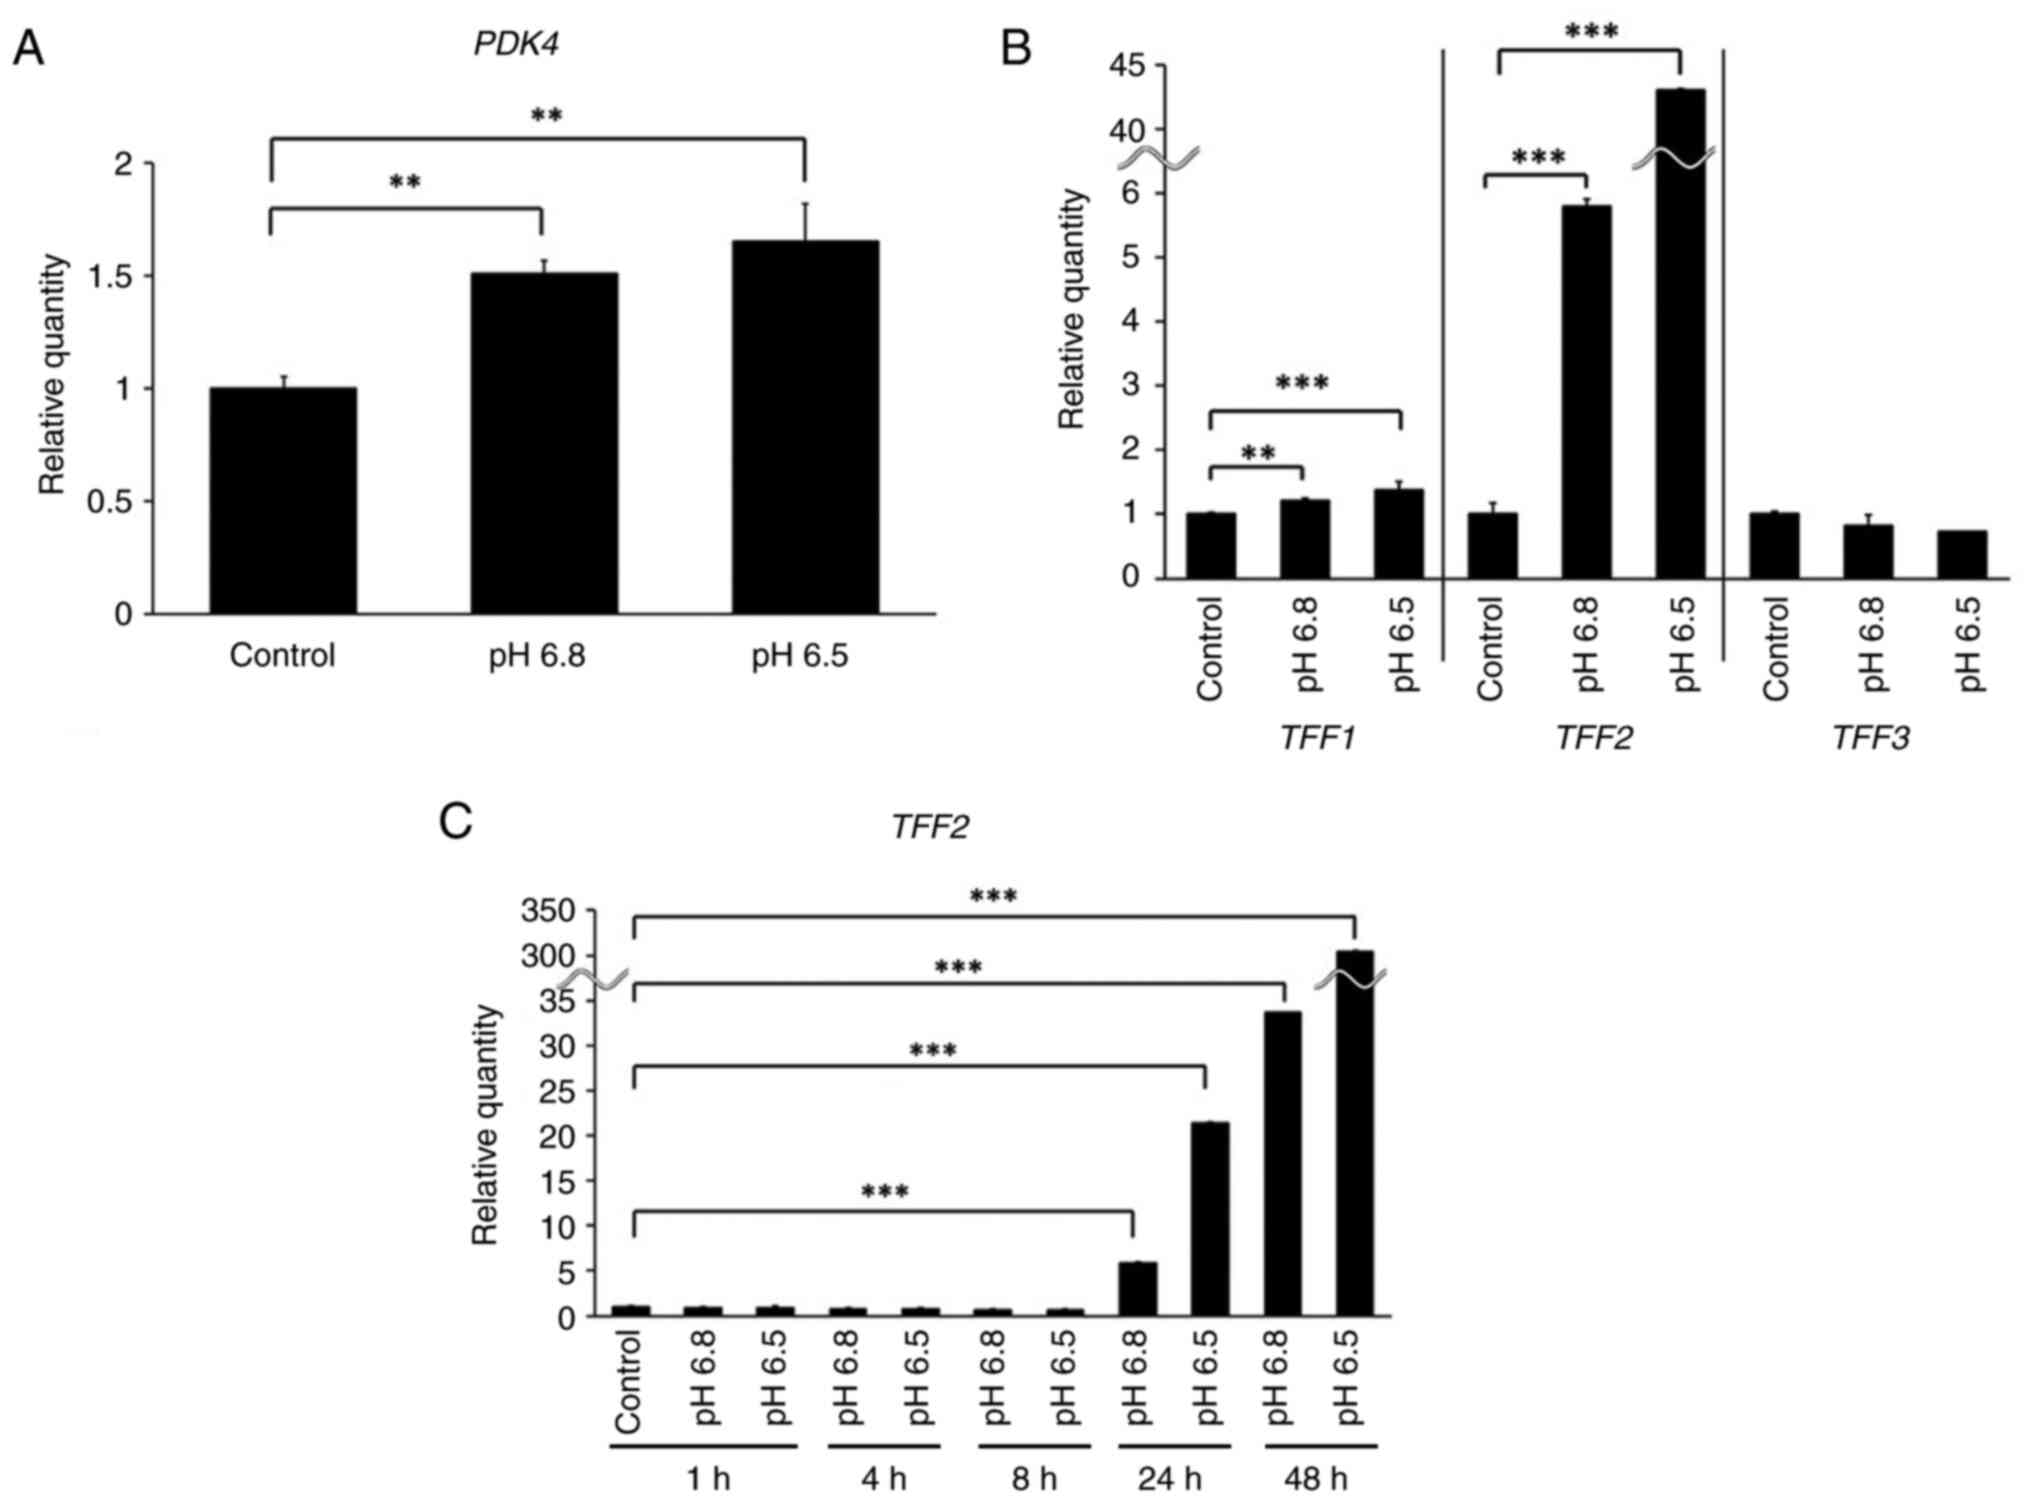
We cultured DLD-1 cells under acidic conditions (pH
6.5 and 6.8) for 48 h. Cells cultured at pH 7.4 for 48 h were used
as a control when performing relative quantification with real-time
RT-qPCR. PDK4, which is expressed at low pH (20), exhibited increased (P<0.01)
expression in the acidic media (Fig.
3A). TFF2 expression was increased 42.8- and 5.8- fold
in relative quantification values in cells cultured in the acidic
medium at pH 6.5 and 6.8 (Fig. 3B).
We then adjusted the cell incubation time, collected cells at
several time points, and measured the relative expression of
TFF2. We used cells cultured at pH 7.4 for 1 h as a control
when performing relative quantification with real-time RT-qPCR. The
TFF2 expression was poor in cultured cells, under neutral
culture conditions. TFF2 expression was significantly
increased (P<0.0001) after 24 h culture under acidic conditions
(Fig. 3C). We also investigated
TFF2 expression in tissues exposed to low pH environments
in vivo. In ApcMin/+ mice aged 13 to 15
weeks, Tff2 expression was confirmed by western blotting in
stomachs and intestinal polyps that are considered acidic, but not
in the normal intestinal tracts, which are weakly alkaline
(Fig. S1).
Effect of acidic pH on TFF2 expression
in other cell lines
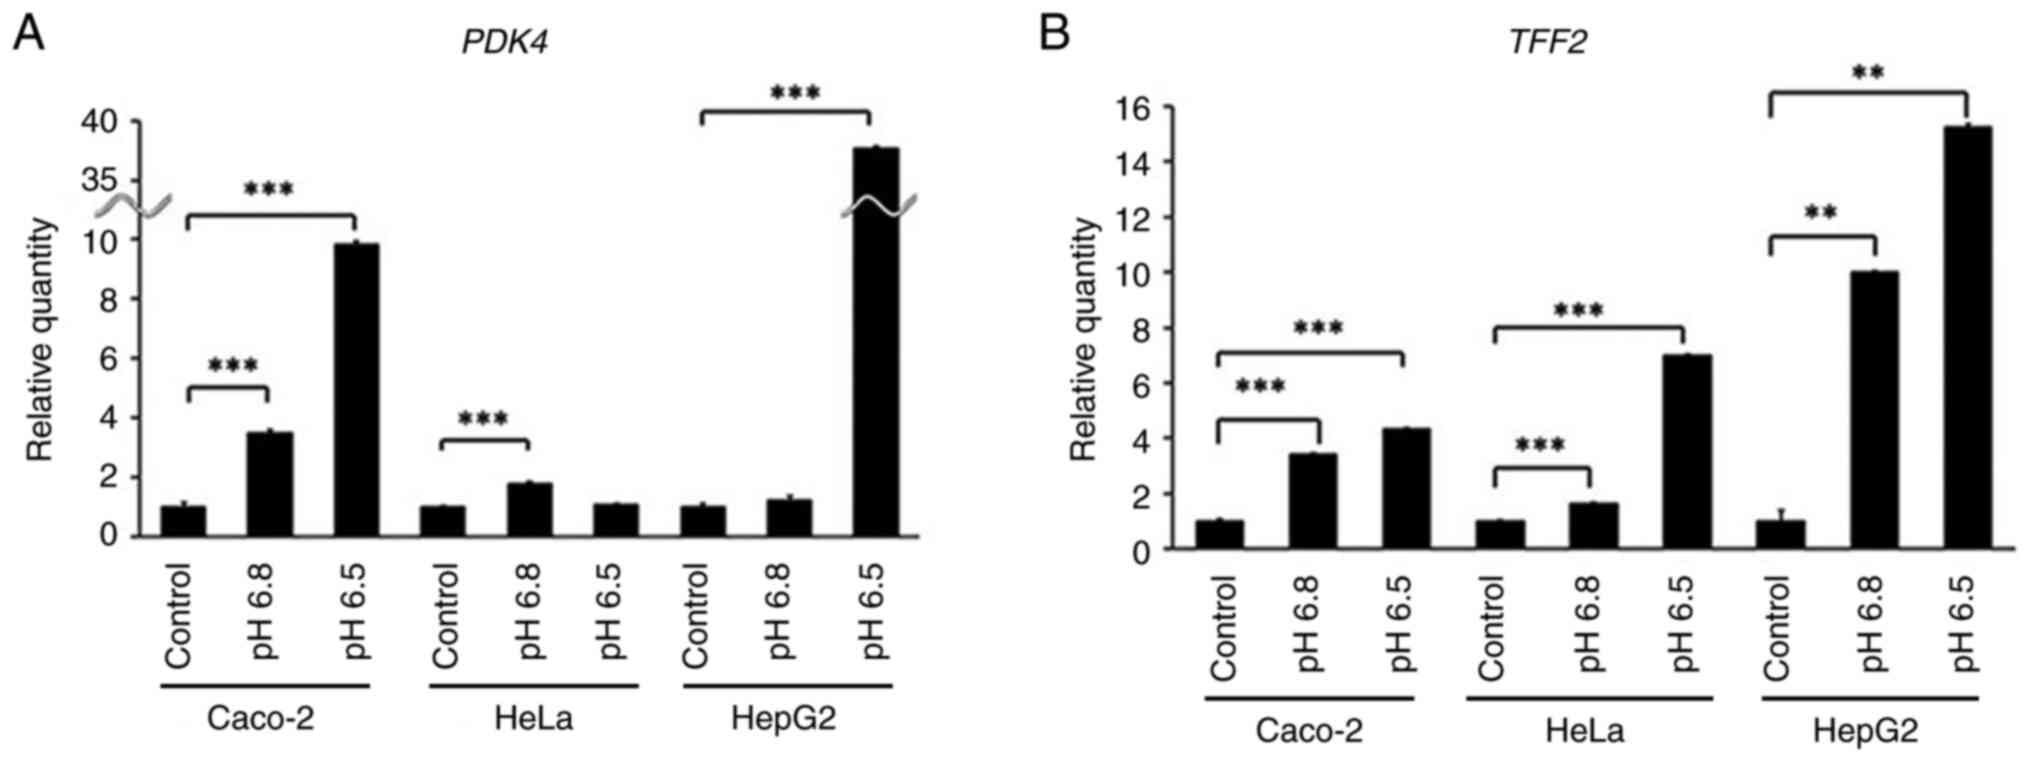
We evaluated TFF2 expression in Caco-2, HeLa,
and HepG2 cells under acidic conditions. PDK4 (Fig. 4A) and TFF2 (Fig. 4B) both exhibited a significant
increased expression in each cell line (P<0.01 and P<0.0001,
respectively). However, HeLa cells showed, hardly upregulated
PDK4 at pH 6.5, while the TFF2 expression was
elevated.
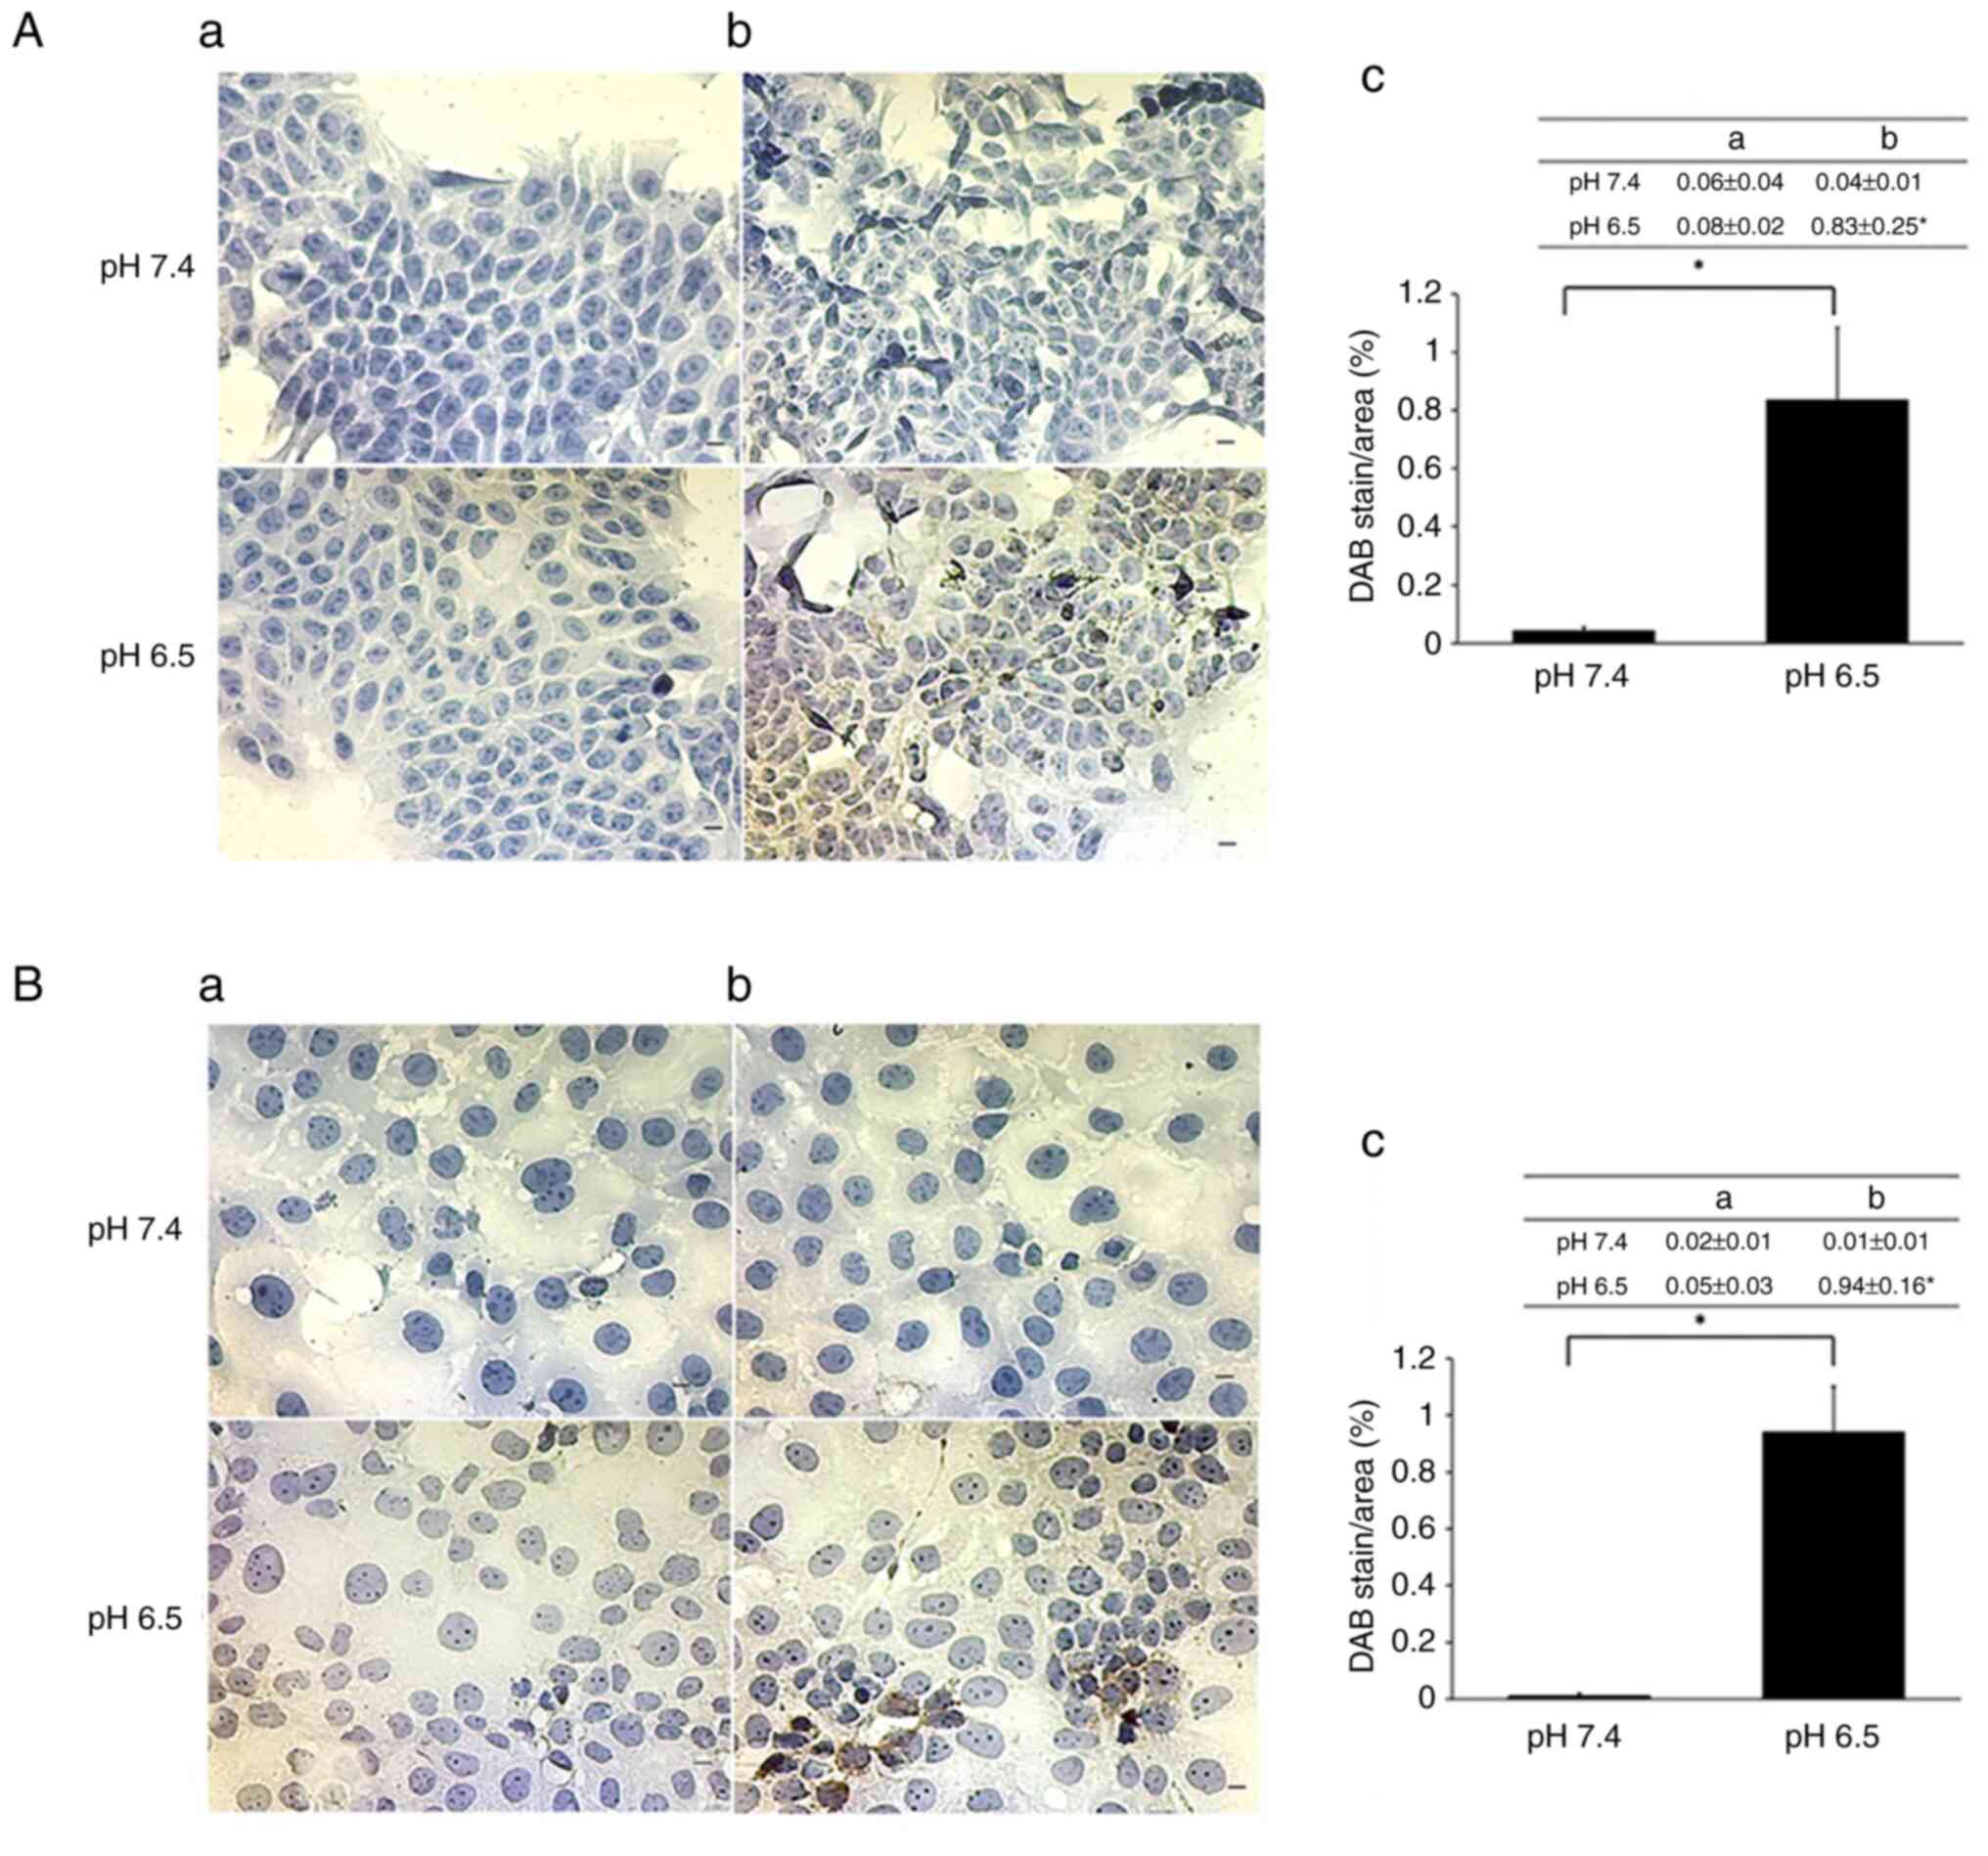
Immunohistochemistry of cultivated
cells
We confirmed the expression of TFF2 in DLD-1 and
Caco-2 cells that were exposed to an acidic medium by
immunohistochemistry. Positive controls were DLD-1 cells
transiently transfected with expression plasmid pcDNA
3.1−/c-(K)-DYK-TFF2 (Fig. S2). All of the TFF2
immunohistochemistry experiments were performed with the same lot
of primary antibodies. TFF2 expression was not observed in
untransfected DLD-1 and Caco-2 cells cultured at pH 7.4 (Fig. 5A and B). To prevent false positives,
cells omitting the TFF2 primary antibody were also not stained
under both neutral and acidic conditions (Fig. 5Aa and Ba). In contrast, TFF2 was
clearly expressed in some DLD-1 and Caco-2 cells cultured under
acidic conditions (Fig. 5Ab and
Bb).
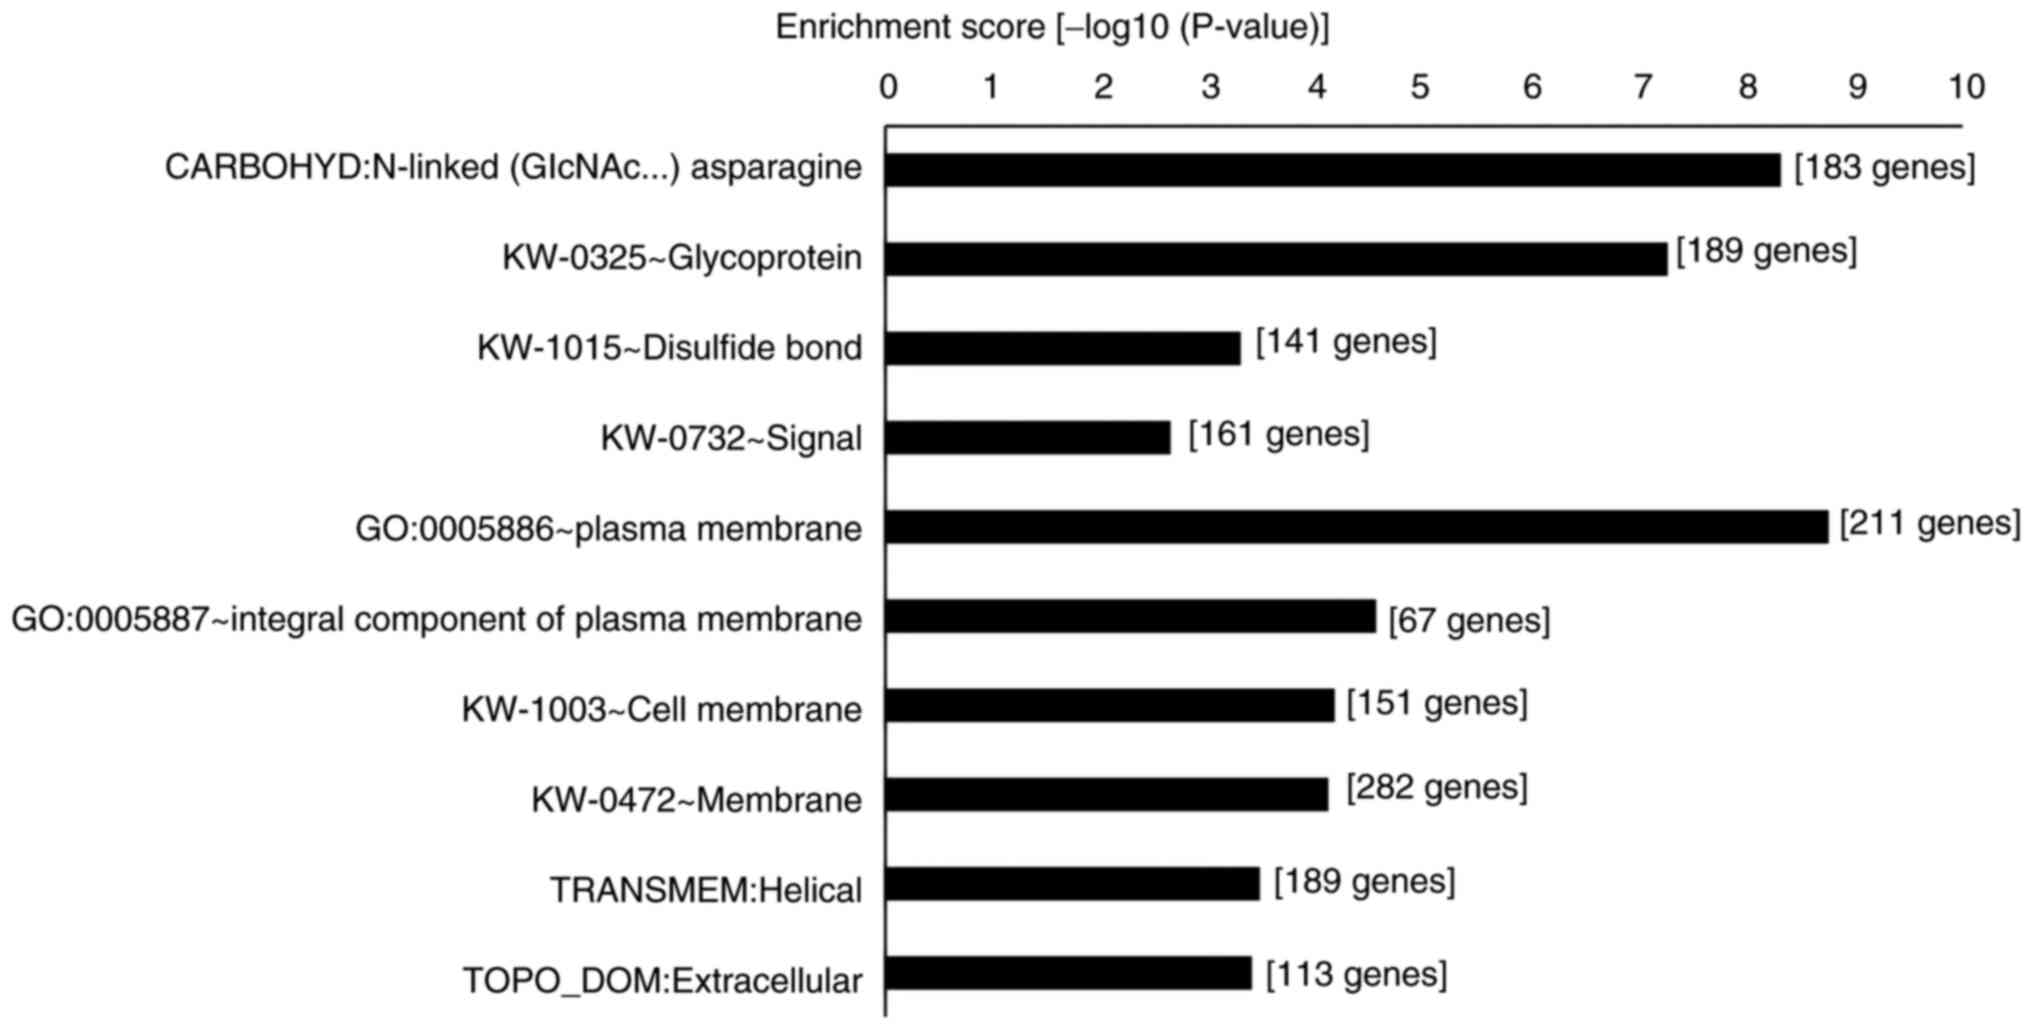
Differential gene expression profiles
under acidic conditions in DLD-1 cells
The expression of several genes is expected to be
altered under acidic conditions, as was seen with TFF2
expression. GO analysis was performed using DAVID to examine which
gene expression was affected under acidic conditions. Microarray
analysis revealed a significant increase in the expression of 916
genes. Subsequently, significantly upregulated genes at pH 6.5 were
analyzed using DAVID. We identified 700 DAVID gene IDs and 562
annotations with charts (Fig. 6).
In particular, the expression of genes related to N-linked glycans,
glycoproteins, disulfide bonds, signal and plasma membranes was
significantly increased in DLD-1 under acidic conditions.
TFF2 was included in the group of disulfide bond- and
signal-related genes. The same tendency was observed at pH 6.8.
Discussion
This study revealed that TFF2, which is
highly expressed in normal gastric tissue, colon cancer, pancreatic
cancer, bile duct cancer, and other tumors, is induced under acidic
conditions. These discrepancies in TFF2 expression among
normal tissue, tumors, and cultured cells make us realize the
importance of the microenvironment in modifying gene expression.
Interestingly, changes in the incubation temperature did not
significantly affect TFF2 expression. Conversely,
TFF1 and TFF3 exhibited slight changes in expression
in response to temperature changes, indicating that a different
expression mechanism may drive TFF2 expression from
TFF1 and TFF3.
TFF1, TFF2, and TFF3 are located on
the same chromosome, and their loci are close proximity; however,
each is an independent gene. TFF1 and TFF3 each have one trefoil
factor domain and form a heterodimer, while TFF2 has two TFF
domains and coexists with mucin MUC6 (21). The protein expression of TFF1 and
TFF3 in the serum of patients with breast cancer is significantly
higher than that of healthy individuals, whereas TFF2 protein
levels are significantly lower (22). The interior of high-malignancy
tumors, especially breast cancer tumors, reportedly exhibits a
higher temperature than normal tissue (15). Additionally, patients with breast
cancer demonstrated a mechanism that suppresses TFF2 expression
when the serum TFF1 and TFF3 levels are elevated (22). These reports confirm our findings,
indicating that the mechanisms underlying the regulation of TFF2
expression differ from those of TFF1 and TFF3.
We revealed a significantly increased TFF2
expression in DLD-1 cells cultured in an acidic medium. This trend
was also observed in Caco-2, HeLa, and HepG2 cells. PDK4
expression in HeLa was not pH-dependent. HeLa cells, representative
of cervical cancer cells, exhibited remarkably rapid proliferation
compared to DLD-1 cells. Interestingly, under low-pH conditions,
the cell count displayed a tendency to decrease, despite the
elevated expression of TFF2. HeLa cells reportedly have
difficulty to survive at pH 6.6 (23). Hence, HeLa cells may have a
survival-associated metabolic gene PDK4 expression that was
barely upregulated at pH 6.5. The rapid reduction in cell number in
the control group is also presumably to a decrease in medium pH
resulting from the overcrowding of the cell population.
Furthermore, in HepG2, which are homeostatic metabolizing fatty
acids, PDK4 expression was significantly increased at pH
6.5, although its expression was similar to that of controls at pH
6.8. Conversely, TFF2 expression was dependent on the acidic
environment, the expression of which was significantly elevated at
a pH 6.8. However, the threshold for gene expression differs from
cell, and some cell types may not be pH-dependent. This may be due
to differences in cell membrane components in the various tissues
(24). Several clinical reports
detail increased TFF2 expression in human colorectal cancer
(25,26). TFF2 expression in cultured
cells was also induced not only by HEPES but also by acidic media
containing acetic and hydrochloric acid; however, TFF1 and
TFF3 expressions were not induced (data not shown). These
findings suggest that the evaluated expression of TFF2 in
cancer cells is triggered by the low pH of the
microenvironment.
The elevated expression of TFF2 in normal
tissues, particularly in the stomach, may protect cells from acidic
environments by inducing the expression of glycoprotein and plasma
membrane-related genes. Mucin-type glycoproteins protect cells by
binding directly to TFF2 (23,27,28).
Cell membranes have been reported to protect against acid stress,
particularly via changes in membrane fluidity, membrane lipid
composition, and metabolic function that help cell survival in
highly acidic environments (24,29,30).
This study revealed that acidic conditions induced
TFF2 expression. The increased TFF2 expression
promotes or inhibits tumor development remained unclear for many
years. TFF2 expression is likely induced in acidic
environments in both normal and cancer cells; therefore,
TFF2 may play a role in assisting cell survival and
tumorigenesis under acidic conditions while repairing cell
membranes. We believe that targeting TFF2 will prevent and evaluate
therapeutic resistance and malignant transformation caused by
changes in the cancer microenvironment in the future.
Supplementary Material
Supporting Data
Acknowledgements
The authors would like to thank Professor Masashi
Fukasawa (Nagasaki International University) for their advice on
the experimental design. The authors would also like to thank Cell
Innovator Co., Ltd., (Fukuoka, Japan) for analyzing the microarray
and registering the raw data with the Gene Expression Omnibus.
Funding
This research was supported by the Pharmaceutical Education and
Research Fund of Nagasaki International University (grant no.
27-9408-4043).
Availability of data and materials
The data generated in the present study may be
requested from the corresponding author. The microarray data
generated in the present study may be found in the Gene Expression
Omnibus under accession number GSE246091 or at the following URL:
https://www.ncbi.nlm.nih.gov/geo/query/acc.cgi?acc=GSE246091.
Authors' contributions
MW and KF made substantial contributions to
conception and design, as well as the analysis and interpretation
of data for this work. YM and SM performed reverse
transcription-quantitative polymerase chain reaction. NK, YN and KF
performed western blot analysis and immunohistochemistry. YM
performed gene expression microarray and data analysis. YM, MW and
KF contributed to the manuscript drafting and confirm the
authenticity of all the raw data. All authors read and approved the
final manuscript. Additionally, all authors were responsible for
the accuracy and completeness of all content.
Ethics approval and consent to
participate
Regarding experimental animals, the utilization of
animals was minimized, and the experiments were conducted following
the Nagasaki International University Animal Experimentation
Guidelines, with approval obtained from the Animal Experimentation
Committee of Nagasaki International University (approval no.
168).
Patient consent for publication
Not applicable.
Competing interests
The authors declare that they have no competing
interests.
References
|
1
|
Fujimoto K, Fujii G, Taguchi K, Yasuda K,
Matsuo Y, Hashiyama A, Mutoh M, Tanaka H and Wada M: Involvement of
trefoil factor family 2 in the enlargement of intestinal tumors in
Apc(Min/+) mice. Biochem Biophys Res Commun. 463:859–863. 2015.
View Article : Google Scholar : PubMed/NCBI
|
|
2
|
Ma X, Yuan W and Ma J: Expression level of
miR-199b in human colorectal cancer tissues and its correlation
with clinicopathological features and prognosis of patients.
Zhonghua Zhong Liu Za Zhi. 45:330–334. 2023.(In Chinese).
PubMed/NCBI
|
|
3
|
Qu Y, Yang Y, Ma D and Xiao W: Increased
trefoil factor 3 levels in the serum of patients with three major
histological subtypes of lung cancer. Oncol Rep. 27:1277–1283.
2012. View Article : Google Scholar : PubMed/NCBI
|
|
4
|
Minegishi K, Dobashi Y, Koyama T,
Ishibashi Y, Furuya M, Tsubochi H, Ohmoto Y, Yasuda T and Nomura S:
Diagnostic utility of trefoil factor families for the early
detection of lung cancer and their correlation with tissue
expression. Oncol Lett. 25:1392023. View Article : Google Scholar : PubMed/NCBI
|
|
5
|
Aihara E, Engevik KA and Montrose MH:
Trefoil factor peptides and gastrointestinal function. Annu Rev
Physiol. 79:357–380. 2017. View Article : Google Scholar : PubMed/NCBI
|
|
6
|
Guo M, Wang R, Geng J, Li Z and Liu M, Lu
X, Wei J and Liu M: Human TFF2-Fc fusion protein alleviates
DSS-induced ulcerative colitis in C57BL/6 mice by promoting
intestinal epithelial cells repair and inhibiting macrophage
inflammation. Inflammopharmacology. 3:1387–1404. 2023. View Article : Google Scholar : PubMed/NCBI
|
|
7
|
Kosriwong K, Menheniott TR, Giraud AS,
Jearanaikoon P, Sripa B and Limpaiboon T: Trefoil factors: Tumor
progression markers and mitogens via EGFR/MAPK activation in
cholangiocarcinoma. World J Gastroenterol. 17:1631–1641. 2011.
View Article : Google Scholar : PubMed/NCBI
|
|
8
|
Jahan R, Ganguly K, Smith LM, Atri P,
Carmicheal J, Sheinin Y, Rachagani S, Natarajan G, Brand RE, Macha
MA, et al: Trefoil factor(s) and CA19.9: A promising panel for
early detection of pancreatic cancer. EBioMedicene. 42:375–385.
2019. View Article : Google Scholar
|
|
9
|
Asaka S, Nakajima T, Momose M, Miyamoto T,
Uehara T and Ota H: Trefoil factor family 2 protein: A potential
immunohistochemical marker for aiding diagnosis of lobular
endocervical glandular hyperplasia and gastric-type adenocarcinoma
of the uterine cervix. Virchows Arch. 474:79–86. 2019. View Article : Google Scholar : PubMed/NCBI
|
|
10
|
Jahan R, Shah A, Kisling SG, Macha MA,
Thayer S, Batra SK and Kaur S: Odyssey of trefoil factors in
cancer: Diagnostic and therapeutic implications. Biochim Biophys
Acta Rev Cancer. 1873:1883622020. View Article : Google Scholar : PubMed/NCBI
|
|
11
|
Zhang Y, Liu Y, Wang L and Song H: The
expression and role of trefoil factors in human tumors. Transl
Cancer Res. 8:1609–1617. 2019. View Article : Google Scholar : PubMed/NCBI
|
|
12
|
So JY, Ohm J, Lipkowitz S and Yang L:
Triple negative breast cancer (TNBC): Non-genetic tumor
heterogeneity and immune microenvironment: Emerging treatment
options. Pharmacol Ther. 237:1082532022. View Article : Google Scholar : PubMed/NCBI
|
|
13
|
Funato Y, Yoshida A, Hirata Y, Hashizume
O, Yamazaki D and Miki H: The oncogenic PRL protein causes acid
addiction of cells by stimulating lysosomal exocytosis. Dev Cell.
55:387–397.e8. 2020. View Article : Google Scholar : PubMed/NCBI
|
|
14
|
Pentheroudakis G, Kotoula V, Fountzilas E,
Kouvatseas G, Basdanis G, Xanthakis I, Makatsoris T, Charalambous
E, Papamichael D, Samantas E, et al: A study of gene expression
markers for predictive significance for bevacizumab benefit in
patients with metastatic colon cancer: A translational research
study of the Hellenic Cooperative Oncology Group (HeCOG). BMC
Cancer. 14:1112014. View Article : Google Scholar : PubMed/NCBI
|
|
15
|
Otsuka K, Yamamoto Y and Ochiya T:
Uncovering temperature-dependent extracellular vesicle secretion in
breast cancer. J Extracell Vesicles. 10:e120492020. View Article : Google Scholar : PubMed/NCBI
|
|
16
|
Pitt MA: Increased temperature and entropy
production in cancer: The role of anti-inflammatory drugs.
Inflammopharmacology. 23:17–20. 2015. View Article : Google Scholar : PubMed/NCBI
|
|
17
|
Livak KJ and Schmittgen TD: Analysis of
relative gene expression data using real-time quantitative PCR and
the 2(−Delta C(T)) method. Mehtods. 25:402–408. 2001.PubMed/NCBI
|
|
18
|
Miyahara E, Nishikawa T, Takeuchi T,
Yasuda K, Okamoto Y, Kawano Y and Horiuchi M: Effect of
myeloperoxidase inhibition on gene expression profiles in HL-60
cells exposed to 1,2,4-benzenetriol. Toxicology. 317:50–57. 2014.
View Article : Google Scholar : PubMed/NCBI
|
|
19
|
Landry J, Bernier D, Chrétien P, Nicole
LM, Tanguay RM and Marceau N: Synthesis and degradation of heat
shock proteins during development and decay of thermotolerance.
Cancer Res. 42:2457–2461. 1982.PubMed/NCBI
|
|
20
|
Pettersen IKN, Tusubira D, Ashrafi H,
Dyrstad SE, Hansen L, Liu XZ, Nilsson LIH, Løvsletten NG, Berge K,
Wergedahl H, et al: Upregulated PDK4 expression is a sensitive
marker of increased fatty acid oxidation. Mitochondrion. 49:97–110.
2019. View Article : Google Scholar : PubMed/NCBI
|
|
21
|
Hoffmann W: Trefoil factor family (TFF)
peptides and their diverse molecular functions in mucus barrier
protection and more: Changing the paradigm. Int J Mol Sci.
21:45352020. View Article : Google Scholar : PubMed/NCBI
|
|
22
|
Ishibashi Y, Ohtsu H, Ikemura M, Kikuchi
Y, Niwa T, Nishioka K, Uchida Y, Miura H, Aikou S, Gunji T, et al:
Serum TFF1 and TFF3 but not TFF2 are higher in women with breast
cancer in women without breast cancer. Sci Rep. 7:48462017.
View Article : Google Scholar : PubMed/NCBI
|
|
23
|
Nogueira-Librelotto DR, Scheeren LE,
Macedo LB, Vinardell MP and Rolim CMB: pH-sensitive
chitosan-tripolyphoshate nanoparticles increase doxorubicin-induced
growth inhibition of cervical HeLa tumor cells by apoptosis and
cell cycle modulation. Colloids Surf B Biointerfaces.
190:1108972020. View Article : Google Scholar : PubMed/NCBI
|
|
24
|
Szlase W, Zendran I, Zalesińska A, Tarek M
and Kulbacka J: Lipid composition of the cancer cell membrane. J
Bioenerg Biomembr. 52:321–342. 2020. View Article : Google Scholar : PubMed/NCBI
|
|
25
|
Yu G, Jiang P, Xiang Y and Zhang Y, Zhu Z,
Zhang C, Lee S, Lee W and Zhang Y: Increased expression of
protease-activated receptor 4 and trefoil factor 2 in human
colorectal cancer. PLoS One. 10:e01226782015. View Article : Google Scholar : PubMed/NCBI
|
|
26
|
Gala MK, Austin T, Ogino S and Chan AT:
TFF2-CXCR4 axis is associated with BRAF V600E colon cancer. Cancer
Prev Res. 8:614–619. 2015. View Article : Google Scholar : PubMed/NCBI
|
|
27
|
Hoffmann W: Trefoil factor family (TFF)
peptides and their different roles in the mucosal innate immune
defense and more: An update. Curr Med Chem. 28:7387–7399. 2021.
View Article : Google Scholar : PubMed/NCBI
|
|
28
|
Järvå MA, Lingford JP, John A, Soler NM,
Scott NE and Goddard-Borger ED: Trefoil factors share a lectin
activity that defines their role in mucus. Nat Commun. 11:22652020.
View Article : Google Scholar : PubMed/NCBI
|
|
29
|
Wu C, Zhang J, Wang M, Du G and Chen J:
Lactobacillus casei combats acid stress by maintaining cell
membrane functionality. J Ind Microbiol Biotechnol. 39:1031–1039.
2012. View Article : Google Scholar : PubMed/NCBI
|
|
30
|
Guan N and Liu L: Microbial response to
acid stress: Mechanisms and applications. Appl Microbiol
Biotechnol. 104:51–65. 2020. View Article : Google Scholar : PubMed/NCBI
|