Introduction
Breast cancer is the prevailing and most lethal form
of malignancy afflicting women globally, and is the most common
type of cancer, with an estimated 2.3 million new cases in 2020, as
well as the leading cause of cancer death among women worlwide,
with ~685,000 deaths in 2020, posing a significant threat to public
health and wellbeing (1). Based on
the expression patterns of 50 specific genes strongly associated
with breast cancer (PAM50), it is divided into five intrinsic
subtypes including luminal A, luminal B, human epidermal growth
factor receptor 2 (HER2) enrichment, basal sample and normal sample
(2). Basal-like breast cancer
(BLBC) refers to a subtype of triple-negative breast cancer (TNBC),
which contributes to 10–20% of breast cancer and is characterized
by tumor cells without estrogen receptors (ER), progesterone
receptors (PR) or HER2 (3,4). In comparison to ER+/PR+ or HER2+
subtypes, patients with BLBC have the most unfavorable prognosis
and highest recurrence rates (5,6).
However, due to the absence of hormonal receptors and HER2,
targeted therapy options for BLBC are limiting and specific
standard treatment regimens are currently unavailable. Hence,
identification and understanding the factors and genes implicated
in the onset and progression of BLBC is imperative for the
management and prognosis of affected individuals.
Dysregulated lipid metabolism is a critical factor
in tumor progression (7,8). A previous study revealed the
significant involvement of apolipoprotein A-I (APOA1) in various
physiological and pathological processes, including but not limited
to anti-inflammatory, antioxidant and anti-apoptotic processes
(9). In the context of tumor
initiation and development, APOA1 has been implicated in the
progression of a diverse range of cancers, including breast cancer
(10), ovarian cancer (11), colorectal carcinoma (12,13)
and liver cancer (14). Despite a
wealth of research highlighting APOA1 as a potential biomarker with
anti-tumor effects (15,16), the specific biological role and
underlying mechanisms of APOA1 in BLBC remain largely unclear.
In the present study, the expression of APOA1 in
breast cancer was investigated to analyze its association with
BLBC. Subsequently, in vitro functional experiments were
performed to investigate the biological role of APOA1 in BLBC. To
the best of our knowledge, the present study was the first to
elucidate the link between the methylation status of APOA1 and gene
expression in BLBC cells, providing experimental and theoretical
support for using APOA1 as a therapeutic target for BLBC.
Materials and methods
Data acquisition
From the TCGA database (https://portal.gdc.cancer.gov), the TCGA-BRCA project
RNAseq data was downloaded, followed by the extraction of the TPM
format and clinical data. Additionally, methylation chip data
(Illumina450k) for the TCGA-BRCA project was obtained from the UCSC
Xena website (https://xenabrowser.net).
Analysis of APOA1 expression level and
clinical characteristics
Normal and tumor samples without any clinical
information in the database were removed, and the respective
expression levels of APOA1 in the transcriptome data were converted
numerically according to the log2 (TPM+1) format. Samples were
divided into high-APOA1 and low-APOA1 groups based on the median
APOA1 expression levels. The differences in clinical
characteristics among the two groups were analyzed using R software
(4.2.1; http://cran.r-project.org/src/base/R-4/) and the box
plot of APOA1 expression between different groups was visualized
using the ggplot2 package. P<0.05 was considered to indicate a
statistically significant difference.
Survival analysis of APOA1
expression
APOA1 expression level, and overall survival (OS)
and disease-free survival (DFS) analysis of all breast cancer
subtypes and basal subtypes were obtained from the GEPIA website
(http://gepia.cancer-pku.cn/) and UCSC
Xena (https://xenabrowser.net), respectively.
The median of APOA1 expression was used as the cut-off value to
distinguish the high and low expression groups of APOA1.
Correlation analysis between APOA1
expression level and methylation value
Samples with transcriptome data and methylation chip
detection results were selected from the TCGA-breast cancer
project. The data obtained from the UCSC Xena website was utilized
to generate a heat map of the methylation of CpG sites and
expression levels of the APOA1 gene. Additionally, the scatter plot
of these parameters was plotted by Graphpad 8 (https://www.graphpad.com) and analyzed for correlation
using Pearson's correlation coefficient). UCSC Xena (https://xenabrowser.net) generated the methylation box
diagram of the CpG locus in different breast cancer subtypes.
Plasmids
The pCMV-3Flag plasmid [Elk (Wuhan) Biotechnology,
Co., Ltd.] and the following primers were used to create the
pCMV-3Flag-APOA1 expression plasmid: Forward,
5′-GATAAAGCCCGGGCGGGATCCATGAAAGCTGCGGTGCTGAC-3′; reverse,
5′-CGACGGTATCGATAAGCTTTCACTGGGTGTTGAGCTTCTTA-3′.
Cell culture and transfection
The BLBC cell lines MDA-MB-468 and MDA-MB-231 (The
Cell Bank of Type Culture Collection of The Chinese Academy of
Sciences) were cultured in Leibovitz's L15 medium (cat. no.
PM151010; Procell Life Science & Technology Co., Ltd.)
supplemented with 10% fetal bovine serum (cat. no. 10270-106,
Gibco; Thermo Fisher Scientific, Inc.) and 1%
penicillin-streptomycin (cat. no. GNM15140; genom Bio). The
MDA-MB-468 and MDA-MB-231 cells were incubated at 37°C in a sterile
incubator without CO2. Thereafter, cells were
transfected with the pCMV-3Flag-APOA1 expression plasmid using
Lipofectamine® 2000 In Vitro Transfection Reagent
(Invitrogen; Thermo Fisher Scientific, Inc.). Specifically, the
cells were seeded in a 96-well plate at a density of
1×10⁵ cells/ml and incubated at 37°C for 24 h.
Subsequently, a mixture of pCMV-3Flag or pCMV-3Flag-APOA1 plasmids
at a concentration of 2.5 nM and Lipofectamine® 2000 was
prepared (total volume, 50 µl) for cell transfection. The cells
were cultivated in a 37°C incubator for 6 h. After which, cells
were transferred to complete culture medium, and collected for
subsequent detection 24–48 h later.
EdU assay
An EdU Assay Kit (cat. no. C10310-1; Guangzhou
Ribobio Co., Ltd.) was used to analyze the cells in the logarithmic
growth phase. Following transfection for 24 h, 1×10⁵
cells were seeded in a 6-well plate and incubated overnight.
Subsequently, cells were incubated at 37°C with 100 µl of 50 µM EdU
solution for 2 h. The cells were then fixed with 50 µl 4%
paraformaldehyde at room temperature for 30 min, followed by
neutralization with 50 µl of 2 mg/ml glycine. After
permeabilization with 0.5% Triton X-100 for 20 min, cells were
stained with 100 µl of 1X Apollo solution for DAPI and 100 µl of 1X
Hoechst33342 solution for EdU, both incubated at room temperature
for 30 min. Cells were visualized using a fluorescence microscope
(Nikon Corporation). Image J software (version 1.50; National
Institutes of Health) was used to calculate the proliferative rate
in each group.
Cell migration
Transwell chambers without diluted Matrigel were
utilized to measure cell migration (cat. no. 3422; Corning, Inc.).
A total of 200 µl of serum-free medium was added to the upper
chamber and 500 µl of complete culture medium was added to the
lower chamber. After transfection for 24 h, cells were prepared in
a suspension of 1×10⁵ cells/ml, and 200 µl of cell
suspension was added to the upper chamber, followed by an
incubation at 37°C for 24 h. After incubation, the cells were fixed
using 4% paraformaldehyde at room temperature for 25 min, followed
by crystal violet staining at room temperature for 20 min.
Subsequently, the cells in the upper chamber were carefully removed
using a cotton swab, while the non-cell seeded side was captured
using an inverted microscope.
RT-qPCR
TRIpure Total RNA Extraction Reagent [cat. no.
EP013; Elk (Wuhan) Biotechnology Co., Ltd.] was employed to extract
RNA from tissues or cells. EntiLink™ 1st Strand cDNA Synthesis
Super Mix kit [cat. no. EQ031; Elk (Wuhan) Biotechnology Co., Ltd.]
was utilized to reverse transcribe RNA into cDNA, with a reaction
temperature of 42°C for 30 min followed by a 5-min incubation at
85°C. EnTurbo™ SYBR Green PCR SuperMix kit [cat. no. EQ001; Elk
(Wuhan) Biotechnology Co., Ltd.] was employed in conjunction with
the QuantStudio 6 Flex System PCR system (Thermo Fisher Scientific,
Inc.) for RT-qPCR. The reaction conditions were as follows: Initial
denaturation at 95°C for 30 sec; denaturation at 95°C for 10 sec,
annealing at 58°C for 30 sec, extension at 72°C for 30 sec,
repeated for 40 cycles. Gene expression differences were calculated
utilizing the relative standard curve and comparative threshold
cycle method (2−ΔΔCq) (17), with ACTB and GAPDH as a reference
gene. The following primer sequences were used to validate the
overexpression efficiency of APOA1: Human APOA1, forward,
5′-CCAGGAGTTCTGGGATAACCT-3′, reverse, 5′-GCCACTTCTTCTGGAAGTCGT-3′,
and human ACTIN, forward, 5′-GTCCACCGCAAATGCTTCTA-3′, reverse,
5′-TGCTGTCACCTTCACCGTTC-3′. The following sequences were used to
validate the mRNA expression of APOA1 after the addition of 5-AZA:
Human APOA1, forward, 5′-CCCTGGGATCGAGTGAAGGA-3′, reverse,
5′-CTGGGACACATAGTCTCTGCC-3′, and GAPDH, forward,
5′-AGCCACATCGCTCAGACAC-3′, reverse, 5′-GCCCAATACGACCAAATCC-3′.
Western blotting
Total protein was extracted using RIPA Lysis Buffer
(cat. no. AS1004; Aspen Biological) and Protease Inhibitor Cocktail
(cat. no. 04693159001; Roche Diagnostics). The protein
concentration was determined using the BCA Protein Quantification
Kit (cat. no. AS1086; Aspen Biological). Subsequently, proteins (40
µg/lane) were separated using 10% SDS-PAGE and transferred onto
PVDF membranes. The membranes were then blocked with 5% skimmed
milk and 0.1% Tween-20 in Tris-buffered saline at room temperature
for 1 h. After which, the membranes were incubated overnight at 4°C
with primary antibodies against APOA1 (1:1,000; cat. no.
14427-1-AP; Proteintech Group, Inc.) and β-actin (1:10,000; cat.
no. TDY051; Beijing TDY Biotech Co., Ltd.). After washing three
times with PBS containing 0.5% Tween-20, the membranes were
incubated with HRP-conjugated anti-rabbit secondary antibodies
(1:10,000; cat. no. AS1107; Aspen Biological) at room temperature
for 1 h. Signal visualization was performed using a Lide110 scanner
(Canon, Inc.).
Methylation-specific PCR (MSP)
Genomic DNA was extracted from the cultured cells
using a gDNA isolation kit [cat. no. EP007; Elk (Wuhan)
Biotechnology Co., Ltd.]. Methylation-Gold Kit (cat. no. D5005S;
Zymo Research Corp.) was used to convert the genomic DNA into
bisulfite-modified DNA. Methylation-specific PCR (MSP) experiments
were conducted employing the HieffTM PCR Master Mix (cat. no.
10102ES08; Shanghai Yeasen Biotechnology Co., Ltd.). The
unmethylated fragments were amplified using the following APOA1
primers: Forward, 5′-TGGAGTGGGGTGGTTTTAGGGAGT-3′, and reverse,
5′-AACCACAACTATTTCTAAACAAAAT-3′. Moreover, the methylated fragments
were amplified using the following primers: Forward methylation,
5′-CGGAGCGGGGCGGTTTTAGGGAGT-3′, and reverse methylation,
5′-AAACCGCGACTATTTCTAAACGA-3′. The PCR reaction volume was set at
20 µl, and the thermocycling conditions were as follows: Initial
denaturation at 98°C for 4 min, followed by denaturation at 98°C
for 30 sec, annealing at 56°C for 30 sec, extension at 72°C for 30
sec and final extension at 72°C for 10 min. The PCR products were
separated by 2% agarose gel electrophoresis, and bands were
visualized by staining with GoldView I nucleic acid dye. The
concentration of 5-azacytidine (5-AZA; cat. no. HY-A0004;
MedChemExpress) in the administration experiment was 10 µM and the
experiment was performed three times. Finally, the methylation
status of the APOA1 promoter was assessed by analyzing different
grayscale values using ImageJ software (version 1.50; National
Institutes of Health).
Statistical analysis
R software (4.2.1) (https://cran.r-project.org/src/base/R-4/), GraphPad
Prism8 (Dotmatics) and SPSS (version 22; IBM Corp.) were used for
statistical analysis and creating figures. A frequency distribution
histogram tested the data distribution. In addition, group t-test
and one way ANOVA were employed for the statistical analysis
between the two groups and multiple groups, respectively. After
ANOVA analysis, Bonferroni was used for pairwise comparison. Data
without a normal distribution utilized non-parametric tests
including Mann-Whitney and Kruskal-Wallis tests were employed for
the statistical analysis between two groups and multiple groups,
respectively. For in vitro experiments, three replicates
were set for each group, and the distribution of data in each group
was expressed as mean and standard deviation. P<0.05 was
considered to indicate a statistically significant difference.
Results
Correlation analysis between APOA1
expression and clinical features
To explore the potential contribution of APOA1 in
the progression of breast cancer, the relationship between clinical
features and APOA1 mRNA levels in clinical data was analyzed
(Table I). A significant
correlation between APOA1 expression and ER, PR, HER2, PAM50 and OS
was revealed. However, the differences were not statistically
significant for all other clinical characteristics.
 | Table I.Clinical analysis results of high-
and low-APOA1 groups. |
Table I.
Clinical analysis results of high-
and low-APOA1 groups.
| Characteristic | Low expression of
APOA1 | High expression of
APOA1 | P-value | Statistical
test |
|---|
| n | 541 | 542 |
|
|
| T stage, n (%) |
|
| 0.166 | Chi square |
| T1 | 132 (12.2) | 145 (13.4) |
|
|
| T2 | 328 (30.4) | 301 (27.9) |
|
|
| T3 | 60 (5.6) | 79 (7.3) |
|
|
| T4 | 20 (1.9) | 15 (1.4) |
|
|
| N stage, n (%) |
|
| 0.459 | Chi square |
| N0 | 250 (23.5) | 264 (24.8) |
|
|
| N1 | 173 (16.3) | 185 (17.4) |
|
|
| N2 | 62 (5.8) | 54 (5.1) |
|
|
| N3 | 43 (4) | 33 (3.1) |
|
|
| M stage, n (%) |
|
| 0.350 | Chi square |
| M0 | 468 (50.8) | 434 (47.1) |
|
|
| M1 | 13 (1.4) | 7 (0.8) |
|
|
| Pathologic stage, n
(%) |
|
| 0.448 | Chi square |
| Stage
I | 85 (8) | 96 (9.1) |
|
|
| Stage
II | 310 (29.2) | 309 (29.2) |
|
|
| Stage
III | 121 (11.4) | 121 (11.4) |
|
|
| Stage
IV | 12 (1.1) | 6 (0.6) |
|
|
| Ethnicity, n
(%) |
|
| 0.246 | Chi square |
|
Asian | 35 (3.5) | 25 (2.5) |
|
|
| Black
or African American | 83 (8.4) | 98 (9.9) |
|
|
|
White | 369 (37.1) | 384 (38.6) |
|
|
| Age, n (%) |
|
| 0.152 | Chi square |
|
≤60 | 288 (26.6) | 313 (28.9) |
|
|
|
>60 | 253 (23.4) | 229 (21.1) |
|
|
| Histological type,
n (%) |
|
| <0.001 | Chi square |
|
Infiltrating ductal
carcinoma | 421 (43.1) | 351 (35.9) |
|
|
|
Infiltrating lobular
carcinoma | 72 (7.4) | 133 (13.6) |
|
|
| PR status, n
(%) |
|
| <0.001 | Fisher's |
|
Negative | 208 (20.1) | 134 (13) |
|
|
|
Indeterminate | 3 (0.3) | 1 (0.1) |
|
|
|
Positive | 303 (29.3) | 385 (37.2) |
|
|
| ER status, n
(%) |
|
| <0.001 | Fisher's |
|
Negative | 158 (15.3) | 82 (7.9) |
|
|
|
Indeterminate | 2 (0.2) | 0 (0) |
|
|
|
Positive | 354 (34.2) | 439 (42.4) |
|
|
| HER2 status, n
(%) |
|
| 0.025 | Chi square |
|
Negative | 265 (36.5) | 293 (40.3) |
|
|
|
Indeterminate | 8 (1.1) | 4 (0.6) |
|
|
|
Positive | 92 (12.7) | 65 (8.9) |
|
|
| PAM50, n (%) |
|
| <0.001 | Chi square |
|
Normal | 20 (1.8) | 20 (1.8) |
|
|
|
LumA | 230 (21.2) | 332 (30.7) |
|
|
|
LumB | 102 (9.4) | 102 (9.4) |
|
|
|
Her2 | 68 (6.3) | 14 (1.3) |
|
|
|
Basal | 121 (11.2) | 74 (6.8) |
|
|
| Menopause status, n
(%) |
|
| 0.760 | Chi square |
|
Pre- | 114 (11.7) | 115 (11.8) |
|
|
|
Peri- | 19 (2) | 21 (2.2) |
|
|
|
Post- | 365 (37.6) | 338 (34.8) |
|
|
| PFI event, n
(%) |
|
| 0.470 | Chi square |
|
Alive | 463 (42.8) | 473 (43.7) |
|
|
|
Deceased | 78 (7.2) | 69 (6.4) |
|
|
| DSS event, n
(%) |
|
| 0.100 | Chi square |
|
Alive | 478 (45) | 500 (47) |
|
|
|
Deceased | 50 (4.7) | 35 (3.3) |
|
|
| OS event, n
(%) |
|
| 0.011 | Chi square |
|
Alive | 450 (41.6) | 481 (44.4) |
|
|
|
Deceased | 91 (8.4) | 61 (5.6) |
|
|
| Radiation therapy,
n (%) |
|
| 0.579 | Chi square |
| No | 208 (21.1) | 226 (22.9) |
|
|
|
Yes | 276 (28) | 277 (28.1) |
|
|
| Anatomic neoplasm
subdivisions, n (%) |
|
| 0.928 | Chi square |
|
Left | 280 (25.9) | 283 (26.1) |
|
|
|
Right | 261 (24.1) | 259 (23.9) |
|
|
| Age, median
(IQR) | 59 (49, 68) | 58 (48, 67) | 0.277 | Wilcoxon |
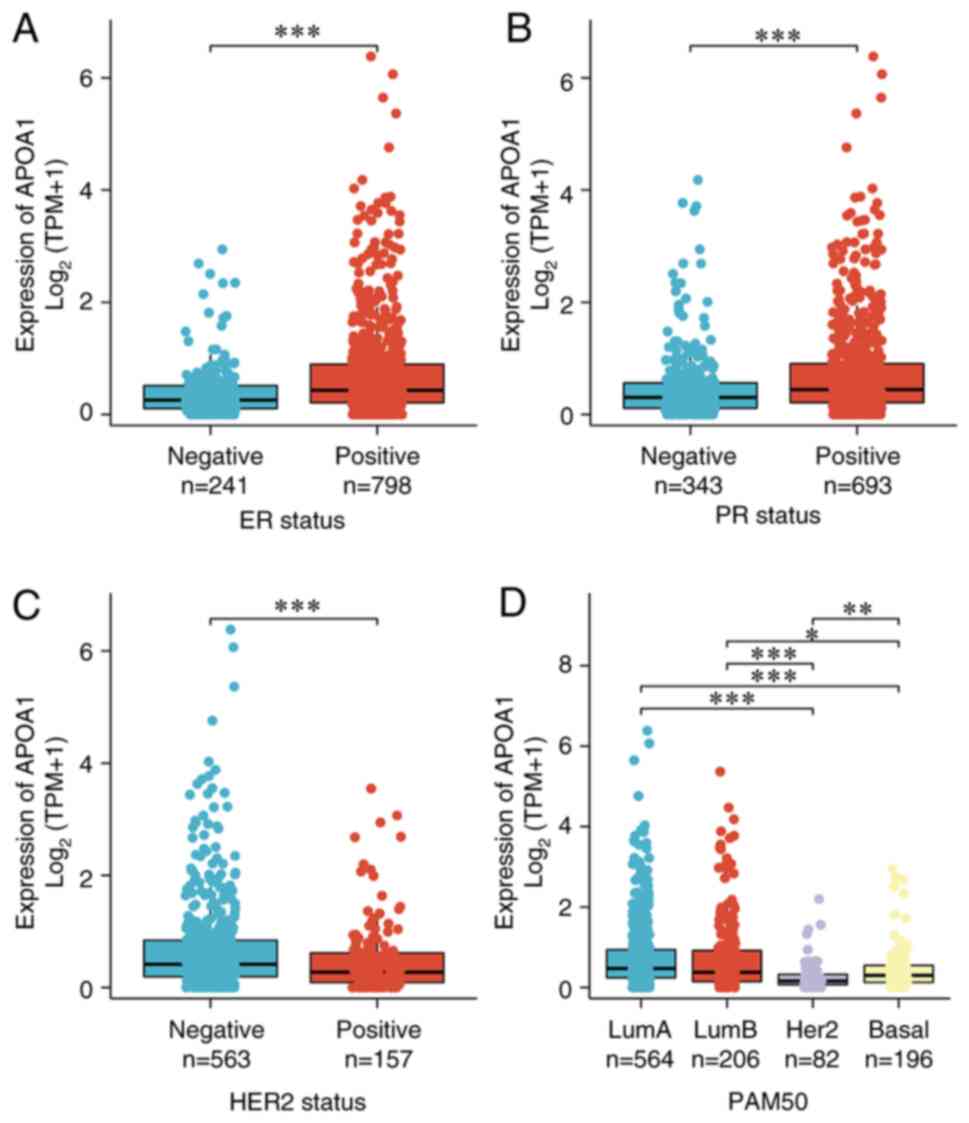
Expression of APOA1 varies among
different breast cancer subtypes
The breast cancer data were further analyzed with
different phenotypes in TCGA database and found that ER and PR were
positively correlated with APOA1 expression (Fig. 1A and B). However, APOA1 expression
was lower in the HER2+ group relative to the HER2-group (Fig. 1C). Simultaneously, the APOA1
expression in the lumina subtype was markedly elevated compared
with that in the basal and HER2 subtypes (Fig. 1D), indicating its diverse biological
roles in different phenotypes of breast cancer.
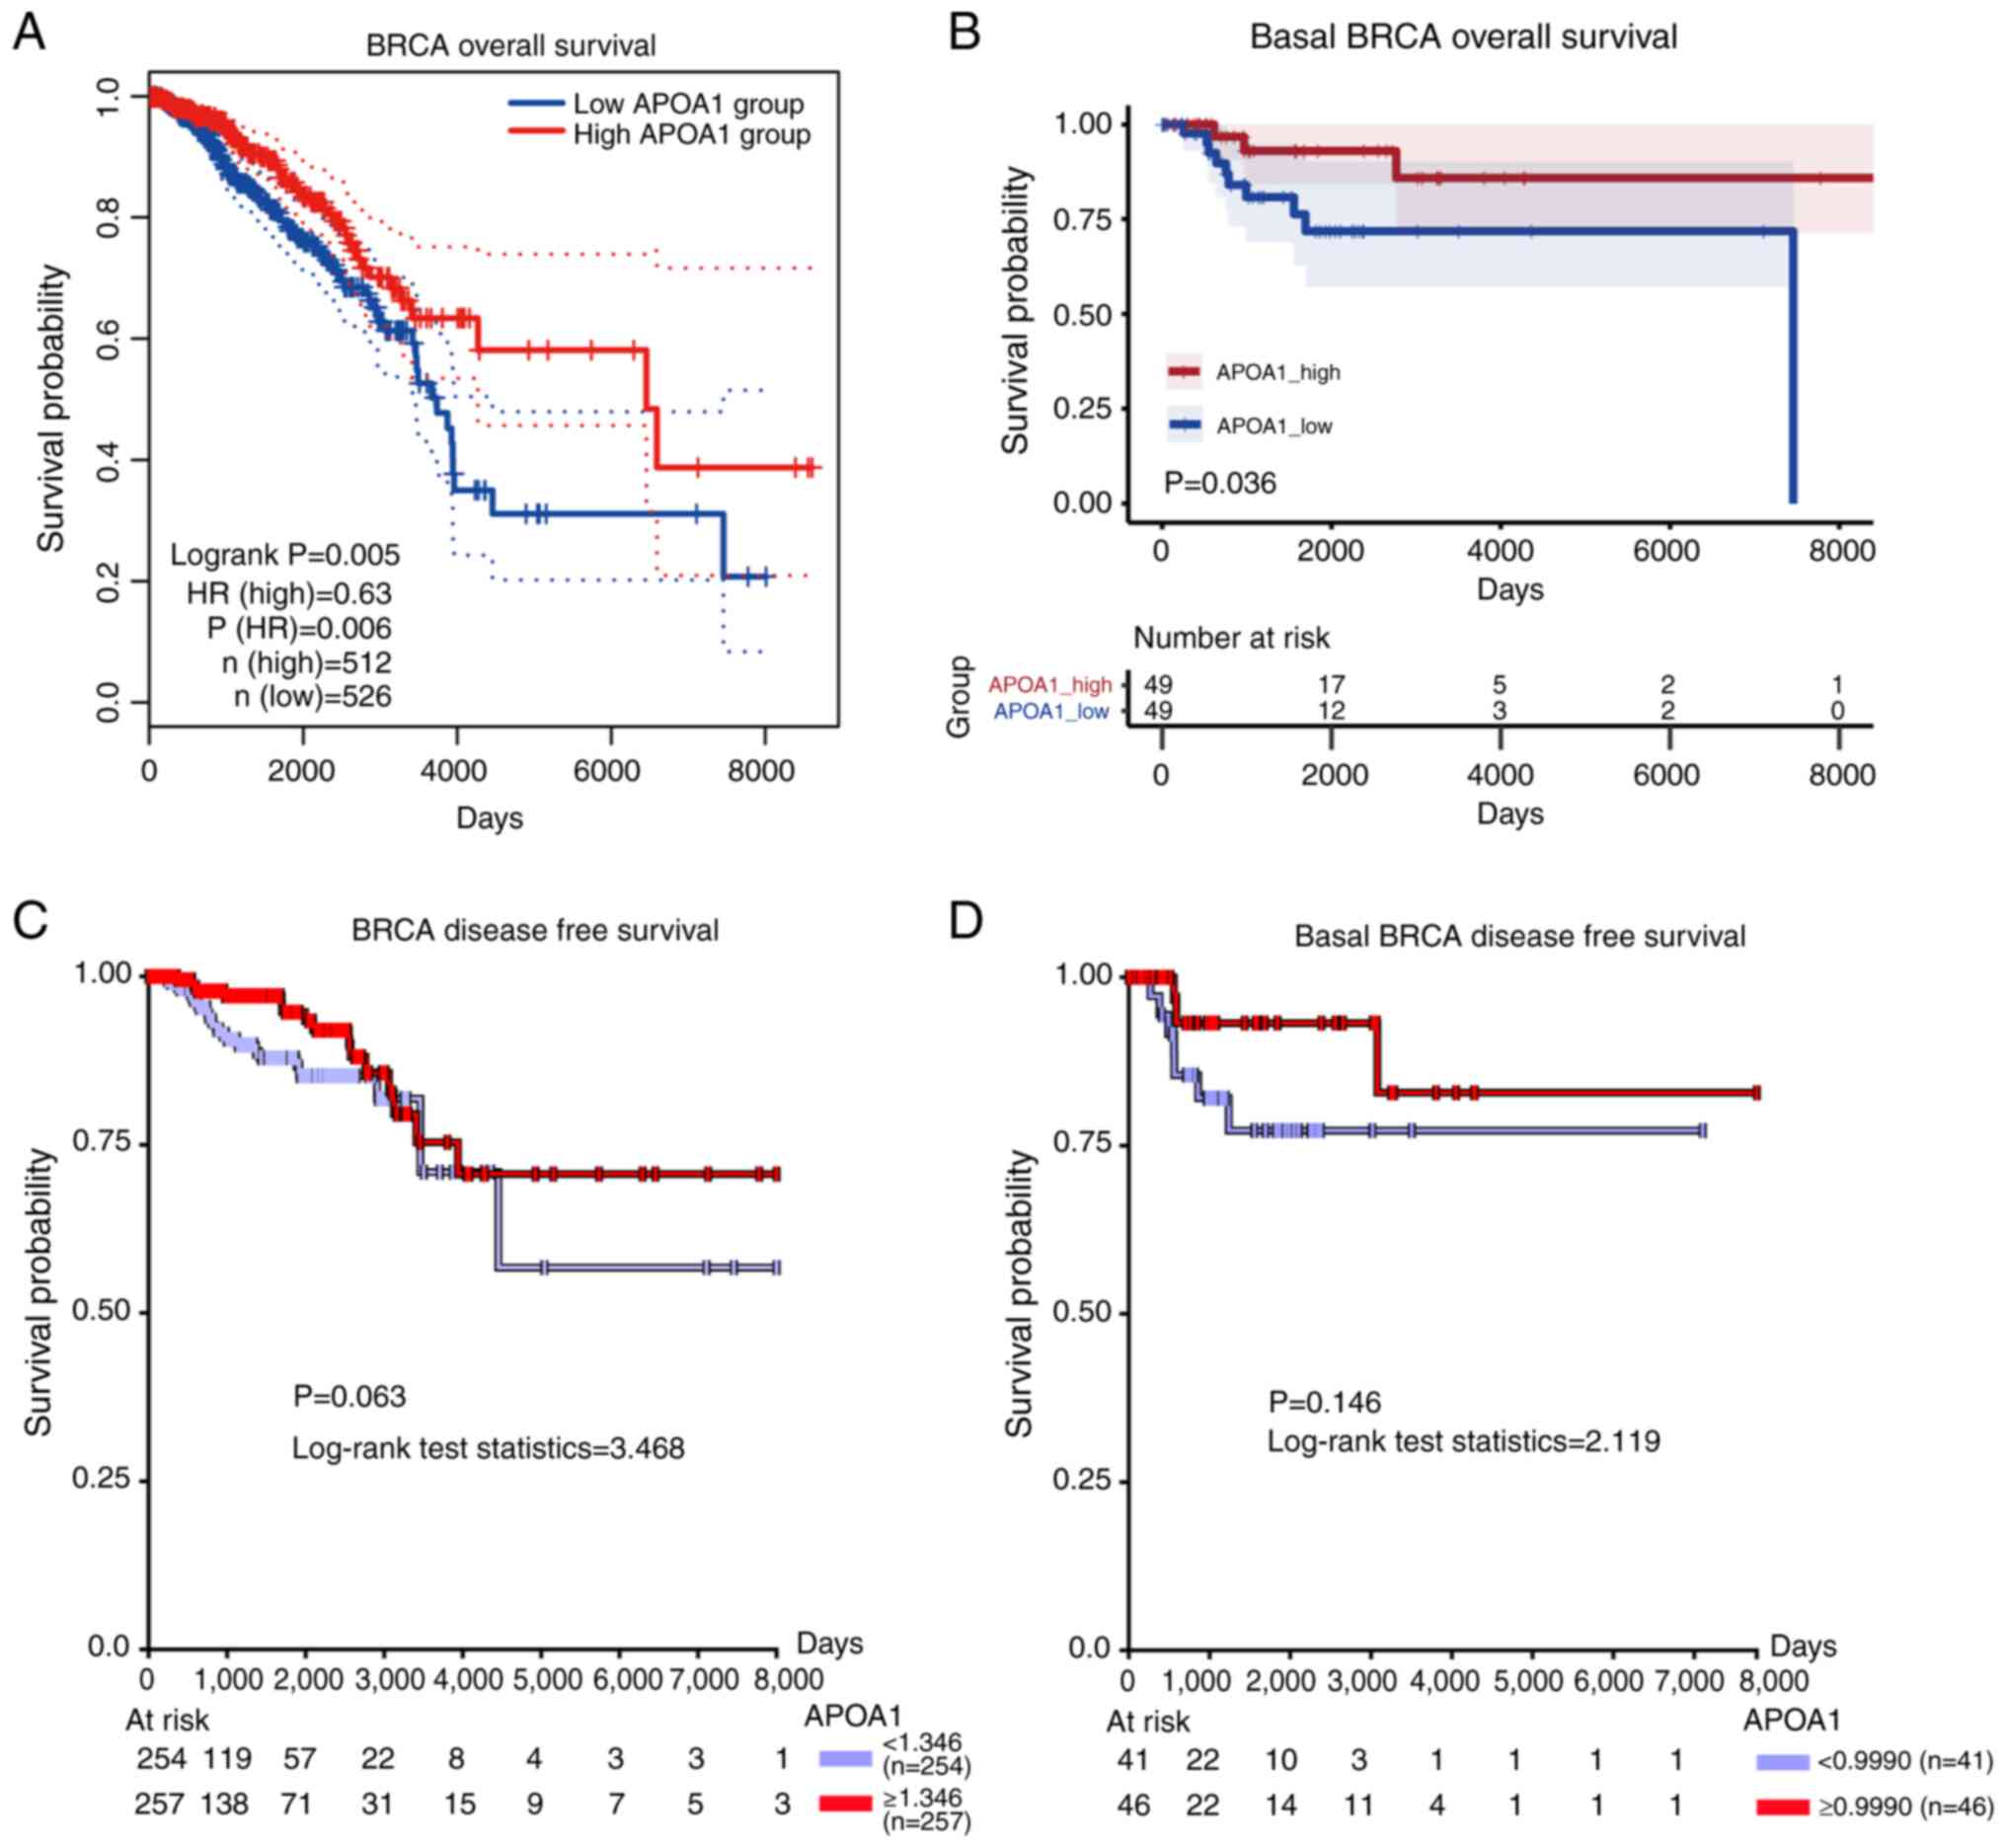
APOA1 is an effective prognostic
factor for breast cancer and patients with BLBC
To further investigate the involvement of APOA1 in
BLBC, the correlation between APOA1 expression and OS and DFS using
TCGA database was examined. The Kaplan Meier survival analysis
showed that the APOA1 down-regulation was associated with poor
prognosis in patients with breast cancer and BLBC (Fig. 2A and B). Meanwhile, the association
between ApoAI expression and DFS in breast cancer patients was
explored. The analysis revealed a trend consistent with the OS
findings, suggesting that higher levels of ApoAI expression may
correlate with improved DFS outcomes (Fig. 2C and D). However, it is important to
note that this trend did not reach statistical significance, likely
due to the limitations posed by sample size and potential
confounding variables.
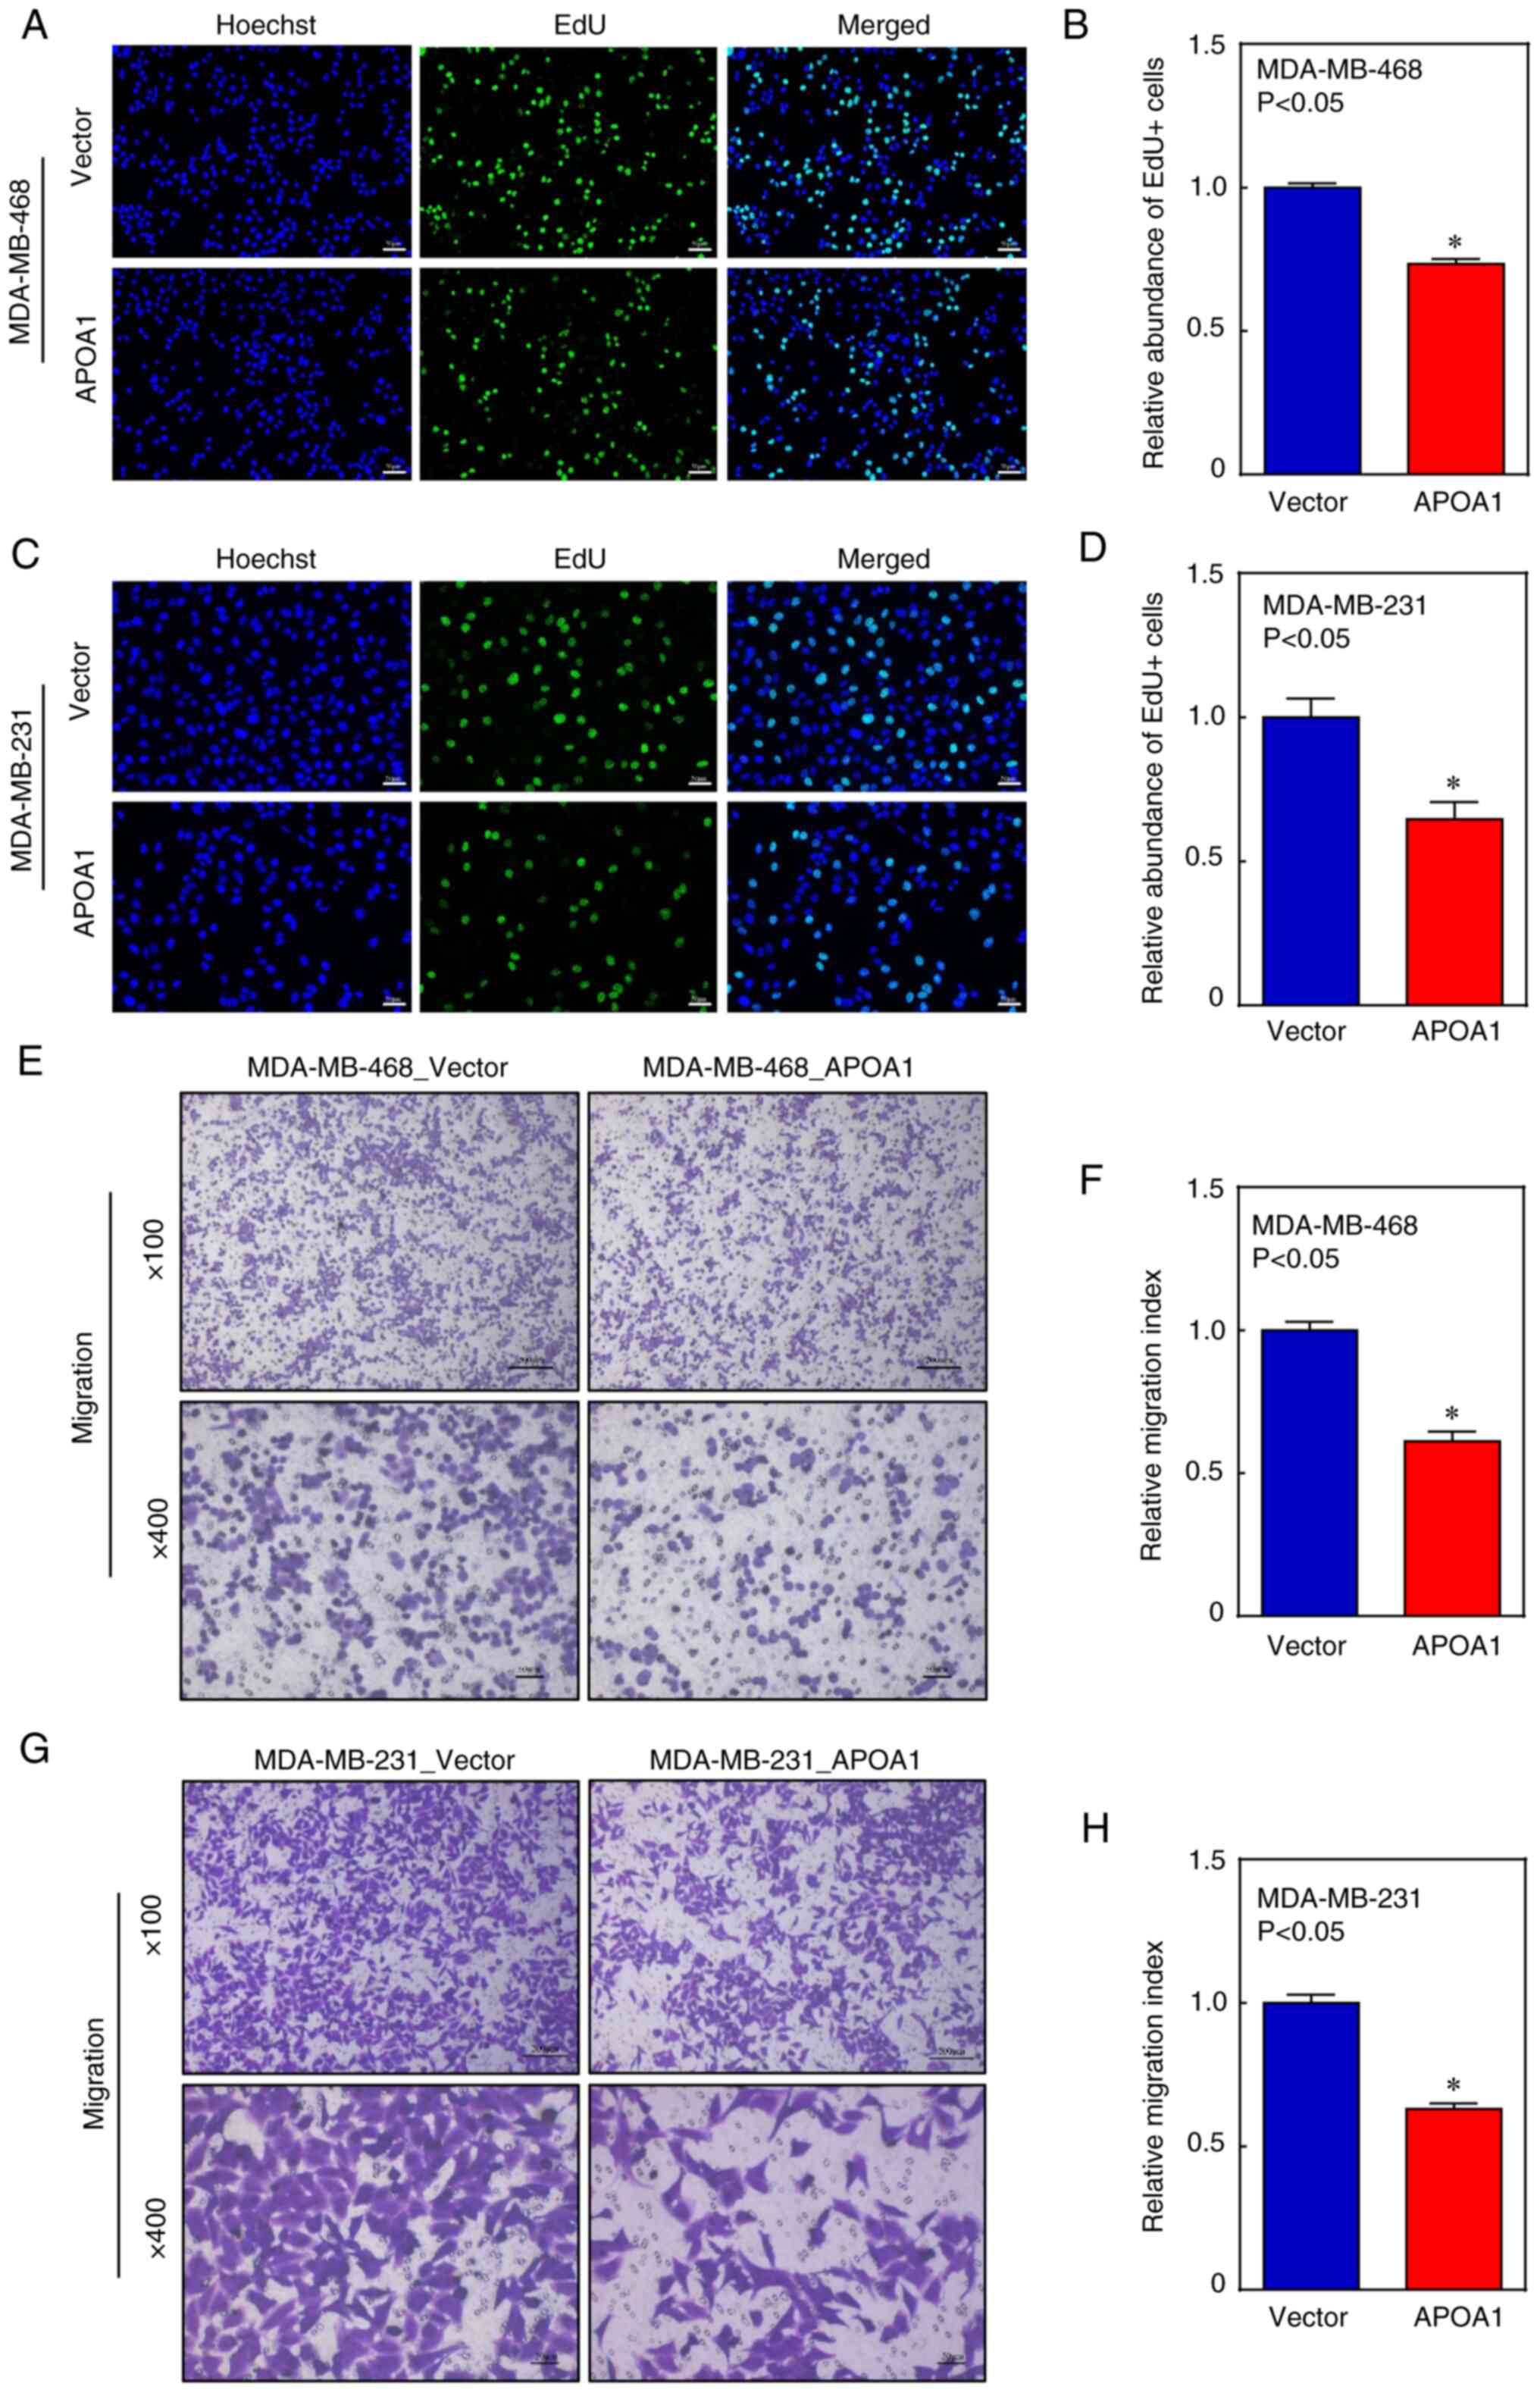
APOA1 inhibits the proliferation and
migration of BLBC cells in vitro
To evaluate whether APOA1 participates in the
development of BLBC, four transfectants, MDA-MB-468 (APOA1),
MDA-MB-468 (Vector), MDA-MB-231 (APOA1), and MDA-MB-231 (Vector),
were constructed and examined by RT-qPCR (Fig. S1). The effect of APOA1 on the
proliferation of BLBC cells was studied in vitro. Results of
the EdU assay showed that APOA1 significantly inhibited DNA
replication within the BLBC cells (Fig.
3A-D). Furthermore, transwell assay confirmed that APOA1
inhibited the migration of BLBC cells (Fig. 3E-H). These results suggested that
APOA1, as a BLBC suppressor gene, may inhibit the proliferation and
migration of BLBC cells in vitro.
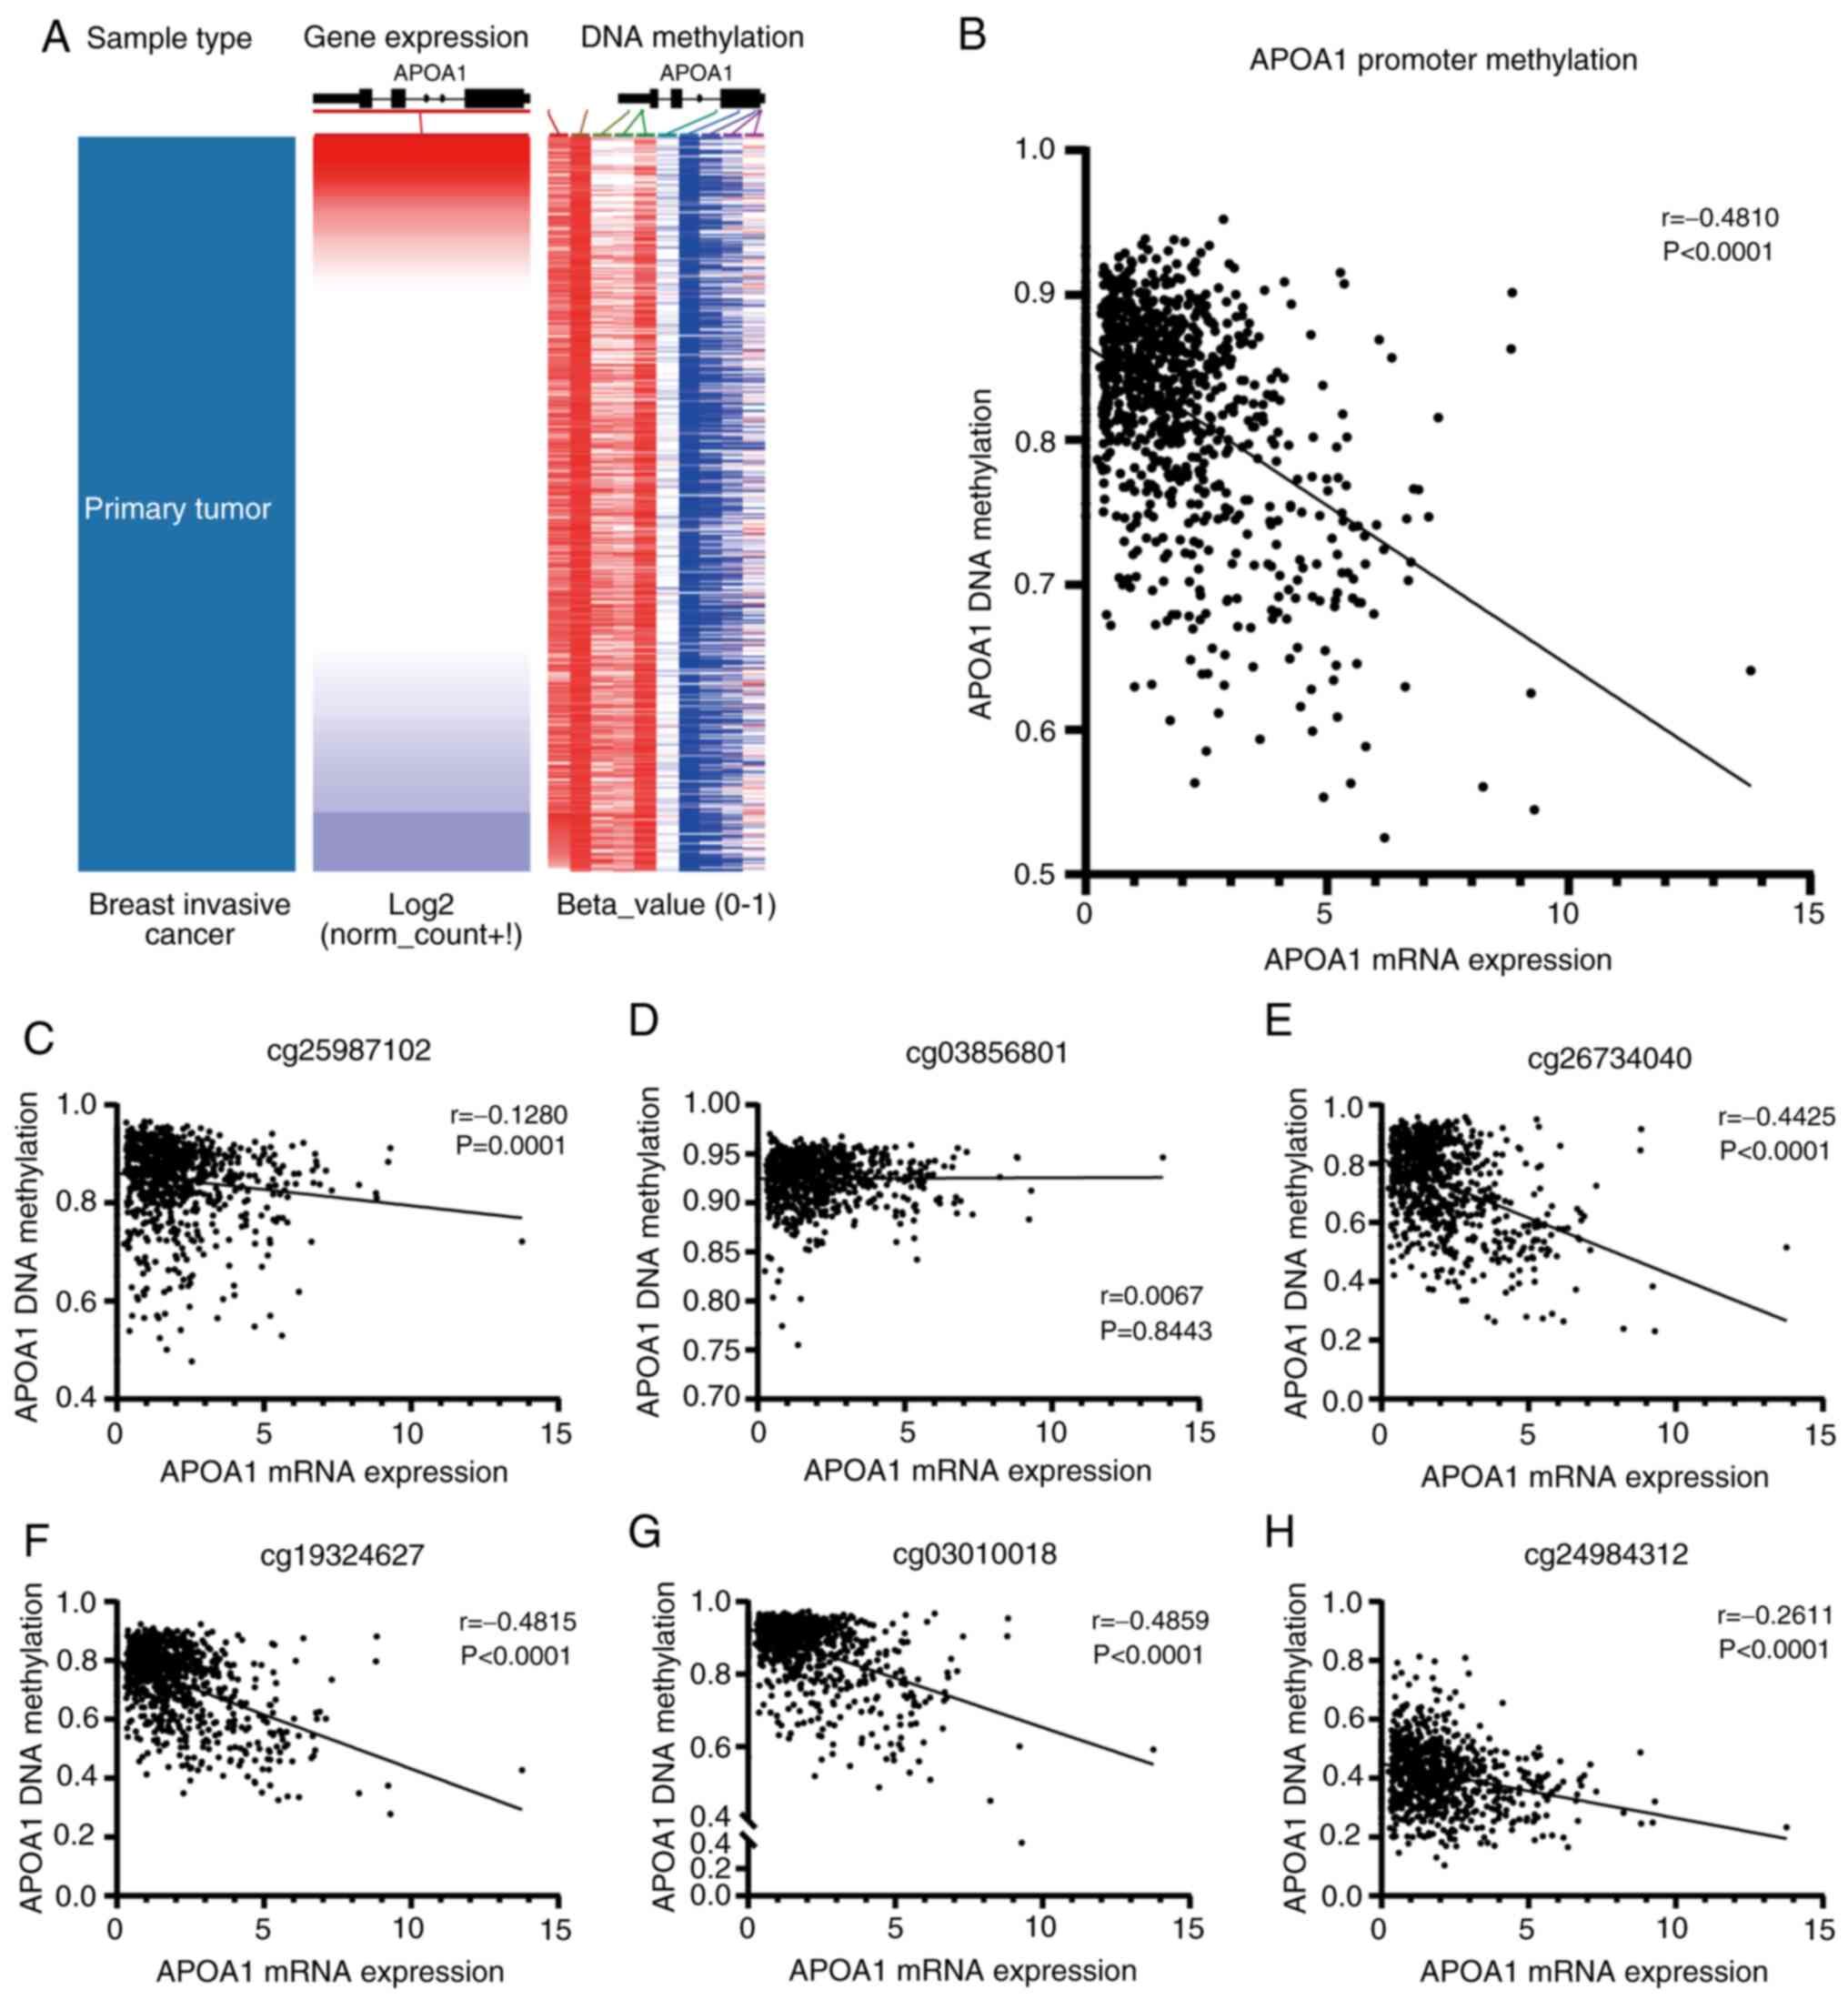
APOA1 mRNA expression level is
negatively correlated with APOA1 methylation level in breast cancer
cells
The UCSC Xena website was used to generate a
comparative heatmap (Fig. 4A). As
depicted in Fig. 4B, the expression
of APOA1 mRNA was significantly down-regulated due to the
methylation of its promoter. Further analysis focused on the
correlation between the methylation of individual CpG sites and
APOA1 expression levels. Specifically, a significant negative
correlation was observed at four out of six methylation levels:
cg26734040, cg19324627, cg03010018 and cg24984312 (Fig. 4C-H showing six CpG sites near the
APOA1 promoter). In contrast, no statistical differences were
observed in the APOA1 expression at the cg03856801 sites. Although,
APOA1 expression at cg25987102 was statistically significant, the
correlation coefficient r was low (r=−0.1280), and considering that
this site was far from the APOA1 gene promoter region, it was not
considered in subsequent analysis.
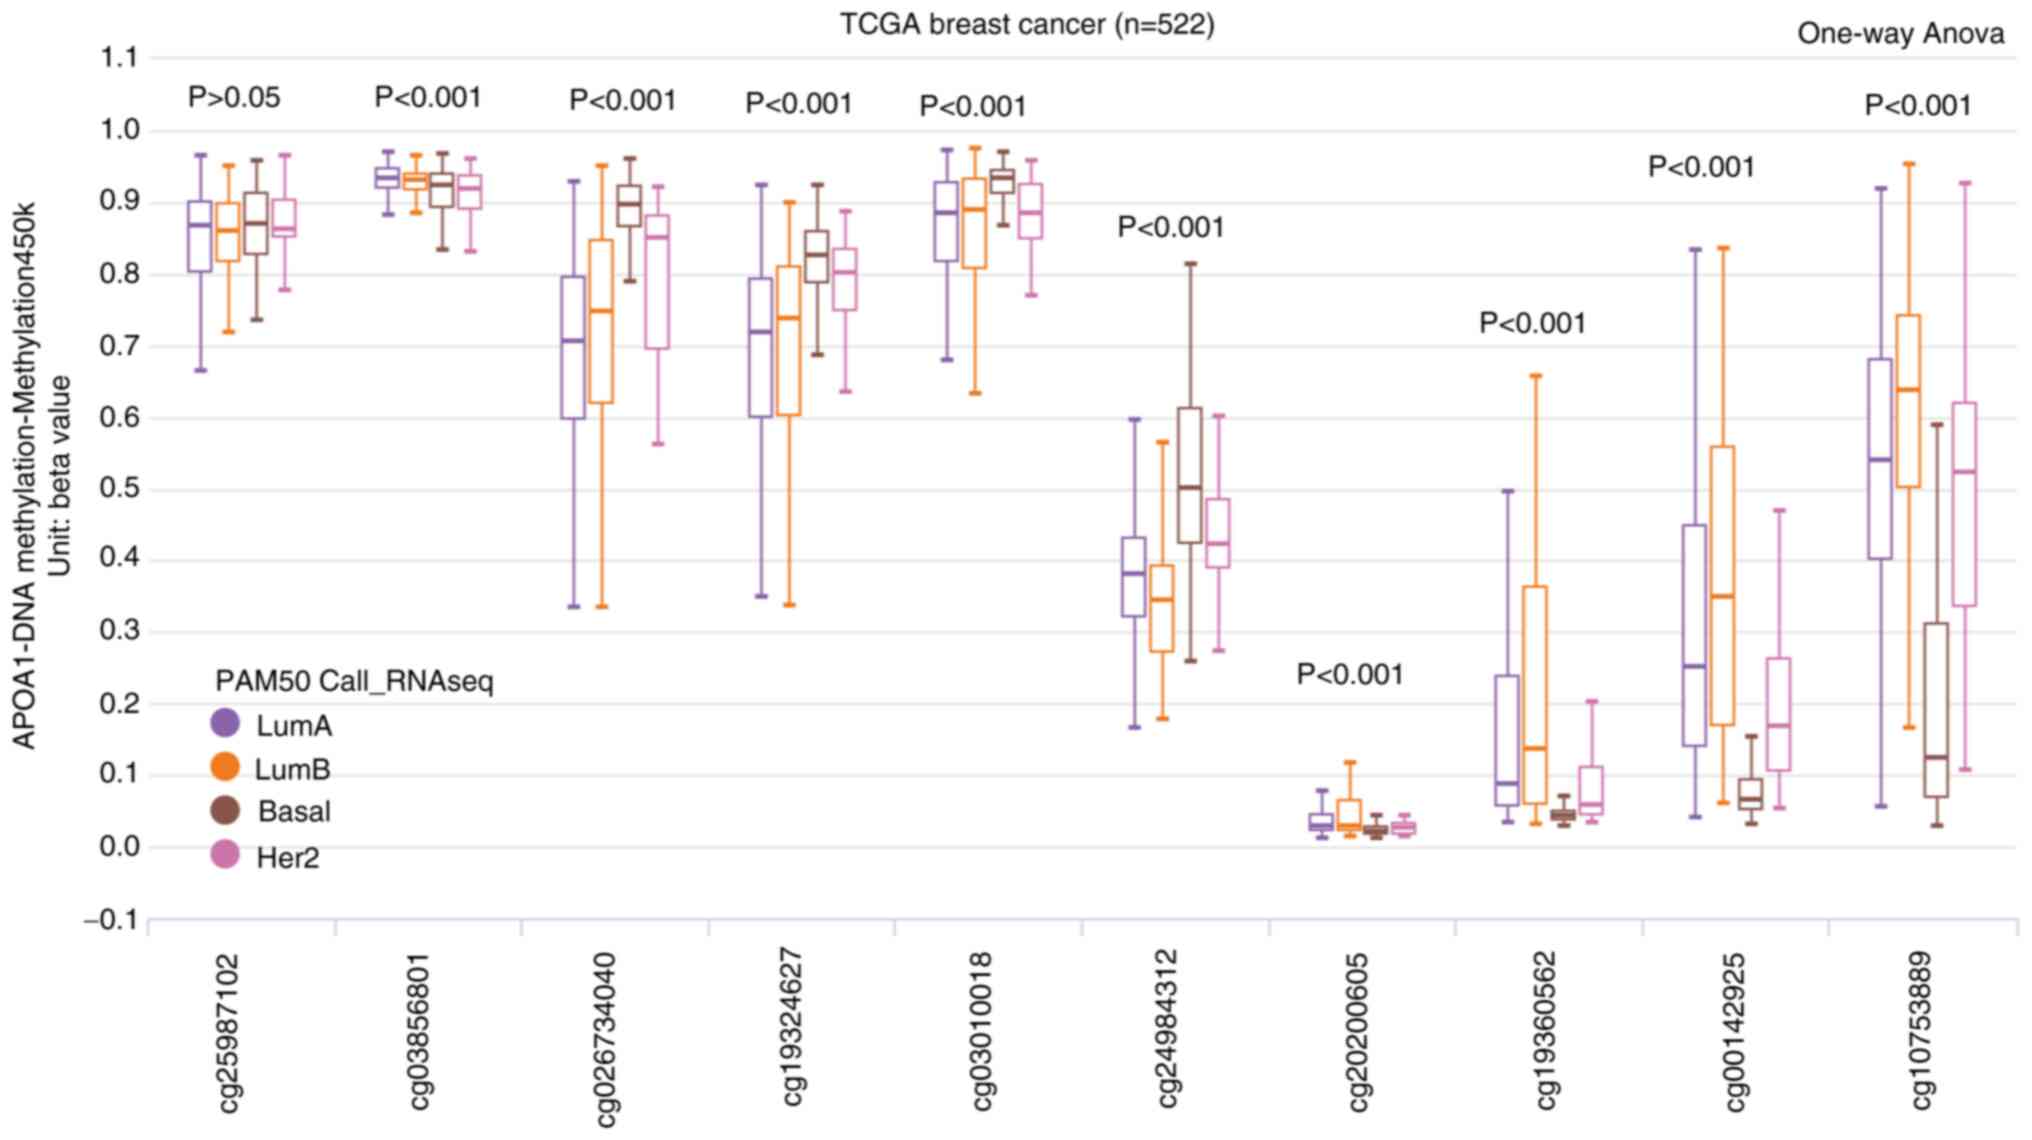
APOA1 methylation level is different
in different subtypes of breast cancer
The distribution map of the APOA1 CpG site also
indicated significant differences in APOA1 methylation levels
between different subtypes of breast cancer, except for the
cg25987102 site. Furthermore, the basal subtype exhibited
significantly higher methylation levels at four CpG sites,
including cg26734040, cg19324627, cg0301018, and cg24984312.
Notably, significantly reduced methylation levels were observed for
cg19360562, cg00142925 and cg10753889 (Fig. 5). These results implied that DNA
methylation may be one of the molecular mechanisms regulating APOA1
expression in BLBC.
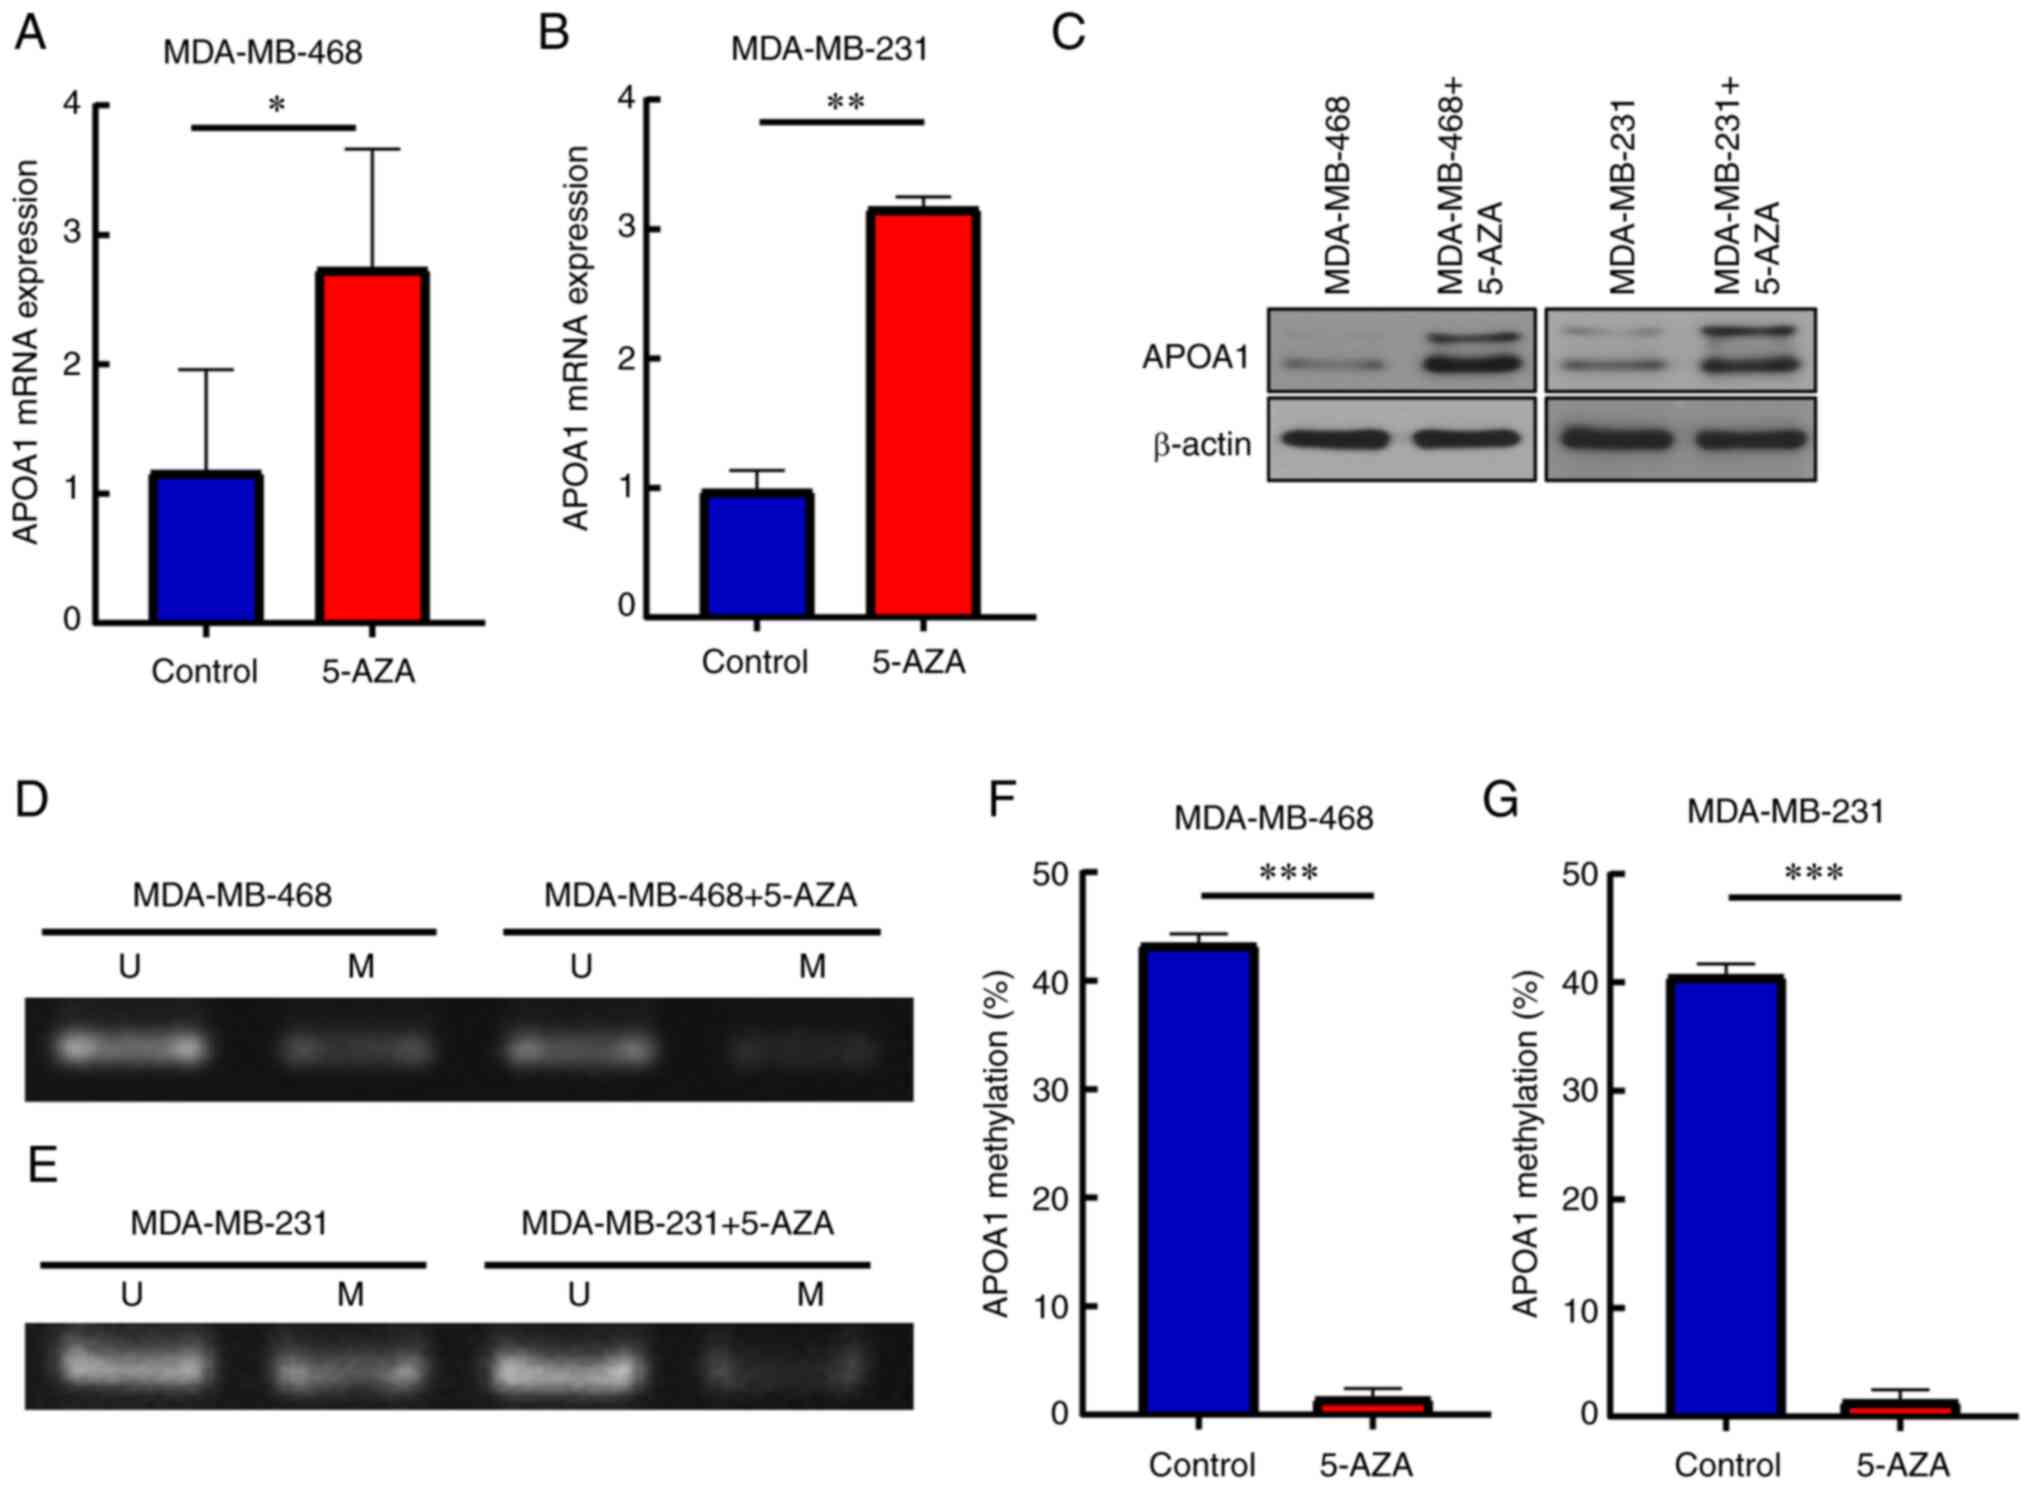
5-AZA reverses APOA1 expression in
BLBC cells
To verify the hypothesis, the effect of 5-AZA on
APOA1 gene expression in the BLBC cell lines MDA-MB-468 and
MDA-MB-231 was investigated. The results demonstrated that the
levels of APOA1 mRNA and protein expressions were elevated in the
presence of 5-AZA (Fig. 6A-C). In
addition, APOA1 gene methylation and subsequent expression in
MDA-MB-468 and MDA-MB-231 cells treated with 5-AZA was examined.
The results showed that the methylation level of APOA1 decreased
significantly after the addition of 5-AZA (Fig. 6D-G). These results indicated that
5-AZA could reduce APOA1 methylation level, thereby promoting APOA1
expression.
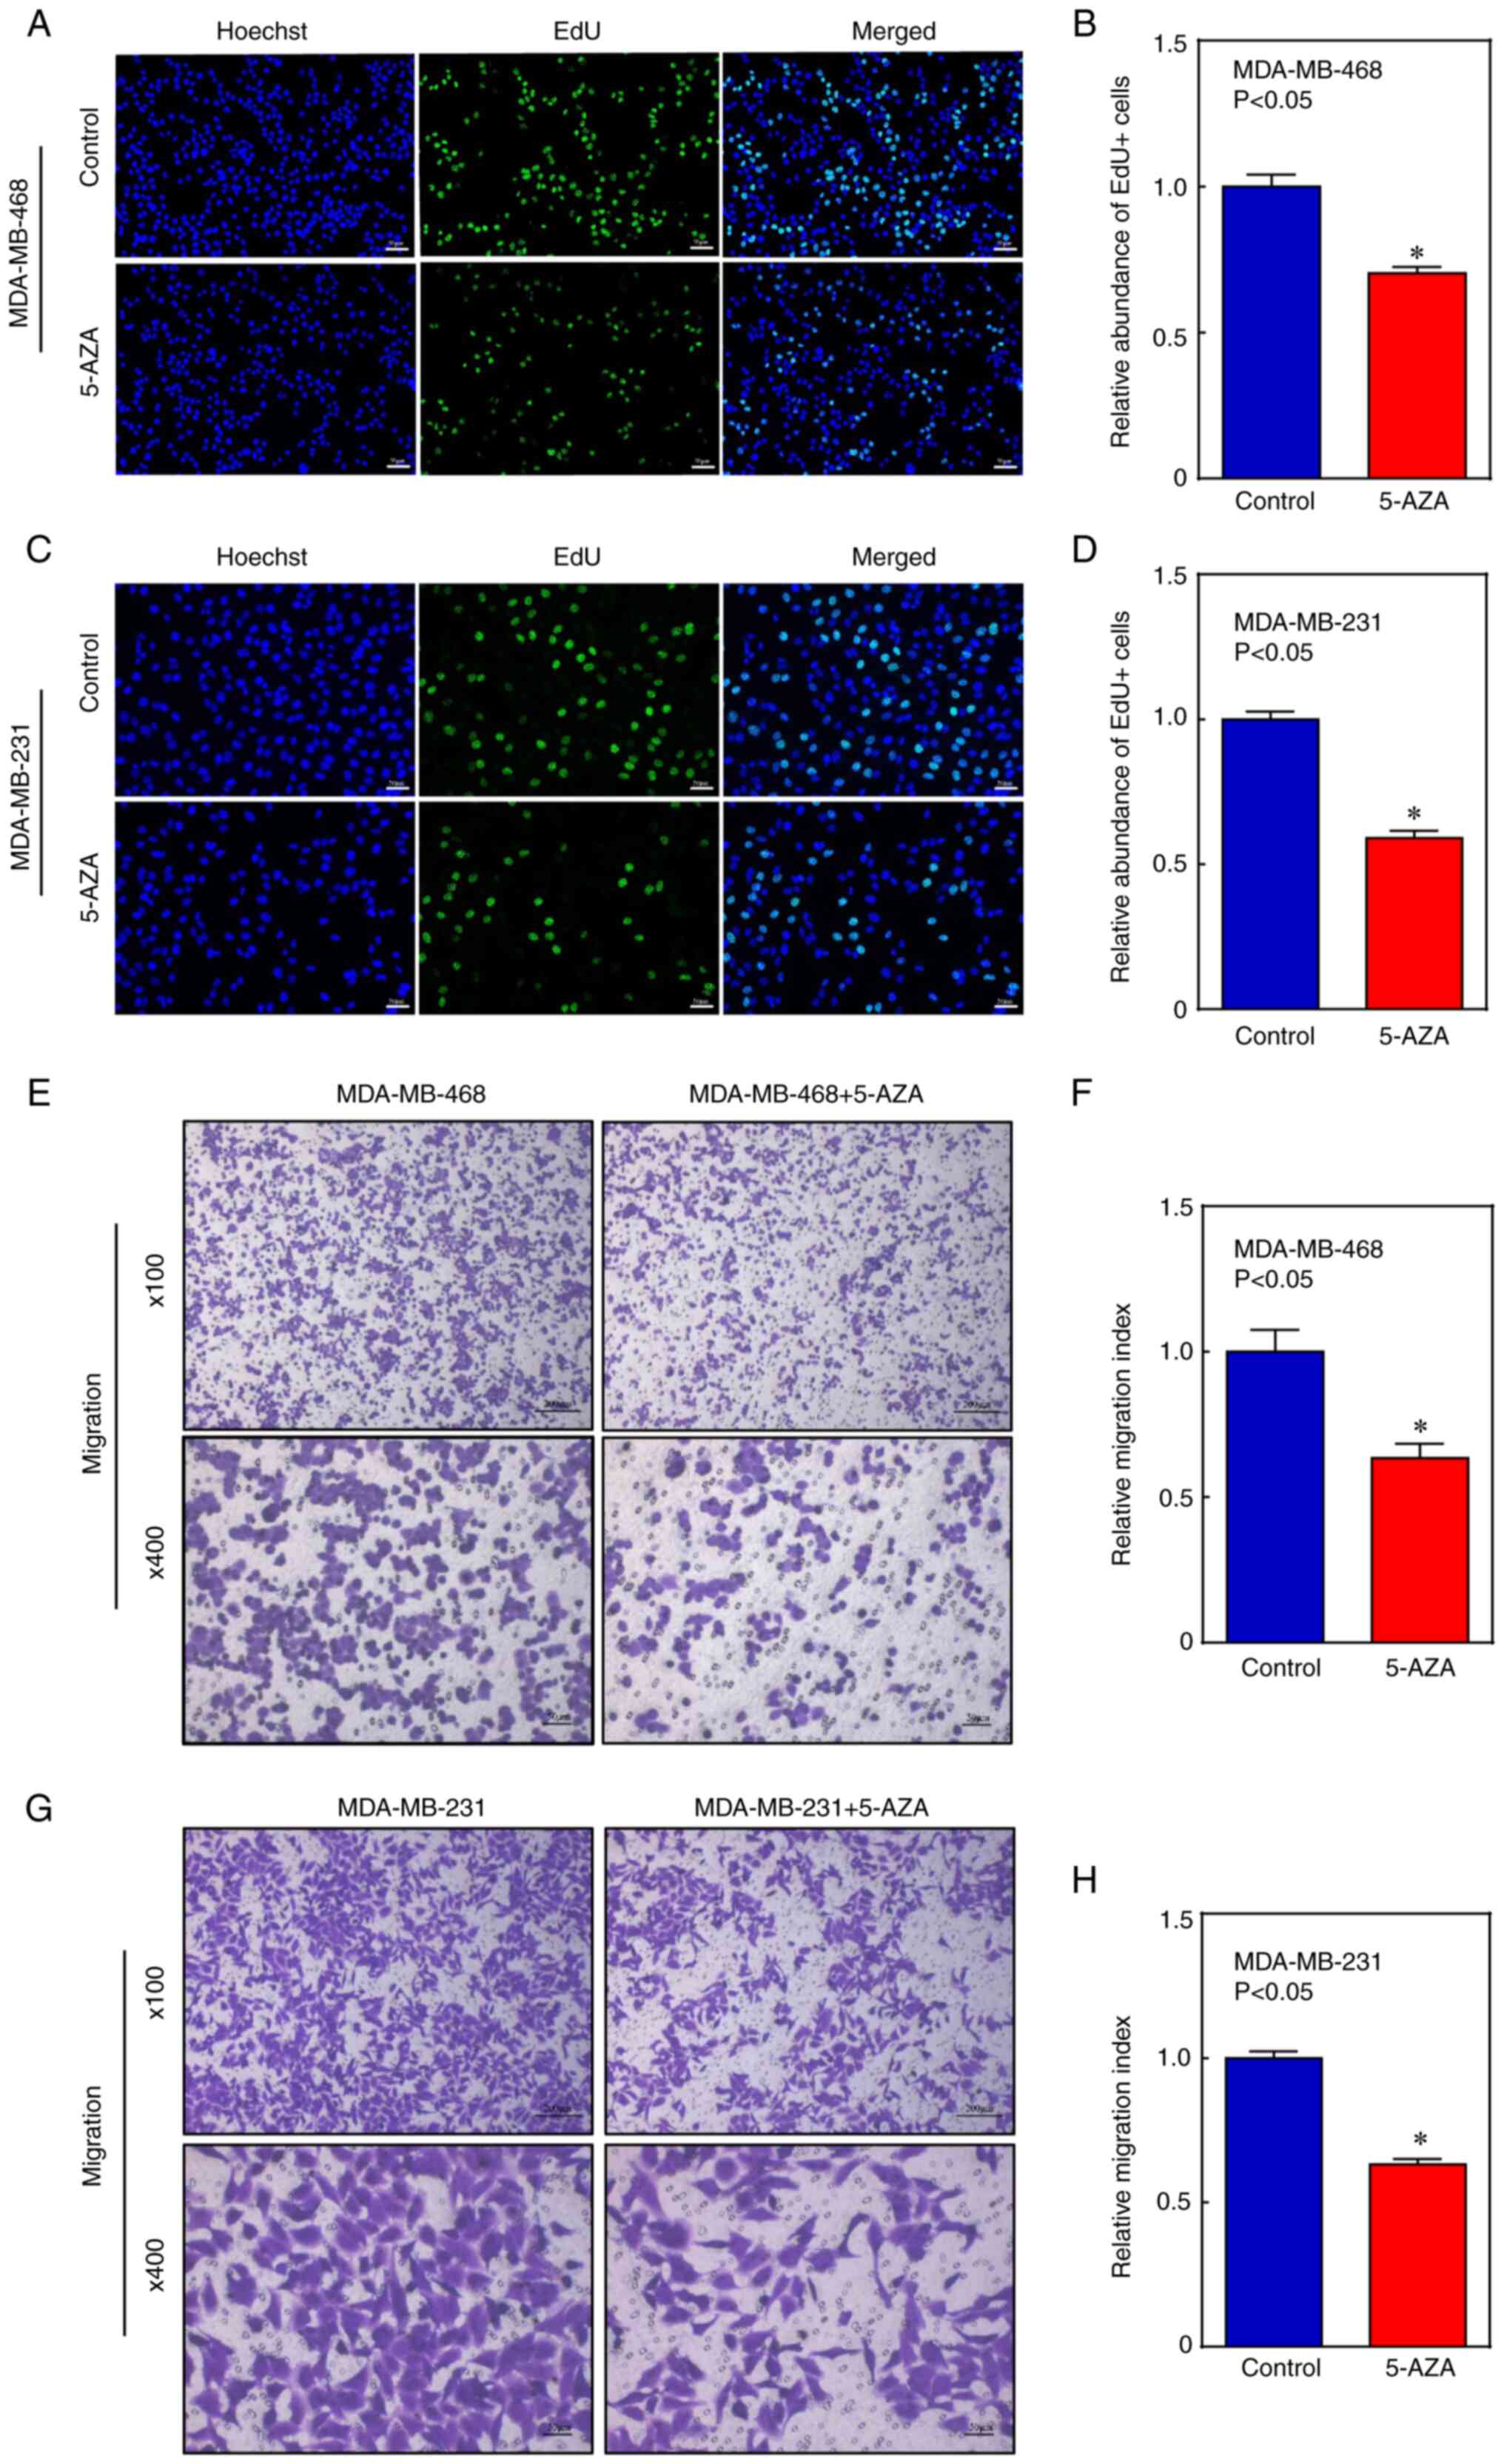
5-AZA inhibits cell proliferation and
migration of BLBC cells
As shown in Fig.
7A-D, EdU+ cells were significantly decreased in 5-AZA-treated
cells. In addition, the transwell assay showed that the migration
ability of these cells was significantly reduced after 5-AZA
treatment (Fig. 7E-H). These
findings suggested that 5-AZA treatment modulated the proliferation
and invasion ability of BLBC cells, which was related to the
induction of APOA1.
Discussion
The global incidence of breast cancer has been
consistently increasing, rendering it a predominant malignancy
among women (18). With a high
early recurrence rate and frequent distant metastasis, BLBC often
manifests as a high-grade invasive ductal carcinoma, compared with
the other subtypes of breast cancer (including luminal A, luminal
B, HER2-enriched), and has a poor prognosis (6). Despite advancements in tumor biology,
the clinical results for patients with BLBC remain unsatisfactory;
therefore, there is an urgent need to develop more effective
therapeutics for its treatment (19). A substantial amount of evidence has
proven that biomarkers and detectable markers are effective for the
prediction and treatment of diseases (20–22).
Hence, the present study investigated the clinical feasibility of
using APOA1 for the prognosis of survival in patients with BLBC.
The present study showed that the expression of APOA1 was not
directly related to traditional tumor staging parameters (T, N, M
stages and pathological stages) and the association of APOA1 levels
with OS suggests that APOA1 may exert its influence on prognosis
through broader mechanisms. Similar observations have been reported
in other studies (23,24). Such broader mechanisms include
affecting the tumor microenvironment, immune response or specific
signaling pathways.
APOA1 is abnormally expressed in various
malignancies. For instance, in renal clear cell carcinoma, poor OS
and DFS are linked to increased APOA1 mRNA levels (25). Reportedly, APOA1 functions as a
tumor suppressor, and its reduced methylation can be considered a
promising prognostic marker in liver cancer (26). In colorectal cancer, decreased serum
levels of APOA1 are linked to higher staging, systemic inflammation
and poor patient prognosis (12,13).
The present study revealed that HER2-enriched and BLBC subtypes
exhibited lower levels of APOA1, suggesting its specific role in
the disease progression. In the present study, the expression level
of APOA1 aligns with the aggressive characteristics and poor
prognosis associated with HER2 and BLBC subtypes. These findings
underscore the importance of further research into APOA1 as an
independent prognostic biomarker and its function in the
subtype-specific pathophysiology of breast cancer. Furthermore, the
present research results also indicated that APOA1 inhibits the
proliferation and migration of MDA-MB-468 and MDA-MB-231 cells
in vitro. Furthermore, the present study demonstrated a lack
of correlation with tumor stage, suggesting the complexity of the
function of APOA1 in BLBC progression, suggesting a multifaceted
role beyond conventional tumor staging markers. It was hypothesized
that APOA1 may exert its influence on tumor cell migration through
intricate intracellular signaling pathways or interactions within
the tumor microenvironment. This provides novel insights into the
nuanced role of APOA1 in BLBC pathology and emphasizes the
importance of further research to elucidate its specific mechanisms
of action and clinical implications. However, the relationship
between APOA1 expression level and tumor size in vivo
requires investigation and these topics will be addressed in future
research.
DNA methylation is a prevalent epigenetic phenomenon
(27,28). In normal conditions, CpG sites can
congregate on CpG islands. The CpG islands in the gene promoter
region are typically unmethylated. However, the level of
methylation may fluctuate as a result of the genetic regulatory
processes underlying diverse pathological disorders (29,30).
According to previous studies, low expression of APOA1 in renal
cell carcinoma may result from increased DNA methylation of the
APOA1 gene (25) and Guo et
al (26) revealed that patients
with liver cancer with high levels of APOA1 DNA methylation had
significantly longer progression-free survival time than those with
low methylation. However, the correlation between DNA methylation
and APOA1 expression level in BLBC has not been reported yet. To
the best of our knowledge, the present study was the first to
report that increased methylation of APOA1 promoter and decreased
methylation of its structural genes affect the expression level of
APOA1. This is consistent with various studies reporting that DNA
methylation near the transcription start site usually inhibits gene
expression. However, the methylation in structural genes has a
reverse impact (31–35).
Demethylating drugs have demonstrated efficacy in
treating hematological malignancies and solid tumors (36,37).
According to previous studies, treatment with azacitidine or
decitabine increased the sensitivity of patients with ovarian
cancer to carboplatin (38–40). Moreover, patients treated with
azacitidine showed an improved response to anti-cancer therapy
against non-small cell lung cancer (41). In BLBC, combined therapy with
6-mercaptopurine and 5-AZA makes the cells more sensitive to
chemotherapeutic drugs; this treatment is suitable before disease
recurrence and can potentially inhibit TNBC cells with high drug
resistance (42). This indicates
that the discovery of new biomarkers for predicting treatment
responses, novel methylation inhibitors and/or combined therapeutic
strategies to target specific processes underlying tumor
development is an important research avenue to achieve the best
therapeutic effect in BLBC.
In conclusion, the present study reported that
downregulated APOA1 expression was associated with a shortened OS
in patients with breast cancer. Furthermore, it was demonstrated
that APOA1 could inhibit the proliferation and migration abilities
of BLBC cells. Notably, DNA methylation could significantly affect
the expression level of APOA1. This evidence supported that APOA1
has a significant role in the proliferation and migration of BLBC
cells and that APOA1 and specific inhibition of its methylation
could be potential targets for the treatment of BLBC, thus
providing a theoretical basis for the targeted therapy of BLBC.
Supplementary Material
Supporting Data
Acknowledgements
Not applicable.
Funding
The present study was supported by the Zhejiang Province
Traditional Chinese Medicine Science and Technology Project (grant
nos. 2023ZL056, 2023ZL409 and 2024ZR015); the Research Project of
Zhejiang Chinese Medical University (grant nos. 2022JKZKTS26,
2022JKJNTZ16, 2022JKJNTZ23, 2022JKJNTZ29 and 2023JKJNTZ10) and
Zhejiang Medical and Health Technology Project (grant nos.
2024KY1225, 2024KY1213, 2024KY1201, 2020KY197 and 2019KY344).
Availability of data and materials
The data generated in the present study may be
requested from the corresponding author.
Authors' contributions
CW, ZZ and SY designed the research study. CW, SC,
RZ and MC performed the research. XY, YH, ZS and QM participated in
the statistical analysis and had input in the experimental design.
CW and SY wrote the main manuscript text. XY, YH, ZS and QM confirm
the authenticity of all the raw data. All authors read and approved
the final version of the manuscript.
Ethics approval and consent to
participate
Not applicable.
Patient consent for publication
Not applicable.
Competing interests
The authors declare that they have no competing
interests.
References
|
1
|
Sung H, Ferlay J, Siegel RL, Laversanne M,
Soerjomataram I, Jemal A and Bray F: Global cancer statistics 2020:
GLOBOCAN estimates of incidence and mortality worldwide for 36
cancers in 185 countries. CA Cancer J Clin. 71:209–249. 2021.
View Article : Google Scholar : PubMed/NCBI
|
|
2
|
Parker JS, Mullins M, Cheang MCU, Leung S,
Voduc D, Vickery T, Davies S, Fauron C, He X, Hu Z, et al:
Supervised risk predictor of breast cancer based on intrinsic
subtypes. J Clin Oncol. 27:1160–1167. 2009. View Article : Google Scholar : PubMed/NCBI
|
|
3
|
Botti G, Cantile M, Collina F, Cerrone M,
Sarno S, Anniciello A and Di Bonito M: Morphological and
pathological features of basal-like breast cancer. Transl Cancer
Res. 8 (Suppl 5):S503–S509. 2019. View Article : Google Scholar : PubMed/NCBI
|
|
4
|
Wang Q, Xu M, Sun Y, Chen J, Chen C, Qian
C, Chen Y, Cao L, Xu Q, Du X and Yang W: Gene Expression profiling
for diagnosis of triple-negative breast cancer: A multicenter,
retrospective cohort study. Front Oncol. 9:3542019. View Article : Google Scholar : PubMed/NCBI
|
|
5
|
Riaz N, Idress R, Habib S and Lalani EN:
Lack of androgen receptor expression selects for basal-like
phenotype and is a predictor of poor clinical outcome in
non-metastatic triple negative breast cancer. Fron Oncol.
10:10832020. View Article : Google Scholar : PubMed/NCBI
|
|
6
|
Dent R, Hanna WM, Trudeau M, Rawlinson E,
Sun P and Narod SA: Pattern of metastatic spread in triple-negative
breast cancer. Breast Cancer Res Treat. 115:423–428. 2009.
View Article : Google Scholar : PubMed/NCBI
|
|
7
|
Cine N, Baykal AT, Sunnetci D, Canturk Z,
Serhatli M and Savli H: Identification of ApoA1, HPX and POTEE
genes by omic analysis in breast cancer. Oncol Rep. 32:1078–1086.
2014. View Article : Google Scholar : PubMed/NCBI
|
|
8
|
Dufresne J, Bowden P, Thavarajah T,
Florentinus-Mefailoski A, Chen ZZ, Tucholska M, Norzin T, Ho MT,
Phan M, Mohamed N, et al: The plasma peptides of breast versus
ovarian cancer. Clin Proteomics. 16:432019. View Article : Google Scholar : PubMed/NCBI
|
|
9
|
Mineo C and Shaul PW: Novel biological
functions of high-density lipoprotein cholesterol. Circ Res.
111:1079–1090. 2012. View Article : Google Scholar : PubMed/NCBI
|
|
10
|
Liu JX, Yuan Q, Min YL, He Y, Xu QH, Li B,
Shi WQ, Lin Q, Li QH, Zhu PW and Shao Y: Apolipoprotein A1 and B as
risk factors for development of intraocular metastasis in patients
with breast cancer. Cancer Manag Res. 11:2881–2888. 2019.
View Article : Google Scholar : PubMed/NCBI
|
|
11
|
Marinho AT, Lu H, Pereira SA, Monteiro E,
Gabra H and Recchi C: Anti-tumorigenic and platinum-sensitizing
effects of apolipoprotein A1 and apolipoprotein A1 Mimetic Peptides
In Ovarian Cancer. Front Pharmacol. 9:15242019. View Article : Google Scholar : PubMed/NCBI
|
|
12
|
Aguirre-Portolés C, Feliu J, Reglero G and
Ramírez de Molina A: ABCA1 overexpression worsens colorectal cancer
prognosis by facilitating tumour growth and caveolin-1-dependent
invasiveness, and these effects can be ameliorated using the BET
inhibitor apabetalone. Mol Oncol. 12:1735–1752. 2018. View Article : Google Scholar : PubMed/NCBI
|
|
13
|
Sirniö P, Väyrynen JP, Klintrup K, Mäkelä
J, Mäkinen MJ, Karttunen TJ and Tuomisto A: Decreased serum
apolipoprotein A1 levels are associated with poor survival and
systemic inflammatory response in colorectal cancer. Sci Rep.
7:53742017. View Article : Google Scholar : PubMed/NCBI
|
|
14
|
Mao M, Wang X, Sheng H, Liu Y, Zhang L,
Dai S and Chi PD: A novel score based on serum apolipoprotein A-1
and C-reactive protein is a prognostic biomarker in hepatocellular
carcinoma patients. BMC Cancer. 18:11782018. View Article : Google Scholar : PubMed/NCBI
|
|
15
|
Gao F, Vasquez SX, Su F, Roberts S, Shah
N, Grijalva V, Imaizumi S, Chattopadhyay A, Ganapathy E, Meriwether
D, et al: L-5F, an apolipoprotein A-I mimetic, inhibits tumor
angiogenesis by suppressing VEGF/basic FGF signaling pathways.
Integr Biol (Camb). 3:479–489. 2011. View Article : Google Scholar : PubMed/NCBI
|
|
16
|
Zamanian-Daryoush M, Lindner D, Tallant
TC, Wang Z, Buffa J, Klipfell E, Parker Y, Hatala D,
Parsons-Wingerter P, Rayman P, et al: The cardioprotective protein
apolipoprotein A1 promotes potent anti-tumorigenic effects. J Biol
Chem. 288:21237–21252. 2013. View Article : Google Scholar : PubMed/NCBI
|
|
17
|
Livak KJ and Schmittgen TD: Analysis of
relative gene expression data using real-time quantitative PCR and
the 2(−Delta Delta C(T)) method. Methods. 25:402–408. 2001.
View Article : Google Scholar : PubMed/NCBI
|
|
18
|
Siegel RL, Miller KD, Fuchs HE and Jemal
A: Cancer statistics, 2021. CA Cancer J Clin. 71:7–33. 2021.
View Article : Google Scholar : PubMed/NCBI
|
|
19
|
Foulkes WD, Smith IE and Reis-Filho JS:
Triple-negative breast cancer. N Engl J Med. 363:1938–1948. 2010.
View Article : Google Scholar : PubMed/NCBI
|
|
20
|
Sun K, Lv H, Chen B, Nie C, Zhao J, Wang
S, Wang J, Xu W and Chen X: Dawning precision treatment for gastric
cancer: The latest biomarkers. J Transl Int Med. 9:228–230. 2021.
View Article : Google Scholar : PubMed/NCBI
|
|
21
|
Karauzum I, Karauzum K, Acar B, Hanci K,
Bildirici HIU, Kilic T and Ural E: Predictive value of
lymphocyte-to-monocyte ratio in patients with contrast-induced
nephropathy after percutaneous coronary intervention for acute
coronary syndrome. J Transl Int Med. 9:123–130. 2021. View Article : Google Scholar : PubMed/NCBI
|
|
22
|
Pan S, Sun S, Liu B and Hou Y: Pan-cancer
landscape of the RUNX protein family reveals their potential as
carcinogenic biomarkers and the mechanisms underlying their action.
J Transl Int Med. 10:156–174. 2022. View Article : Google Scholar : PubMed/NCBI
|
|
23
|
Chen Y, Meng Z, Zhang L and Liu F: CD2 is
a novel immune-related prognostic biomarker of invasive breast
carcinoma that modulates the tumor microenvironment. Front Immunol.
12:6648452021. View Article : Google Scholar : PubMed/NCBI
|
|
24
|
Ha Y, Kim D, Han S, Chon YE, Lee YB, Kim
MN, Lee JH, Park H, Rim KS and Hwang SG: Sarcopenia predicts
prognosis in patients with newly diagnosed hepatocellular
carcinoma, independent of tumor stage and liver function. Cancer
Res Treat. 50:843–851. 2018. View Article : Google Scholar : PubMed/NCBI
|
|
25
|
Zeng W, Xiong G, Hua L, Hu Y, Guo X and
Peng X: APOA1 mRNA and protein in kidney renal clear cell carcinoma
correlate with the disease outcome. Sci Rep. 12:124062022.
View Article : Google Scholar : PubMed/NCBI
|
|
26
|
Guo Y, Huang B, Li R, Li J, Tian S, Peng C
and Dong W: Low APOA-1 expression in hepatocellular carcinoma
patients is associated with DNA methylation and poor overall
survival. Front Genet. 12:7607442021. View Article : Google Scholar : PubMed/NCBI
|
|
27
|
Li E, Bestor TH and Jaenisch R: Targeted
mutation of the DNA methyltransferase gene results in embryonic
lethality. Cell. 69:915–926. 1992. View Article : Google Scholar : PubMed/NCBI
|
|
28
|
Jaenisch R and Bird A: Epigenetic
regulation of gene expression: How the genome integrates intrinsic
and environmental signals. Nat Genet. 33 (Suppl):S245–S254. 2003.
View Article : Google Scholar
|
|
29
|
Greenberg MVC and Bourc'his D: The diverse
roles of DNA methylation in mammalian development and disease. Nat
Rev Mol Cell Biol. 20:590–607. 2019. View Article : Google Scholar : PubMed/NCBI
|
|
30
|
Grosser K and Metzler D: Modeling
methylation dynamics with simultaneous changes in CpG islands. BMC
Bioinformatics. 21:1152020. View Article : Google Scholar : PubMed/NCBI
|
|
31
|
Hellman A and Chess A: Gene body-specific
methylation on the active X chromosome. Science. 315:1141–1143.
2007. View Article : Google Scholar : PubMed/NCBI
|
|
32
|
Ball MP, Li JB, Gao Y, Lee JH, LeProust
EM, Park IH, Xie B, Daley GQ and Church GM: Targeted and
genome-scale strategies reveal gene-body methylation signatures in
human cells. Nat Biotechnol. 27:361–368. 2009. View Article : Google Scholar : PubMed/NCBI
|
|
33
|
Aran D, Toperoff G, Rosenberg M and
Hellman A: Replication timing-related and gene body-specific
methylation of active human genes. Hum Mol Genet. 20:670–680. 2011.
View Article : Google Scholar : PubMed/NCBI
|
|
34
|
Jjingo D, Conley AB, Yi SV, Lunyak VV and
Jordan IK: On the presence and role of human gene-body DNA
methylation. Oncotarget. 3:462–474. 2012. View Article : Google Scholar : PubMed/NCBI
|
|
35
|
Roadmap Epigenomics Consortium, . Kundaje
A, Meuleman W, Ernst J, Bilenky M, Yen A, Heravi-Moussavi A,
Kheradpour P, Zhang Z, Wang J, et al: Integrative analysis of 111
reference human epigenomes. Nature. 518:317–330. 2015. View Article : Google Scholar : PubMed/NCBI
|
|
36
|
Cowan LA, Talwar S and Yang AS: Will DNA
methylation inhibitors work in solid tumors? A review of the
clinical experience with azacitidine and decitabine in solid
tumors. Epigenomics. 2:71–86. 2010. View Article : Google Scholar : PubMed/NCBI
|
|
37
|
Linnekamp JF, Butter R, Spijker R, Medema
JP and van Laarhoven HWM: Clinical and biological effects of
demethylating agents on solid tumours-a systematic review. Cancer
Treat Rev. 54:10–23. 2017. View Article : Google Scholar : PubMed/NCBI
|
|
38
|
Fu S, Hu W, Iyer R, Kavanagh JJ, Coleman
RL, Levenback CF, Sood AK, Wolf JK, Gershenson DM, Markman M, et
al: Phase 1b-2a study to reverse platinum resistance through use of
a hypomethylating agent, azacitidine, in patients with
platinum-resistant or platinum-refractory epithelial ovarian
cancer. Cancer. 117:1661–1669. 2011. View Article : Google Scholar : PubMed/NCBI
|
|
39
|
Matei D, Fang F, Shen C, Schilder J,
Arnold A, Zeng Y, Berry WA, Huang T and Nephew KP: Epigenetic
resensitization to platinum in ovarian cancer. Cancer Res.
72:2197–2205. 2012. View Article : Google Scholar : PubMed/NCBI
|
|
40
|
Fang F, Balch C, Schilder J, Breen T,
Zhang S, Shen C, Li L, Kulesavage C, Snyder AJ, Nephew KP and Matei
DE: A phase 1 and pharmacodynamic study of decitabine in
combination with carboplatin in patients with recurrent,
platinum-resistant, epithelial ovarian cancer. Cancer.
116:4043–4053. 2010. View Article : Google Scholar : PubMed/NCBI
|
|
41
|
Juergens RA, Wrangle J, Vendetti FP,
Murphy SC, Zhao M, Coleman B, Sebree R, Rodgers K, Hooker CM,
Franco N, et al: Combination epigenetic therapy has efficacy in
patients with refractory advanced non-small cell lung cancer.
Cancer Discov. 1:598–607. 2011. View Article : Google Scholar : PubMed/NCBI
|
|
42
|
Singh B, Sarli VN and Lucci A: Inhibition
of resistant triple-negative breast cancer cells with low-dose
6-mercaptopurine and 5-azacitidine. Oncotarget. 12:626–637. 2021.
View Article : Google Scholar : PubMed/NCBI
|