Introduction
Intrahepatic cholangiocarcinoma (ICC), the second
most common primary hepatobiliary cancer, is among the most
aggressive malignancies, with a 5-year survival rate of ~5%
(1). Largely attributable to the
absence of pathognomonic symptoms during early tumorigenesis and
the suboptimal performance of conventional surveillance strategies
in high-risk populations, patients who are diagnosed with liver
cancer frequently present at advanced stages of the disease, which
typically makes curative liver resection unfeasible (2). Additionally, patients diagnosed with
ICC often experience minimal benefits from chemotherapy treatment,
a phenomenon driven by intrinsic chemoresistance mechanisms and the
tumor's desmoplastic stroma that impedes drug penetration (3,4).
Therapeutic approaches, including targeted therapy or
immunotherapy, have shown promise and are currently being assessed
in clinical trials (5). Therefore,
further exploration of effective treatments is essential to extend
the survival of patients with ICC.
The tumor microenvironment (TME) is characterized by
complex interactions between different cell types, particularly
tumor cells and immune cells, such as tumor-associated macrophages
and cancer-associated fibroblasts (6). The interactions between various cell
types within the TME are associated with tumor progression and are
also a promising therapeutic target (6). The TME is crucial for use in assessing
the prognosis of patients with ICC and the malignancy of tumors,
with stromal density, immune cell spatial distribution and
angiogenic patterning providing actionable insights into metastatic
potential and therapeutic resistance (7). Single-cell RNA sequencing (scRNA-seq)
has provided valuable insights into the nature of the TME by
assessing the gene expression levels and immune cell types present
in this environmen (7). However,
while a number of studies have reported scRNA-seq data of ICC cells
(1,8), there is still a need for further
studies on patients with ICC to understand the complexities of the
TME and how it influences this disease.
The human secreted phosphoprotein (SPP1) gene, also
known as osteopontin, encodes a protein with a function similar to
cytokines. The highly acidic nature of this protein serves a
crucial role in regulating the turnover of the extracellular matrix
(ECM). This regulatory capacity is further modulated through
post-translational modifications including N-linked/O-linked
glycosylation and transglutamination-induced polymerization. These
biochemical alterations exhibit context-dependent functionality:
While glycosylation may obscure specific interaction domains,
transglutamination conversely enhances SPP1's structural stability
and ligand-binding specificity. Such plasticity allows spp1 to
differentially execute its cytokine-like functions across various
cellular microenvironments and tissue matrices (9–11). A
recent study reported that SPP1 expression could determine the
different subtypes of the TME. Single-cell transcriptomic analyses
in ICC reveal two molecularly distinct TME subtypes: The
S100P+SPP1-subtype (iCCAphl) and the S100P-SPP1+ subtype (iCCApps).
These subtypes correlate with divergent clinical outcomes, where
the S100P+SPP1-subtype is associated with improved survival
compared to SPP1+ counterparts (12). Furthermore, SPP1 orchestrates tumor
microenvironment reprogramming involving SPP1-mediated crosstalk
between tumor cells and stromal components, driving
immunosuppression, metabolic reprogramming and ECM reorganization
to promote tumor invasion and immune evasion (13). CD44 is a widely expressed cell
surface glycoprotein that serves as a receptor for hyaluronic acid
and other ECM components. It is highly expressed in various cancer
cells and is involved in cell adhesion, migration and
proliferation. Its expression pattern is often associated with
tumor aggressiveness and poor prognosis (14). SPP1 acts as a ligand for CD44
(15) and it has been previously
reported that SPP1 interacts with CD44 to modulate cell signaling
and the activation of neoplastic cells, resulting in tumor
metastasis and progression (16).
Additionally, the interactions between SPP1 and CD44 promote stem
cell features in the glioma perivascular niche (17) and SPP1 suppresses T-cell activation
(18). Therefore, SPP1 may have
multiple key functions in tumor progression and the TME. However,
the mechanisms of action by which SPP1 modulates the TME phenotype
of ICC have remained largely elusive.
The present study provided a comprehensive analysis
of the complexity of the TME and transcriptomic features of ICC by
analyzing the scRNA-seq of clinical surgical samples and online
datasets. The cell types and interactions between lymphocytes and
other immune cells were identified. Further analysis demonstrated
that the cell types, gene expression levels and interactions of
immune cells were markedly different in patients with early-stage
ICC compared with patients with late-stage ICC. Furthermore, the
present study established a CD4+ T cell/SPP1-CD44 axis,
which may serve as a direct link to regulate the development of
ICC.
Materials and methods
Data preparation
In the present study, clinical datasets were
utilized to evaluate the scRNA-seq results obtained from The
National Center for Biotechnology Information Gene Expression
Omnibus (GEO; https://www.ncbi.nlm.nih.gov/geo/; GSE138709)
(1). Samples in this dataset
(GSE138709) had been collected from 5 patients with ICC, including
3 male patients and 2 female patients. The original databases did
not include the age for all patients; therefore, the present study
is unable to provide an overall age range or median age for the
patient cohort.
Sequencing and raw data
processing
All sequencing reads were aligned to the human
genome (reference no. GRCh38) using Cell Ranger software (version
3.0.2; 10× Genomics). Subsequently, the refined feature barcode
matrix was utilized as the basis for data analysis.
scRNA data analysis
The Seurat package (version 5.0.2; http://satijalab.org/seurat/articles/install.html) was
used for processing and analyzing the scRNA-seq data in R language
(version 4.3.1, 2023-06-16). The individual libraries were
transformed into Seurat objects. The data were filtered to focus on
genes expressed across ≥10 cells and each cell exhibited gene
expression levels within the range of 500–20,000 genes, with
mitochondrial transcripts accounting for <15% of the total. The
cutoffs were set after performing a quality control evaluation of
each library. Subsequently, the data underwent logarithmic
transformation for normalization and variable genes were identified
through an in-depth mean and variance analysis. The genes were
scaled and principal components were derived. To determine the most
informative principal components, an elbow plot was used and the
leading components were applied for dimensionality reduction using
the Uniform Manifold Approximation and Projection (UMAP)
dimensionality algorithm (19).
The main cell populations present in both the
stromal tissue and immune compartments were identified by analyzing
the average expression levels of particular gene markers in each
cluster: i) Malignant, epithelial cell adhesion molecule; ii) B
cells, B cell scaffold protein with ankyrin repeats 1 and CD79A;
iii) CD4 cells, CD3D and CD4; iv) CD8 cells, CD3E and CD8A; v)
macrophages, CD14 and apolipoprotein E; vi) myeloid cells, SP100A9
and lysozyme (LYZ); vii) dendritic cells (DCs), CD1C and C-type
lectin domain containing 9A (CLEC9A); viii) natural killer (NK)
cells, neural cell adhesion molecule 1 and NK cell granule protein
7; ix) hepatocytes, apolipoprotein C1 and fatty acid binding
protein 1; and x) fibroblasts, decorin and actin α2, smooth muscle.
Initially, the dataset was filtered to include only these specific
cells. There were only 568 cholangiocytes in the original
literature, resulting in cholangiocyte-specific markers showing
limited representation in our results (GSE138709) (1). Following the initial filtering,
analysis was performed to identify subpopulations of T cells and
myeloid cells, as previously described (19).
For each patient, the subpopulations of T cells and
myeloid cells were examined by isolating the corresponding subset
based on patient identity and processing the raw data according to
the aforementioned methodology. Patient data with <100 cells in
either the myeloid or T-cell categories for the individual patient
analysis were excluded (19). The
marker identification function within the Seurat package was used
to identify the signature genes associated with each cluster
(19).
The visualizations, including UMAPs, heat maps,
violin plots and box plots, displayed gene expression levels that
were normalized using the Scran method (version 1.10.2; http://bioconductor.org/packages/release/bioc/vignettes/scran/inst/doc/scran.html)
(20). The calculated expression
values were derived from the raw expression data.
Correction of batch effect
To analyze the myeloid and T-cell populations that
exhibited clustering specific to individual patients, the Harmony
algorithm (version 1.2.3; http://github.com/immunogenomics/harmony) was used to
mitigate the influence of patient-related variations, also known as
batch effects (19). A
cross-verification of the analysis outcomes for the clusters and
their associated markers with those from a single-library cluster
was conducted to ensure that the Harmony algorithm focused solely
on technical variations, without accounting for biological factors
(21).
InferCNV analysis
The inferCNV software (Bioconductor; version 3.10;
http://bioconductor.riken.jp/packages/3.10/bioc/html/infercnv.html)
was used to estimate the initial copy number variants (CNVs)
(22). CNVs for each region were
calculated based on cellular expression levels, using a cutoff
value of 0.1 to refine the data. All cells, with the exception of
epithelial cells, were categorized as healthy cells. Subsequently,
a denoising procedure was used to generate refined CNV profiles.
The diffusion pseudotime analysis was performed using Monocle3
software (Bioconductor; version 3.10; http://bioconductor.jp/packages/3.10/bioc/html/monocle.html)
on an anndata object that had been processed with Harmony
correction and the results were converted into a Seurat-compatible
format (23).
Subpopulation delineation
The established clusters of immune cell
subpopulations, specifically myeloid and T cells, were labeled
based on the average expression levels of the subsequent genetic
indicators: i) Macrophages, CD14 and apolipoprotein E; ii) myeloid
cells, SP100A9 and LYZ; iii) DCs, CD1C and CLEC9A; iv) CD8 cells,
CD8A and CD8B; v) CD4 cells, forkhead box (FOXP3, FOXP6 and CD4;
and vi) proliferative cells, marker of proliferation Ki-67.
Gene set enrichment analysis
(GSEA)
The fgsea package (version 1.26.0; http://bioconductor.org/fgsea.html) was employed
to perform a comprehensive analysis of gene set enrichment based on
the outcomes derived from analysis of differential gene expression
patterns, following the approach as previously described (24). The msigdbr package was used to
retrieve the hallmark gene sets from the extensive Molecular
Signatures Database collection (version 7.5.1; http://cran.r-project.org/msigdbr) (19,25).
Single-cell regulatory network
inference and clustering (SCENIC) pathway evaluation
SCENIC pathway analysis was performed using the
motifs database associated with RcisTarget (version 1.20.0;
http://www.bioconductor.org/RcisTarget.html) in
conjunction with the GRNboost algorithm (SCENIC; version 1.3.1)
(26,27). The RcisTarget package was utilized
to identify binding sequences for transcription factors within the
provided gene list (26). The
AUCell package (version 1.22.0; http://bioconductor.org/AUCell.html) was utilized to
assess the activity levels of each regulon group across individual
cells (26).
Data analysis online
Survival of patients with ICC was assessed utilizing
the Cancer Genome Atlas dataset through the Gene Expression
Profiling Interactive Analysis (GEPIA2) database (http://gepia2.cancer-pku.cn/). The KM-plotter website
(https://kmplot.com/analysis/) is the
most sophisticated online survival analysis tool, performing all
calculations in real time. It contains the gene expression
information and clinical case data of 364 patients with liver
cancer. The best cutoff value of gene expression was automatically
set. The details of this dataset were mentioned by Menyhárt
(28). For the Kaplan-Meier
survival curves, the follow-up time of patients was ≤5 years, and
the log-rank test was performed to observe the statistical
difference.
The Metabolic gEne RApid Visualizer (MERAV) website
(http://merav.wi.mit.edu/) is designed to analyze
human gene expression across a large variety of arrays (4,454
arrays). It contains the gene expression of 7 normal liver tissues
and 14 liver primary cancer tissues. The differential expression
analysis of SPP1 was conducted directly online.
Experimental model
A total of 2 patients with ICC were thoroughly
evaluated to confirm their eligibility (aged >18 years, had no
contraindications for surgery or infectious diseases) based on
established medical criteria and provided written informed consent
prior to participation, ensuring the patients were fully aware of
the study's purpose, procedures and potential risks. At last, a
52-year-old female patient and a 63-year-old male patient with ICC
from The University of Hong Kong Shenzhen Hospital were enrolled.
Detailed information of the patients is presented in Table SI.
Reverse transcription-quantitative PCR
(RT-qPCR)
Total RNA was isolated from paraffin-embedded tumor
tissues through a dewaxing process, followed by the utilization of
TransZol reagent (TransGen Biotech Co., Ltd.), according to the
manufacturer's protocol. A total of 1 µg RNA was used for cDNA
synthesis using the TransScript First-Strand cDNA Synthesis Kit
(TransGen Biotech Co., Ltd.). The thermocycling procedure used for
template amplification was set as deformation (94°C, 5 sec),
annealing (60°C, 15 sec) and extension stage (72°C, 10 sec) for 40
cycles. RT-qPCR reactions were performed in triplicate with the
TransStart Tip Green qPCR SuperMix (TransGen Biotech Co., Ltd.)
containing SYBR Green dye and detected by the CFX96 real-time PCR
system (Bio-Rad Laboratories, Inc.). Primers for PCR were as
follows: Human SPP1 forward, 5′-CGAGGTGATAGTGTGGTTTATGG-3′ and
reverse, 5′-GCACCATTCAACTCCTCGCTTTC-3′; human beta-actin forward,
5′-CACCATTGGCAATGAGCGGTTC-3′ and reverse,
5′-AGGTCTTTGCGGATGTCCACGT-3′. The relative quantification method
was used for quantifying mRNA level of the target gene, beta-actin
was the reference gene and used for normalization, and then the
normalized values were compared to obtain the fold change. The
comparative Cq value (2−ΔΔCq method) was used to
calculate relative quantitative data (29).
Immunohistochemistry (IHC)
staining
The tissues collected were fixed in 10% neutral
formalin at room temperature for 24 h. Subsequently, the tissue
underwent gradient alcohol dehydration, was cleared with xylene and
was embedded in paraffin. Subsequently, 4 µm-thick slices were
prepared for IHC staining. In briefly, paraffin sections of excised
tumor tissue were dewaxed with xylene and processed using a
gradient of ethanol concentrations. Tissue slices were washed with
PBS before staining. Endogenous peroxidase activity was quenched
with 3% H2O2 for 30 min. Subsequently, the
tissues were blocked with 3% BSA in PBS for 30 min at room
temperature and incubated overnight at 4°C with antibody against
human SPP1 (1:100; cat. no. ER1802-16; Hangzhou HuaAn Biotechnology
Co., Ltd.). Subsequently, slices were incubated with HRP-conjugated
secondary antibody (1:1,000 dilution; cat. no. 7074S; Cell
Signaling Technology, Inc.) for 1 h at room temperature after
washing with PBS three times. The immune complex was visualized
using DAB (Vector Laboratories, Inc.; Maravai LifeSciences) as a
chromogen. The reaction was terminated by washing with distilled
water, and the sections were counterstained with 0.5% hematoxylin
staining solution (cat. no. C0107; Beyotime Institute of
Biotechnology) for 5 min at room temperature and mounted with
neutral resin. Images were captured using a BX53 microscope
(Olympus Corp.).
Statistical analysis
Statistical analysis and figure generation were
performed using R (version 4.3.1; http://cran.rstudio.com/bin/windows/base/old/4.3.1/).
Statistical differences in data between paired groups were analyzed
using Student's t-tests and the outcomes were presented as the mean
± standard deviation.
Results
Transcriptomic analysis of individual
cells in ICC
To investigate the TME characteristics of ICC, the
data of tumor tissues and adjacent tissues collected from 5
patients with ICC were downloaded from the GEO database. The
details of the patients with ICC are listed in Table SII. Prior to transcriptomic
analysis, histopathological validation had been performed using
hematoxylin-eosin staining to confirm the malignant features of
tumor regions and normal architecture of adjacent tissues. IHC
staining of cytokeratin 19, a cholangiocyte-specific marker,
further verified the origin of the tumor cells (Fig. S1A and B). The scRNA-seq data encompassed 4 tumor
tissue samples and 3 samples of adjacent normal tissue (1). Finally, after quality control, an
scRNA-seq dataset consisting of a total of 20,412 cells from the
database was produced.
T cells and macrophages exhibit
differences in the TME of ICC tumor tissue
Using graph-based clustering (30) to analyze the cells from the
aforementioned patients with ICC, 10 main cell types were
identified, including tumor cells, hepatocytes, B cells,
CD4+ T cells, CD8+ T cells, macrophages, DCs,
fibroblast, monocytes and NK cells (Fig. 1A and B) (31).
All the cell types were characterized using known markers (Figs. 1C and S1C). A UMAP plot was used to assess the
distribution of these cells in tumor tissues (Fig. 1D) and adjacent tissues (Fig. 1F). The distribution of different
cell types in the tumor and adjacent tissues from ICC samples
indicated that macrophages were significantly increased in tumor
tissues, whereas T cells were markedly reduced (Fig. 1E, G
and H). The numbers of different
cell types in every patient are displayed in Tabl SIII and Table SIV.
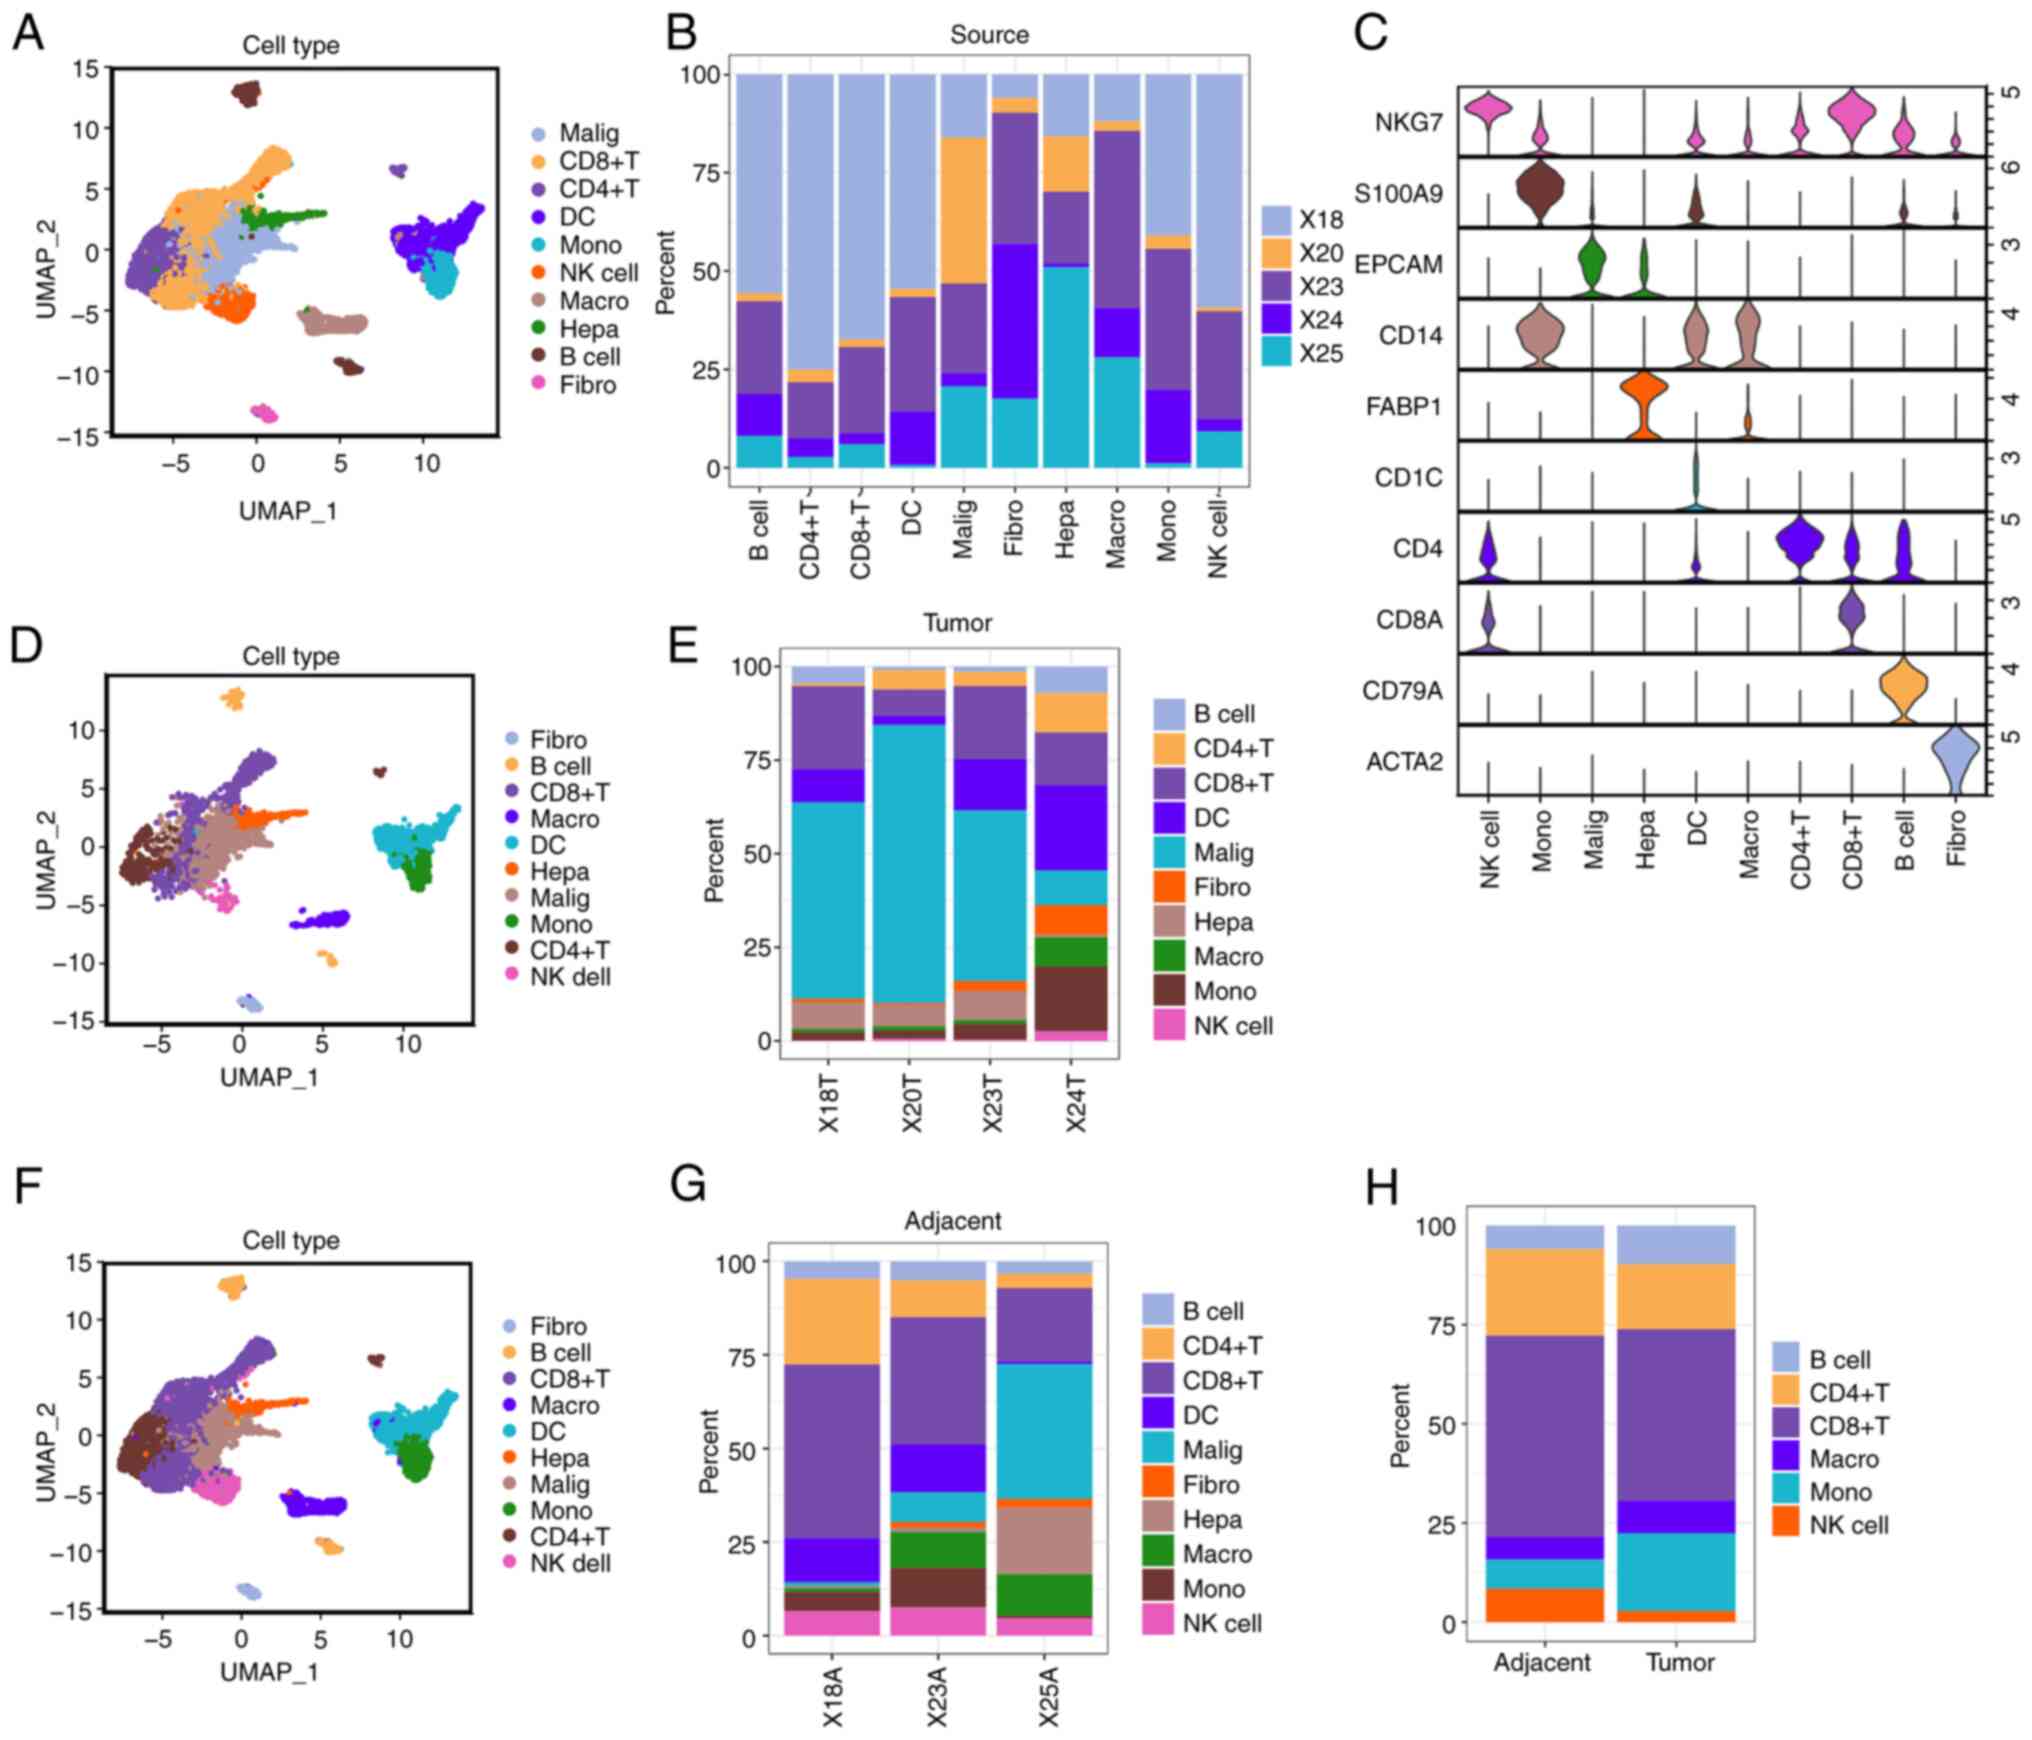 | Figure 1.Single-cell analysis of immune cells
in ICC tumor tissues and adjacent tissues. (A) Single cells from 5
ICC cases were categorized into 10 distinct cell clusters. (B)
Proportion of 10 cell clusters in different samples. (C) The
expression of marker genes specific to each cell type within the
clusters. (D and E) Single cells from the 5 ICC cases were
categorized into 10 distinct cell clusters across samples from ICC
tumor tissues. (F and G) Single cells from 5 ICC cases were
stratified into 10 cell types across samples from ICC adjacent
tissues. (H) The total proportions of cell types in ICC tumor
tissues and adjacent tissues. ICC, intrahepatic cholangiocarcinoma;
hepa, hepatocytes; NK, natural killer; DC, dendritic cell; fibro,
fibroblast; macro, macrophage; malig, malignant cells; mono,
monocyte; UMAP, Uniform Manifold Approximation and Projection;
FXYD3, FXYD domain containing ion transport regulator 3; ACTA2,
actin a2; FABP1, fatty acid binding protein 1; EPCAM, epithelial
cell adhesion molecule; NKG7, natural killer cell granule protein
7. |
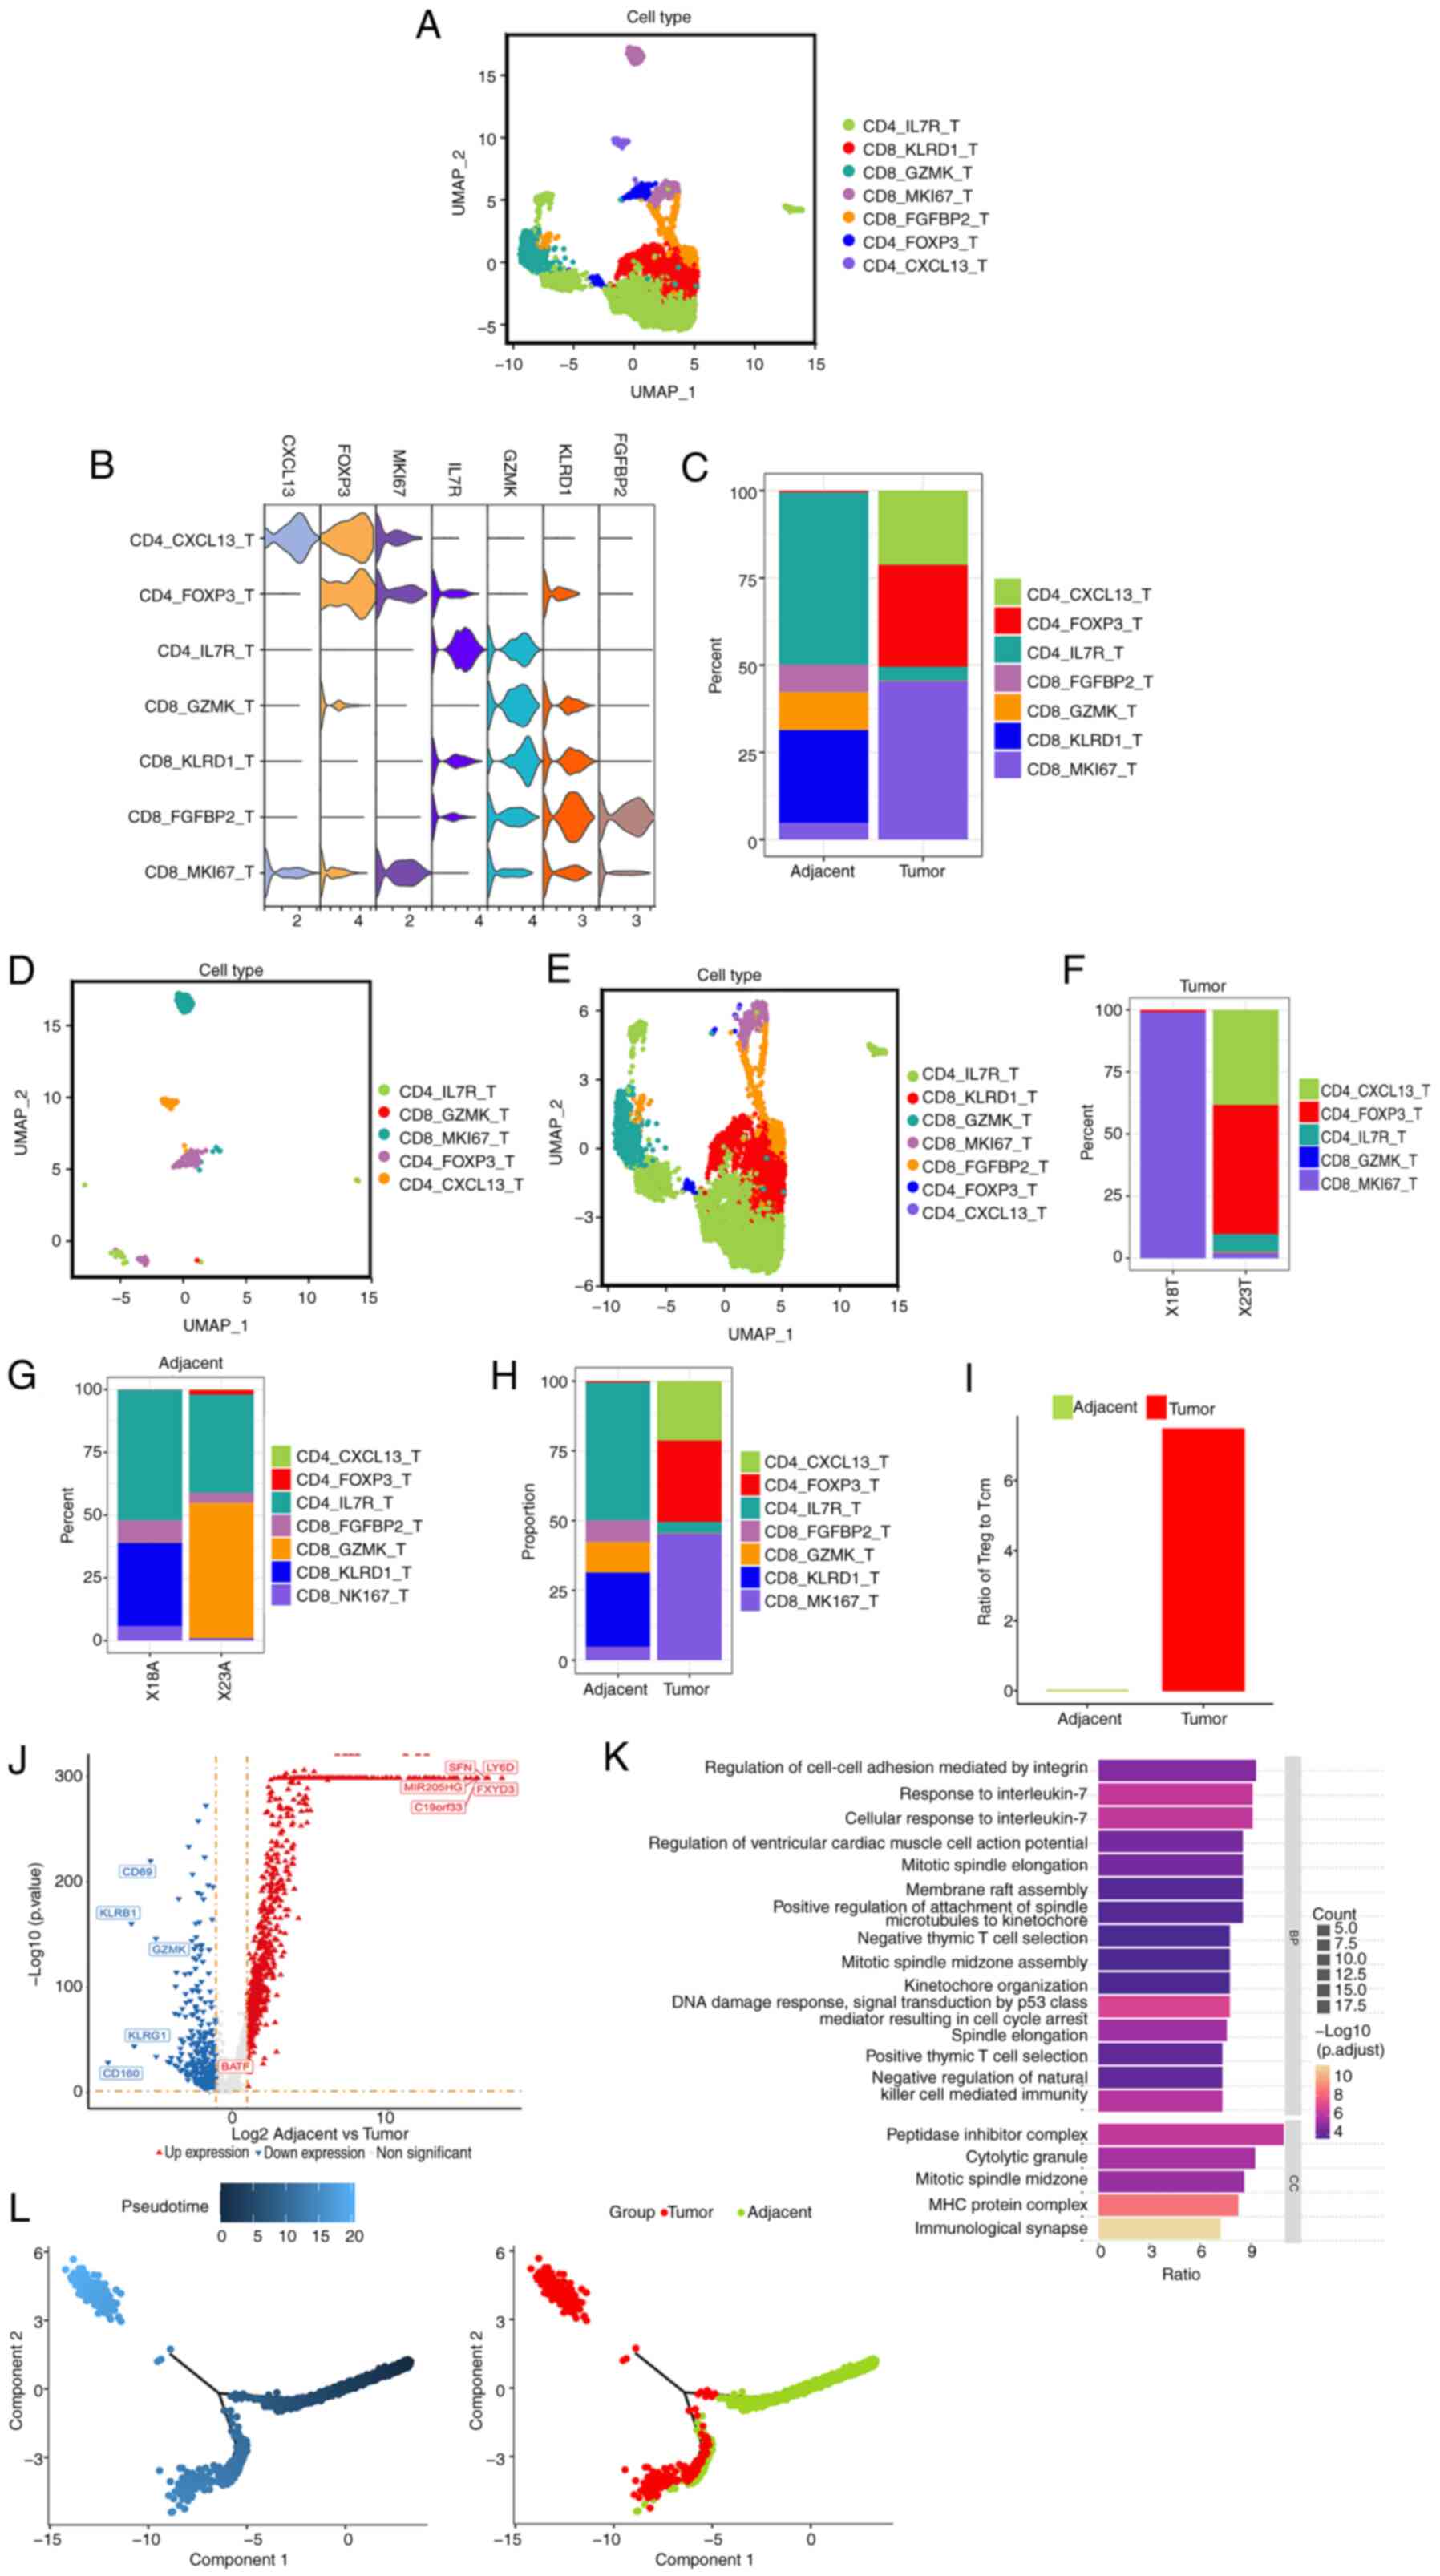
Increased ratio of regulatory T cells
to central memory T cells in the TME of ICC tumor tissues
To determine the influence of ICC tumor cells on T
cells, the presence of infiltrating T lymphocytes (TILs) in ICC
tumor tissues was compared with the surrounding non-tumor tissues.
A total of 9,654 T cells were shown and 7 subsets of TILs were
identified in ICC tissues (Fig.
2A). The expression levels of certain marker genes (Figs. 2B and S2A) and the percentage of each cell type
subset in each patient with ICC were analyzed (Fig. 2C). The percentage of subsets of TILs
in tumor tissues and the surrounding non-tumor tissues of each
patient were assessed (Fig. 2D and
E). A UMAP plot was used to measure the distribution of T-cell
subsets in tumor tissues (Fig. 2F)
and adjacent tissues (Fig. 2G).
These data demonstrate that central memory T cells [CD4-interleukin
7 receptor (IL7R) T cells] were decreased, while exhausted T cells
[CD4-C-X-C motif chemokine ligand 13 (CXCL13) T cells] and
regulatory T cells (CD4-FOXP3 T cells) were increased in the tumor
tissue of X23 compared with adjacent tissues (Fig. 2H). Furthermore, the ratio of
regulatory T cells to central memory T cells was higher in the TME
of ICC tumor tissues compared with adjacent tissues (Fig. 2I). The expression level of CD44 in T
cells in tumor tissues was higher compared with that in adjacent
tissues (Fig. S2B).
A volcano plot demonstrated that 875 genes were
upregulated and 354 genes were downregulated in T cells in tumor
tissues compared with adjacent tissues (Fig. 2J). Kyoto Encyclopedia of Genes and
Genomes (KEGG) pathway analysis demonstrated that differential gene
expression mainly occurred in ‘response to interleukin-7, ‘signal
transduction by p53’, ‘positive thymic T cell selection’ and ‘DNA
damage response’ (Fig. 2K). The
expression levels of the top 10 highest differentially expressed
genes were measured and their association with the prognosis of
patients with ICC was analyzed. It was shown that the basic leucine
zipper ATF-like transcription factor gene exhibited increased
expression levels in T cells in ICC tumor tissues compared with
adjacent tissues and exerted a notable influence on the prognosis
of patients with ICC (Fig. S2C and
D). This finding was also reported
by a previous study (32).
The diffusion pseudotime analysis provided a window
for studying cellular dynamic processes, facilitating the
prediction of tumor cell development and lineage diversification.
The developmental trajectories of the subsets of T cells were
analyzed (Figs. 2L and S2E). Pseudotime analysis showed that
central memory T cells and regulatory T cells in adjacent tissues
had similar gene clusters but had different gene clusters in tumor
tissues (Fig. S2E). In addition,
most regulatory T cells in tumor tissues were distributed at, or
close to, the pseudotime branching point 1 (Fig. S2E), which indicated that these
cells were undergoing cell programmed changes such as cell fate
differentiation. Thus, both cell proliferation and reprogramming
could potentially account for the increased ratio of regulatory T
cells to central memory cells in tumor tissues.
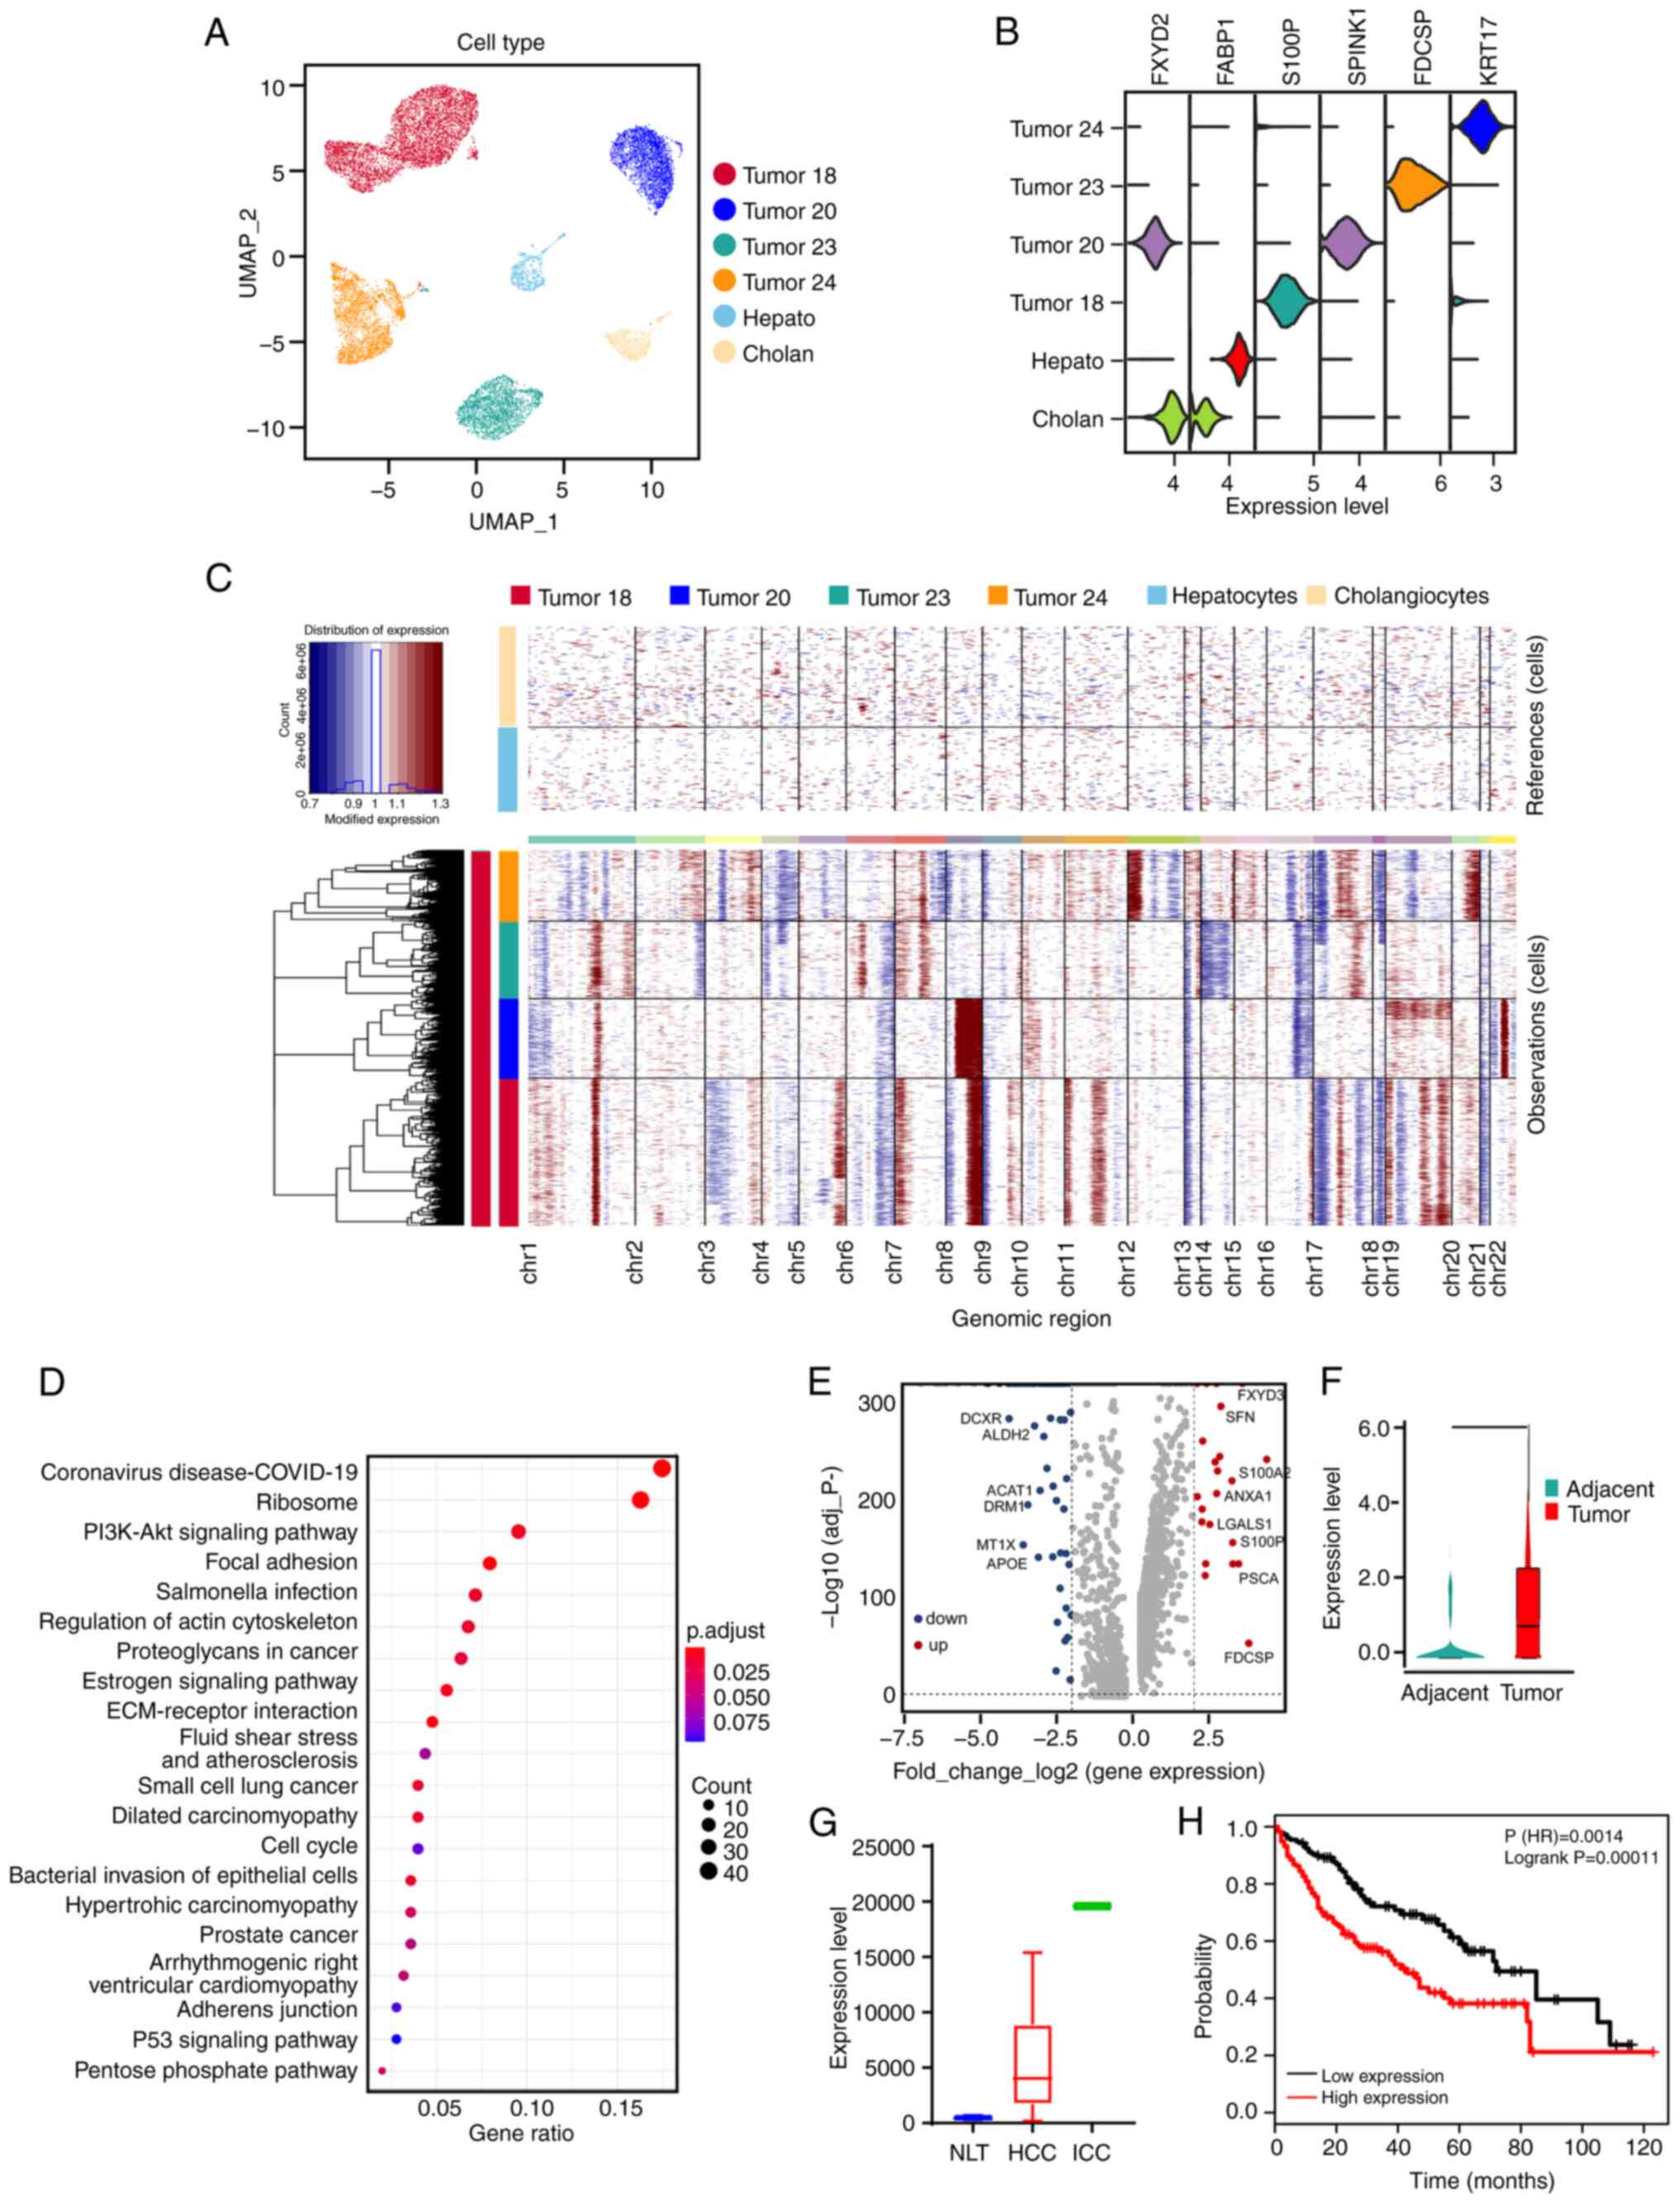
Association between upregulation of
SPP1 in ICC tumor cells and poor prognosis
To detect the transcriptomic features of ICC tumor
cells, scRNA-seq data including tumor cells, hepatocytes and
cholangiocytes were analyzed (Fig.
3A). The expression level of each cell group marker gene was
assessed (Fig. 3B). CNVs, which
comprise amplifications and deletions, could notably accelerate the
adaptive evolution and development of cancer (33). The results of the present study
demonstrated that ICC tumor cells contained several amplification
and deletion variants in the entire chromosome. Specifically, the
amplification variants in chromosomes 1, 7, 8, 11 and 21 and the
deletion variants in chromosomes 3, 6, 16, 17 and 22 (Fig. 3C). KEGG pathway analysis results
demonstrated that ICC tumor cells had different gene expression
levels in the ‘PI3K-Akt signaling pathway’, ‘focal adhesion’
cascade, ‘ECM receptor-interaction’ cascade, ‘cell cycle pathway’
and ‘p53 signaling pathway’ (Fig.
3D). Furthermore, a volcano plot was used to investigate the
differential gene expression of ICC tumor cells. Finally, 176 genes
were identified as upregulated and 228 genes and as downregulated
in ICC tumor cells compared with adjacent cells (Fig. 3E).
The SPP1 gene was among the most upregulated genes
in ICC tumor cells (Fig. 3F). To
further assess the association of SPP1 with ICC tumors, analysis of
data from the GEPIA2 disease database was performed, which
demonstrated a significant upregulation of SPP1 levels in ICC
tumors compared with normal tissue and in stage IV of ICC (Fig. S3A and B). Furthermore, the sequencing results
were further verified using biological experiments. SPP1 mRNA
levels were significantly increased in tumor tissues compared with
adjacent tissues from both patients with ICC (Fig. S3C). The SPP1 protein level was also
demonstrated to be upregulated in tumors compared with adjacent
tissues using IHC staining (Fig.
S3D). The results demonstrate that SPP1 expression is elevated
in ICC tumor tissues. Thus, the role of SPP1 in ICC immune
microenvironment modulation was evaluated. SPP1 was first
identified in osteosarcoma cells to serve a role of mediating
osteoblast adhesion (34). The data
from normal liver, primary hepatocellular carcinoma (HCC) and
primary ICC microarrays showed a significant increase in SPP1
expression levels in liver carcinoma, particularly in ICC, compared
with normal liver tissues (Fig.
3G). Furthermore, the expression level of SPP1 had a
significant association with adverse prognosis in patients with ICC
(Fig. 3H). In addition, S100A2 and
stratifin (SFN) were also associated with the prognosis of patients
with ICC (Fig. S3E-G) (35,36).
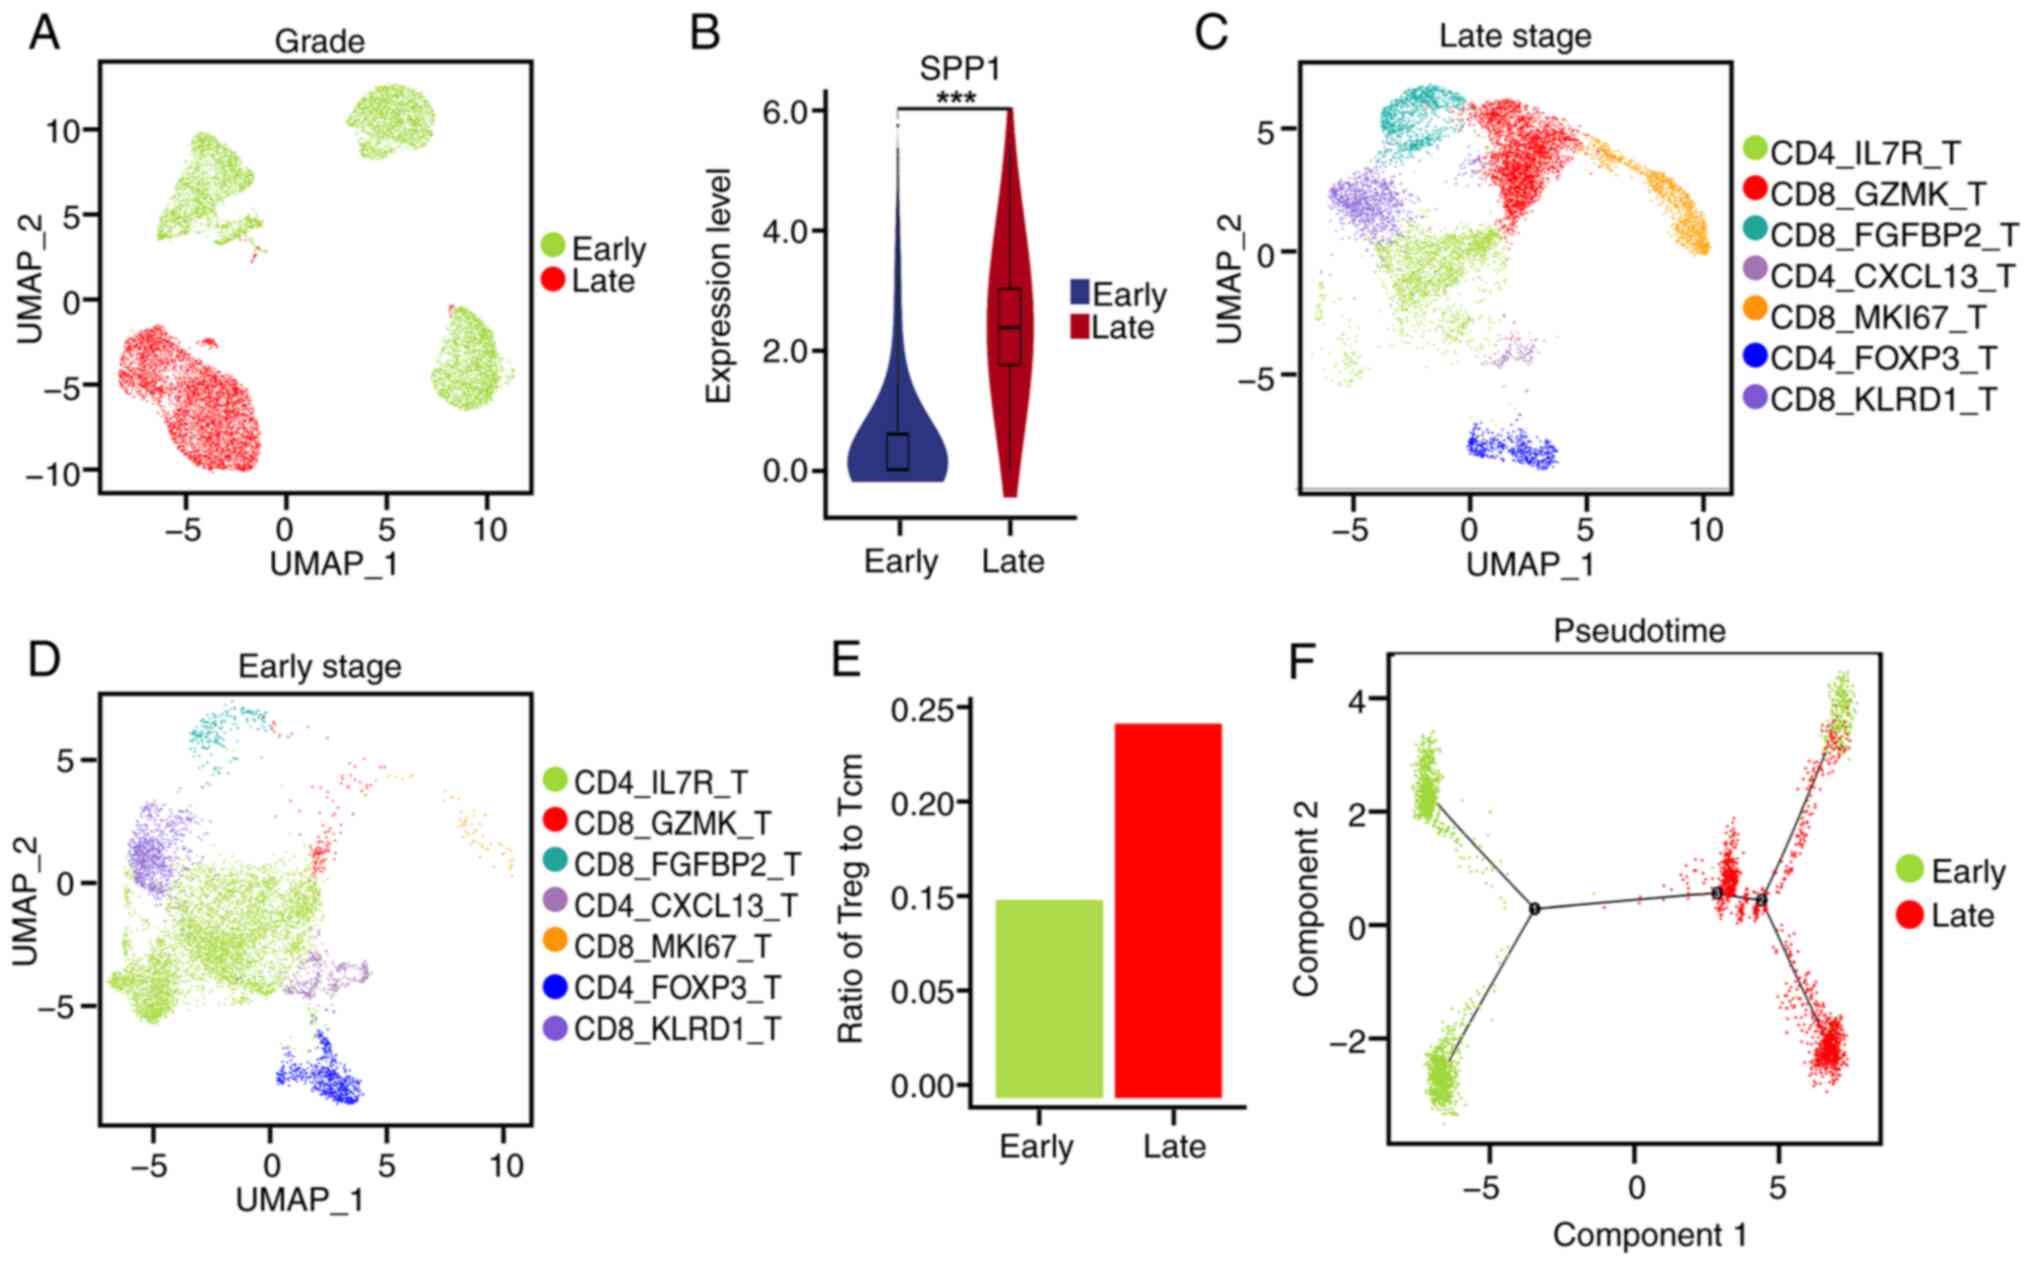
SPP1 expression and the ratio of
regulatory T cells to central memory T cells are increased in
late-stage ICC
Tumor stage is an important clinical diagnostic
index for tumor prognosis. To identify an association between the
expression levels of the SPP1 gene and the ICC tumor stage, the
expression level of SPP1 in tumor cells at different ICC stages was
analyzed. ICC stages T1-2 were defined as early-stage and ICC
stages T3-4 were defined as late-stage. Tumor cells from patient
X25 were excluded from the datasets due to the absence of tumor
tissue data in the public database. Therefore, tumor cells from
patients X20, X23 and X24 were used as the early-stage group and
tumor cells from patient X18 as late-stage (Fig. 4A). The volcano plot indicated that
there were 69 upregulated genes and 101 downregulated genes in
late-stage tissues compared with early-stage tissues (Fig. S4A).
The differentially expressed genes and their
association with the prognosis of patients with ICC were further
investigated. These results demonstrated that the expression level
of SPP1 was higher in late-stage ICC compared with earlier stages
(Fig. 4B). Furthermore, aldo-keto
reductase family 1 member C2 and S100P exhibited increased
expression levels, while IL-32 and vitronectin exhibited decreased
expression levels in the late-stage ICC tumors compared with
early-stage ICC tumors, and all of the aforementioned genes were
significantly associated with the prognosis of patients with ICC
(Fig. S4B-F). KEGG pathway
analysis showed that the early- and late-stage groups exhibited
different expression levels of genes associated with ‘cellular
senescence’, the ‘p53 signaling pathway’ and ‘ferroptosis’
(Fig. S4G).
Furthermore, a UMAP plot was utilized to analyze the
subset of CD4+ T cells present in the late and early
stages of ICC tumor tissues (Fig. 4C
and D). An increase in the ratio of regulatory T cells to
central memory T cells in the tumor tissues of late-stage ICC was
demonstrated (Fig. 4E). Pseudotime
analysis showed distinct gene expression clusters of various T-cell
types that were different between the early and late stages of ICC
(Figs. 4F and S4H). Compared with early-stage tissues,
both central memory T cells and regulatory T cells in late-stage
tissues were located at the pseudotime branching points 2 and 3,
which suggested that these two subtypes of CD4+ T cells
underwent cell reprogramming and differentiation during ICC tumor
progression.
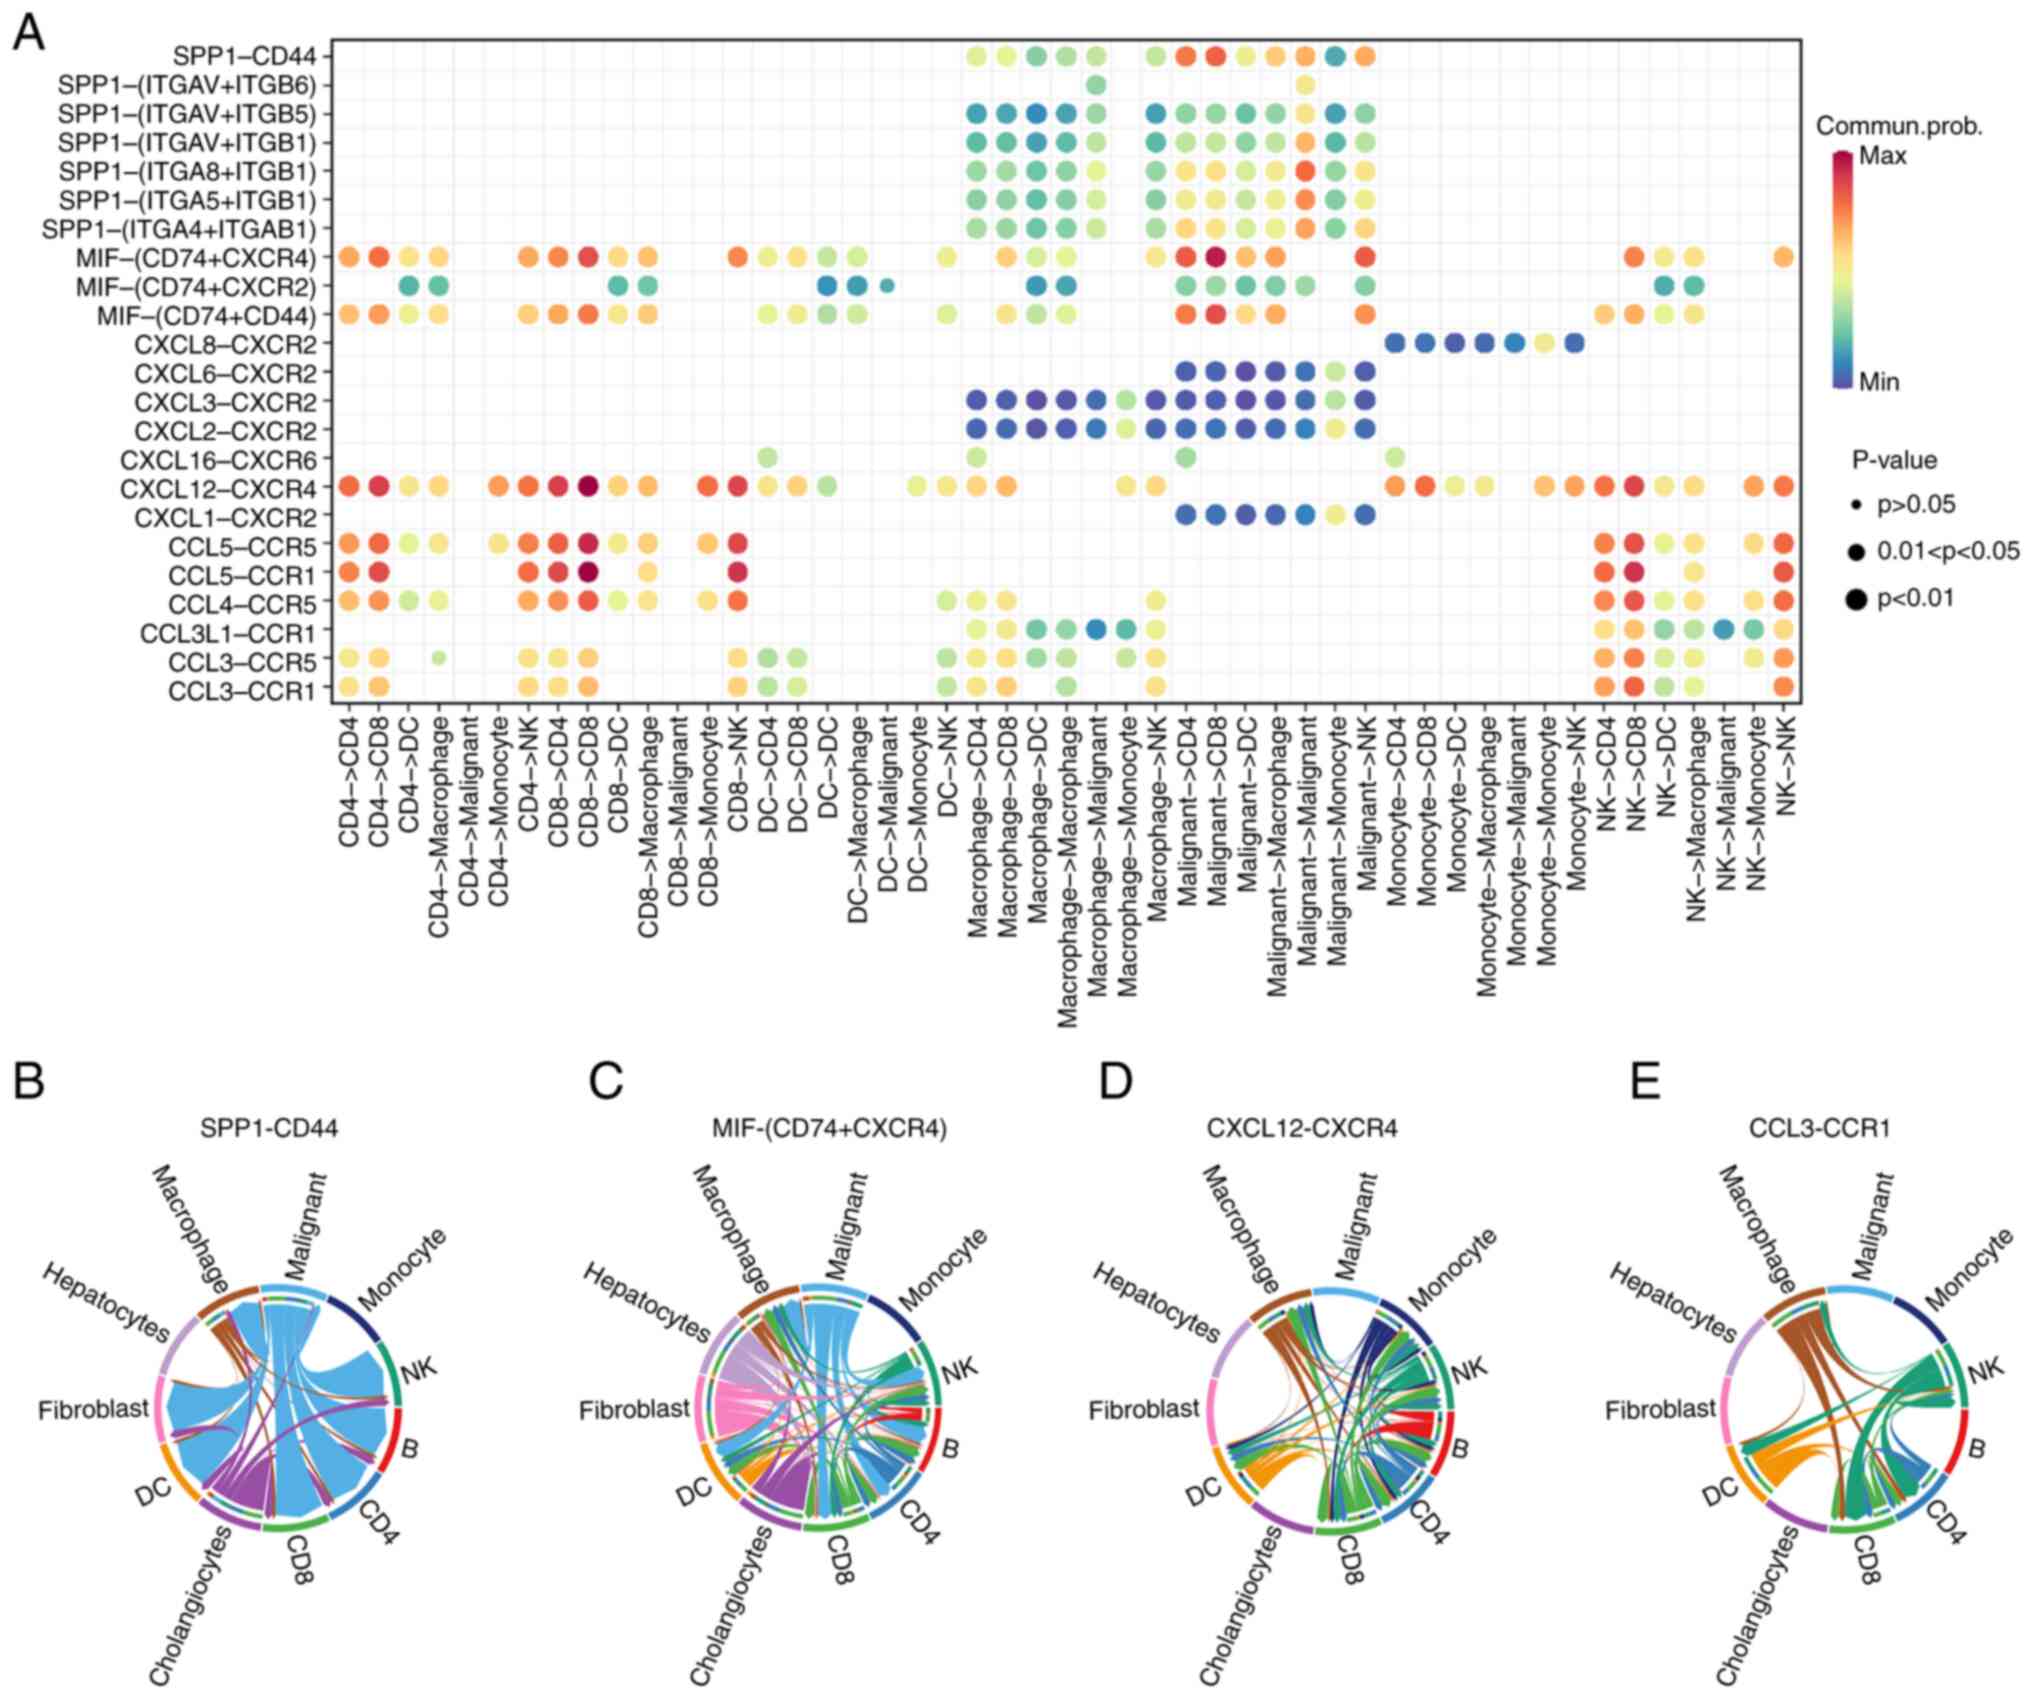
ICC tumor cells interact with T cells
and macrophages to facilitate tumor progression through SPP1/CD44
interactions
To identify the interactions between tumor and
immune cells, a list of 1,800 reported interactions were compiled
from previously published literature. This list included
ligand-receptor pairs from several families, such as cytokines,
chemokines, TNFs and receptor tyrosine kinases, along with
interactions between the ECM and integrins (37). A bubble plot was employed to predict
the ligand-receptor interactions that contributed to the signaling
between the tumor cells and immune cell clusters in ICC (Fig. 5A). The details of SPP1-CD44,
macrophage migration inhibitory factor-CD74 and CD44, CXCL12-C-X-C
motif chemokine receptor type 4 and CCL3-C-C motif chemokine
receptor type 1 interactions in the microenvironment of ICC were
compiled in a chord diagram (Fig.
5B-E).
Discussion
ICC is an aggressive form of cancer characterized by
a scarcity of effective treatment modalities and poor prognosis
(1). Immunological therapy is an
emerging treatment strategy for this disease that has the potential
to improve treatment efficacy and prolong the survival of patients
with ICC. However, the complex immune microenvironment of ICC
limits the effectiveness of immunotherapy for patients. scRNA-seq
is a powerful and effective method that can be used to understand
the detailed immune microenvironment of different types of
cancer.
T cell-based immunotherapy is a promising strategy
for the systemic treatment of cancer. CD8+ T
lymphocytes, particularly CD8+ cytotoxic T cells, can
directly eliminate cancer cells via specific major
histocompatibility complex class I interactions. The function of
CD4+ T cells in immunotherapy has been previously
reported in both mouse models and clinical studies involving
patients, which shows that various subsets of CD4+ T
cells mediate the effects of antitumor immune responses (38). However, there is still limited
research on the roles of CD4+ T cells in the oncogenesis
and progression of ICC, which hinders the development of effective
immunotherapy strategies against ICC tumors.
In the present study, characteristics of the TME of
ICC tumor tissues were identified and features of the immune
microenvironment in both early- and late-stage ICC were further
analyzed. The scRNA-seq data demonstrated that the number of
CD4+ T cells was increased in ICC tumor tissues. When
activated by antigen-presenting cells, uncommitted CD4+
T cells can differentiate into a range of effector T-cell subsets,
as well as memory T cells (39,40).
The results demonstrated that the proportion of central memory T
cells (CD4-IL7R T cells), regulatory T cells (CD4-FOXP3 T cells)
and exhausted T cells (CD4-CXCL13 T cells) were higher in ICC tumor
tissues compared with those in adjacent normal tissues. Central
memory T cells are potent antitumor immune cells, distinguished by
their prolonged in vivo survival and their robust capacity
for self-renewal (41). However,
regulatory T cells and exhausted T cells exerted a pro-tumor effect
(42). The number of
CD4+ T cells was higher in the tumor tissues of
late-stage ICC (T3 stage) compared with those in early-stage ICC
(T2 stage). Furthermore, the proportion of regulatory T cells to
central memory T cells was elevated both in ICC tumor tissues
compared with adjacent liver tissues and in late-stage ICC tumor
tissues (T3 stage) compared with early-stage tissues (T2 stage).
These results demonstrated that the ICC tumor TME is in a
hyper-immunosuppressive state, particularly regarding
CD4+ T cells. In addition, the ratio of CD4+
T-cell subsets to other subsets, rather than the absolute subset
cell number, is critical for the growth and advancement of ICC
tumors. Therefore, the development of techniques and methods that
can reduce the proportion of inhibitory CD4+ cells
(regulatory T cells and exhausted CD4+ T cells) could
effectively alleviate or restrict the growth of ICC tumors.
Beyond the immunosuppressive TME landscape, the
genomic profiling performed in the present study revealed recurrent
chromosomal amplification (Chr1, 7, 8, 11, 21) and deletion (Chr3,
6, 16, 17, 22) variants in ICC tumor cells. The detection of
specific amplification and deletion variants in ICC tumor cells
provides valuable insights into the genetic landscape of this
malignancy. Amplifications on chromosomes 1, 7, 8, 11 and 21 may
indicate regions of oncogene enrichment, while deletions on
chromosomes 3, 6, 16, 17 and 22 could suggest loss of tumor
suppressor genes. For instance, amplifications in chromosome 1q
(encompassing MDM2) and chromosome 8q (containing
MYC) are frequently associated with enhanced cell
proliferation, apoptosis resistance and metabolic reprogramming in
solid tumors (43,44). Conversely, deletions in chromosome
17p (spanning TP53) reduced the tumor suppressor activity,
genomic instability and chemoresistance patterns observed in
biliary tract malignancies (45,46).
Notably, the chromosome 11q amplification encompasses FGF family
genes, which are implicated in promoting tumor cell proliferation
and survival in ICC (47). Future
studies should explore whether these aberrations correlate with
clinicopathological features (metastasis, survival) or therapeutic
responses to targeted agents.
The SPP1 gene is located at human chromosome 4 and
encodes a protein similar to cytokines, which modulates the
turnover of the ECM. Previous studies reported that SPP1 serves as
both a predictive biomarker and a potential therapeutic target for
various types of cancer, including head and neck squamous cell
carcinoma and lung adenocarcinoma (48,49).
SPP1 gene expression and its downstream effects are regulated by
certain upstream regulators, such as cell adhesion to the ECM, the
movement of leukocytes, organization of the ECM and signaling
pathways that are dependent on integrins. In addition, SPP1 serves
a vital role in the process of liver regeneration following a
partial hepatectomy (50). SPP1
expression was upregulated in HCC. A previous study reported an
association between elevated serum SPP1 levels and several adverse
outcomes, including worse overall survival and disease-free
survival, advanced HCC stage, larger tumor size and the presence of
vascular invasion following surgical resection in patients with HCC
(50). Furthermore, it has been
reported that SPP1 is a potential serum biomarker for HCC (50). However, it remains largely elusive
how SPP1 contributes to the development of ICC. In the present
study, a significant upregulation of SPP1 expression levels was
observed in ICC tumors, particularly in late-stage ICC, using the
GEPIA2 database. Furthermore, RT-qPCR and IHC results demonstrated
that SPP1 expression was markedly elevated in tumor tissues
compared with adjacent non-tumor tissues. These findings provide
evidence that elevated SPP1 expression levels are associated with a
worse prognosis and progression of ICC. Therefore, SPP1 may
potentially be used as a new tumor marker for ICC.
A previous study reported that SPP1 is elevated
during inflammation and is associated with the infiltration and
differentiation of immune cells (51). In a mouse model of obesity induced
by a high-fat diet, knocking out SPP1 and neutralizing SPP1
ameliorated inflammation in adipose tissue and enhanced insulin
sensitivity (50). Mechanistically,
SPP1 interacted with various immune cells (e.g., macrophages, T
cells and cancer-associated fibroblast cells) (48,52,53)
and molecules (e.g., CD44, ITGB1) (54,55) to
create an immunosuppressive microenvironment. For instance, SPP1 in
breast cancer acts as an autocrine and paracrine factor, promoting
proliferation and recruiting and polarizing macrophages into a
pro-tumorigenic state. Its inhibition reduces recurrence and
enhances the efficacy of immunotherapy, underscoring its crucial
role in the immune microenvironment (56). Furthermore, SPP1 promotes cancer
cell migration and proliferation by interacting with growth factor
receptors (EGFR, PDGFR, VEGFR) and signaling pathways (PI3K/AKT
pathway, MAPK/ERK pathway, JAK/STAT pathway) that are involved in
cell motility and survival (57,58).
In late-stage ICC, increased expression of SPP1 has been associated
with the enhancement of cancer cell invasion and metastasis, which
are hallmarks of aggressive disease progression. SPP1 achieves this
by modulating the activity of signaling molecules such as the
PI3K-Akt signaling cascade, focal adhesion cascade, ECM-receptor
interaction cascade, cell cycle pathway and p53 signaling cascade,
which are known to regulate cell migration, proliferation and
survival. SPP1 expression contributes to the maturation and
migration of DCs by interaction with CD44 (59). An association has been previously
reported between high SPP1 expression levels in adipose tissue and
macrophage recruitment (50).
Cytoplasmic SPP1 promoted the migration of macrophages by
interacting with the CD44-ezrin-radixin-moesin complex (50). The knockout of SPP1 delayed liver
regeneration in a mouse model by reducing hepatic macrophage and
neutrophil infiltration, along with insufficient activation of
STAT3 signaling and IL6 in Kupffer cells (60,61).
Following the activation of T cells, SPP1 serves a notable role in
promoting the differentiation of Th1 and Th17 cells (18).
SPP1 overexpression in tumor cells could regulate
TME features through surrounding immune cells in a receptor-ligand
pattern. The SPP1-CD44 interaction serves a critical role in tumor
progression and metastasis in various types of cancers. For
example, the SPP1-CD44 interaction promotes tumor progression and
has been recognized as mediating the interplay between macrophages
and HCC cells (62). Furthermore,
the SPP1-CD44 axis promotes cancer stemness and metastasis in
pancreatic tumors (54). The
SPP1-CD44 axis has also been reported to mediate crosstalk between
macrophages and cancer cells in gliomas, highlighting its potential
as a promising therapeutic target for the treatment of gliomas
(63). Additionally, the SPP1-CD44
interaction has been identified as a promising target for combined
immunotherapy, offering a novel perspective for clinical approaches
targeting ICC through modulation of effector T-cell infiltration
(64).
In conclusion, the present study revealed that
elevated SPP1 expression in ICC tumor cells correlates with ICC
progression and poor prognosis. The findings demonstrated a dual
immunomodulatory role of SPP1 within the TME: First, CD44
expression was significantly upregulated across all T-cell subsets,
particularly in tumor-infiltrating CD4+ T cells, which showed
substantial enrichment in ICC tissues. Notably, late-stage ICC
exhibited an increased ratio of immunosuppressive regulatory T
cells (Tregs) to antitumor central memory T cells within the CD4+
population, indicative of a progressively immunosuppressive TME.
Second, ligand-receptor analysis of scRNA-seq data identified
critical interactions between SPP1-expressing tumor cells and
CD44-bearing CD4+ T cells, suggesting the SPP1-CD44 axis serves as
a key mediator of tumor-immune crosstalk. Collectively, these
findings position the SPP1-CD44 interaction as both a prognostic
biomarker and a promising therapeutic target. Future studies should
validate its potential for combination immunotherapy strategies
aimed at reprogramming the immunosuppressive TME while directly
targeting tumor-stromal communication pathways.
There are certain limitations to the present study
and experimental design. Firstly, for the patient data being
collected from online databases and included in the analysis, it
only partially reflects the general clinical case pattern.
Secondly, due to the small sample size, there is a lack of reliable
correlation analysis between clinical manifestations and
pathological features of tumors. Therefore, only indirect
assessments can be made with the help of online pathological
databases. Thirdly, the variability in treatment protocols among
patients poses a challenge to the reliability and convincing nature
of the survival outcomes reported. Despite best efforts to analyze
the data thoroughly, the heterogeneity in treatment approaches
underscores a notable limitation that cannot be overlooked. Due to
the constraints of the current dataset, the present study was
unable to provide survival outcomes that are unaffected by these
inconsistencies. Therefore, these limitations will be addressed in
future work by increasing the sample size to enhance the
reliability and generalizability of the findings. By doing so,
potential confounding factors can be accounted for to provide more
robust survival outcome data.
In conclusion, the present study provides valuable
insights into the role of SPP1 in ICC, highlighting its potential
as a therapeutic target and prognostic marker. The findings suggest
that targeting the SPP1-CD44 axis may offer a promising strategy
for ICC treatment by modulating the tumor immune microenvironment.
Future research should build on these results to further explore
the mechanisms underlying SPP1's functions and to develop effective
therapeutic approaches for patients with ICC.
Supplementary Material
Supporting Data
Supporting Data
Acknowledgements
Not applicable.
Funding
The present work was supported by The Shenzhen Science and
Technology Innovation Commission Fundamental Research Key Projects
(grant nos. JCYJ20210324120200001, JCYJ20210324101805014 and
JCYJ20240813113038049) and the Sanming Project of Medicine in
Shenzhen (grant no. SZSM202211017).
Availability of data and materials
The data generated in the present study may be
requested from the corresponding author.
Authors' contributions
XL, HP, KL, WC, XS, CN, HL and DY contributed to the
study conception and design. DY drafted the manuscript and
supervised the study. HL conceptualized the study and drafted the
manuscript. XL wrote the original draft. HP analyzed the data and
produced figures and tables. KL was involved in visualization. WC
provided professional suggestions. XS performed data curation. CN
edited the manuscript. XL and HP confirm the authenticity of all
the raw data. All authors read and approved the final version of
the manuscript.
Ethics approval and consent to
participate
All of the patients involved provided written
informed consent and the present study was approved by the Medical
Research Ethics Committee of The University of Hong Kong Shenzhen
Hospital [approval no. Lun (2021)122].
Patient consent for publication
Not applicable.
Competing interests
The authors declare that they have no competing
interests.
References
|
1
|
Zhang M, Yang H, Wan L, Wang Z, Wang H, Ge
C, Liu Y, Hao Y, Zhang D, Shi G, et al: Single-cell transcriptomic
architecture and intercellular crosstalk of human intrahepatic
cholangiocarcinoma. J Hepatol. 73:1118–1130. 2020. View Article : Google Scholar : PubMed/NCBI
|
|
2
|
Loeuillard E, Yang J, Buckarma E, Wang J,
Liu Y, Conboy C, Pavelko KD, Li Y, O'Brien D, Wang C, et al:
Targeting tumor-associated macrophages and granulocytic
myeloid-derived suppressor cells augments PD-1 blockade in
cholangiocarcinoma. J Clin Invest. 130:5380–5396. 2020. View Article : Google Scholar : PubMed/NCBI
|
|
3
|
Yuan H, Lin Z, Liu Y, Jiang Y, Liu K, Tu
M, Yao N, Qu C and Hong J: Intrahepatic cholangiocarcinoma induced
M2-polarized tumor-associated macrophages facilitate tumor growth
and invasiveness. Cancer Cell Int. 20:5862020. View Article : Google Scholar : PubMed/NCBI
|
|
4
|
Zheng C, Zheng L, Yoo JK, Guo H, Zhang Y,
Guo X, Kang B, Hu R, Huang JY, Zhang Q, et al: Landscape of
infiltrating T cells in liver cancer revealed by single-cell
sequencing. Cell. 169:1342–1356.e16. 2017. View Article : Google Scholar : PubMed/NCBI
|
|
5
|
Kim RD, Chung V, Alese OB, El-Rayes BF, Li
D, Al-Toubah TE, Schell MJ, Zhou JM, Mahipal A, Kim BH and Kim DW:
A Phase 2 multi-institutional study of nivolumab for patients with
advanced refractory biliary tract cancer. JAMA Oncol. 6:888–894.
2020. View Article : Google Scholar : PubMed/NCBI
|
|
6
|
Song G, Shi Y, Zhang M, Goswami S, Afridi
S, Meng L, Ma J, Chen Y, Lin Y, Zhang J, et al: Global immune
characterization of HBV/HCV-related hepatocellular carcinoma
identifies macrophage and T-cell subsets associated with disease
progression. Cell Discov. 6:902020. View Article : Google Scholar : PubMed/NCBI
|
|
7
|
D'Avola D, Villacorta-Martin C,
Martins-Filho SN, Craig A, Labgaa I, von Felden J, Kimaada A,
Bonaccorso A, Tabrizian P, Hartmann BM, et al: High-density single
cell mRNA sequencing to characterize circulating tumor cells in
hepatocellular carcinoma. Sci Rep. 8:115702018. View Article : Google Scholar : PubMed/NCBI
|
|
8
|
Chai X, Wang J, Li H, Gao C, Li S, Wei C,
Huang J, Tian Y, Yuan J, Lu J, et al: Intratumor microbiome
features reveal antitumor potentials of intrahepatic
cholangiocarcinoma. Gut Microbes. 15:21562552023. View Article : Google Scholar : PubMed/NCBI
|
|
9
|
Jono S, Peinado C and Giachelli CM:
Phosphorylation of osteopontin is required for inhibition of
vascular smooth muscle cell calcification. J Biol Chem.
275:20197–1203. 2000. View Article : Google Scholar : PubMed/NCBI
|
|
10
|
Christensen B, Kazanecki CC, Petersen TE,
Rittling SR, Denhardt DT and Sørensen ES: Cell type-specific
post-translational modifications of mouse osteopontin are
associated with different adhesive properties. J Biol Chem.
282:19463–19472. 2007. View Article : Google Scholar : PubMed/NCBI
|
|
11
|
Oyama M, Kariya Y, Kariya Y, Matsumoto K,
Kanno M, Yamaguchi Y and Hashimoto Y: Biological role of
site-specific O-glycosylation in cell adhesion activity and
phosphorylation of osteopontin. Biochem J. 475:1583–1595. 2018.
View Article : Google Scholar : PubMed/NCBI
|
|
12
|
Song G, Shi Y, Meng L, Ma J, Huang S,
Zhang J, Wu Y, Li J, Lin Y, Yang S, et al: Single-cell
transcriptomic analysis suggests two molecularly subtypes of
intrahepatic cholangiocarcinoma. Nat Commun. 13:16422022.
View Article : Google Scholar : PubMed/NCBI
|
|
13
|
Ma L, Wang L, Khatib SA, Chang CW,
Heinrich S, Dominguez DA, Forgues M, Candia J, Hernandez MO, Kelly
M, et al: Single-cell atlas of tumor cell evolution in response to
therapy in hepatocellular carcinoma and intrahepatic
cholangiocarcinoma. J Hepatol. 75:1397–1408. 2021. View Article : Google Scholar : PubMed/NCBI
|
|
14
|
Paulis YW, Huijbers EJ, van der Schaft DW,
Soetekouw PM, Pauwels P, Tjan-Heijnen VC and Griffioen AW: CD44
enhances tumor aggressiveness by promoting tumor cell plasticity.
Oncotarget. 6:19634–19646. 2015. View Article : Google Scholar : PubMed/NCBI
|
|
15
|
Katagiri YU, Sleeman J, Fujii H, Herrlich
P, Hotta H, Tanaka K, Chikuma S, Yagita H, Okumura K, Murakami M,
et al: CD44 variants but not CD44s cooperate with beta1-containing
integrins to permit cells to bind to osteopontin independently of
arginine-glycine-aspartic acid, thereby stimulating cell motility
and chemotaxis. Cancer Res. 59:219–226. 1999.PubMed/NCBI
|
|
16
|
Rao G, Wang H, Li B, Huang L, Xue D, Wang
X, Jin H, Wang J, Zhu Y, Lu Y, et al: Reciprocal interactions
between tumor-associated macrophages and CD44-positive cancer cells
via osteopontin/CD44 promote tumorigenicity in colorectal cancer.
Clin Cancer Res. 19:785–797. 2013. View Article : Google Scholar : PubMed/NCBI
|
|
17
|
Pietras A, Katz AM, Ekström EJ, Wee B,
Halliday JJ, Pitter KL, Werbeck JL, Amankulor NM, Huse JT and
Holland EC: Osteopontin-CD44 signaling in the glioma perivascular
niche enhances cancer stem cell phenotypes and promotes aggressive
tumor growth. Cell Stem Cell. 14:357–369. 2014. View Article : Google Scholar : PubMed/NCBI
|
|
18
|
Klement JD, Paschall AV, Redd PS, Ibrahim
ML, Lu C, Yang D, Celis E, Abrams SI, Ozato K and Liu K: An
osteopontin/CD44 immune checkpoint controls CD8+ T cell activation
and tumor immune evasion. J Clin Invest. 128:5549–5560. 2018.
View Article : Google Scholar : PubMed/NCBI
|
|
19
|
Hornburg M, Desbois M, Lu S, Guan Y, Lo
AA, Kaufman S, Elrod A, Lotstein A, DesRochers TM, Munoz-Rodriguez
JL, et al: Single-cell dissection of cellular components and
interactions shaping the tumor immune phenotypes in ovarian cancer.
Cancer Cell. 39:928–944.e6. 2021. View Article : Google Scholar : PubMed/NCBI
|
|
20
|
Lun ATL, McCarthy DJ and Marioni JC: A
step-by-step workflow for low-level analysis of single-cell RNA-seq
data with bioconductor. F1000Res. 5:21222016. View Article : Google Scholar : PubMed/NCBI
|
|
21
|
Korsunsky I, Millard N, Fan J, Slowikowski
K, Zhang F, Wei K, Baglaenko Y, Brenner M, Loh PR and Raychaudhuri
S: Fast, sensitive and accurate integration of single-cell data
with Harmony. Nat Methods. 16:1289–1296. 2019. View Article : Google Scholar : PubMed/NCBI
|
|
22
|
Hao Q, Li J, Zhang Q, Xu F, Xie B, Lu H,
Wu X and Zhou X: Single-cell transcriptomes reveal heterogeneity of
high-grade serous ovarian carcinoma. Clin Transl Med. 11:e5002021.
View Article : Google Scholar : PubMed/NCBI
|
|
23
|
Cao J, Spielmann M, Qiu X, Huang X,
Ibrahim DM, Hill AJ, Zhang F, Mundlos S, Christiansen L, Steemers
FJ, et al: The single-cell transcriptional landscape of mammalian
organogenesis. Nature. 566:496–502. 2019. View Article : Google Scholar : PubMed/NCBI
|
|
24
|
Sergushichev AA: An algorithm for fast
preranked gene set enrichment analysis using cumulative statistic
calculation. bioRxiv. 0600122016.
|
|
25
|
Subramanian A, Tamayo P, Mootha VK,
Mukherjee S, Ebert BL, Gillette MA, Paulovich A, Pomeroy SL, Golub
TR, Lander ES and Mesirov JP: Gene set enrichment analysis: A
knowledge-based approach for interpreting genome-wide expression
profiles. Proc Natl Acad Sci USA. 102:15545–15550. 2005. View Article : Google Scholar : PubMed/NCBI
|
|
26
|
Aibar S, González-Blas CB, Moerman T,
Huynh-Thu VA, Imrichova H, Hulselmans G, Rambow F, Marine JC,
Geurts P, Aerts J, et al: SCENIC: Single-cell regulatory network
inference and clustering. Nat Methods. 14:1083–1086. 2017.
View Article : Google Scholar : PubMed/NCBI
|
|
27
|
Bao MM, Kennedy JM, Dolinger MT, Dunkin D,
Lai J and Dubinsky MC: Cytomegalovirus colitis in a patient with
severe treatment refractory ulcerative colitis. Crohns Colitis 360.
6:otae0142024. View Article : Google Scholar : PubMed/NCBI
|
|
28
|
Menyhárt O, Nagy Á and Győrffy B:
Determining consistent prognostic biomarkers of overall survival
and vascular invasion in hepatocellular carcinoma. R Soc Open Sci.
5:1810062018. View Article : Google Scholar : PubMed/NCBI
|
|
29
|
Livak KJ and Schmittgen TD: Analysis of
relative gene expression data using real-time quantitative PCR and
the 2(−Delta Delta C(T)) method. Methods. 25:402–408. 2001.
View Article : Google Scholar : PubMed/NCBI
|
|
30
|
Traag VA, Waltman L and van Eck NJ: From
louvain to leiden: Guaranteeing well-connected communities. Sci
Rep. 9:52332019. View Article : Google Scholar : PubMed/NCBI
|
|
31
|
Zhang Q, He Y, Luo N, Patel SJ, Han Y, Gao
R, Modak M, Carotta S, Haslinger C, Kind D, et al: Landscape and
dynamics of single immune cells in hepatocellular carcinoma. Cell.
179:829–845.e20. 2019. View Article : Google Scholar : PubMed/NCBI
|
|
32
|
Jia C, Ma Y, Wang M, Liu W, Tang F and
Chen J: Evidence of omics, immune infiltration, and
pharmacogenomics for BATF in a pan-cancer cohort. Front Mol Biosci.
9:8447212022. View Article : Google Scholar : PubMed/NCBI
|
|
33
|
Lauer S and Gresham D: An evolving view of
copy number variants. Curr Genet. 65:1287–1295. 2019. View Article : Google Scholar : PubMed/NCBI
|
|
34
|
Sodek J, Chen J, Nagata T, Kasugai S,
Todescan R Jr, Li IW and Kim RH: Regulation of osteopontin
expression in osteoblasts. Ann N Y Acad Sci. 760:223–241. 1995.
View Article : Google Scholar : PubMed/NCBI
|
|
35
|
Sato Y, Harada K, Sasaki M and Nakanuma Y:
Clinicopathological significance of S100 protein expression in
cholangiocarcinoma. J Gastroenterol Hepatol. 28:1422–1429. 2013.
View Article : Google Scholar : PubMed/NCBI
|
|
36
|
Yang Z, Jin Q, Hu W, Dai L, Xue Z, Man D,
Zhou L, Xie H, Wu J and Zheng S: 14-3-3σ downregulation suppresses
ICC metastasis via impairing migration, invasion, and anoikis
resistance of ICC cells. Cancer Biomark. 19:313–325. 2017.
View Article : Google Scholar : PubMed/NCBI
|
|
37
|
Kumar MP, Du J, Lagoudas G, Jiao Y, Sawyer
A, Drummond DC, Lauffenburger DA and Raue A: Analysis of
single-cell RNA-Seq identifies cell-cell communication associated
with tumor characteristics. Cell Rep. 25:1458–1468.e4. 2018.
View Article : Google Scholar : PubMed/NCBI
|
|
38
|
Richardson JR, Schöllhorn A, Gouttefangeas
C and Schuhmacher J: CD4+ T cells: Multitasking cells in the duty
of cancer immunotherapy. Cancers (Basel). 13:5962021. View Article : Google Scholar : PubMed/NCBI
|
|
39
|
Kim HJ and Cantor H: CD4 T-cell subsets
and tumor immunity: The helpful and the not-so-helpful. Cancer
Immunol Res. 2:91–98. 2014. View Article : Google Scholar : PubMed/NCBI
|
|
40
|
Tay RE, Richardson EK and Toh HC:
Revisiting the role of CD4+ T cells in cancer
immunotherapy-new insights into old paradigms. Cancer Gene Ther.
28:5–17. 2021. View Article : Google Scholar : PubMed/NCBI
|
|
41
|
Aizarani N, Saviano A, Sagar, Mailly L,
Durand S, Herman JS, Pessaux P, Baumert TF and Grün D: A human
liver cell atlas reveals heterogeneity and epithelial progenitors.
Nature. 572:199–204. 2019. View Article : Google Scholar : PubMed/NCBI
|
|
42
|
Kang K, Wang X, Meng C, He L, Sang X,
Zheng Y and Xu H: The application of single-cell sequencing
technology in the diagnosis and treatment of hepatocellular
carcinoma. Ann Transl Med. 7:7902019. View Article : Google Scholar : PubMed/NCBI
|
|
43
|
Shroff RT and Bachini M: Treatment options
for biliary tract cancer: Unmet needs, new targets and
opportunities from both physicians' and patients' perspectives.
Future Oncol. 20:1435–1450. 2024. View Article : Google Scholar : PubMed/NCBI
|
|
44
|
Vincelette ND, Yu X, Kuykendall AT, Moon
J, Su S, Cheng CH, Sammut R, Razabdouski TN, Nguyen HV, Eksioglu
EA, et al: Trisomy 8 defines a distinct subtype of
myeloproliferative neoplasms driven by the MYC-alarmin axis. Blood
Cancer Discov. 5:276–297. 2024. View Article : Google Scholar : PubMed/NCBI
|
|
45
|
Popek-Marciniec S, Styk W,
Wojcierowska-Litwin M, Chocholska S, Szudy-Szczyrek A,
Samardakiewicz M, Swiderska-Kolacz G, Czerwik-Marcinkowska J and
Zmorzynski S: Association of chromosome 17 aneuploidy, TP53
deletion, expression and Its rs1042522 variant with multiple
myeloma risk and response to thalidomide/bortezomib treatment.
Cancers (Basel). 15:47472023. View Article : Google Scholar : PubMed/NCBI
|
|
46
|
Hallek M and Al-Sawaf O: Chronic
lymphocytic leukemia: 2022 Update on diagnostic and therapeutic
procedures. Am J Hematol. 96:1679–1705. 2021. View Article : Google Scholar : PubMed/NCBI
|
|
47
|
Wang F, Luo M, Qu H and Cheng Y: BAP1
promotes viability and migration of ECA109 cells through
KLF5/CyclinD1/FGF-BP1. FEBS Open Bio. 11:1497–1503. 2021.
View Article : Google Scholar : PubMed/NCBI
|
|
48
|
Zhang Y, Du W, Chen Z and Xiang C:
Upregulation of PD-L1 by SPP1 mediates macrophage polarization and
facilitates immune escape in lung adenocarcinoma. Exp Cell Res.
359:449–457. 2017. View Article : Google Scholar : PubMed/NCBI
|
|
49
|
Cai X, Zhang H and Li T: The role of SPP1
as a prognostic biomarker and therapeutic target in head and neck
squamous cell carcinoma. Int J Oral Maxillofac Surg. 51:732–741.
2022. View Article : Google Scholar : PubMed/NCBI
|
|
50
|
Song Z, Chen W, Athavale D, Ge X, Desert
R, Das S, Han H and Nieto N: Osteopontin takes center stage in
chronic liver disease. Hepatology. 73:1594–1608. 2021. View Article : Google Scholar : PubMed/NCBI
|
|
51
|
Morse C, Tabib T, Sembrat J, Buschur KL,
Bittar HT, Valenzi E, Jiang Y, Kass DJ, Gibson K, Chen W, et al:
Proliferating SPP1/MERTK-expressing macrophages in idiopathic
pulmonary fibrosis. Eur Respir J. 54:18024412019. View Article : Google Scholar : PubMed/NCBI
|
|
52
|
Liu L, Zhang R, Deng J, Dai X, Zhu X, Fu
Q, Zhang H, Tong Z, Zhao P, Fang W, et al: Construction of TME and
Identification of crosstalk between malignant cells and macrophages
by SPP1 in hepatocellular carcinoma. Cancer Immunol Immunother.
71:121–136. 2022. View Article : Google Scholar : PubMed/NCBI
|
|
53
|
Storrs EP, Chati P, Usmani A, Sloan I,
Krasnick BA, Babbra R, Harris PK, Sachs CM, Qaium F, Chatterjee D,
et al: High-dimensional deconstruction of pancreatic cancer
identifies tumor microenvironmental and developmental stemness
features that predict survival. NPJ Precis Oncol. 7:1052023.
View Article : Google Scholar : PubMed/NCBI
|
|
54
|
Nallasamy P, Nimmakayala RK, Karmakar S,
Leon F, Seshacharyulu P, Lakshmanan I, Rachagani S, Mallya K, Zhang
C, Ly QP, et al: Pancreatic tumor microenvironment factor promotes
cancer stemness via SPP1-CD44 axis. Gastroenterology.
161:1998–2013.e7. 2021. View Article : Google Scholar : PubMed/NCBI
|
|
55
|
Zheng Y, Zhao L, Xiong Z, Huang C, Yong Q,
Fang D, Fu Y, Gu S, Chen C, Li J, et al: Ursolic acid targets
secreted phosphoprotein 1 to regulate Th17 cells against metabolic
dysfunction-associated steatotic liver disease. Clin Mol Hepatol.
30:449–467. 2024. View Article : Google Scholar : PubMed/NCBI
|
|
56
|
Shevde LA and Samant RS: Role of
osteopontin in the pathophysiology of cancer. Matrix Biol.
37:131–141. 2014. View Article : Google Scholar : PubMed/NCBI
|
|
57
|
Yan Z, Hu X, Tang B and Deng F: Role of
osteopontin in cancer development and treatment. Heliyon.
9:e210552023. View Article : Google Scholar : PubMed/NCBI
|
|
58
|
Zhao H, Chen Q, Alam A, Cui J, Suen KC,
Soo AP, Eguchi S, Gu J and Ma D: The role of osteopontin in the
progression of solid organ tumour. Cell Death Dis. 9:3562018.
View Article : Google Scholar : PubMed/NCBI
|
|
59
|
Kawamura K, Iyonaga K, Ichiyasu H, Nagano
J, Suga M and Sasaki Y: Differentiation, maturation, and survival
of dendritic cells by osteopontin regulation. Clin Diagn Lab
Immunol. 12:206–212. 2005.PubMed/NCBI
|
|
60
|
Cui G, Chen J, He J, Lu C, Wei Y, Wang L,
Xu X, Li L, Uede T and Diao H: Osteopontin promotes dendritic cell
maturation and function in response to HBV antigens. Drug Des Devel
Ther. 9:3003–3016. 2015.PubMed/NCBI
|
|
61
|
Wen Y, Feng D, Wu H, Liu W, Li H, Wang F,
Xia Q, Gao WQ and Kong X: Defective initiation of liver
regeneration in osteopontin-deficient mice after partial
hepatectomy due to insufficient activation of IL-6/Stat3 pathway.
Int J Biol Sci. 11:1236–1247. 2015. View Article : Google Scholar : PubMed/NCBI
|
|
62
|
Liu Y, Zhang L, Ju X, Wang S and Qie J:
Single-cell transcriptomic analysis reveals macrophage-tumor
crosstalk in hepatocellular carcinoma. Front Immunol.
13:9553902022. View Article : Google Scholar : PubMed/NCBI
|
|
63
|
He C, Sheng L, Pan D, Jiang S, Ding L, Ma
X, Liu Y and Jia D: Single-cell transcriptomic analysis revealed a
critical role of SPP1/CD44-mediated crosstalk between macrophages
and cancer cells in glioma. Front Cell Dev Biol. 9:7793192021.
View Article : Google Scholar : PubMed/NCBI
|
|
64
|
Cheng M, Liang G, Yin Z, Lin X, Sun Q and
Liu Y: Immunosuppressive role of SPP1-CD44 in the tumor
microenvironment of intrahepatic cholangiocarcinoma assessed by
single-cell RNA sequencing. J Cancer Res Clin Oncol. 149:5497–5512.
2023. View Article : Google Scholar : PubMed/NCBI
|