Introduction
Thyroid cancer (TC) is a common endocrine malignancy
comprising anaplastic thyroid carcinomas (ATC), medullary thyroid
carcinoma and differentiated thyroid carcinoma (DTC) (1). Globally, there are ~586,202 new cases
of TC and 43,646 deaths associated with it, ranking ninth in
incidence among all cancers. Furthermore, it is expected to
overtake colorectal cancer as the fourth most prevalent cancer in
the USA by 2030 (2,3). Among the subtypes of TC, DTC accounts
for ~95% of cases and generally has a favorable prognosis, whereas
ATC is rare but aggressive, with a median survival of <6 months
(4).
Radioactive iodine ablation continues to be the
primary treatment for TC (5);
however, it is ineffective in all ATC cases and in ~10% of DTC
cases (5). This is due to
resistance caused by changes in the MAPK and PI3K pathways, as well
as mutations or rearrangements in B-Raf proto-oncogene,
serine/threonine kinase, neurotrophic receptor tyrosine kinase,
telomerase reverse transcriptase, RAS proto-oncogene, GTPase,
anaplastic lymphoma kinase and ret proto-oncogene in ATC and DTC,
which serve as important diagnostic and prognostic markers for TC
(4,6). Targeted inhibitors against these
biomarkers, such as sorafenib, lenvatinib and vemurafenib, have
thus become promising strategies for treating ATC and DTC; however,
targeted therapies face challenges, including limited
effectiveness, drug resistance and serious side effects (4,6).
Therefore, further research into TC molecular mechanisms is
necessary to develop more effective targeted treatment
strategies.
Inducing tumor cell death is a fundamental aspect of
developing cancer treatments. For decades, apoptosis, pyroptosis
and necroptosis were regarded as separate cell death pathways. More
recently, PANoptosis has been described as an integrated
inflammatory cell death process involving crosstalk among
pyroptosis, apoptosis and necroptosis, coordinated by multiprotein
complexes called PANoptosomes (7–11).
PANoptosis begins when pathogen- and damage-associated molecular
patterns activate the pattern recognition receptors Z-DNA-binding
protein 1 (ZBP1) and absent in melanoma 2 (AIM2). Once activated,
ZBP1 and AIM2 recruit adaptor proteins with protein-interaction
domains to form PANoptosomes, which contain key effectors of
apoptosis, pyroptosis and necroptosis, including caspase
(CASP)1/3/8/9, dasdermin D, receptor interacting serine/threonine
kinase 3 (RIPK3) and mixed lineage kinase domain like pseudokinase
(MLKL). Within these structures, the coordinated action of these
effectors causes rupture of the plasma membrane and organelle
membranes, initiating cascades of inflammatory and immune
responses. Notably, PANoptosis has been associated with several
malignancies, including esophageal cancer (12), melanoma (13), adrenocortical carcinoma (14) and diffuse large B-cell lymphoma
(15). Specifically, sulconazole
has been reported to increase the radiosensitivity of esophageal
cancer by inducing PANoptosis (12). Adenosine deaminase RNA specific 1
and CDK1 also facilitate tumor burden in colorectal cancer,
melanoma and adrenocortical carcinoma by suppressing ZBP1-mediated
PANoptosis (13,14). Furthermore, suppression of SAM and
HD domain containing deoxynucleoside triphosphate
triphosphohydrolase 1 has been reported to stimulate PANoptosis by
activating stimulator of interferon response CGAMP interactor,
which effectively alleviates diffuse large B-cell lymphoma
(15). Its role in influencing the
tumor immune microenvironment emphasizes its potential for therapy.
Nonetheless, the regulatory mechanisms and critical molecular
factors governing PANoptosis in TC are still unknown, marking a
substantial gap in current knowledge.
The transferrin receptor (TFRC) is a transmembrane
glycoprotein dimer widely expressed on the cell membrane and mainly
involved in cellular iron uptake (16). Due to its role in iron homeostasis,
TFRC has been reported to promote ferroptosis in several cancers,
including TC (17–19), endometrial carcinoma (20), colorectal carcinoma (21), hepatocellular carcinoma (22) and gastric carcinoma (23). For example, high TFRC expression has
been reported to predict a worse prognosis in patients with TC,
compared with low TFRC expression (17,18),
and it interacts with longevity assurance homolog 2 to promote
ferroptosis in TC (19). In
addition to ferroptosis, TFRC has been associated with numerous
cell death types such as apoptosis, pyroptosis, cuproptosis,
autophagy and necrosis (24–26).
Specifically, TFRC promotes PTEN induced kinase 1 (PINK1)-parkin
RBR E3 ubiquitin protein ligase-dependent mitochondrial autophagy
and apoptosis in anaplastic large cell lymphoma (24). Notably, TFRC-mediated cell death
displays features similar to PANoptosis. Overall, the
aforementioned studies imply that TFRC could serve as a molecular
regulator of PANoptosis.
The present study aimed to identify biomarkers
associated with ZBP1 and AIM2 expression in the TCGA-THCA cohort
and determine their prognostic value in TC. Furthermore, the
present study intended to investigate the utility of the prognostic
biomarker as a target in TC and of the expression of ZBP1 and AIM2
on PANoptosis using in vitro experiments and to characterize
the molecular mechanisms that may be involved with this target
using mRNA-seq. It aims to provide a new perspective and a solid
experimental basis for the development of therapeutic strategies
related to PANoptosis in TC.
Materials and methods
PANoptosis-related bioinformatics
analysis
The TCGA-THCA dataset was obtained from TCGA
(https://portal.gdc.cancer.gov), which
includes 571 samples with clinical data from the study by Liu et
al (27). The dataset features
RNA-sequencing (RNA-seq) expression profiles (transcripts per
million format) of 59 paracancerous samples and 507 tumor samples.
Pearson correlation analysis identified coding genes associated
with ZBP1 and AIM2 expression across 571 RNA-seq datasets. Coding
genes with an adjusted P-value (P.adj) <0.05 were determined to
be significantly associated with ZBP1 and AIM2 expression. The
clusterProfiler package (v4.4.4) (28) in R was used to perform Gene Ontology
(GO) and Kyoto Encyclopedia of Genes and Genomes (KEGG) enrichment
analysis of these co-associated coding genes to assess their roles
in molecular composition, biological processes, molecular functions
and signaling pathways. The STRING database (29) and Cytoscape software (v3.7.2)
(30) were used to construct and
visualize the protein-protein interaction (PPI) networks of ZBP1-
and AIM2-associated coding genes, and the resulting PPIs were
analyzed using the Network Analysis and MCODE (31) apps within Cytoscape software.
Finally, the survival package (v3.3.1) (32) in R software was used to performed
log-rank tests and univariate and multivariate Cox regression
analyses to assess the associations between ZBP1- and
AIM2-associated coding genes and patient prognosis in TC.
Culture and transfection of TC
cells
Normal human thyroid cells (Nthy) and TC cell lines
(K1, TPC-1 and BCPAP) were purchased from Procell Life Science
& Technology Co., Ltd. and Wuhan SAIOS Biotechnology Co., Ltd.
All cell lines underwent DNA amplification using the 21-short
tandem repeat (STR) profiling protocol, followed by detection of
STR loci and the sex-determining gene Amelogenin on a
SeqStudio™ Genetic Analyzer (Thermo Fisher Scientific,
Inc.). DNA profiles of Nthy, K1, TPC-1 and BCPAP cells matched
reference profiles of cell lines in the ExPASy database (https://www.expasy.org/), with accession numbers
CVCL-2659, CVCL-2537, CVCL-6298 and CVCL-0153, respectively.
Nthy, TPC-1 and BCPAP cells were cultured in RPMI
1640 medium (cat. no. 61870-127; Gibco; Thermo Fisher Scientific,
Inc.) supplemented with 1% double antibodies (cat. no. PB180120;
Procell Life Science & Technology Co., Ltd.) and 10% FBS (cat.
no. 12003C; Merck KGaA) at 5% CO2 and 37°C, whereas K1
cells were maintained in Ham's F-12K medium (cat. no. 21127-022;
Gibco; Thermo Fisher Scientific, Inc.) at 5% CO2 and
37°C.
For genetic manipulation, Genomeditech (Shanghai)
Co., Ltd. synthesized short hairpin (sh)RNA constructs targeting
TFRC for knockdown and provided the
PGMLV-CMV-MCS-EF1-ZsGreen1-T2A-Puro plasmid for overexpression of
TFRC. The shRNA sequences targeting TFRC used were as
follows: 5′-CGTGAATTTAAACTCAGCAAA-3′ (shRNA sense #1);
5′-TTTGCTGAGTTTAAATTCACG-3′ (shRNA antisense #1);
5′-GCCAGCTTTACTGGAGAACTT-3′ (shRNA sense #2);
5′-AAGTTCTCCAGTAAAGCTGGC-3′ (shRNA antisense #2);
5′-GCTGGTCAGTTCGTGATTAAA-3′ (shRNA sense #3);
5′-TTTAATCACGAACTGACCAGC-3′ (shRNA antisense #3);
5′-TTCTCCGAACGTGTCACGT-3′ [negative control (NC) sense]; and
5′-ACGTGACACGTTCGGAGAA-3′ (NC antisense). BCPAP cells were
randomized into overexpression control (OV-NC) and overexpression
of TFRC (OV-TFRC) groups, whilst K1 cells were randomized into
knockdown control (KD-NC) and knockdown of TFRC (KD-TFRC) groups.
Transfections were performed using Lipo8000™
transfection reagent (cat. no. C0533-7.5 ml; Beyotime Institute of
Biotechnology), with BCPAP cells transfected with TFRC
overexpression plasmid or its NC (blank
PGMLV-CMV-MCS-EF1-ZsGreen1-T2A-Puro plasmid) and K1 cells
transfected with TFRC shRNA or its NC (oligo control).
Cellular PANoptosis-related staining
assays
The PI/Calcein-AM Double Staining Kit (cat. no.
CA1630; Beijing Solarbio Science & Technology Co., Ltd.) and
Apoptosis and Necrosis Detection Kit with YO-PRO-1 and PI Kit (cat.
no. C1075S; Beyotime Institute of Biotechnology) were used to
assess PANoptosis in BCPAP and K1 cells. For PI/Calcein-AM
staining, BCPAP and K1 cells were adjusted to a concentration of
1×10⁵ cells/ml using 1X assay buffer and incubated with
Calcein-AM for 25 min at 37°C, followed by PI for 5 min at 37°C.
For YO-PRO-1/PI staining, PBS-washed BCPAP and K1 cells
(5×10⁴ cells/ml) were inoculated in 24-well plates, and
100 µl YO-PRO-1 and PI staining was added to each well for 20 min
at 37°C. Representative images of PI/Calcein-AM and YO-PRO-1/PI
staining were captured using a BX53 fluorescence microscope
(Olympus Corp.). Excitation filters were set at 535 nm for PI
(red), 495 nm for Calcein-AM (green) and 491 nm for YO-PRO-1
(green), enabling the detection of apoptosis/necroptosis, viable
cells and necroptosis/pyroptosis, respectively.
Western blot assay for PANoptosis
markers
Total proteins were extracted from BCPAP and K1
cells using RIPA lysis buffer (cat. no. C500005; Sangon Biotech
Co., Ltd.). Protein concentrations were determined using a BCA
Protein Colorimetric Assay Kit (cat. no. E-BC-K318-M;
Elabscience®; Elabscience Bionovation Inc.), separated
using a 5 and 10% SDS-PAGE gel kit (cat. no. P1200; Beijing
Solarbio Science & Technology Co., Ltd.) and transferred onto
PVDF membranes (cat. no. 88520; Thermo Fisher Scientific, Inc.).
The mass of protein loaded per lane was 20 µg. Membranes were
blocked with 5% skimmed milk at room temperature for 1 h and
incubated with the following primary antibodies overnight at 4°C:
Vinculin mouse mAb (1:50,000; cat. no. 66305-1-Ig; Proteintech
Group, Inc.), CASP3 mouse mAb (1:2,000; cat. no. bsm-33284M;
BIOSS), cleaved-CASP3 mouse mAb (1:2,000; cat. no. bsm-33199M;
BIOSS), CASP1 rabbit pAb (1:2,000; cat. no. 22915-1-AP; Proteintech
Group, Inc.), cleaved-CASP1 rabbit pAb (1:3,000; cat. no.
PA5-77886; Thermo Fisher Scientific, Inc.), phospho-(p)MLKL rabbit
pAb (1:2,000; cat. no. PA5-105677; Thermo Fisher Scientific, Inc.),
total-(t)MLKL mouse mAb (1:50,000; cat. no. 66675-1-Ig; Proteintech
Group, Inc.) and tRIPK3 rabbit pAb (1:10,000; cat. no. 29080-1-AP;
Proteintech Group, Inc.). Membranes were incubated with the
following secondary antibodies at room temperature for 2 h: Goat
anti-mouse IgG HRP (1:4,000; cat. no. M21001L; Abmart, Inc.) and
goat anti-rabbit IgG HRP (1:4,000; cat. no. M21002L; Abmart, Inc.).
After visualization with an ECL detection kit (cat. no. 34580;
Thermo Fisher Scientific, Inc.), images of membranes were captured
using the GelDoc Go Gel Imaging System (Bio-Rad Laboratories,
Inc.), and band intensities were semi-quantified using ImageJ 1.0
software (National Institutes of Health).
Reverse transcription-quantitative PCR
(RT-qPCR) assay for TFRC and hub genes
Total RNA was extracted from BCPAP and K1 cells
using TRIzol™ lysis buffer (cat. no. 15596018CN;
Invitrogen™; Thermo Fisher Scientific, Inc.) and
chloroform, followed by RNA concentration measurement using a
NanoDrop™ 8000 Spectrophotometer (cat. no. ND-8000-GL;
Thermo Fisher Scientific, Inc.). Reverse transcription of RNA and
amplification of the target gene were performed using the FastKing
RT Kit (cat. no. KR116; Tiangen Biotech Co., Ltd.) and Taq Pro
Universal SYBR qPCR Master Kit (cat. no. Q712; Vazyme Biotech Co.,
Ltd.) on a 7500 PCR System (Thermo Fisher Scientific, Inc.). The
conditions for reverse transcription were as follows: Incubation at
42°C for 15 min, followed by heating at 95°C for 3 min. The thermal
cycling conditions for qPCR were as follows: Denaturation at 95°C
for 10 min, followed by annealing and extension at 95°C for 15 sec
and at 60°C for 30 sec, with 45 cycles. The relative expression
level of the target gene relative to GAPDH is calculated using the
2−ΔΔCq method (33). The
following primer sequences were used: 5′-TTGCCCTCAACGACCACTTT-3′
[GAPDH-forward (F)]; 5′-TGGTCCAGGGGTCTTACTCC-3′ [GAPDH-reverse
(R)]; 5′-ATCTTGCGTTGTATGTTG-3′ (TFRC-F); 5′-AGTCTACCGTTCTTATCAA-3′
(TFRC-R); 5′-TCTACCTCTGTGATAACCT-3′ (CD34-F);
5′-TGAACACTGTGCTGATTA-3′ (CD34-R); 5′-GATGATGTCTTCCTTAGTGTT-3′
[lactate dehydrogenase A (LDHA)-F]; 5′-AGTCAGAGTCACCTTCAC-3′
(LDHA-R); 5′-GAAGAACTGGCGGCTTAA-3′ [low-density lipoprotein
receptor (LDLR)-F]; 5′-CCTCATCCTCTGTGGTCT-3′ (LDLR-R);
5′-TAAGACAATAGAGGTATTCTG-3′ [adaptor related protein complex 1
subunit µ 2 (AP1M2-F]; 5′-GTAGACGATGACAAAGTT-3′ (AP1M2-R);
5′-CAGAATGATGATATTGGAAGTAGA-3′ [diaphanous related formin 3
(DIAPH3)-F]; 5′-CAGGTTCACATAAGTTGCTAT-3′ (DIAPH3-R);
5′-AGATGCTGCCAATAACTATG-3′ [tubulin α 1b (TUBA1B)-F];
5′-AATTCGGTCCAACACAAG-3′ (TUBA1B-R); 5′-AACAACATTCGTAACTCTC-3′
[citron ρ-interacting serine/threonine kinase (CIT)-F];
5′-TTCTTCTCTGGTTCATCA-3′ (CIT-R); 5′-CAACCTCGTAGACTCCTA-3′ [dynamin
3 (DNM3)-F]; 5′-TCCTCTGAAGAATACAACTG-3′ (DNM3-R);
5′-CGAAGAGGAATTGAGAACTACTAT-3′ [tetraspanin 15 (TSPAN15)-F];
5′-GCCACAGCACTTGAACTT-3′ (TSPAN15-R); 5′-GATTACTATGGTCACTTG-3′ [DEP
domain containing 1B (DEPDC1B)-F]; 5′-CATCATCCTCATCAATAG-3′
(DEPDC1B-R); 5′-GACCACTACCTAACTCAG-3′ [IQ motif containing GTPase
activating protein 3 (IQGAP3)-F]; 5′-GCATCATCAACAACTTCTA-3′
(IQGAP3-R); 5′-AACAACAACTGGAACTTCAA-3′ (CD24-F);
5′-CTTGGTGGTGGCATTAGT-3′ (CD24-R); 5′-ATTAACCACTATCACCAT-3′
[phosphoinositide-3-kinase regulatory subunit 3 (PIK3R3)-F]; and
5′-TATTCTTCATACAGCCTAT-3′ (PIK3R3-R).
TFRC-related mRNA-seq and
bioinformatics analysis
Shanghai OE Biotech Co., Ltd performed sequencing of
K1 cells from the KD-NC and KD-TFRC groups, including total RNA
extraction, quality control, library construction, mRNA-seq on a
sequencing platform (NovaSeq 6000; Illumina, Inc.) and subsequent
bioinformatics analysis. Total RNA was extracted using the TRIzol
reagent (15596026CN; Thermo Fisher Scientific, Inc.). RNA purity
and quantification were evaluated using a spectrophotometer
(NanoDrop 2000; Thermo Fisher Scientific, Inc.). RNA integrity was
assessed using a Bioanalyzer (Agilent 2100; Agilent, Inc.). The
libraries were then constructed using the VAHTS Universal V6
RNA-seq Library Prep Kit (NR616; Vazyme Biotech Co., Ltd.). The
libraries were sequenced on a Novaseq 6000 sequencing platform and
150 bp paired-end reads were generated. For quality control, RseQC
(v4.0.0) (34), fastp (v0.20.1)
(35), hisat2 (v2.1.0) (36) and htseq-count (v0.11.2) (37) were applied to perform RNA integrity
assessment, raw read quality filtering, base-level quality control,
genome alignment and gene quantification, respectively. A total of
41.70 G clean data was generated from six K1 cell samples, with Q30
base range from 93.99–94.24%. Clean reads were mapped to the
GRCh38.p13 reference genome with alignment rates of 97.81–98.13%.
For downstream analysis, DESeq2 (v1.22.2) (38) was used to identify TFRC-associated
differentially expressed (DE)-mRNAs; clusterProfiler (v4.4.4)
(28) for GO, KEGG and gene set
enrichment analysis (GSEA) enrichment analyses; ggplot (v3.3.6)
(39) for data visualization; and
the Network Analysis and MCODE (31) apps within Cytoscape software
(v3.7.2) for PPI network construction and analysis. The shared
genes between the ZBP1-related and the AIM2-related coding genes
were obtained using the jvenn Web (https://jvenn.toulouse.inra.fr/app/example.html).
Statistical analyses
All data were replicated at least three times, and
GraphPad Prism 9.0.0 software (Dotmatics) was used for statistical
analyses, including Student's t-test or Mann-Whitney test and
one-way ANOVA followed by Tukey's highly-significant differences
post-hoc test or the Kruskal-Wallis test followed by Dunn's
post-hoc test, as well as data visualization. Data were expressed
as mean ± standard deviation. Pearson correlation analysis was used
to identify coding genes associated with ZBP1 and AIM2 expression
in the TCGA-THCA dataset. P<0.05 was considered to indicate a
statistically significant difference.
Results
Identification and enrichment analysis
of ZBP1- and AIM2-related coding genes
ZBP1 and AIM2 are well-established sensors of
PANoptosis (7–11). To identify potential regulators of
this process in TC, the present study analyzed protein-coding genes
correlated with ZBP-1 and AIM2 expression in the TCGA-THCA cohort.
A total of 729 and 1,568 genes were demonstrated to be
significantly correlated with ZBP1 and AIM2 expression,
respectively (P.adj <0.05; Fig.
1A). Venn diagram analysis revealed that there were 315 shared
genes, including leucine aminopeptidase 3, CASP10, integrin subunit
α L, 5′-nucleotidase cytosolic IIIA (NT5C3A) and TFRC
(Fig. 1B). Functional enrichment
analysis indicated that these genes were enriched in membrane- and
vesicle-associated proteins, and were associated with ‘leukocyte
mediated immunity’, ‘response to tumor necrosis factor’, ‘extrinsic
apoptotic signaling pathway’, ‘immune receptor activity’ and ‘tumor
necrosis factor’ (Fig. 1C). They
were also enriched in pathways associated with ‘natural killer cell
mediated cytotoxicity’, ‘cytokine-cytokine receptor interaction’,
‘cell adhesion molecules’, ‘autoimmune thyroid disease’,
‘apoptosis’ and ‘necroptosis’ (Fig.
1D). Collectively, these findings suggest that, in TC, coding
genes associated with ZBP1 and AIM2 expression are primarily
involved in immunity processes, apoptosis, necroptosis and
cytokine-cytokine receptor interaction.
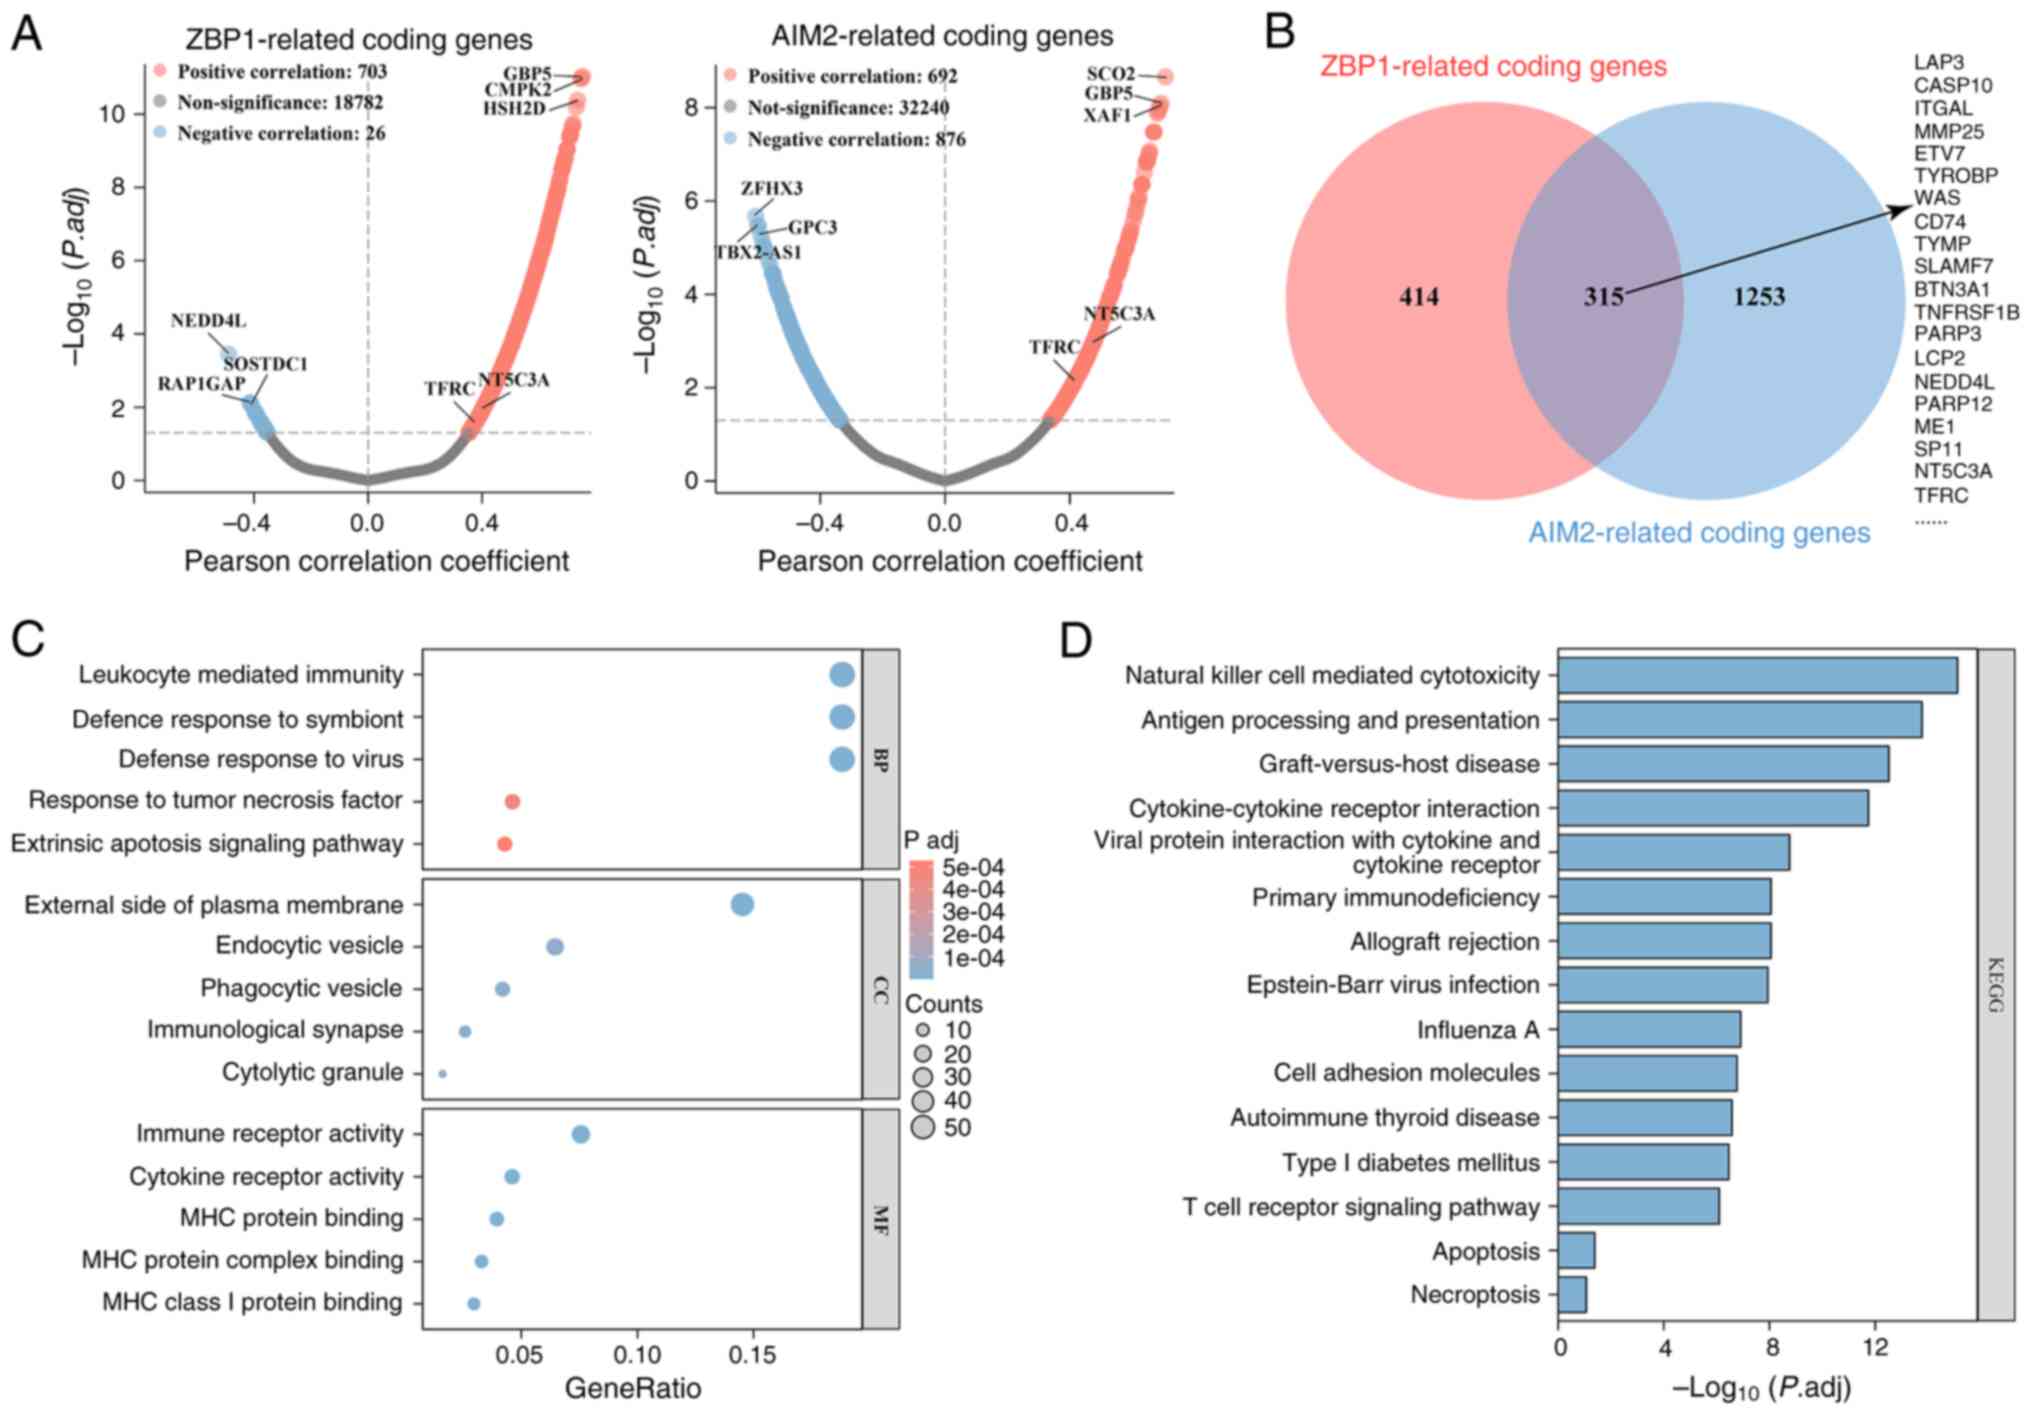 | Figure 1.Identification and enrichment
analysis of ZBP1- and AIM2-related coding genes. (A) Coding genes
associated with ZBP1 and AIM2 expression in The Cancer Genome
Atlas-Thyroid Cancer cohort were identified using Person
correlation analysis. The volcano plots exhibit the results, with
blue and red dots representing genes negatively and positively
correlated with ZBP1 or AIM2, respectively. (B) Overlap and union
of ZBP1- and AIM2-related coding genes, visualized using the jvenn
Web (https://jvenn.toulouse.inra.fr/app/example.html).
(C) Gene Ontology enrichment analysis of ZBP1- and AIM2-associated
coding genes. The bubble plot presents the top five terms for BP,
CC and MF. (D) KEGG pathway enrichment analysis of ZBP1- and
AIM2-related coding genes. The bar chart depicts the top 15
pathways ranked by-log10(P.adj). ZBP1, Z-DNA-binding
protein 1; AIM2, absent in melanoma 2; BP, biological process; CC,
cellular component; MF, molecular function; KEGG, Kyoto
Encyclopedia of Genes and Genomes. |
TFRC is associated with the prognosis
of TC
To further identify hub genes associated with ZBP-1
and AIM2 expression in TC, a PPI network of 315 coding genes was
constructed. This network contained 178 genes (nodes) and 608
relationship pairs (edges), using a minimum required interaction
score of 0.9 in the STRING database (Fig. 2A). Network analysis revealed that
the top five genes ranked by edge count were CD8A, interferon γ
(IFNG), interferon induced protein 44, signal transducer and
activator of transcription 1 (STAT1) and interferon-induced
15 KDa protein (ISG15), whereas the top five ranked by
indegree were STAT1, radical S-adenosyl methionine domain
containing 2, ubiquitin specific peptidase 18, ISG15 and
IFNG. To identify the key sub-networks, MCODE analysis was
performed, and 10 clusters (clustering score ≥3) were detected
(Fig. 2B). The sub-network with the
highest clustering score (14.267) contained 16 genes (nodes) and
107 relationship pairs (edges), and was enriched in biological
processes such as inflammatory response, apoptosis, oxidative
stress and immune response, as well as pathways such as Toll-like
receptor, retinoic acid-inducible gene-I-like receptor and
cytosolic DNA-sensing. Moreover, the present study screened the
genes associated with TC prognosis in this PPI network (178
genes/nodes). Univariate Cox analysis suggested that 15 coding
genes were significantly associated with the prognosis of patients
with TC. Furthermore, multivariate Cox analysis identified two
independent risk factors, including TFRC and NT5C3A (Table I). Log-rank analysis demonstrated
that low TFRC expression and high NT5C3A expression predicted
reduced overall survival in patients with TC within 5,000 days
(Fig. 2C). Consistently, TCGA-THCA
expression data revealed that TFRC was downregulated and NT5C3A
upregulated in TC tissues, compared with in normal tissues
(Fig. 2D). Notably, the expression
of TFRC and NT5C3A correlated positively with ZBP-1 and AIM2
(Fig. 1A). Although NT5C3A also
demonstrated significant association with patient survival, the
present study subsequently focused on TFRC due to its established
evidence across multiple cell death pathways, indicating greater
potential for mechanism exploration. For experimental validation,
TFRC expression was reduced in TC cell lines (TPC-1, K1 and BCPAP),
with the lowest expression observed in BCPAP cells (Fig. 2E), consistent with TCGA-THCA
profiles. Collectively, these findings suggest that TFRC functions
as a prognostic factor and a potential regulator of PANoptosis in
TC.
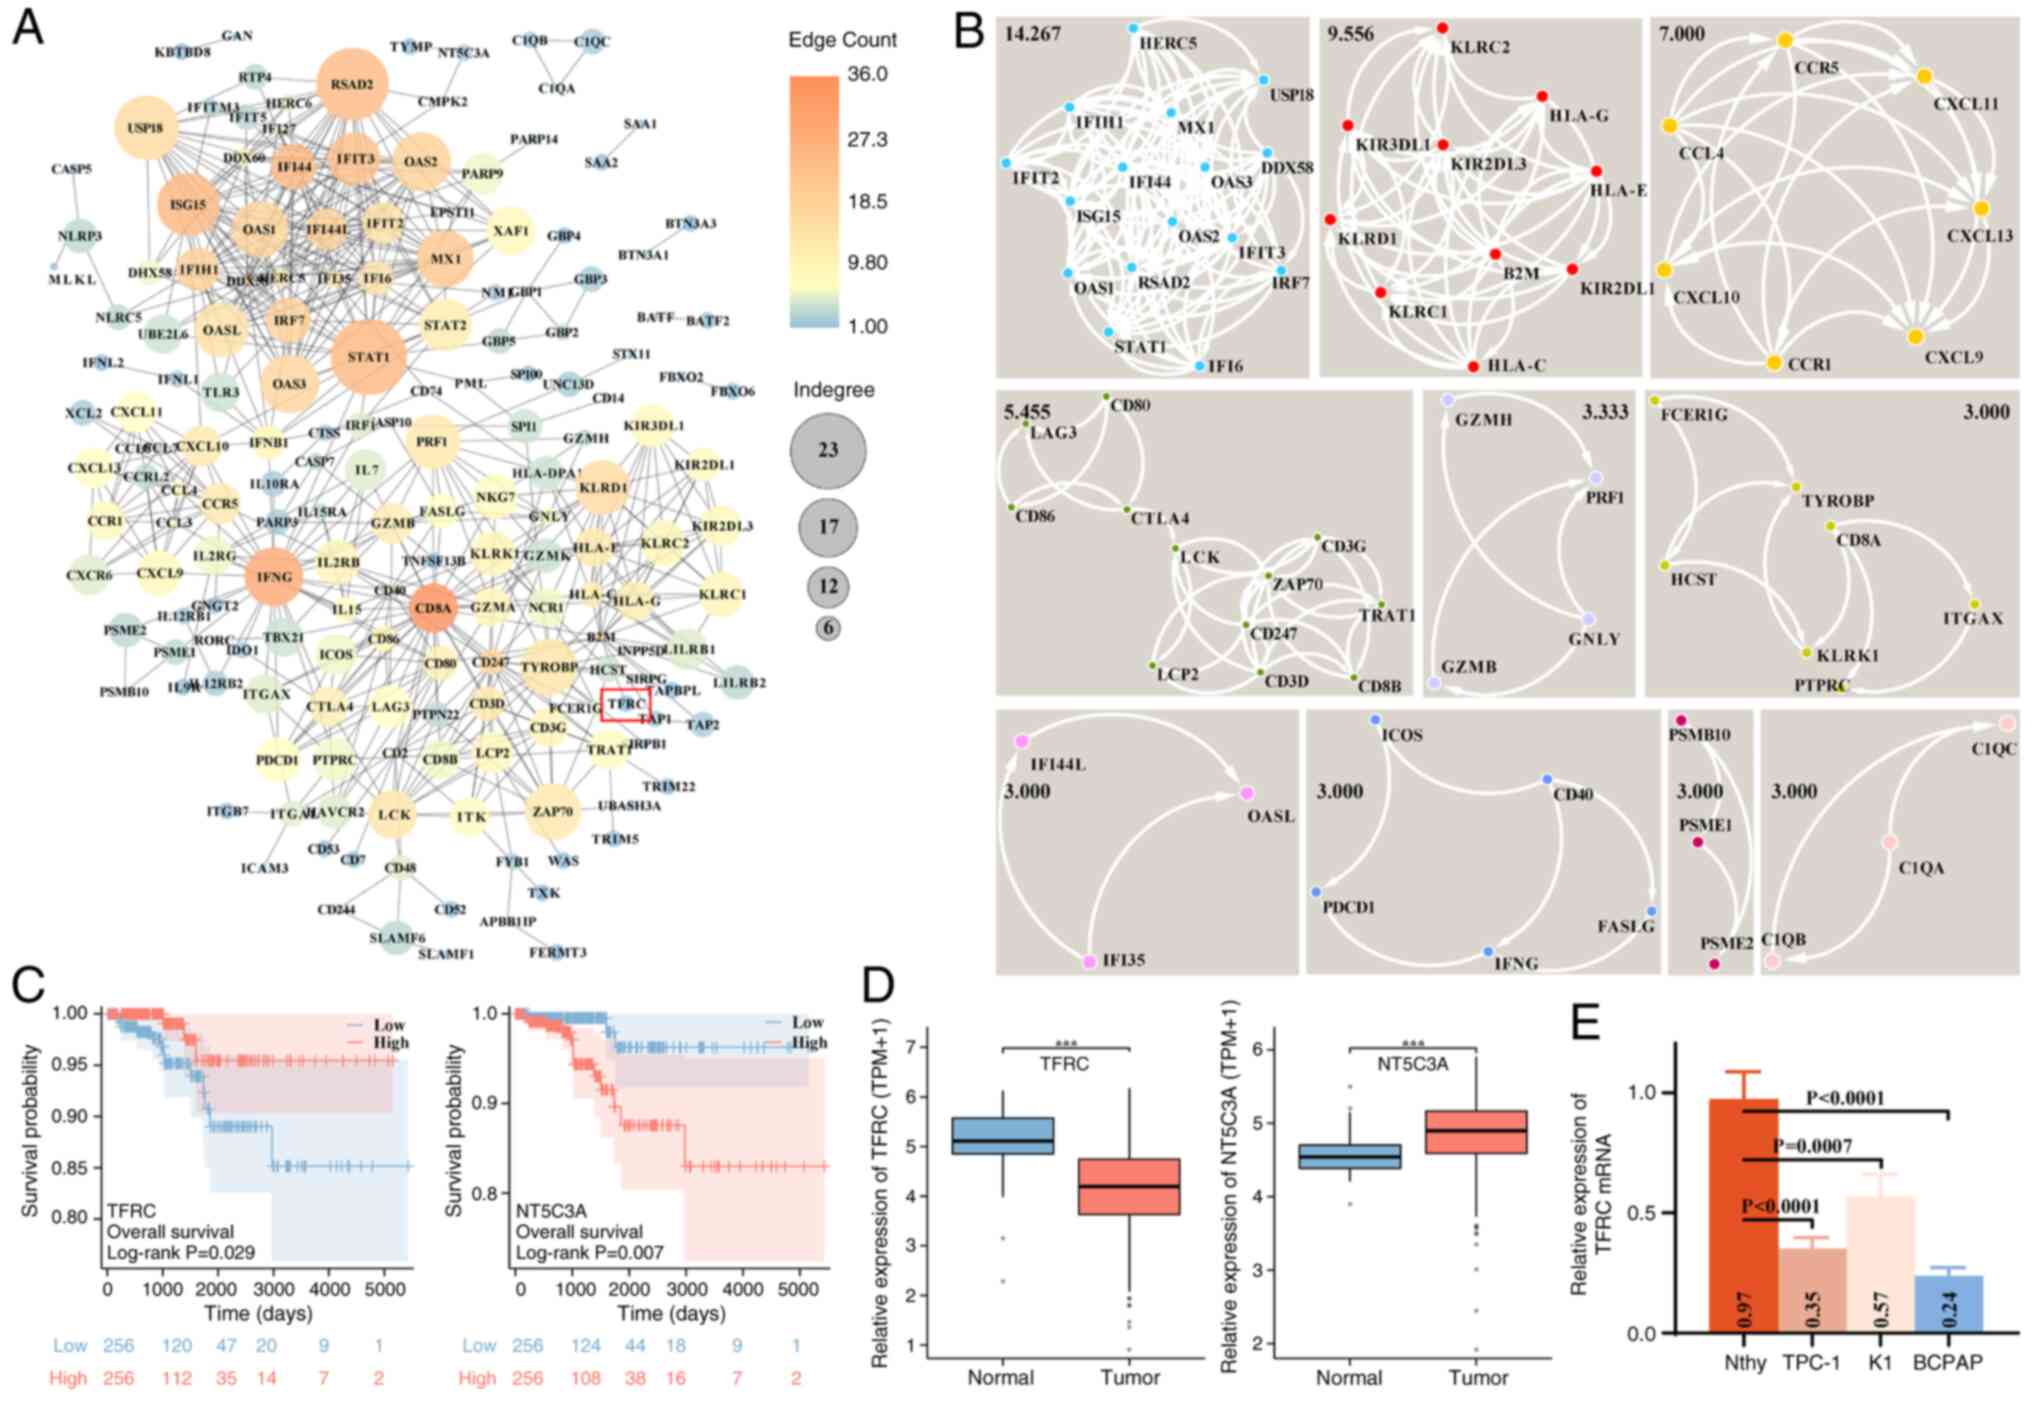 | Figure 2.PPI network construction of ZBP1- and
AIM2-related coding genes and prognostic analysis of hub genes in
TC. (A) PPI networks of ZBP1 and AIM2 co-associated genes,
constructed using the STRING database and visualized using
Cytoscape software. Node color and size indicate edge counts and
indegree, respectively. (B) Sub-networks within the PPI network
were identified using the MCODE app in Cytoscape software. Black
numbers denote the clustering scores of each sub-network. (C)
Prognostic significance of TFRC and NT5C3A expression in patients
with TC, evaluated using log-rank analysis in the TCGA-THCA cohort.
(D) Differential expression of TFRC and NT5C3A in the TCGA-THCA
cohort. (E) Relative TFRC mRNA expression in Nthy and TC cells
(TPC-1, K1 and BCPAP), assessed using reverse
transcription-quantitative PCR assay. ***P<0.001. PPI,
protein-protein interaction; ZBP1, Z-DNA-binding protein 1; AIM2,
absent in melanoma 2; TC, thyroid cancer; TFRC, transferrin
receptor; NT5C3A, 5′-nucleotidase cytosolic IIIA; TCGA-THCA, The
Cancer Genome Atlas-Thryoid Cancer; Nthy, normal human thyroid
epithelial; TPM, transcripts per million. |
 | Table I.Cox regression analysis of
Z-DNA-binding protein 1 and absent in melanoma 2 expression-related
coding genes in thyroid cancer. |
Table I.
Cox regression analysis of
Z-DNA-binding protein 1 and absent in melanoma 2 expression-related
coding genes in thyroid cancer.
|
| Univariate
analysis | Multivariate
analysis |
|---|
|
|
|
|
|---|
| Gene (low vs. high
expression) | HR (95% CI) | P-value | HR (95% CI) | P-value |
|---|
| ISG15 | 0.305
(0.098–0.949) | 0.040 | 1.339
(0.249–7.211) | 0.734 |
| IL2RB | 0.208
(0.059–0.732) | 0.014 | 0.521
(0.077–3.542) | 0.505 |
| PARP9 | 0.318
(0.102–0.988) | 0.048 | 0.723
(0.136–3.839) | 0.704 |
| IFIT2 | 0.320
(0.103–0.992) | 0.048 | 1.480
(0.305–7.176) | 0.626 |
| CXCL10 | 0.304
(0.098–0.942) | 0.039 | 1.062
(0.195–5.765) | 0.945 |
| CD8B | 0.318
(0.103–0.987) | 0.047 | 0.798
(0.193–3.300) | 0.755 |
| HLA-G | 0.215
(0.061–0.755) | 0.016 | 0.289
(0.055–1.525) | 0.143 |
| PSME2 | 0.246
(0.070–0.866) | 0.029 | 2.505
(0.350–17.920) | 0.360 |
| PSME1 | 0.073
(0.010–0.554) | 0.011 | 0.119
(0.010–1.416) | 0.092 |
| RTP4 | 0.144
(0.033–0.636) | 0.011 | 0.434
(0.063–3.006) | 0.398 |
| GBP2 | 0.279
(0.089–0.869) | 0.028 | 0.701
(0.147–3.350) | 0.656 |
| HERC6 | 0.280
(0.090–0.872) | 0.028 | 1.246
(0.255–6.082) | 0.786 |
| TFRC | 1.270
(1.077–1.949) | 0.041 | 1.146
(1.035–1.618) | 0.019 |
| NT5C3A | 4.773
(1.359–16.759) | 0.015 | 7.464
(1.387–40.175) | 0.009 |
| PARP14 | 0.206
(0.059–0.724) | 0.014 | 0.466
(0.078–2.781) | 0.402 |
TFRC facilitates PANoptosis for
TC
To further investigate the role of TFRC in
regulating PANoptosis in TC cells in vitro, the present
study performed in vitro functional experiments. TFRC was
overexpressed in BCPAP cells, which exhibit relatively low
endogenous TFRC expression, and silenced in K1 cells, which express
higher TFRC levels. RT-qPCR demonstrated that
PGMLV-CMV-MCS-EF1-ZsGreen1-T2A-Puro and shRNA effectively regulated
the level of TFRC mRNA in BCPAP and K1 cells (Fig. 3A and B). Calcein-AM/PI staining
revealed a marked increase in PI+ BCPAP cells in the
OV-TFRC group, whereas a notable decrease in PI+ K1
cells was observed in the KD-TFRC group, compared with their
respective controls (Fig. 3C).
These results indicate that TFRC facilitates TC cell death.
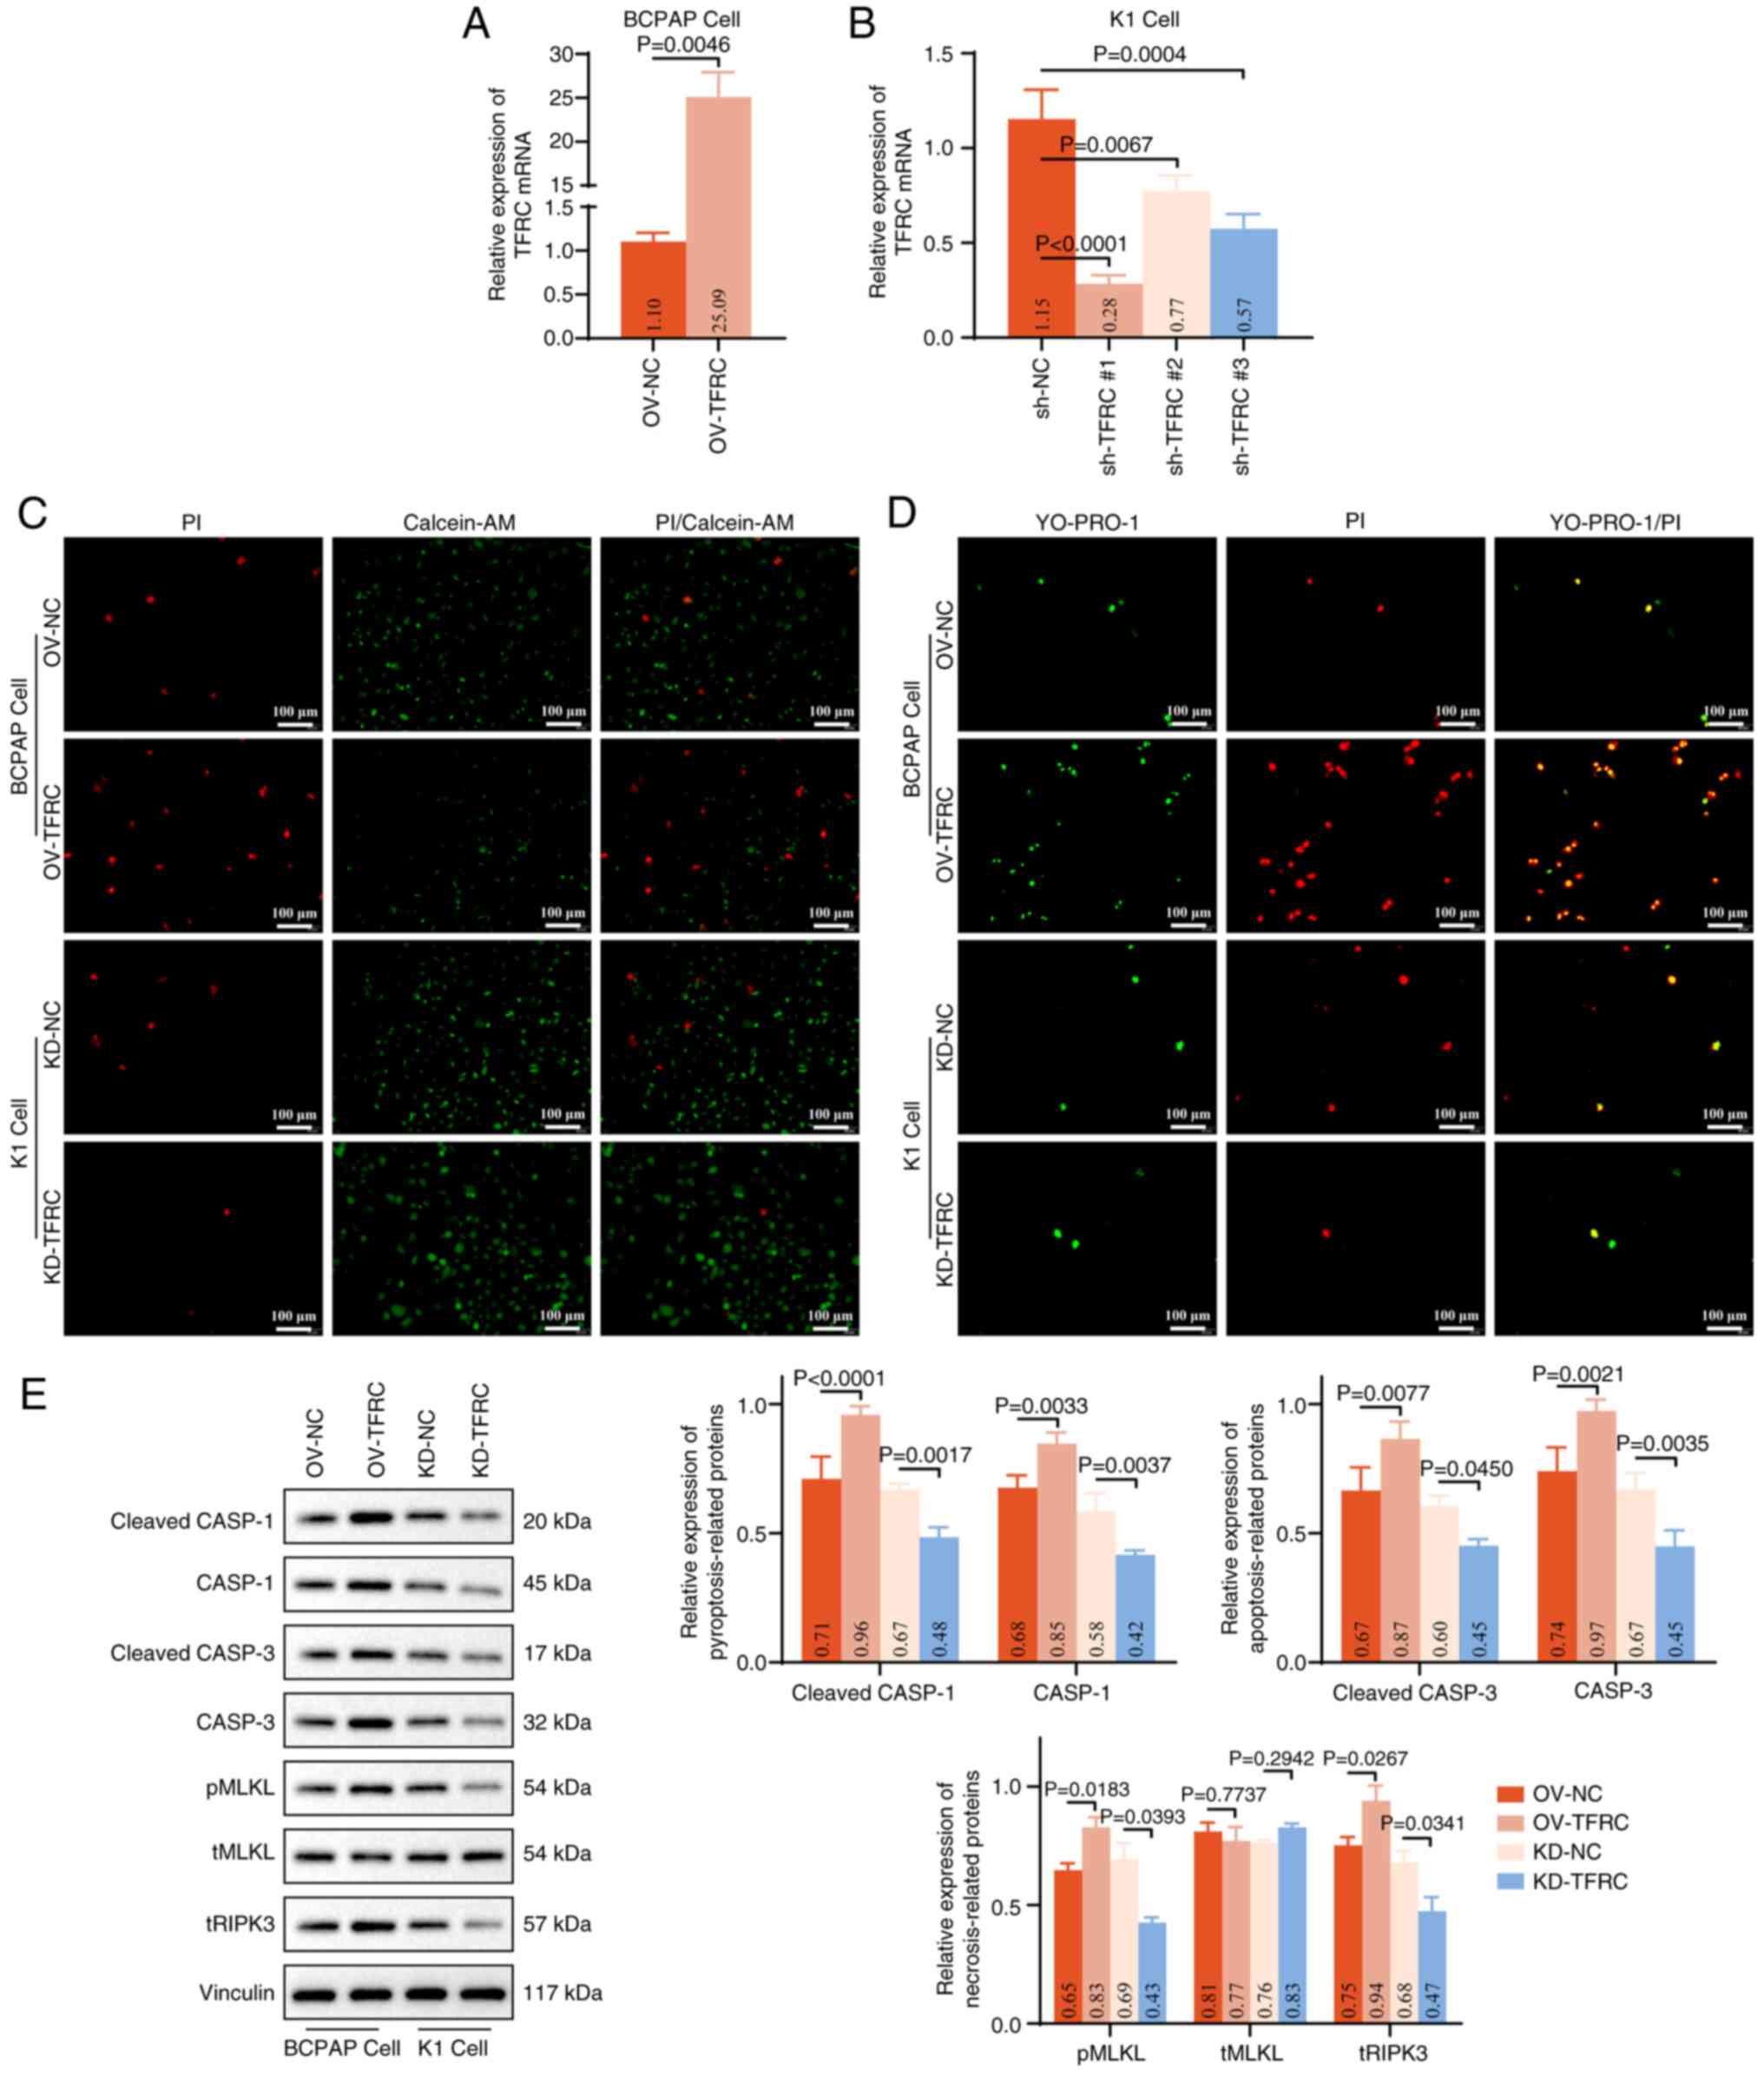 | Figure 3.TFRC contributes to PANoptosis in TC
cells. Effects of (A) PGMLV-CMV-MCS-EF1-ZsGreen1-T2A-Puro and (B)
shRNA transfection on the expression of TFRC mRNA in BCPAP
and K1 cells, assessed using reverse transcription-quantitative PCR
assay. (C) PI/Calcein-AM staining was performed to assess the
effect of TFRC on cell death in BCPAP (OV-NC and OV-TFRC groups)
and K1 (KD-NC and KD-TFRC groups) cells. PI (red) and Calcein-AM
(green) label dead and viable cells, respectively. (D) YO-PRO-1/PI
staining was performed to evaluate pyroptosis, apoptosis and
necroptosis in BCPAP and K1 cells following exogenous modulation of
TFRC expression. YO-PRO-1 (green) indicates apoptotic or
necroptotic cells, whereas PI (red) labels necroptotic or
pyroptotic cells. (E) Western blot analysis of markers associated
with pyroptosis (cleaved-CASP1/CASP1), apoptosis
(cleaved-CASP3/CASP3) and necroptosis (pMLKL/tMLKL and tRIPK3),
with corresponding quantitative analyses. TFRC, transferrin
receptor; sh, short hairpin; OV, overexpression; NC, negative
control; KD, knockdown; CASP; caspase; MLKL, mixed lineage kinase
domain like pseudokinase; pMLKL, phospho-MLKL; tMLKL, total-MLKL;
tRIPK3, total receptor interacting serine/threonine kinase 3. |
To further distinguish the mode of cell death,
YO-PRO-1/PI staining was performed. Overexpression of TFRC notably
increased the proportion of YO-PRO-1-positive cells
(apoptosis/necroptosis) and PI-positive cells
(necroptosis/pyroptosis) in BCPAP cells, whereas the opposite trend
was observed following TFRC knockdown (Fig. 3D). These findings suggest that TFRC
promotes multiple forms of regulated cell death, including
pyroptosis, apoptosis and necroptosis, in TC cells. Consistent with
these observations, western blot analysis revealed that, compared
with in the OV-NC or KD-NC groups, the expression levels of
cleaved-CASP1, CASP1, cleaved-CASP3, CASP3, pMLKL and tRIPK3
proteins were significantly augmented in BCPAP cells overexpressing
TFRC, but reduced in K1 cells with TFRC knockdown (Fig. 3E). Collectively, these results
indicate that overexpression of TFRC drives PANoptosis in TC
cells.
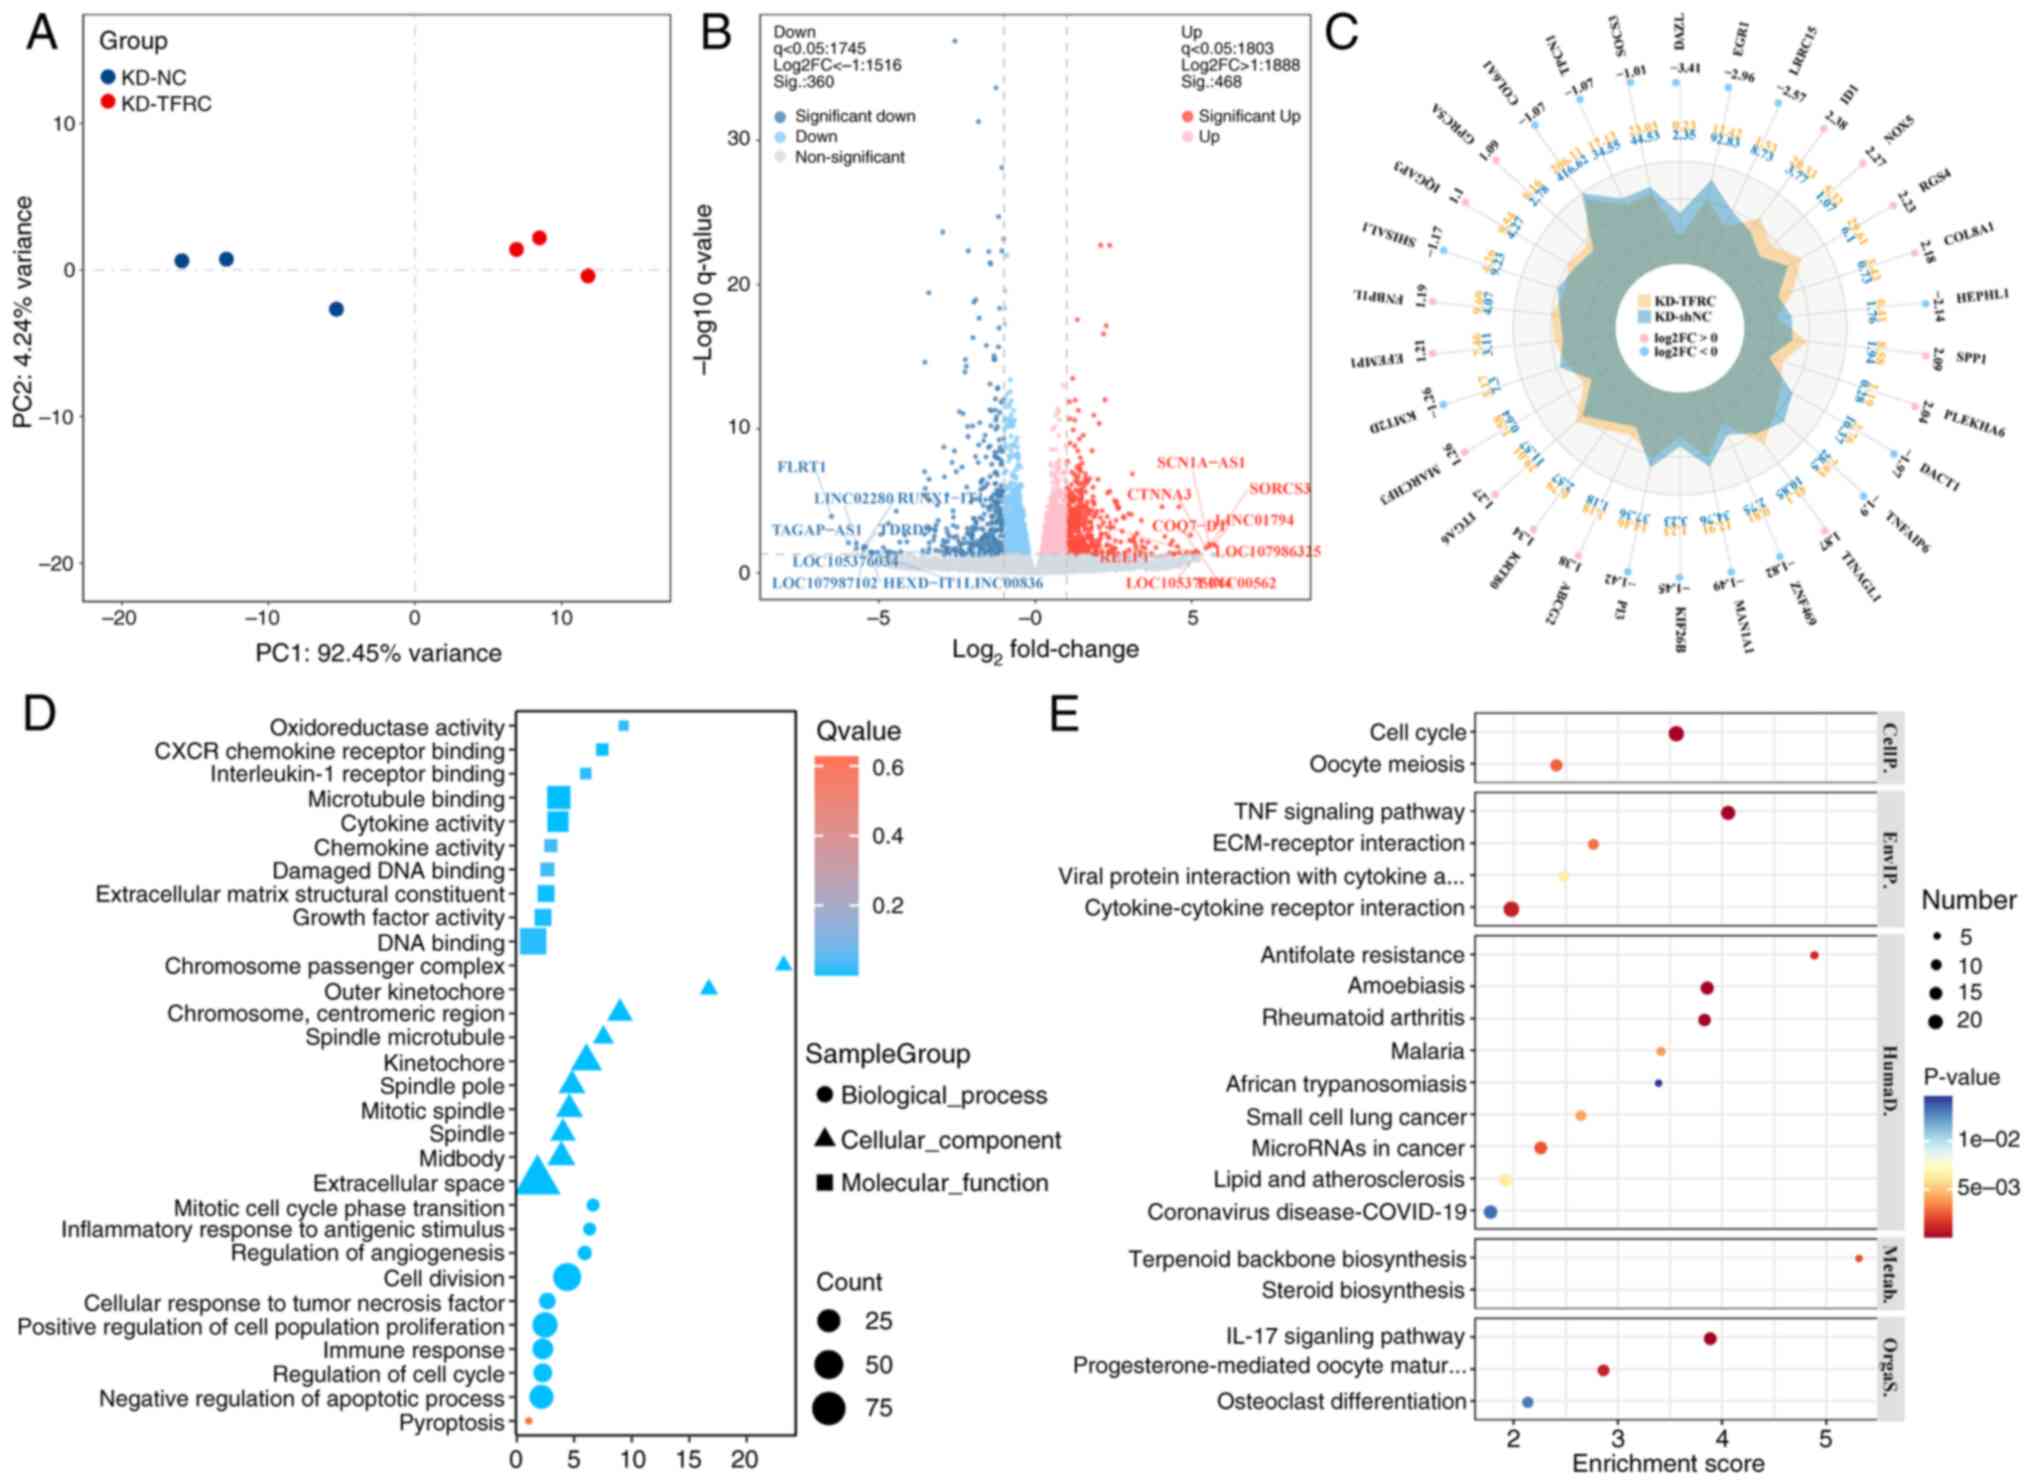
Identification and enrichment analysis
of TFRC-associated DE-mRNAs
To explore the potential mechanism underlying
TFRC-associated PANoptosis in TC cells, mRNA-seq was performed on
K1 cells from the KD-NC and KD-TFRC groups. The results
demonstrated that mRNA expression profiles clustered tightly within
groups, but were clearly separated between groups, indicating
distinct gene expression patterns (Fig.
4A). Compared with the KD-NC group, the KD-TFRC group exhibited
360 significantly downregulated DE-mRNAs and 468 significantly
upregulated DE-mRNAs (Fig. 4B).
Radar plots highlighted the top 30 DE-mRNAs ranked by
|log2FoldChange (FC)|, with inhibitor of DNA binding 1,
NADPH oxidase 5, regulator of G protein signaling 4, collagen type
VIII α1 chain and secreted phosphoprotein 1 among the most
upregulated, and deleted in azoospermia like, early growth response
1, leucine rich repeat containing 15, hephaestin like 1 and
dishevelled binding antagonist of β catenin 1 among the most
downregulated (Fig. 4C). GO
enrichment analysis indicated that TFRC-associated DE-mRNAs were
predominantly localized to the extracellular matrix and enriched in
processes such as ‘pyroptosis’, ‘negative regulation of apoptotic
process’, ‘immune response’ and ‘cellular response to tumor
necrosis factor’ (Fig. 4D). KEGG
enrichment analysis further demonstrated enrichment in ‘cell
cycle’, ‘TNF signaling pathway’, ‘ECM-receptor interaction’,
‘cytokine-cytokine receptor interaction’ and ‘IL-17 signaling
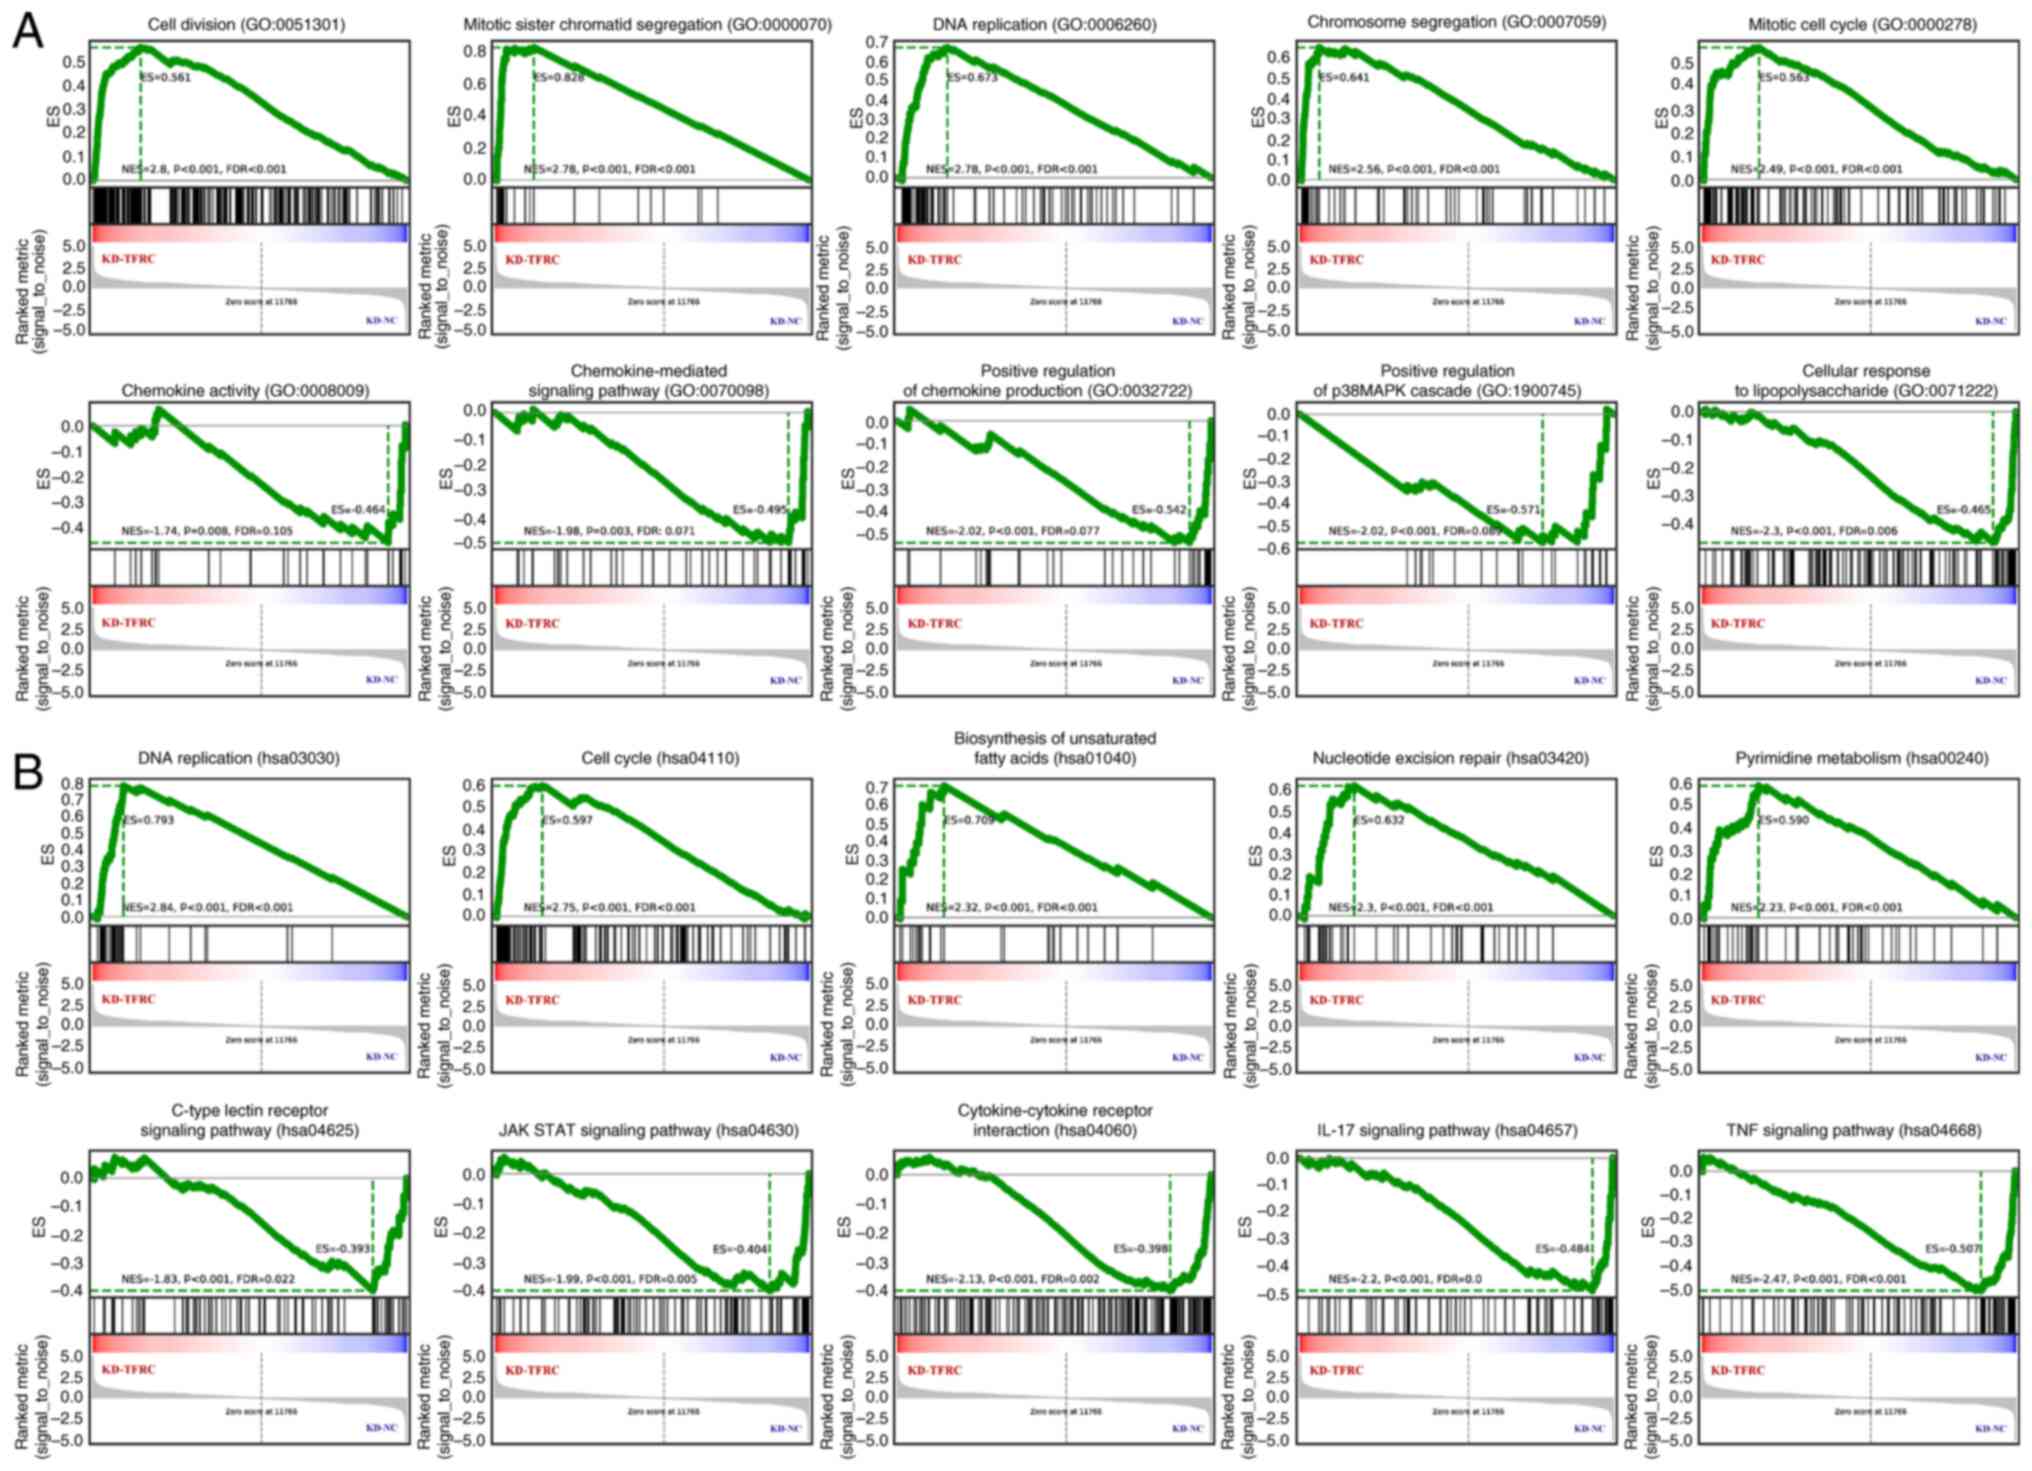
pathway’ (Fig. 4E). Consistently,
GSEA analysis revealed that knockdown of TFRC was associated with
cell proliferation, unsaturated fatty acid biosynthesis and
pyrimidine metabolism, whilst suppressing immune-related processes
(Fig. 5). Collectively, these
findings suggest that TFRC-associated DE-mRNAs are mainly involved
in regulating the cell cycle, apoptosis, necrotic apoptosis,
pyroptosis, angiogenesis, oxidative stress and immunity, thereby
reflecting the molecular mechanisms of TFRC-mediated PANoptosis in
TC cells.
Identification of hub genes for
TFRC-associated DE-mRNAs
The present study further constructed a PPI network
comprising 828 TFRC expression-associated DE-mRNAs. This PPI
network consisted of 122 genes and 535 interrelationship pairs,
with the top five hub genes ranked by degree centrality being
CDC20, kinesin family member 11, polo like kinase 1, budding
uninhibited by benzimidazoles 1 (yeast homolog) and CDK1
(Fig. 6A). MCODE analysis further
identified six sub-networks (clustering scores ≥3) (Fig. 6B). The most notable sub-network,
with a clustering score of 15.789, contained 20 genes and 150
interaction pairs, including assembly factor for spindle
microtubule, aurora kinase B, cell division cycle-associated
protein 1 and centromere protein f and kinesin family
member 2C, which are primarily involved in regulating the cell
cycle and immunity (40–44). Notably, the STRING database
predicted potential interactions between TFRC and 13 genes, namely
CD34, LDHA, LDLR, AP1M2, DIAPH3, TUBA1B, CIT, DNM3, TSPAN15,
DEPDC1B, IQGAP3, CD24 and PIK3R3 (Fig. 6C). Consistently, mRNA expression
profile of K1 cells revealed a strong positive correlation between
TFRC expression and the mRNAs levels of these genes (Fig. 6D). RT-qPCR revealed that TFRC
knockdown led to significant reductions in the mRNA levels of
PIK3R3, LDLR, LDHA, IQGAP3, CIT, CD34, DNM3, AP1M2 and
CD24 in K1 cells, compared with controls (Fig. 6E), which was consistent with the
results of the correlation analysis (Fig. 6D). Collectively, these findings
suggest that the pro-PANoptotic role of TFRC in TC may be mediated,
at least in part, through its association with these 13 genes.
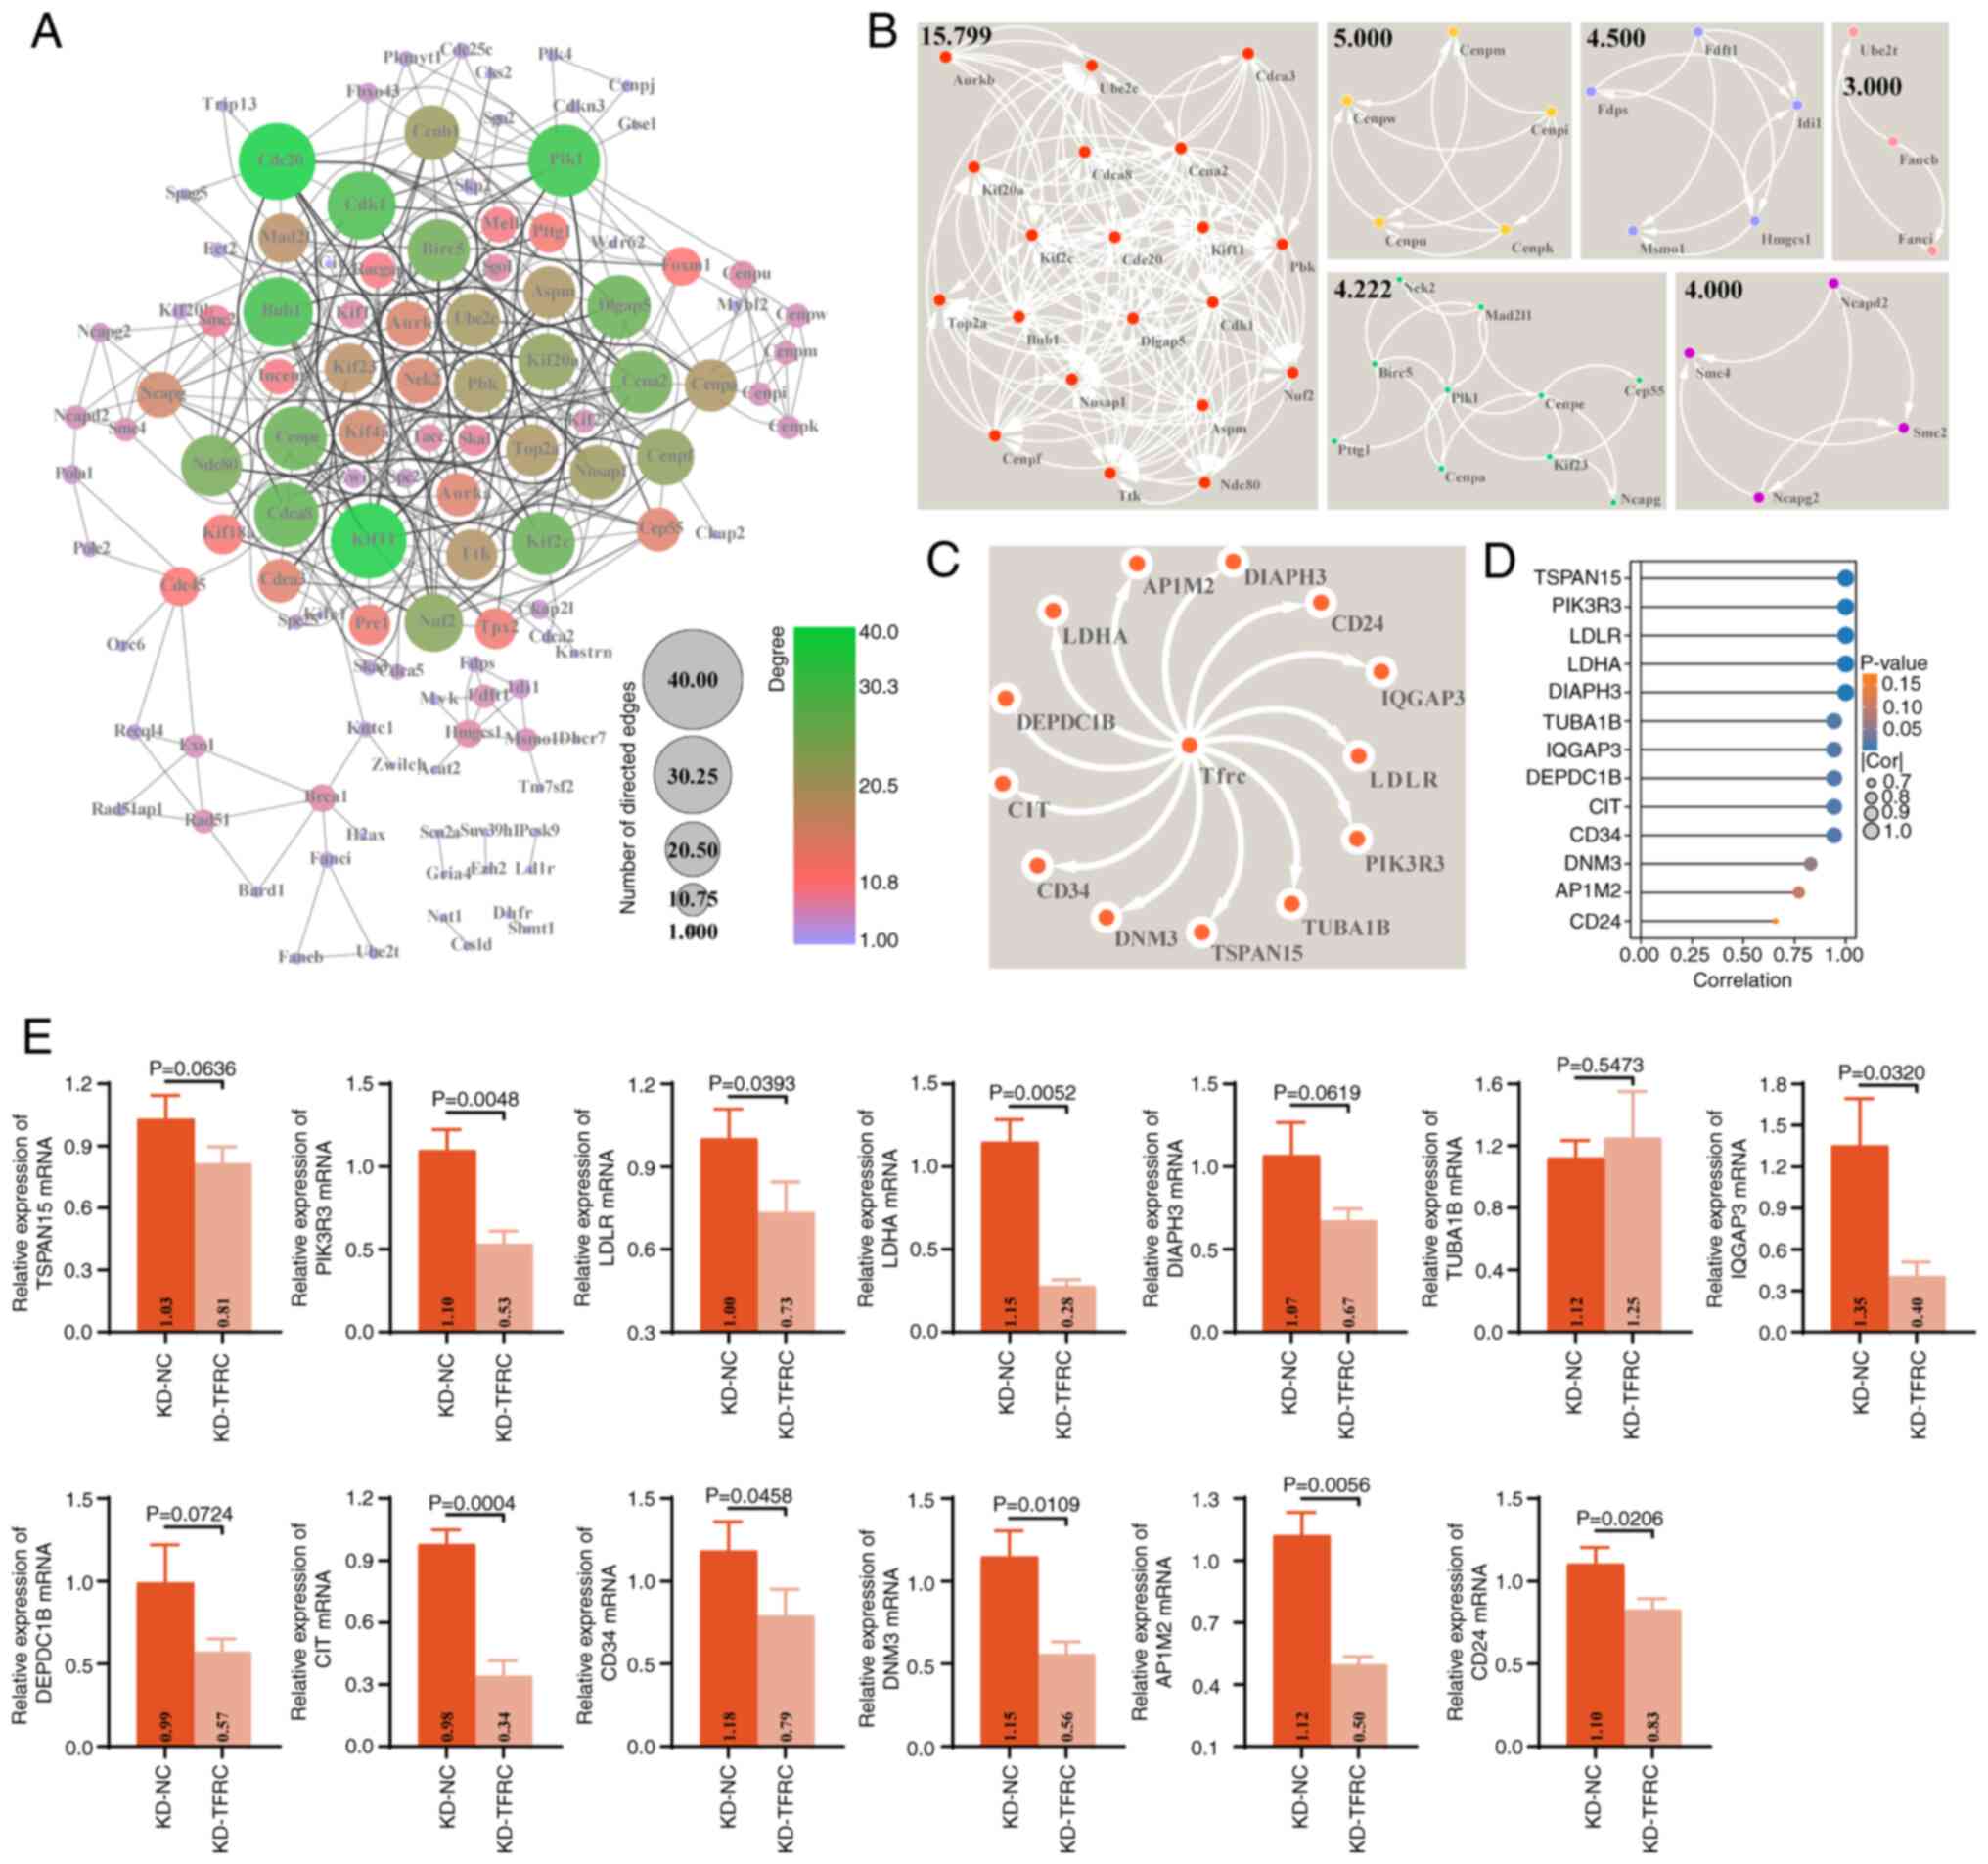 | Figure 6.PPI network of TFRC-associated
DE-mRNAs in thyroid cancer. (A) PPI network of TFRC-associated
DE-mRNAs constructed and visualized in Cytoscape software. Node
color and size represent degree and indegree, respectively. (B)
Sub-networks within the PPI network identified using the MCODE app
in Cytoscape software. (C) Predicted TFRC-interacting genes
obtained from the STRING database (minimum required interaction
score, 0.4). (D) Lollipop plot showing the correlation between TFRC
and the expression of CD34, LDHA, LDLR, AP1M2, DIAPH3, TUBA1B,
CIT, DNM3, TSPAN15, DEPDC1B, IQGAP3, CD24 and PIK3R3 in
the mRNA expression profiles of K1 cells (KD-NC and KD-TFRC
groups). (E) Effects of TFRC knockdown on the mRNA expressions of
CD34, LDHA, LDLR, AP1M2, DIAPH3, TUBA1B, CIT, DNM3, TSPAN15,
DEPDC1B, IQGAP3, CD24 and PIK3R3 in K1 cells, assessed
using reverse transcription-quantitative PCR. PPI, protein-protein
interaction; DE-mRNAs, differentially expressed mRNAs; TFRC,
transferrin receptor; KD, knockdown; NC, negative control; LDHA,
lactate dehydrogenase A; LDLR, low-density lipoprotein receptor;
AP1M2, adaptor related protein complex 1 subunit µ 2; DIAPH3,
diaphanous related formin 3; TUBA1B, tubulin α 1b; CIT, citron
ρ-interacting serine/threonine kinase; DNM3, dynamin 3; TSPAN15,
tetraspanin 15; DEPDC1B, DEP domain containing 1B; IQGAP3, IQ motif
containing GTPase activating protein 3; PIK3R3,
phosphoinositide-3-kinase regulatory subunit 3. |
Discussion
The present study identified 315 coding genes
associated with ZBP-1 and AIM2 expression, among which TFRC and
NT5C3A emerged as significantly associated with the prognosis of
patients with TC. Although NT5C3A also demonstrated a significant
association with patient survival and represents a promising
candidate for future studies, the present study subsequently
focused on TFRC due to its established evidence across multiple
cell death pathways, indicating greater potential for mechanism
exploration in the context of PANoptosis. Notably, TFRC mRNA was
expressed at low levels in TC cells (TPC-1, K1 and BCPAP) yet
facilitated PANoptosis process. Notably, in TFRC-related
experiments, inducers were not employed to trigger PANoptosis in TC
cells. Since Malireddi et al (45) first proposed PANoptosis,
PANoptosis-related studies have not utilized induction agents, to
the best of our knowledge (46–53).
This may be due to the lack of specific PANoptosis inducers.
Therefore, in subsequent experiments in the present study, an
inducer for treatment was not used.
TFRC has previously been implicated in the
regulation of cell death. Earlier studies reported that TFRC
primarily promotes ferroptosis, as reported in endometrial cancer
(54), sepsis-associated
encephalopathy (55) and colorectal
cancer (21). In addition, TFRC has
been reported to regulate apoptosis in nasopharyngeal carcinoma
cells (56), pyroptosis in sheep
hepatocytes and hepatocytes (57),
and necroptosis in placenta (58).
However, its role in TC has remained unexplored, despite
bioinformatics analyses suggesting TFRC as a ferroptosis-related
feature predictive of TC prognosis (17,18).
Therefore, the present study refined the understanding of
TFRC-mediated cell death and demonstrated, for the first time to
the best of our knowledge, its involvement in PANoptosis process in
TC.
Furthermore, to elucidate the molecular mechanism
underlying TFRC regulation of PANoptosis, the present study
performed mRNA-seq and identified 828 TFRC-associated DE-mRNAs
enriched in biological processes and pathways including cell cycle,
apoptosis, necrotic apoptosis, pyroptosis, angiogenesis, oxidative
stress and immunity. Among these, 13 DE-mRNAs (CD34, LDHA, LDLR,
AP1M2, DIAPH3, TUBA1B, CIT, DNM3, TSPAN15, DEPDC1B, IQGAP3,
CD24 and PIK3R3) were predicted to interact with TFRC
and displayed a positive correlation with its expression in TC.
Notably, these DE-mRNAs are implicated in the progression of TC
process and functionally associated with apoptosis, necroptosis and
pyroptosis. CD34, LDHA, and LDLR are well-established markers of
angiogenesis, glycolysis and cholesterol metabolism, respectively,
in malignant tumors, and have also been associated with apoptotic
and pyroptotic pathways (59–61).
Moreover, DNM3 has been reported to be markedly downregulated in
TCs, where it facilitates tumor cell death (62). DIAPH3, DEPDC1B, CD24 and PIK3R3 have
each been implicated in the regulation of tumor cell death
(63,64). Notably, the present study
demonstrated that TFRC expression was positively correlated with
these DE-mRNAs, and its knockdown effectively reduced the levels of
PIK3R3, LDLR, LDHA, IQGAP3, CIT, CD34, DNM3, AP1M2h and CD24.
However, although the present study identified 13 TFRC-interacting
DE-mRNAs, none have been directly established as core regulators of
PANoptosis in existing literature. Instead, these genes are
primarily associated with distinct biological processes such as
angiogenesis (CD34), cholesterol metabolism (LDLR)
and cytoskeletal organization (DIAPH3). Several, including
DIAPH3, DEPDC1B, CD24 and PIK3R3, have been
associated with apoptosis or other forms of regulated cell death,
but not to the integrated PANoptosis pathway (59–64).
This suggests that TFRC may orchestrate PANoptosis, not through
direct engagement of these DE-mRNAs as PANoptosis-specific
effectors, but by modulating broader networks involving immunity,
metabolism and stress response.
Among these, the interaction between TFRC and LDHA
may link glycolysis and lactylation modification to the PANoptosis
process. LDHA is the key enzyme catalyzing the final step of
glycolysis, converting pyruvate into lactate. This process provides
efficient ATP for rapid tumor cell proliferation and supplies an
abundant lactate pool for lactate modification (65,66).
Previous study has reported that the PANoptosis process is mediated
by glycolysis during radiotherapy for esophageal cancer (12). Simultaneously, lactylation
modification induced by lactic acid accumulation regulates the
PANoptosis process through multiple signaling cascades, including
the Arg1/Mic10/voltage dependent anion channel 1 axis, the cold
inducible RNA binding/toll like receptor 4/ZBP1/tripartite motif
containing 32/RIPK3 axis and the proteasome 26S subunit, non-ATPase
14/pyruvate kinase M1/2/PINK1 axis (67–69).
Notably, lactate efflux via monocarboxylate transporters acidifies
the tumor microenvironment (TME), triggering damage-associated
molecular patterns (DAMPs) that induce stress signals leading to
inflammatory cell death in adjacent immune cells and cancer cells
(70). Furthermore, lactylation
activates downstream inflammatory cascades (TNF-α, IL-1β, IL-6 and
IL-12) by regulating S100 and high mobility group box 1 in DAMPs
(71,72). Notably, DAMP is one of the pathways
that trigger PANoptosis (7–11). The present study revealed that the
expression of TFRC and LDHA was positively associated during the
PANoptosis process in TC, and TFRC knockdown inhibited LDHA
expression in K1 cells. Therefore, we hypothesize that the
interaction between TFRC and LDHA may accelerate glycolysis and
lactate production. Further, accumulated lactic acid serves as a
substrate to induce lactylation of DAMP-associated proteins,
thereby regulating pro-inflammatory gene expression. Meanwhile,
lactic acid triggers inflammatory death through stress signals in
an acidic TME. These pathways together activate the PANoptosome
complex, ultimately synergistically triggering PANoptosis.
Therefore, the TFRC-LDHA-lactylation pathway may provide a novel
mechanism linking tumor glycolysis to PANoptosis. Collectively,
these findings suggest the occurrence of PANoptosis in TC may be an
outcome of TFRC interactions with these DE-mRNAs.
Although the present study proposes a potential
mechanism by which TFRC regulates PANoptosis in TC, the precise
mode of action remains unclear and requires further validation. In
particular, it is not yet known at which molecular level (protein,
RNA or DNA) and through what mechanisms TFRC interacts with the
identified DE-mRNAs. These issues warrant investigation using
approaches such as chromatin immunoprecipitation, pull down,
co-immunoprecipitation and RNA-binding protein immunoprecipitation.
Moreover, the potential interactions of TFRC with the PANoptosis
sensors, ZBP1 and AIM2, also require verification. Finally, the
absence of in vivo experiments in the present study limits
direct evidence for TFRC-mediated regulation of PANoptosis in TC.
The findings suggest a potential association between TFRC and LDHA
expression, which may indirectly implicate glycolytic and
lactylation pathways in PANoptosis regulation. However, direct
experimental validation of LDHA function and lactate metabolism
remains to be investigated in future studies. Subsequently,
experiments such as LDHA knockdown/overexpression, lactate
measurement and histone lactylation detection need be performed to
further verify whether this pathway is indeed involved in
TFRC-mediated PANoptosis.
In conclusion, the present study provides the first
evidence, to the best of our knowledge, that TFRC contributes to
PANoptosis process in TC and delineates a potential regulatory
pathway using mRNA-seq. The findings not only advance the
understanding of PANoptosis in TC but also hold promise for
informing future therapeutic strategies targeting this pathway. To
exploit TFRC for TC treatment, several strategies could be
considered to increase its expression or activity in tumor cells.
Small molecule agonists or transcriptional activators that enhance
TFRC expression could be developed. Additionally,
nanoparticle-based delivery systems could be designed to deliver
TFRC-expressing plasmids or mRNA directly into tumor cells, thereby
restoring TFRC function and inducing PANoptosis. Future studies
should focus on validating these strategies in preclinical models
and ultimately in clinical trials to translate TFRC-based
PANoptosis induction into a viable therapeutic option for patients
with TC.
Acknowledgements
Not applicable.
Funding
The present study was supported by the Yunnan Provincial Health
Commission ‘Medical Leading Talents’ Training Program (grant no.
L-2018015) and Yunnan Province ‘Ten Thousand People Plan’ Special
Medical Talents (grant no. 2019-35).
Availability of data and materials
The data generated in the present study may be found
in the Gene Expression Omnibus under accession number GSE280138
(Secure Token: ctgxycgmjrazxob) or at the following URL: https://www.ncbi.nlm.nih.gov/geo/query/acc.cgi?acc=GSE280138.
All other data generated in the present study may be requested from
the corresponding author.
Authors' contributions
SM and ZM conceived and designed the experiments;
SM, JS, HL, HY, YH and SY performed the experiments; SM and JS
analyzed and interpreted the data; HL, HY, YH and SY sourced the
reagents, materials and analysis tools; SM wrote original draft;
and ZM, JS, HL, HY, YH and SY reviewed and edited the manuscript
draft. SM, ZM, JS, HL, HY, YH and SY checked and confirmed the
authenticity of all the raw data. All authors read and approved the
final manuscript.
Ethics approval and consent to
participate
Not applicable.
Patient consent for publication
Not applicable.
Competing interests
The authors declare that they have no competing
interests.
References
|
1
|
Chen DW, Lang BHH, McLeod DSA, Newbold K
and Haymart MR: Thyroid cancer. Lancet. 401:1531–1544. 2023.
View Article : Google Scholar : PubMed/NCBI
|
|
2
|
Sung H, Ferlay J, Siegel RL, Laversanne M,
Soerjomataram I, Jemal A and Bray F: Global cancer statistics 2020:
GLOBOCAN estimates of incidence and mortality worldwide for 36
cancers in 185 countries. CA Cancer J Clin. 71:209–249.
2021.PubMed/NCBI
|
|
3
|
Rahib L, Smith BD, Aizenberg R, Rosenzweig
AB, Fleshman JM and Matrisian LM: Projecting cancer incidence and
deaths to 2030: The unexpected burden of thyroid, liver, and
pancreas cancers in the United States. Cancer Res. 74:2913–2921.
2014. View Article : Google Scholar : PubMed/NCBI
|
|
4
|
Zhang L, Feng Q, Wang J, Tan Z, Li Q and
Ge M: Molecular basis and targeted therapy in thyroid cancer:
Progress and opportunities. Biochim Biophys Acta Rev Cancer.
1878:1889282023. View Article : Google Scholar : PubMed/NCBI
|
|
5
|
Laha D, Nilubol N and Boufraqech M: New
therapies for advanced thyroid cancer. Front Endocrinol (Lausanne).
11:822020. View Article : Google Scholar : PubMed/NCBI
|
|
6
|
Shen H, Zhu R, Liu Y, Hong Y, Ge J, Xuan
J, Niu W, Yu X, Qin JJ and Li Q: Radioiodine-refractory
differentiated thyroid cancer: Molecular mechanisms and therapeutic
strategies for radioiodine resistance. Drug Resist Updat.
72:1010132024. View Article : Google Scholar : PubMed/NCBI
|
|
7
|
Pandian N and Kanneganti TD: PANoptosis: A
unique innate immune inflammatory cell death modality. J Immunol.
209:1625–1633. 2022. View Article : Google Scholar : PubMed/NCBI
|
|
8
|
Samir P, Malireddi RKS and Kanneganti TD:
The PANoptosome: A deadly protein complex driving pyroptosis,
apoptosis, and necroptosis (PANoptosis). Front Cell Infect
Microbiol. 10:2382020. View Article : Google Scholar : PubMed/NCBI
|
|
9
|
Karki R and Kanneganti TD: PANoptosome
signaling and therapeutic implications in infection: Central role
for ZBP1 to activate the inflammasome and PANoptosis. Curr Opin
Immunol. 83:1023482023. View Article : Google Scholar : PubMed/NCBI
|
|
10
|
Nozaki K, Li L and Miao EA: Innate sensors
trigger regulated cell death to combat intracellular infection.
Annu Rev Immunol. 40:469–498. 2022. View Article : Google Scholar : PubMed/NCBI
|
|
11
|
Lee S, Karki R, Wang Y, Nguyen LN,
Kalathur RC and Kanneganti TD: AIM2 forms a complex with pyrin and
ZBP1 to drive PANoptosis and host defence. Nature. 597:415–419.
2021. View Article : Google Scholar : PubMed/NCBI
|
|
12
|
Liu LX, Heng JH, Deng DX, Zhao H, Zheng
ZY, Liao LD, Lin W, Xu XE, Li EM and Xu LY: Sulconazole induces
PANoptosis by triggering oxidative stress and inhibiting glycolysis
to increase radiosensitivity in esophageal cancer. Mol Cell
Proteomics. 22:1005512023. View Article : Google Scholar : PubMed/NCBI
|
|
13
|
Karki R, Sundaram B, Sharma BR, Lee S,
Malireddi RKS, Nguyen LN, Christgen S, Zheng M, Wang Y, Samir P, et
al: ADAR1 restricts ZBP1-mediated immune response and PANoptosis to
promote tumorigenesis. Cell Rep. 37:1098582021. View Article : Google Scholar : PubMed/NCBI
|
|
14
|
Ren L, Yang Y, Li W, Zheng X, Liu J, Li S,
Yang H, Zhang Y, Ge B, Zhang S, et al: CDK1 serves as a therapeutic
target of adrenocortical carcinoma via regulating
epithelial-mesenchymal transition, G2/M phase transition, and
PANoptosis. J Transl Med. 20:4442022. View Article : Google Scholar : PubMed/NCBI
|
|
15
|
Cai Y, Chen X, Lu T, Fang X, Ding M, Yu Z,
Hu S, Liu J, Zhou X and Wang X: Activation of STING by SAMHD1
deficiency promotes PANoptosis and enhances efficacy of PD-L1
blockade in diffuse Large B-cell lymphoma. Int J Biol Sci.
19:4627–4643. 2023. View Article : Google Scholar : PubMed/NCBI
|
|
16
|
Karbakhsh Ravari F, Ghasemi Gorji M and
Rafiei A: From iron-driven cell death to clot formation: The
emerging role of ferroptosis in thrombogenesis. Biomed
Pharmacother. 189:1183282025. View Article : Google Scholar : PubMed/NCBI
|
|
17
|
Shi J, Wu P, Sheng L, Sun W and Zhang H:
Ferroptosis-related gene signature predicts the prognosis of
papillary thyroid carcinoma. Cancer Cell Int. 21:6692021.
View Article : Google Scholar : PubMed/NCBI
|
|
18
|
Yang D, Wang J, Li C, Shi L and Zhang M:
Ferroptosis-related gene model to predict overall survival of
papillary thyroid carcinoma. Am J Otolaryngol. 42:1031632021.
View Article : Google Scholar : PubMed/NCBI
|
|
19
|
Huang Y, Du J, Li D, He W, Liu Z, Liu L,
Yang X, Cheng X, Chen R and Yang Y: LASS2 suppresses metastasis in
multiple cancers by regulating the ferroptosis signalling pathway
through interaction with TFRC. Cancer Cell Int. 24:872024.
View Article : Google Scholar : PubMed/NCBI
|
|
20
|
Zhou X, Nie M, Xin X, Hua T, Zhang J, Shi
R, Dong K, Shu W, Yan B and Wang H: RAB17 promotes endometrial
cancer progression by inhibiting TFRC-dependent ferroptosis. Cell
Death Dis. 15:6552024. View Article : Google Scholar : PubMed/NCBI
|
|
21
|
Wang X, Zhou Y, Ning L, Chen J, Chen H and
Li X: Knockdown of ANXA10 induces ferroptosis by inhibiting
autophagy-mediated TFRC degradation in colorectal cancer. Cell
Death Dis. 14:5882023. View Article : Google Scholar : PubMed/NCBI
|
|
22
|
Guo S, Chen Y, Xue X, Yang Y, Wang Y, Qiu
S, Cui J, Zhang X, Ma L, Qiao Y and Wang J: TRIB2 desensitizes
ferroptosis via βTrCP-mediated TFRC ubiquitiantion in liver cancer
cells. Cell Death Discov. 7:1962021. View Article : Google Scholar : PubMed/NCBI
|
|
23
|
Lin Z, Zhong C, Shi M, Long Q, Jing L, Yu
Y, Chou J, Chen M, Lan M and Long F: Circular RNA TFRC/SCD1 mRNA
interaction regulates ferroptosis and metastasis in gastric cancer.
Cell Death Dis. 16:4362025. View Article : Google Scholar : PubMed/NCBI
|
|
24
|
Wang WT, Duan ZW, Xing TY, Hua W, Du KX,
Shang CY, Wu YF, Wang L, Li JY, Gao R, et al: PTPN2 inhibition
disrupts mitochondrial renewal and blocks TFRC-Mediated mitophagy
to exert Anti-Tumor activities in ALK-Positive anaplastic large
cell lymphoma. Adv Sci (Weinh). 12:e142822025. View Article : Google Scholar : PubMed/NCBI
|
|
25
|
Wang K, Shi X, Lin H, Xu T and Xu S:
Selenium deficiency exacerbates ROS/ER stress mediated pyroptosis
and ferroptosis induced by bisphenol A in chickens thymus. J
Environ Sci (China). 148:13–26. 2025. View Article : Google Scholar : PubMed/NCBI
|
|
26
|
Zhang X, Xu W, Wang Z, Liu J, Gong H and
Zou W: Cross-talk between cuproptosis and ferroptosis to identify
immune landscape in cervical cancer for mRNA vaccines development.
Eur J Med Res. 29:6022024. View Article : Google Scholar : PubMed/NCBI
|
|
27
|
Liu J, Lichtenberg T, Hoadley KA, Poisson
LM, Lazar AJ, Cherniack AD, Kovatich AJ, Benz CC, Levine DA, Lee
AV, et al: An Integrated TCGA Pan-cancer clinical data resource to
drive High-quality survival outcome analytics. Cell.
173:400–416.e11. 2018. View Article : Google Scholar : PubMed/NCBI
|
|
28
|
Wu T, Hu E, Xu S, Chen M, Guo P, Dai Z,
Feng T, Zhou L, Tang W, Zhan L, et al: clusterProfiler 4.0: A
universal enrichment tool for interpreting omics data. Innovation
(Camb). 2:1001412021.PubMed/NCBI
|
|
29
|
Szklarczyk D, Gable AL, Lyon D, Junge A,
Wyder S, Huerta-Cepas J, Simonovic M, Doncheva NT, Morris JH, Bork
P, et al: STRING v11: Protein-protein association networks with
increased coverage, supporting functional discovery in genome-wide
experimental datasets. Nucleic Acids Res. 47:D607–D613. 2019.
View Article : Google Scholar : PubMed/NCBI
|
|
30
|
Otasek D, Morris JH, Bouças J, Pico AR and
Demchak B: Cytoscape Automation: Empowering workflow-based network
analysis. Genome Biol. 20:1852019. View Article : Google Scholar : PubMed/NCBI
|
|
31
|
Bader GD and Hogue CW: An automated method
for finding molecular complexes in large protein interaction
networks. BMC Bioinformatics. 4:22003. View Article : Google Scholar : PubMed/NCBI
|
|
32
|
Lin H and Zelterman DJT: Modeling Survival
Data: Extending the Cox Model. Technometrics. 44:85–86. 2002.
View Article : Google Scholar
|
|
33
|
Livak KJ and Schmittgen TD: Analysis of
relative gene expression data using real-time quantitative PCR and
the 2(−Delta Delta C(T)) method. Methods. 25:402–408. 2001.
View Article : Google Scholar : PubMed/NCBI
|
|
34
|
Wang L, Wang S and Li W: RSeQC: Quality
control of RNA-seq experiments. Bioinformatics. 28:2184–2185. 2012.
View Article : Google Scholar : PubMed/NCBI
|
|
35
|
Chen S, Zhou Y, Chen Y and Gu J: fastp: An
ultra-fast all-in-one FASTQ preprocessor. Bioinformatics.
34:i884–i890. 2018. View Article : Google Scholar : PubMed/NCBI
|
|
36
|
Kim D, Langmead B and Salzberg SL: HISAT:
A fast spliced aligner with low memory requirements. Nat Methods.
12:357–360. 2015. View Article : Google Scholar : PubMed/NCBI
|
|
37
|
Anders S, Pyl PT and Huber W: HTSeq-a
Python framework to work with high-throughput sequencing data.
Bioinformatics. 31:166–169. 2015. View Article : Google Scholar : PubMed/NCBI
|
|
38
|
Love MI, Huber W and Anders S: Moderated
estimation of fold change and dispersion for RNA-seq data with
DESeq2. Genome Biol. 15:5502014. View Article : Google Scholar : PubMed/NCBI
|
|
39
|
Ginestet C: ggplot2: Elegant graphics for
data analysis. J Royal Stat Soc Series A Statistics Soc.
174:245–246. 2011. View Article : Google Scholar
|
|
40
|
Wan Z, Wen M, Zheng C, Sun Y, Zhou Y, Tian
Y, Xin S, Wang X, Ji X, Yang J, et al: Centromere protein F in
tumor biology: Cancer's Achilles heel. Cancer Med. 14:e709492025.
View Article : Google Scholar : PubMed/NCBI
|
|
41
|
Li RQ, Yang Y, Qiao L, Yang L, Shen DD and
Zhao XJ: KIF2C: An important factor involved in signaling pathways,
immune infiltration, and DNA damage repair in tumorigenesis. Biomed
Pharmacother. 171:1161732024. View Article : Google Scholar : PubMed/NCBI
|
|
42
|
Burns M and Borgal L: Asp/ASPM
phospho-regulation throughout the cell cycle. Genome. 68:1–10.
2025. View Article : Google Scholar : PubMed/NCBI
|
|
43
|
Marima R, Hull R, Penny C and Dlamini Z:
Mitotic syndicates Aurora Kinase B (AURKB) and mitotic arrest
deficient 2 like 2 (MAD2L2) in cohorts of DNA damage response (DDR)
and tumorigenesis. Mutat Res Rev Mutat Res. 787:1083762021.
View Article : Google Scholar : PubMed/NCBI
|
|
44
|
Tokuzumi A, Fukushima S, Miyashita A,
Nakahara S, Kubo Y, Yamashita J, Harada M, Nakamura K, Kajihara I,
Jinnin M and Ihn H: Cell division cycle-associated protein 1 as a
new melanoma-associated antigen. J Dermatol. 43:1399–1405. 2016.
View Article : Google Scholar : PubMed/NCBI
|
|
45
|
Malireddi RKS, Kesavardhana S and
Kanneganti TD: ZBP1 and TAK1: Master regulators of NLRP3
Inflammasome/Pyroptosis, apoptosis, and necroptosis (PAN-optosis).
Front Cell Infect Microbiol. 9:4062019. View Article : Google Scholar : PubMed/NCBI
|
|
46
|
Lin JF, Hu PS, Wang YY, Tan YT, Yu K, Liao
K, Wu QN, Li T, Meng Q, Lin JZ, et al: Phosphorylated NFS1 weakens
oxaliplatin-based chemosensitivity of colorectal cancer by
preventing PANoptosis. Signal Transduct Target Ther. 7:542022.
View Article : Google Scholar : PubMed/NCBI
|
|
47
|
Lin C, Lin P, Yao H, Liu S, Lin X, He R,
Teng Z, Zuo X, Li Y, Ye J and Zhu G: Modulation of YBX1-mediated
PANoptosis inhibition by PPM1B and USP10 confers chemoresistance to
oxaliplatin in gastric cancer. Cancer Lett. 587:2167122024.
View Article : Google Scholar : PubMed/NCBI
|
|
48
|
Tan YT, Li T, Wang RB, Liu ZK, Ma MY,
Huang RZ, Mo HY, Luo SY, Lin JF, Xu RH and Ju HQ: WTAP weakens
oxaliplatin chemosensitivity of colorectal cancer by preventing
PANoptosis. Cancer Lett. 604:2172542024. View Article : Google Scholar : PubMed/NCBI
|
|
49
|
Qi H, Li X, Ma J, Sun J, Liu Y, Wang X,
Fan K, Shu C and Wang C: Fullerenols hijack lysosomes to disrupt
inter-organellar crosstalk and block autophagy pre-activated by
mTOR inhibitors for cancer cell PANoptosis. Sci Bull (Beijing).
70:1275–1294. 2025. View Article : Google Scholar : PubMed/NCBI
|
|
50
|
Luo Y, Linghu M, Luo X, Li D, Wang J, Peng
S and Ma Y: Remodeling tumor immunosuppressive microenvironment
through dual activation of immunogenic panoptosis and ferroptosis
by H2S-amplified nanoformulation to enhance cancer immunotherapy.
Acta Pharm Sin B. 15:1242–1254. 2025. View Article : Google Scholar : PubMed/NCBI
|
|
51
|
Wang J, Chen Y, Xu Y, Zhang J, Yang S,
Zhou Y, Lei J, Ren R, Chen Y, Zhao H, et al: DNASE1L3-mediated
PANoptosis enhances the efficacy of combination therapy for
advanced hepatocellular carcinoma. Theranostics. 14:6798–6817.
2024. View Article : Google Scholar : PubMed/NCBI
|
|
52
|
Wang S, Song A, Xie J, Wang YY, Wang WD,
Zhang MJ, Wu ZZ, Yang QC, Li H, Zhang J and Sun ZJ: Fn-OMV
potentiates ZBP1-mediated PANoptosis triggered by oncolytic HSV-1
to fuel antitumor immunity. Nat Commun. 15:36692024. View Article : Google Scholar : PubMed/NCBI
|
|
53
|
Xing J, Ma X, Yu Y, Xiao Y, Chen L, Yuan
W, Wang Y, Liu K, Guo Z, Tang H, et al: A Cardiac-targeting and
anchoring bimetallic cluster nanozyme alleviates
Chemotherapy-induced cardiac ferroptosis and PANoptosis. Adv Sci
(Weinh). 12:e24055972025. View Article : Google Scholar : PubMed/NCBI
|
|
54
|
Zhang J, Chen S, Wei S, Cheng S, Shi R,
Zhao R, Zhang W, Zhang Q, Hua T, Feng D, et al: CircRAPGEF5
interacts with RBFOX2 to confer ferroptosis resistance by
modulating alternative splicing of TFRC in endometrial cancer.
Redox Biol. 57:1024932022. View Article : Google Scholar : PubMed/NCBI
|
|
55
|
Wei XB, Jiang WQ, Zeng JH, Huang LQ, Ding
HG, Jing YW, Han YL, Li YC and Chen SL: Exosome-derived lncRNA
NEAT1 exacerbates Sepsis-associated encephalopathy by promoting
ferroptosis through Regulating miR-9-5p/TFRC and GOT1 axis. Mol
Neurobiol. 59:1954–1969. 2022. View Article : Google Scholar : PubMed/NCBI
|
|
56
|
Feng G, Arima Y, Midorikawa K, Kobayashi
H, Oikawa S, Zhao W, Zhang Z, Takeuchi K and Murata M: Knockdown of
TFRC suppressed the progression of nasopharyngeal carcinoma by
downregulating the PI3K/Akt/mTOR pathway. Cancer Cell Int.
23:1852023. View Article : Google Scholar : PubMed/NCBI
|
|
57
|
Mu Y, Sun J, Li Z, Zhang W, Liu Z, Li C,
Peng C, Cui G, Shao H and Du Z: Activation of pyroptosis and
ferroptosis is involved in the hepatotoxicity induced by
polystyrene microplastics in mice. Chemosphere. 291:1329442022.
View Article : Google Scholar : PubMed/NCBI
|
|
58
|
Zhang Y, Hu M, Jia W, Liu G, Zhang J, Wang
B, Li J, Cui P, Li X, Lager S, et al: Hyperandrogenism and insulin
resistance modulate gravid uterine and placental ferroptosis in
PCOS-like rats. J Endocrinol. 246:247–263. 2020. View Article : Google Scholar : PubMed/NCBI
|
|
59
|
Urbańska K and Orzechowski A:
Unappreciated role of LDHA and LDHB to control apoptosis and
autophagy in tumor cells. Int J Mol Sci. 20:20852019. View Article : Google Scholar : PubMed/NCBI
|
|
60
|
Shi X, Chen Y, Liu Q, Mei X, Liu J, Tang
Y, Luo R, Sun D, Ma Y, Wu W, et al: LDLR dysfunction induces LDL
accumulation and promotes pulmonary fibrosis. Clin Transl Med.
12:e7112022. View Article : Google Scholar : PubMed/NCBI
|
|
61
|
Yao X and Li C: Lactate dehydrogenase A
mediated histone lactylation induced the pyroptosis through
targeting HMGB1. Metab Brain Dis. 38:1543–1553. 2023. View Article : Google Scholar : PubMed/NCBI
|
|
62
|
Lin S, Tan L, Luo D, Peng X, Zhu Y and Li
H: Linc01278 inhibits the development of papillary thyroid
carcinoma by regulating miR-376c-3p/DNM3 axis. Cancer Manag Res.
11:8557–8569. 2019. View Article : Google Scholar : PubMed/NCBI
|
|
63
|
Rong Y, Gao J, Kuang T, Chen J, Li JA,
Huang Y, Xin H, Fang Y, Han X, Sun LQ, et al: DIAPH3 promotes
pancreatic cancer progression by activating selenoprotein
TrxR1-mediated antioxidant effects. J Cell Mol Med. 25:2163–2175.
2021. View Article : Google Scholar : PubMed/NCBI
|
|
64
|
Han F, Cheng C, Xu Q, Chen J, Yang Z and
Liu J: DEPDC1B promotes colorectal cancer via facilitating cell
proliferation and migration while inhibiting apoptosis. Cell Cycle.
22:131–143. 2023. View Article : Google Scholar : PubMed/NCBI
|
|
65
|
Li C, Liu Z, Kong D, Li Z and Li L:
Lactylation: A novel driver of drug resistance in the tumor
microenvironment. Cancer Drug Resist. 8:392025.PubMed/NCBI
|
|
66
|
Yang Y, Wu Y, Chen H, Xu Z, Lu R, Zhang S,
Zhan R, Xi Q and Jin Y: Research progress on the interaction
between glucose metabolic reprogramming and lactylation in tumors.
Front Immunol. 16:15951622025. View Article : Google Scholar : PubMed/NCBI
|
|
67
|
She H, Zheng J, Zhao G, Du Y, Tan L, Chen
ZS, Wu Y, Li Y, Liu Y, Sun Y, et al: Arginase 1 drives
mitochondrial cristae remodeling and PANoptosis in
ischemia/hypoxia-induced vascular dysfunction. Signal Transduct
Target Ther. 10:1672025. View Article : Google Scholar : PubMed/NCBI
|
|
68
|
Gong T, Wang QD, Loughran PA, Li YH, Scott
MJ, Billiar TR, Liu YT and Fan J: Mechanism of lactic
acidemia-promoted pulmonary endothelial cells death in sepsis: Role
for CIRP-ZBP1-PANoptosis pathway. Mil Med Res. 11:712024.PubMed/NCBI
|
|
69
|
Xu L, Ye Y, Gu W, Xu X, Chen N, Zhang L,
Cai W, Hu J, Wang T, Chao H, et al: Histone lactylation stimulated
upregulation of PSMD14 alleviates neuron PANoptosis through
deubiquitinating PKM2 to activate PINK1-mediated mitophagy after
traumatic brain injury. Autophagy. 21:1473–1491. 2025. View Article : Google Scholar : PubMed/NCBI
|
|
70
|
Peng X, He Z, Yuan D, Liu Z and Rong P:
Lactic acid: The culprit behind the immunosuppressive
microenvironment in hepatocellular carcinoma. Biochim Biophys Acta
Rev Cancer. 1879:1891642024. View Article : Google Scholar : PubMed/NCBI
|
|
71
|
Mi K, Chen Z, He J, Jiang C, Xia Y and
Peng J: P300-Mediated ARRB1 lactylation promotes mitochondrial
dysfunction and neuronal apoptosis in subarachnoid hemorrhage via
upregulating S100A9. Neurochem Res. 50:1742025. View Article : Google Scholar : PubMed/NCBI
|
|
72
|
Du S, Zhang X, Jia Y, Peng P, Kong Q,
Jiang S, Li Y, Li C, Ding Z and Liu L: Hepatocyte HSPA12A inhibits
macrophage chemotaxis and activation to attenuate liver
ischemia/reperfusion injury via suppressing glycolysis-mediated
HMGB1 lactylation and secretion of hepatocytes. Theranostics.
13:3856–3871. 2023. View Article : Google Scholar : PubMed/NCBI
|