Introduction
Kidney cancer accounts for 2–3% of all cancer cases
and the incidence rate is increasing (1). According to GLOBOCAN 2022 statistics,
the age-standardized incidence rate of kidney cancer worldwide is
4.6/100,000 person-years, ranging from 1.5 per 100,000 person-years
in Eastern Africa to 12.0 per 100,000 person-years in Northern
America (1). Globally, it was
estimated that there were 434,419 novel cases of kidney cancer and
155,702 mortalities in 2022 (1).
The most prevalent histological type of kidney cancer is renal cell
carcinoma, which constitutes ~90% of all cases (2). By contrast, primary neuroendocrine
tumors of the kidneys are extremely rare due to the absence of
neuroendocrine cells in normal kidney parenchyma (3). To date, 100–200 clinical cases have
been documented worldwide (4–6).
Primary neuroendocrine tumors of the kidneys are generally divided
into two categories: Poorly-differentiated and well-differentiated
tumors (7). Typical and atypical
carcinoid tumors are classified as well-differentiated
neuroendocrine tumors, whereas poorly-differentiated neuroendocrine
tumors include large and small cell neuroendocrine carcinomas.
Among them, primary renal small cell carcinoma (PRSCC) is a rare,
highly invasive and lethal histological subtype of renal cancer.
Lee et al (8) analyzed 45
cases and reported that PRSCC commonly exhibited large,
advanced-stage tumors that exhibit a high degree of malignancy and
have a poor prognosis (median survival of 9.9 months).
The origin of PRSCC remains incompletely understood.
Small cell carcinoma of the urogenital system may originate from
multifunctional stem cells of the urogenital tract (9–14).
PRSCC may be accompanied by urothelial carcinoma, squamous cell
carcinoma or adenocarcinoma, which may support this hypothesis. It
is hypothesized that tumors originate from normal neuroendocrine
cells and therefore, express neuroendocrine markers such as Syn and
CD56 (15). However, its
pathogenesis requires further study. Due to its highly malignant
biological behavior, there is an urgent need for in-depth research
to improve prognosis. Due to the rarity of PRSCC, current research
is limited to primarily retrospective clinical studies, including
case reports, and data on its genetic and molecular characteristics
are also scarce (16). To date,
there is only one cytogenetic study on PRSCC; La Rosa et al
(16) conducted a fluorescence
in situ hybridization (FISH) study on a patient with
confirmed PRSCC. The results demonstrated that the chromosome
assessment was complex, with highly unstable chromosomes, multiple
chromosomal gains, p53 loss and Myc gene amplification. These
results suggested that PRSCC has a distinct genetic background from
clear cell renal cell carcinoma (ccRCC), with the primary feature
being loss of the short arm of chromosome 3.
Furthermore, the clinicopathological characteristics
and prognostic analysis of patients with PRSCC have not been
systematically described to date. Next-generation sequencing (NGS)
provides notable evidence for the detection of genomic changes in
cancer. Since NGS can detect genetic mutations in tumors,
whole-exome sequencing (WES) was performed in the present study for
a 63-year-old male patient who presented with left flank pain and
was pathologically diagnosed with PRSCC in the left kidney.
Mutations, predisposing genes, driving genes and pathways
contribute to the development of PRSCC, making it a key field of
research (17–20). The findings from unbiased sequencing
of all protein-coding exons are presented and compared with normal
controls from the same patients, thereby identifying mutations that
may shed light on the biology of the tumor. Our study aimed to
characterize the genetic mutation spectrum underlying the
pathogenesis of PRSCC via WES, identify novel predisposing and
driver genes for the disease, and validate the detected mutations
with Sanger sequencing. It also aimed to reveal the
histopathological features of PRSCC associated with these genetic
mutations using immunohistochemistry (IHC). Additionally, the study
intended to systematically summarize the clinicopathological
characteristics and identify independent prognostic factors of
PRSCC through a population-based literature analysis, thereby
providing a theoretical basis for molecular targeted therapy and
prognostic assessment of this rare malignancy.
Materials and methods
Analysis of histopathological
characteristics
Clinical data and tissue sample
Clinical data and tissue samples were collected from
the Second Affiliated Hospital of Dalian Medical University.
Patients with PRSCC who were hospitalized in the Department of
Urology between May 2010 and May 2024 were retrospectively
analyzed. Inclusion criteria were as follows: i) Pathologically
confirmed diagnosis of PRSCC via histopathological examination; ii)
hospitalized in the Department of Urology, The Second Affiliated
Hospital of Dalian Medical University between May 2010 and May
2024; iii) Written informed consent provided by the patient for
study participation and use of biological samples/tissue specimens;
iv) Availability of formalin-fixed paraffin-embedded (FFPE) tumor
tissue specimens and adjacent normal renal tissue specimens for
experimental analysis. Exclusion criteria are as follows: i) No
pathological confirmation of PRSCC (e.g., metastatic small cell
carcinoma of other organs, other renal malignancies); ii) Lack of
available tumor/adjacent normal tissue specimens for WES and IHC;
iii) no written informed consent from the patient; iv) other
malignant tumors or severe systemic diseases that affect sample
analysis and clinical data interpretation. Due to the extreme
rarity of PRSCC, the present study included only one patient with
PRSCC. The Ethics Committee of the Second Affiliated Hospital of
Dalian Medical University approved the study protocol (approval no.
KY2025-472-01; Dalian, China) and the study was performed in
accordance with the principles of the Declaration of Helsinki for
research involving human subjects. Written informed consent was
obtained from patients for their participation and the use of their
samples.
Hematoxylin-eosin staining and
IHC
The tissue samples were fixed in 10% formalin,
embedded in paraffin, cut into 4 µm thick sections, stained with
hematoxylin and eosin and examined under a light microscope. Fresh
tumor and adjacent normal tissue samples were fixed in 10%
neutral-buffered formalin at room temperature (RT) for 24 h. The
paraffin-embedded tissue blocks were cut into 4 µm thick continuous
sections. Hematoxylin-eosin staining was performed at RT
(hematoxylin staining for 5 min and eosin staining for 2 min).
Hematoxylin-eosin staining images were captured under a light
microscope; Subsequently, the FFPE tissues were analyzed using IHC.
All steps were performed on FFPE tumor tissue sections (4 µm thick)
and adjacent normal renal tissue sections. Tissue sections were
dewaxed in xylene, followed by graded ethanol hydration. Hydrated
sections were incubated in sodium citrate buffer and heated at 95°C
for 20 min to retrieve masked epitopes of target proteins (CD56,
Syn, insulinoma associated protein 1, CgA and neuron specific
enolase). Sections were treated with 0.5% hydrogen peroxide for 20
min to quench endogenous peroxidase activity and eliminate
non-specific signal interference. Sections were permeabilized with
0.1% (v/v) Triton X-100 to enhance intracellular and membrane
protein accessibility for antibodies targeting internal epitopes
(CD56, Syn, insulinoma associated protein 1, CgA and neuron
specific enolase). Permeabilized sections were incubated with 5%
(w/v) bovine serum albumin (Sigma-Aldrich, Merck KGaA, Darmstadt,
Germany; Cat. No. A9647) at RT for 60 min to block non-specific
antibody binding sites. Sections were incubated with
target-specific primary antibodies (Table SI) overnight at 4°C to allow
specific antigen-antibody binding. Sections were incubated with
biotin-labeled goat anti-rabbit/mouse IgG secondary antibodies
(1:200; Catalogue No. BA-1000/BA-9200; Vector Laboratories,
Burlingame, CA, USA) at RT for 30 min, per the manufacturer's
standard protocol. Sections were incubated with HRP-labeled avidin
(per manufacturer's protocol) and developed with DAB. Sections were
stained with Mayer's hematoxylin at RT for 2 min to label cell
nuclei. IHC-stained sections were visualized and images captured
using an Olympus BX53 light microscope (Olympus Corporation, Tokyo,
Japan).
WES
DNA extraction
Following the manufacturer's instructions, genomic
DNA from PRSCC specimens and adjacent normal tissue was extracted
from FFPE materials using the GeneRead™ DNA FFPE Kit (Qiagen GmbH;
cat. No. 180134). The quality of the isolated genomic DNA was
evaluated using two approaches: A Qubit® DNA Assay Kit
on a Qubit® 2.0 Fluorometer (Invitrogen; Thermo Fisher
Scientific, Inc.) to assess DNA concentration, and 1% agarose gel
electrophoresis to assess DNA degradation and contamination.
Library preparation and
sequencing
Using a Covaris instrument, genomic DNA was
fragmented into 180–280 bp segments for WES. The whole exome was
captured according to the manufacturer's guidelines using an
Agilent SureSelect Human All Exon Kit (Agilent Technologies, Inc.).
Using an AMPure XP system (Beckman Coulter, Inc.), the products
were purified and subsequently quantified using an Agilent
high-sensitivity DNA assay on an Agilent Bioanalyzer 2100 system
(Agilent Technologies, Inc.). DNA libraries, ~150 bp in insert
size, were sequenced on an Illumina HiSeq platform (Illumina, Inc.)
at a sequencing facility in Novogene Co., Ltd. Paired-end
sequencing was performed using the Illumina HiSeq 4000 SBS kit
(Catalog No. FC-404-1003). The final libraries were normalized to a
loading concentration of 2 nM. The concentration was accurately
measured using the Qubit® dsDNA HS Assay Kit (Thermo
Fisher Scientific) and confirmed by quantitative PCR (qPCR) using
the KAPA Library Quantification Kit (Roche, Catalog No. KK4824) to
ensure precise molarity calculation for cluster generation.
Quality control
Raw sequencing data typically contained a few
adapter reads, previously unexplained nucleotides and low-quality
nucleotides. Ensuring the quality of the analysis required
filtering raw reads to obtain clean reads, which served as the
foundation for subsequent analysis. Paired reads that had adapter
contamination, >10% uncertain bases or >50% low-quality bases
were eliminated if they had a Phred quality score <5. The
quality and integrity of the processed clean reads were verified
using FastQC (v0.11.9,
bioinformatics.babraham.ac.uk/projects/fastqc/), with key metrics
including Phred quality scores (Q20/Q30), GC content distribution
and sequence length uniformity validated; the average Q30 ratio of
clean reads was >97% for both tumor and normal tissue,
indicating high sequencing accuracy. Clean reads were aligned to
the UCSC hg19 reference genome using BWA-MEM, and the aligned BAM
files were further quality-checked using SAMtools and Picard to
assess sequencing depth, mapping quality (MQ ≥30) and PCR
duplication rate (<5%). Only clean, high-quality data that
passed all the above quality verification steps were collected and
used to enable meaningful downstream analysis.
Bioinformatics analysis
Using the Burrows-Wheeler Aligner software (v0.7.17,
http://bio-bwa.sourceforge.net/), valid
sequencing reads were aligned to the reference genome (University
of California Santa Cruz human genome version 19) to generate BAM
files. Subsequently, Picard software (v2.26.10, Broad Institute,
http://broadinstitute.github.io/picard/) was used to
mark duplicate reads after sorting the BAM files with SAMtools
(v1.15.1, http://www.htslib.org/). The final BAM
files were used to calculate the sequence coverage and depth.
Carcinogenic signaling pathways from The Cancer Genome Atlas (TCGA)
database cohorts were collected and their enrichment in the sample
was assessed.
Variant calling and detection of
insertions and deletions (INDELs) and somatic mutations
To ensure meaningful analysis, variants [single
nucleotide polymorphisms (SNPs) and INDELs] were identified and
filtered using bcftools v1.23, SAMtools/HTSlib Team;
htslib.org/doc/bcftools.html and mpileup integrated in SAMtools
v1.23, htslib.org/doc/samtools-mpileup.html in SAMtools. Using the
Genome Analysis Toolkit (GATK, version 4.6.2.0,
gatk.broadinstitute.org/), all potential polymorphic SNP/INDEL
mutation sites in the exons were identified. ANNOVAR software
(v20210220, annovar.openbioinformatics.org/en/latest/) was used to
describe and annotate variant call formats, with reference to the
1000 Genomes Project, Database of Single Nucleotide Polymorphisms
(dbSNP) and other comparable databases. SNP/INDEL mutation data
were imported into R software (version 4.5.0, R Foundation for
Statistical Computing, Vienna, Austria) for mutational analysis.
Oncoplot (waterfall) graphs were generated using the maftools
package (version 2.24.0, bioconductor.org/packages/maftools/).
Somatic single nucleotide variations (SNVs) were detected using
MuTect (v2.2.7,
gatk.broadinstitute.org/hc/en-us/articles/360037593851-MuTect2),
and somatic INDELs were identified using Strelka (v2.9.10,
Illumina, Inc.; http://github.com/Illumina/strelka). Furthermore,
VarScan2 (version 2.4.6, github.com/dkoboldt/varscan) and
Control-FREEC software (v11.6, github.com/BoevaLab/FREEC) were
applied to identify variations in somatic copy number variations
(CNVs).
Kataegis rainfall analysis
A precipitation plot was used to visualize
hypermutated genomic regions, known as kataegis loci, by mapping
mutation frequency across chromosomes. Using the kataegis criterion
(21), genomic sites with
hypermutation were identified, characterized by an average of six
consecutive mutations within 1,000 bp. Using the baseline site
sequence as a starting point, six consecutive mutations were added
and the average mutation distance was calculated. When the average
interchange distance was >1,000, an element was appended to the
end of the queue and one was removed from the front. If the average
mutation distance was ≤1,000, the number of mutations was increased
until it was >1,000. Subsequently, all mutations in the sequence
were documented and created as a kataegis. The rainfall plot and
kataegis cluster identification were performed using R software
(version 4.2.2; R Development Core Team) with the GenVisR package
(version 1.34.0; Bioconductor).
Identification of predisposing
genes
Predisposing genes can confer susceptibility to
disease or increase vulnerability when exposed to specific
environmental stimuli. SAMtools was used to identify germline
mutations (SNVs and INDELs), and the findings were filtered using
the Cancer Gene Census (CGC, v98, cancer.sanger.ac.uk/census)
database to identify potential cancer-predisposing genes. The
detailed methods in filtering mutation sites were as follows: i)
Variant sites with a depth of <10× were filtered out; ii) the
variant loci in the 1000 Genomes Project database (frequency
>0.01 in the population) were filtered, the diversity loci among
individuals were removed and rare mutations that were likely to
cause disease were obtained. The mutation sites with frequencies
<0.01 in the 1000 Genomes Project database and Catalogue Of
Somatic Mutations In Cancer (COSMIC, v98;
cancer.sanger.ac.uk/cosmic) database were retained; iii) the
variations in the exonic region or the splicing region (2 bp
upstream of the splicing site) were retained. Specifically, the
variation sites located in the intron, non-coding and intergenic
regions were filtered out; iv) synonymous mutations (mutations that
did not cause changes in amino acid coding) were removed to obtain
mutations that had an impact on the protein product (retaining
mutations including frameshift and non-frameshift mutations in
INDEL); and v) based on the scores of Sorting Intolerant From
Tolerant (SIFT), Polymorphism Phenotyping v2-Human Variation
(PolyPhen2_HVAR) and PolyPhen2_ Human Diversity (HDIV) for
filtering, if a mutation was determined as a harmful mutation in at
least one database or as a moderately harmful mutation in ≥2 or
more databases, it was retained. The dbNSFP database was annotated
for non-synonymous mutations, primarily assessing amino acid
conservation and pathogenicity using corresponding computational
scores. These scores included SIFT (v6.2.1,
sift.bii.a-star.edu.sg/), PolyPhen-2 (v2.2.2,
genetics.bwh.harvard.edu/pph2/) (including both HVAR and HDIV
models), Functional Analysis Through Hidden Markov Models (v2.3,
University of Bristol; http://fathmm.biocompute.org.uk/), MutationTaster
(v2.0, Charité-Universitätsmedizin Berlin; http://www.mutationtaster.org/), Genomic Evolutionary
Rate Profiling++ (v2.1, Stanford University; http://github.com/sidowlab/gerp++), MutationAssessor
(r3, Memorial Sloan Kettering Cancer Center; http://mutationassessor.org/), Phylogenetic P-values
(v1.5, Cold Spring Harbor Laboratory; http://compgen.cshl.edu/phast/), Likelihood Ratio Test
(v1.5, Cold Spring Harbor Laboratory; http://compgen.cshl.edu/phast/phyloP-tutorial.php),
and Site-specific Phylogenetic (v1.5, Cold Spring Harbor
Laboratory; http://compgen.cshl.edu/phast/). Different scoring
systems are based on different algorithms to evaluate the
conservation and pathogenicity of mutations. Each score corresponds
to the original score (score), the converted score
(score_converted) and the predicted classification (pred). The
present study primarily screened for mutations classified as
predicted by SIFT (score ≤0.05) and PolyPhen2_HVAR (score ≥0.909).
Scores were interpreted as follows: Variants with SIFT scores
0.00–0.05 were considered harmful and a PolyPhen score of 0.00
indicated a benign variant. Based on the American College of
Medical Genetics (ACMG) scoring annotation results, the loci
annotated as harmful, potentially harmful or ambiguous were
retained. The final screening was conducted in accordance with ACMG
guidelines (22). Furthermore,
SAMtools was used to explore germline mutations, including SNVs and
INDELs, in the normal tissues from patients. Potential predisposing
genes based on germline mutations were identified and compared
against CGC.
Identification of potential driver
mutations
High-frequency mutant genes detected in a large
number of samples, which may serve as candidate genes for disease
occurrence and progression, were identified. Driver genes were
those genes considered notable in the occurrence and development of
diseases. Once driver genes were identified, personalized and
precise medical treatment may be provided to patients in a targeted
manner. SNP and INDEL data from all previous sample analyses were
used to identify potential driver genes using the OncodriveCLUSTL
algorithm (23). Furthermore,
MutSigCV (24) was used to identify
high-frequency mutant genes and these results were combined with
analyses from the OncodriveCLUSTL algorithm to identify driver
mutations. Additionally, a secondary verification was performed by
amplifying the DNA fragment using PCR and the products were
sequenced using Sanger sequencing to identify the mutant base.
Genomic DNA extracted from the original FFPE tumor tissue using the
QIAamp DNA FFPE Advanced Kit (Qiagen) was used as the template for
PCR. Amplification was performed using the KAPA2G Fast HS PCR Kit
(Kapa Biosystems, Inc.) according to the manufacturer's
instructions. Prior to sequencing, PCR products were
electrophoresed on a 2.0% (w/v) agarose gel containing GelRed
Nucleic Acid Gel Stain (Biotium, Inc.). Target amplicons were
visualized using a Gel Doc XR + Imaging System (Bio-Rad
Laboratories, Inc.), excised, and purified using the QIAquick Gel
Extraction Kit (Qiagen). Purified products were then subjected to
Sanger sequencing. Primer sequences and detailed PCR conditions are
presented in Tables SII and
SIII.
Functional enrichment analysis of
predisposing and driver genes
Functional enrichment analyses of the identified
predisposing and driver genes were performed to annotate their
biological functions and associated signaling pathways using the
Gene Ontology (GO) database (geneontology.org/), Kyoto Encyclopedia
of Genes and Genomes (KEGG) database (genome.jp/kegg/), and
Eukaryotic Orthologous Groups (KOG) database
(ncbi.nlm.nih.gov/COG/KOG/). For GO analysis, the genes were
categorized into three main ontologies: biological process (BP),
cellular component (CC), and molecular function (MF); significantly
enriched GO terms were screened based on the biological relevance
to PRSCC pathogenesis. For KEGG analysis, gene enrichment in
canonical signaling pathways and biological pathways was identified
to reveal the molecular mechanisms underlying PRSCC development
associated with the candidate genes. For KOG analysis, the genes
were classified into orthologous functional categories to further
annotate their conserved cellular and molecular functions across
eukaryotes.
Population-based study
Literature published before October 2025 was
searched for studies on patients with PRSCC in PubMed (https://pubmed.ncbi.nlm.nih.gov/) and EMBASE
(https://www.elsevier.com/products/embase) databases
using the keywords ‘renal’, ‘small cell carcinoma’ and ‘kidney’
with the appropriate Boolean modifiers. The analysis included only
patients with complete follow-up information. As detailed in
Table SIV, 60 patients were
included from the literature. Their clinicopathological features,
such as age, sex, symptoms, tumor size, laterality, primary site,
pathological tumor (T) stage, lymph node metastasis, distant
metastasis, surgery, chemotherapy, follow-up time and survival
status, were collected.
Statistical analysis
Univariate Cox regression analyses were performed to
identify variables significantly associated with overall survival
(OS). Variables with a P<0.05 from the univariate analysis were
subsequently included in the multivariate analysis. A multivariate
analysis was performed using a Cox proportional-hazards model to
identify independent prognostic factors for PRSCC. According to the
univariate or multivariate analyses, hazard ratios (HR) and their
corresponding 95% confidence intervals (CI) were calculated.
P<0.05 was considered to indicate a statistically significant
difference. All statistical analyses were performed using R
software (version 4.2.2; R Development Core Team).
Results
Analysis of histological and
pathological features
Case report
A 63-year-old male patient presented to the
Department of Urology at the Second Affiliated Hospital of Dalian
Medical University (Dalian, China) in October 2016, complaining of
left flank pain. A routine urine test indicated positive occult
blood (++) and a blood test indicated an abnormally elevated serum
creatinine level (127 µmol/l). A full abdominal computed tomography
examination was performed, which revealed a cystic mass in the left
kidney, along with left kidney stones and severe hydronephrosis
(Fig. S1). The patient and their
family strongly requested surgical treatment, so a left nephrectomy
was performed in October 2016. The macroscopic examination revealed
the left kidney and perirenal fat, measuring 13×9×10 cm. The renal
parenchyma was thinner, measuring 0.3–1 cm. The renal pelvis and
calyces were dilated, and several stones were present inside. A
grayish-yellow, brittle mass was identified in the renal hilum,
measuring ~6×6×6.5 cm, without a capsule and with ill-defined
margins. It involved the renal pelvis mucosa, perirenal and renal
sinus fat. Subsequently, the pathologist performed hematoxylin and
eosin staining. Using light microscopy, tumor-like small round
cells were present diffusely in patches or nest-like infiltrative
patterns (Fig. S2). The nucleus
was large and strongly stained, with fine chromatin, no obvious
nucleolus and readily visible mitotic figures. The cytoplasm was
not distinct and the nucleoplasmic ratio was increased. The tumor
cells were densely arranged and certain cells were relatively
large, with a cytoplasm that appeared powdery. It presented a
glandular tubule-like or nested structure. Nerve invasion and
intravascular tumor thrombi were identified. The final pathological
diagnosis was PRSCC, a poorly differentiated neuroendocrine
carcinoma, classified according to the World Health Organization
Classification of Tumors of the Urinary System and Male Genital
Organs (25). The patient was
followed up until August 2025, via outpatient clinic visits and
telephone interviews.
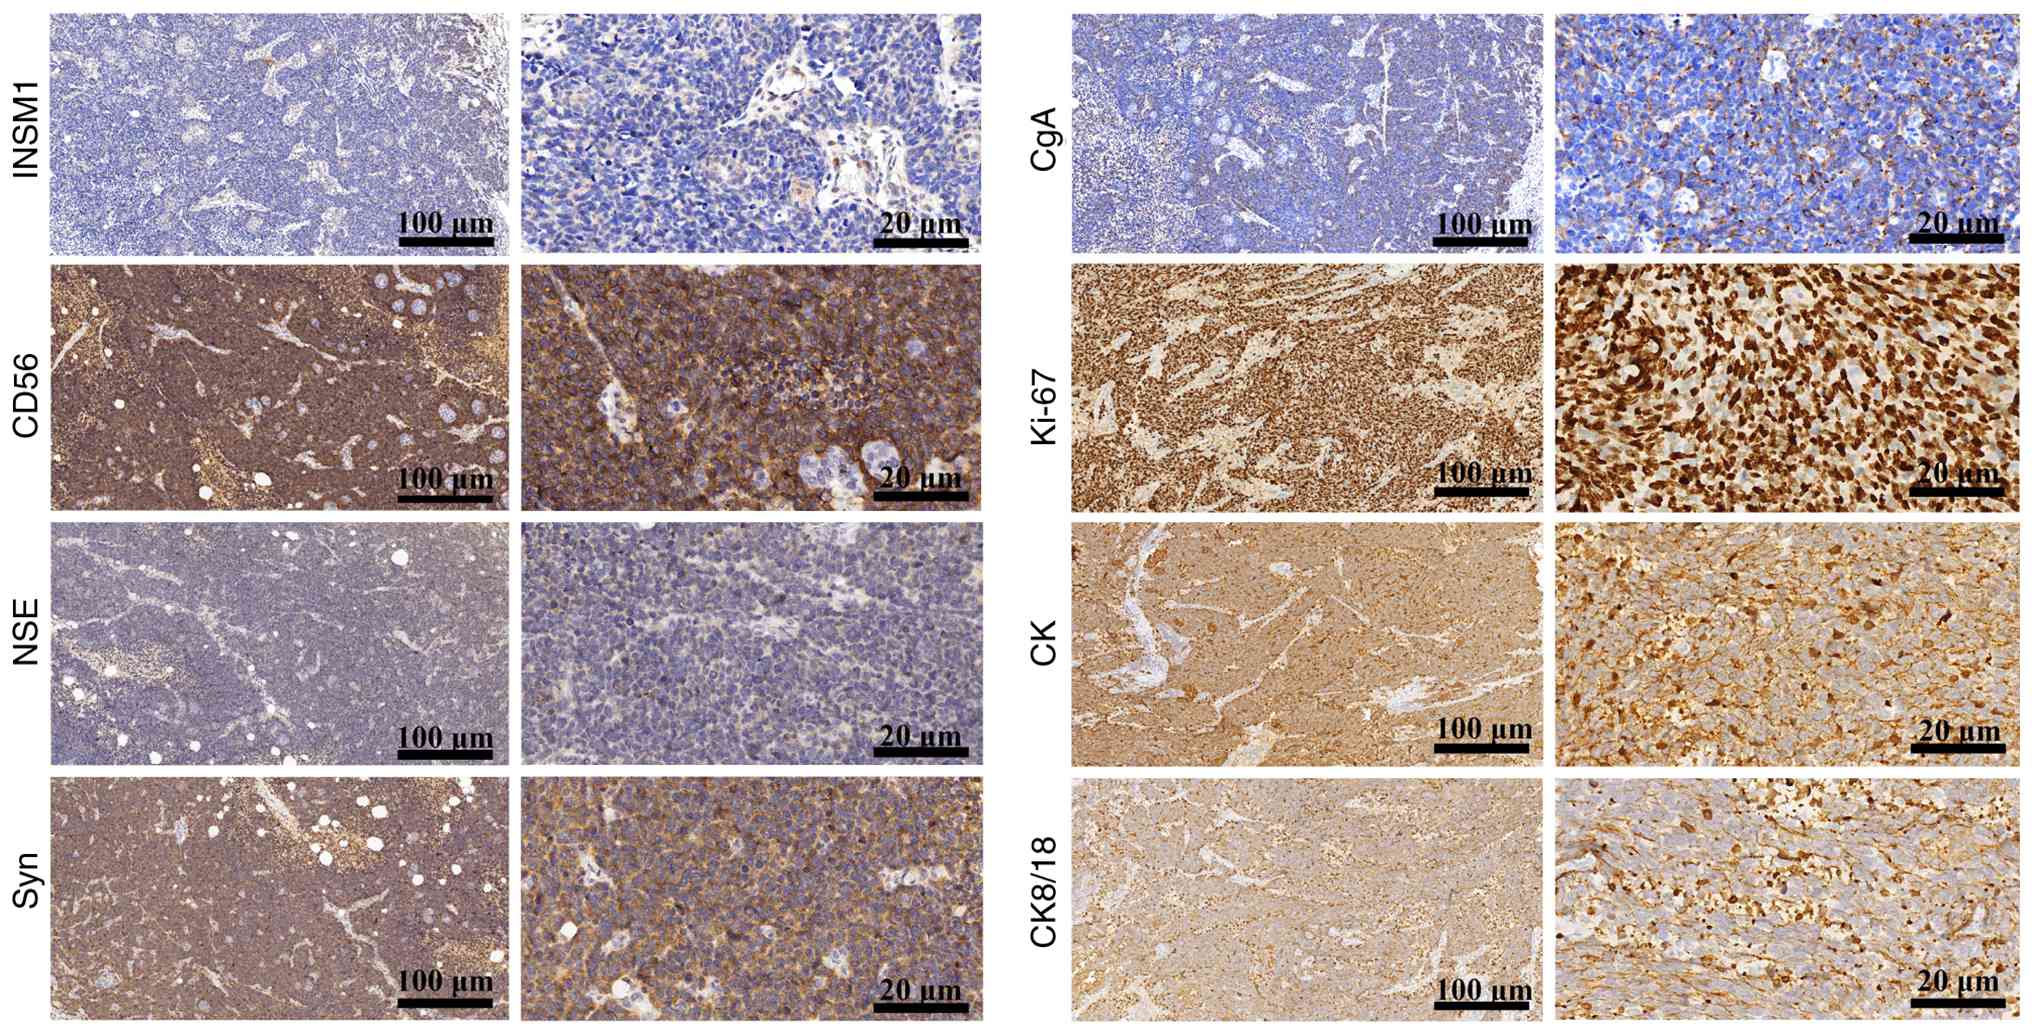
Immunohistochemical profile
The histopathological manifestation of PRSCC was
confirmed by protein expression profiling using IHC. IHC analysis
revealed that CD56 and Syn were diffusely and strongly positive,
whereas INSM1, CgA and NSE were focally and weakly positive,
aligning with the tumor characteristics of PRSCC (Fig. 1). Proliferative activity was high,
as indicated by a Ki-67 proliferation index of ~80% (Fig. 1). Furthermore, moderate expression
level of CK and CK8/18 suggested that the tissue originated from
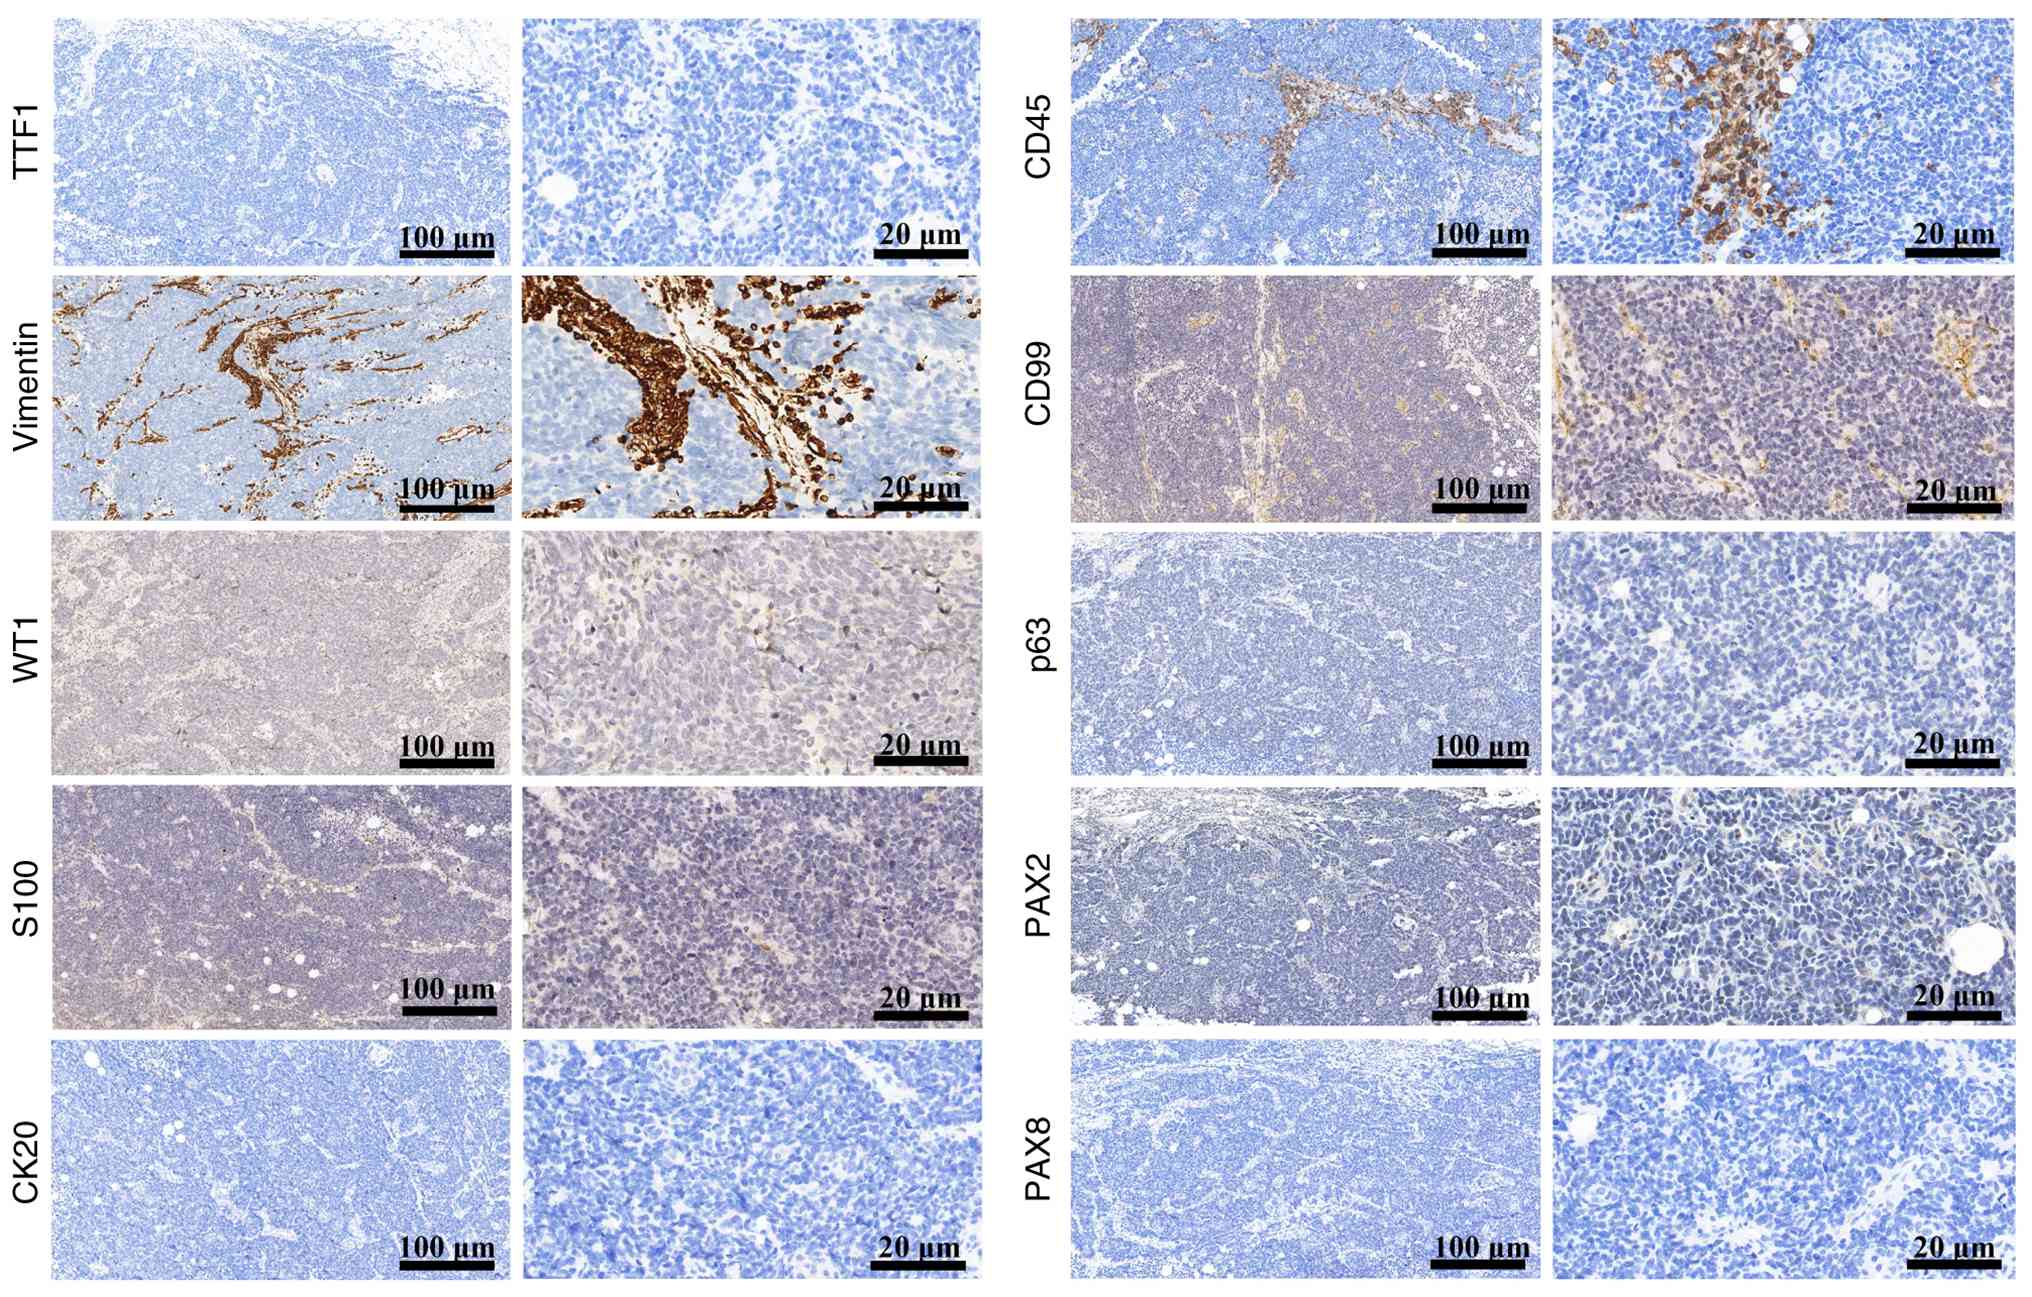
epithelial cells (Fig. 1). Negative
staining of S100, WT1, CD45, CD99 and p63 helped differentiate
PRSCC from paraganglioma, Wilms' tumor, malignant lymphoma, Ewing
sarcoma/peripheral primitive neuroectodermal tumor and high-grade
urothelial carcinoma, respectively (Fig. 2); negative staining of TTF1 helped
differentiate PRSCC from metastatic small cell carcinoma; and
negative staining of CK20, PAX-2, PAX-8 and vimentin helped
differentiate PRSCC from urothelial and renal cell carcinoma
(including papillary renal cell carcinoma and ccRCC) (Fig. 2).
WES
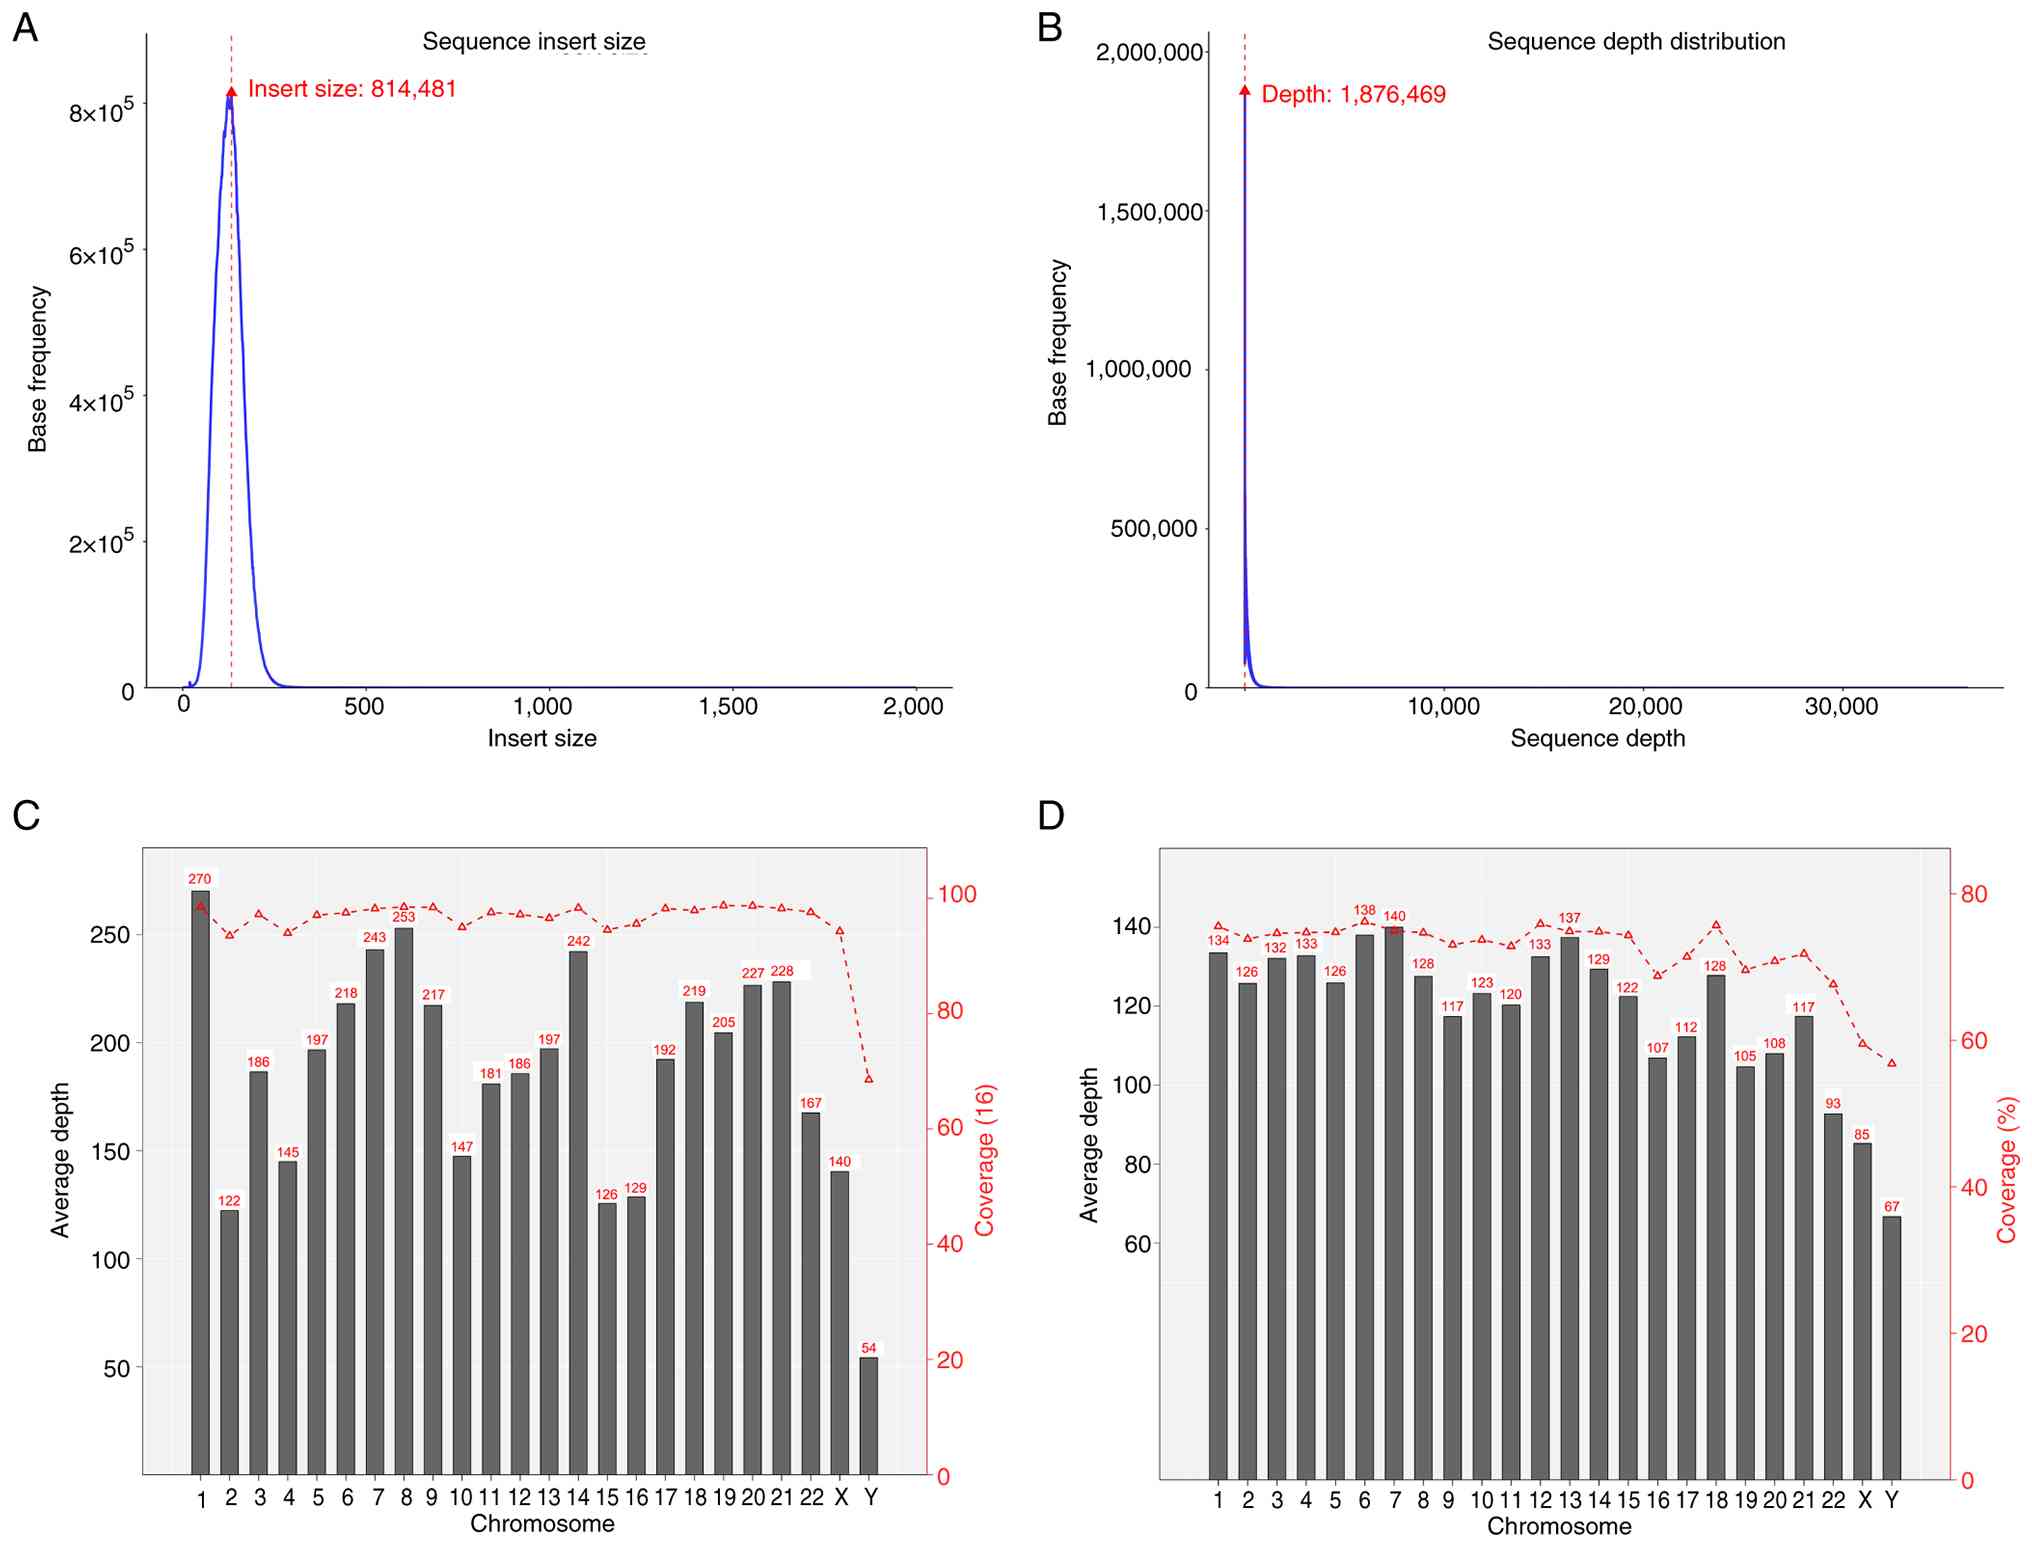
Quality control and insert length analysis
FastQC was used to visually assess the sequencing
data quality of the sample, based on statistics derived from raw
data quality metrics. There was a total of 112,834,018 raw reads in
tumor tissues compared with 159,776,604 raw reads in adjacent
normal tissues. The overall Q30 average was >90%, indicating
that the error rate remained <0.1%. Filtering the raw data was
necessary to obtain clean data (Table
I). The insert size distribution for Read1 and Read2 obtained
from paired-end sequencing encodes three key relational features:
Sequence direction, distance and interconnection (Fig. 3A). Detecting genomic variations,
particularly structural variants, relies heavily on this
information. A sequencing depth density map was used to reflect the
accuracy of variation detection. The higher the distribution of
sequencing depth, the further the coverage of challenging regions,
the more of the reference genome that is covered, the more mutation
sites that can be detected and the more information the sequencing
data can provide (Fig. 3B). For
exon/capture region sequencing, the average sequencing depth of the
whole genome was not statistically significant. The average
coverage depth column chart and the coverage line chart for tumor
and adjacent normal tissue samples are presented in Fig. 3C and D, respectively.
 | Table I.Statistics of the raw data and clean
data of each sample. |
Table I.
Statistics of the raw data and clean
data of each sample.
| Indicator | Raw data tumor
tissue (PRSCC) | Raw data normal
tissue | Clean data tumor
tissue (PRSCC) | Clean data normal
tissue |
|---|
| Total reads count,
n | 112,834,018 | 159,776,604 | 111,594,896 | 158,320,116 |
| Total bases count,
bp | 16,925,102,700 | 23,966,490,600 | 15,086,783,085 | 21,781,554,681 |
| Average read
length, bp | 150 | 150 | 135 | 138 |
| Q20 bases count,
bp | 16,687,640,537 | 23,640,865,068 | 14,935,245,674 | 21,562,055,054 |
| Q20 bases ratio,
% | 98.60 | 98.64 | 99.00 | 98.99 |
| Q30 bases count,
bp | 16,365,557,723 | 23,171,331,259 | 14,673,417,986 | 21,171,498,497 |
| Q30 bases ratio,
% | 96.69 | 96.68 | 97.26 | 97.20 |
| GC content, % | 46.82 | 48.87 | 46.25 | 48.57 |
Identification of SNPs and INDELs
Typically, the genome of an individual includes ~3.6
million SNPs. High-frequency SNPs are predominantly recorded in the
dbSNP database. The distribution of SNPs and INDELs across
different genomes and coding regions is presented in Table II. A total of 83,934 SNPs were
identified in PRSCC specimens and 28,228 SNPs in adjacent normal
specimens, with most being identified in coding sequence (CDS)
areas. Deletions occurring at splicing sites or coding regions may
impact protein translation. Additionally, the genome of each
individual generally harbors ~350,000 INDELs. A total of 2,489
INDELs were identified in PRSCC specimens and 2,206 INDELs in
adjacent normal specimens, with majority of INDELs identified in
CDS areas.
| Table II.Number of SNPs and INDELs in
different regions of the genome and coding regions. |
Table II.
Number of SNPs and INDELs in
different regions of the genome and coding regions.
| A, SNPs |
|---|
|
|---|
| Sample | PRSCC, n | Normal, n |
|---|
| CDS | 83,169 | 27,916 |
| Synonymous_SNP | 31,963 | 10,798 |
| Missense_SNP | 47,838 | 15,882 |
| Stopgain | 2,169 | 819 |
| Stoploss | 26 | 14 |
| Startloss | 74 | 34 |
| Unknown | 1,099 | 369 |
| Intronic | 54 | 31 |
| UTR3 | 5 | 7 |
| UTR5 | 48 | 13 |
| Splicing | 39 | 15 |
| ncRNA_exonic | 171 | 59 |
| ncRNA_intronic | 10 | 7 |
| ncRNA_UTR3 | 0 | 0 |
| ncRNA_UTR5 | 0 | 0 |
| ncRNA_splicing | 0 | 0 |
| Upstream | 17 | 3 |
| Downstream | 4 | 2 |
| Intergenic | 54 | 27 |
|
Frameshift_deletion | - | - |
|
Frameshift_insertion | - | - |
| Others | 363 | 148 |
| Total | 83,934 | 28,228 |
|
| B,
INDELs |
|
| Sample | PRSCC,
n | Normal,
n |
|
| CDS | 2,338 | 2,106 |
|
Frameshift_deletion | 725 | 506 |
|
Frameshift_insertion | 741 | 839 |
|
Non-frameshift_deletion | 429 | 238 |
|
Non-frameshift_insertion | 233 | 278 |
| Stopgain | 123 | 186 |
| Stoploss | 4 | 5 |
| Startloss | 8 | 5 |
| Unknown | 75 | 49 |
| Intronic | 3 | 5 |
| UTR3 | 0 | 0 |
| UTR5 | 4 | 3 |
| Splicing | 66 | 37 |
| ncRNA_exonic | 9 | 1 |
| ncRNA_intronic | 1 | 2 |
| ncRNA_UTR3 | 0 | 0 |
| ncRNA_UTR5 | 0 | 0 |
| ncRNA_splicing | 0 | 0 |
| Upstream | 0 | 0 |
| Downstream | 0 | 0 |
| Intergenic | 2 | 1 |
| Others | 66 | 51 |
| Total | 2,489 | 2,206 |
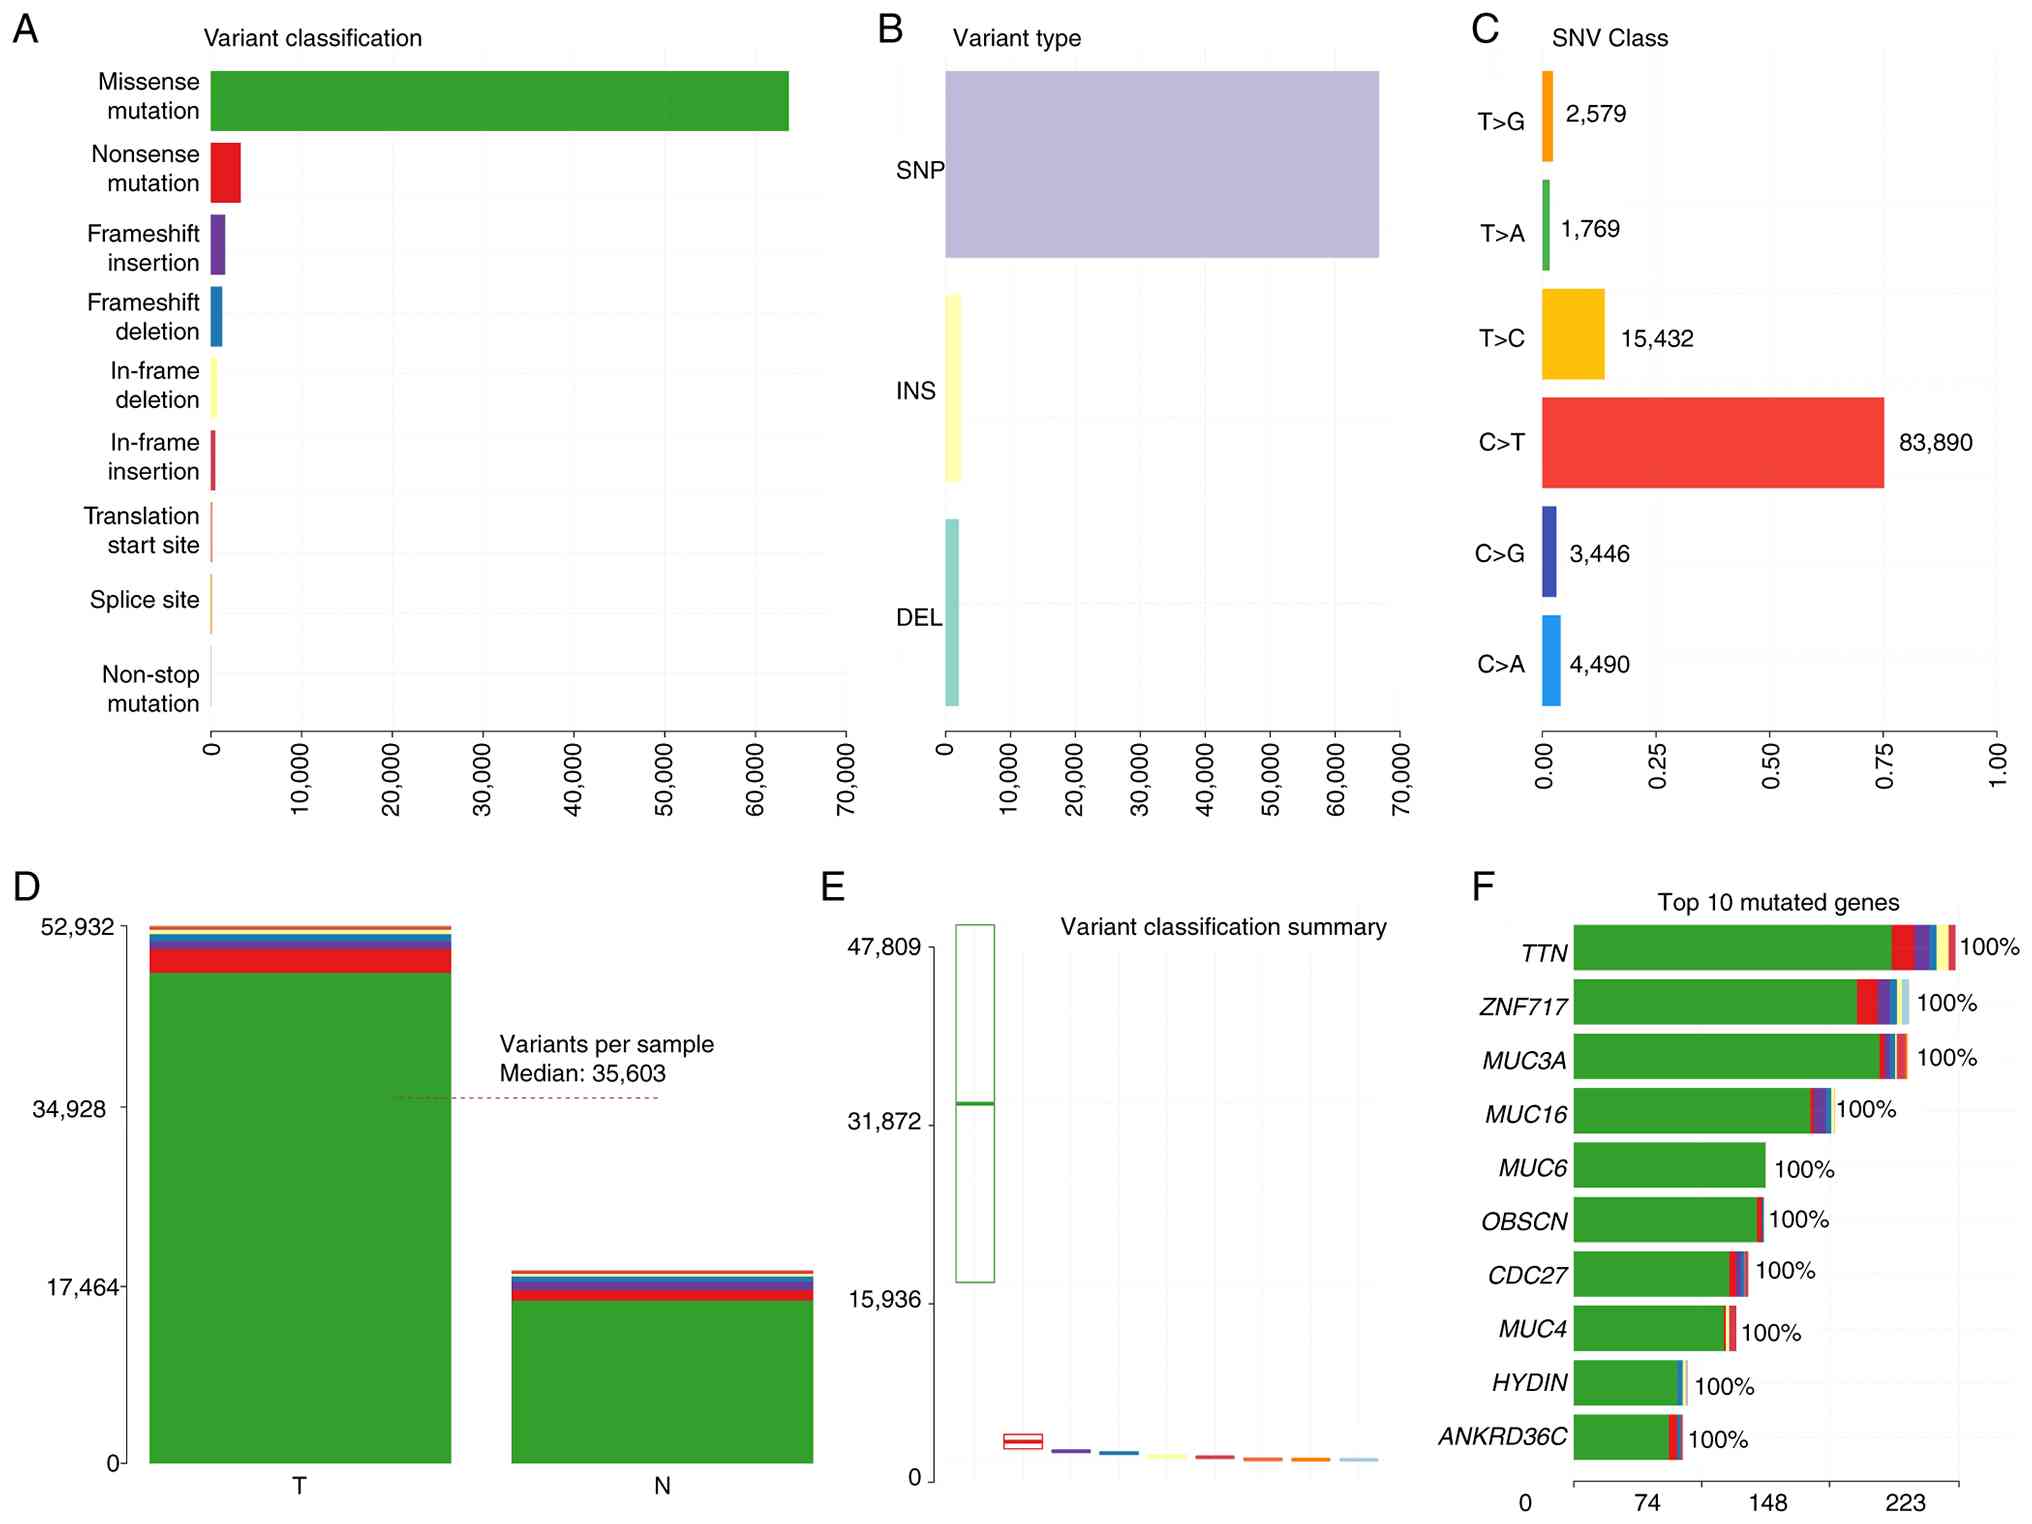
Identification of somatic SNVs/INDELs,
CNV and structural variation (SV) mutations
The mutation sites were filtered and screened based
on repeatability, depth and quality value to obtain a
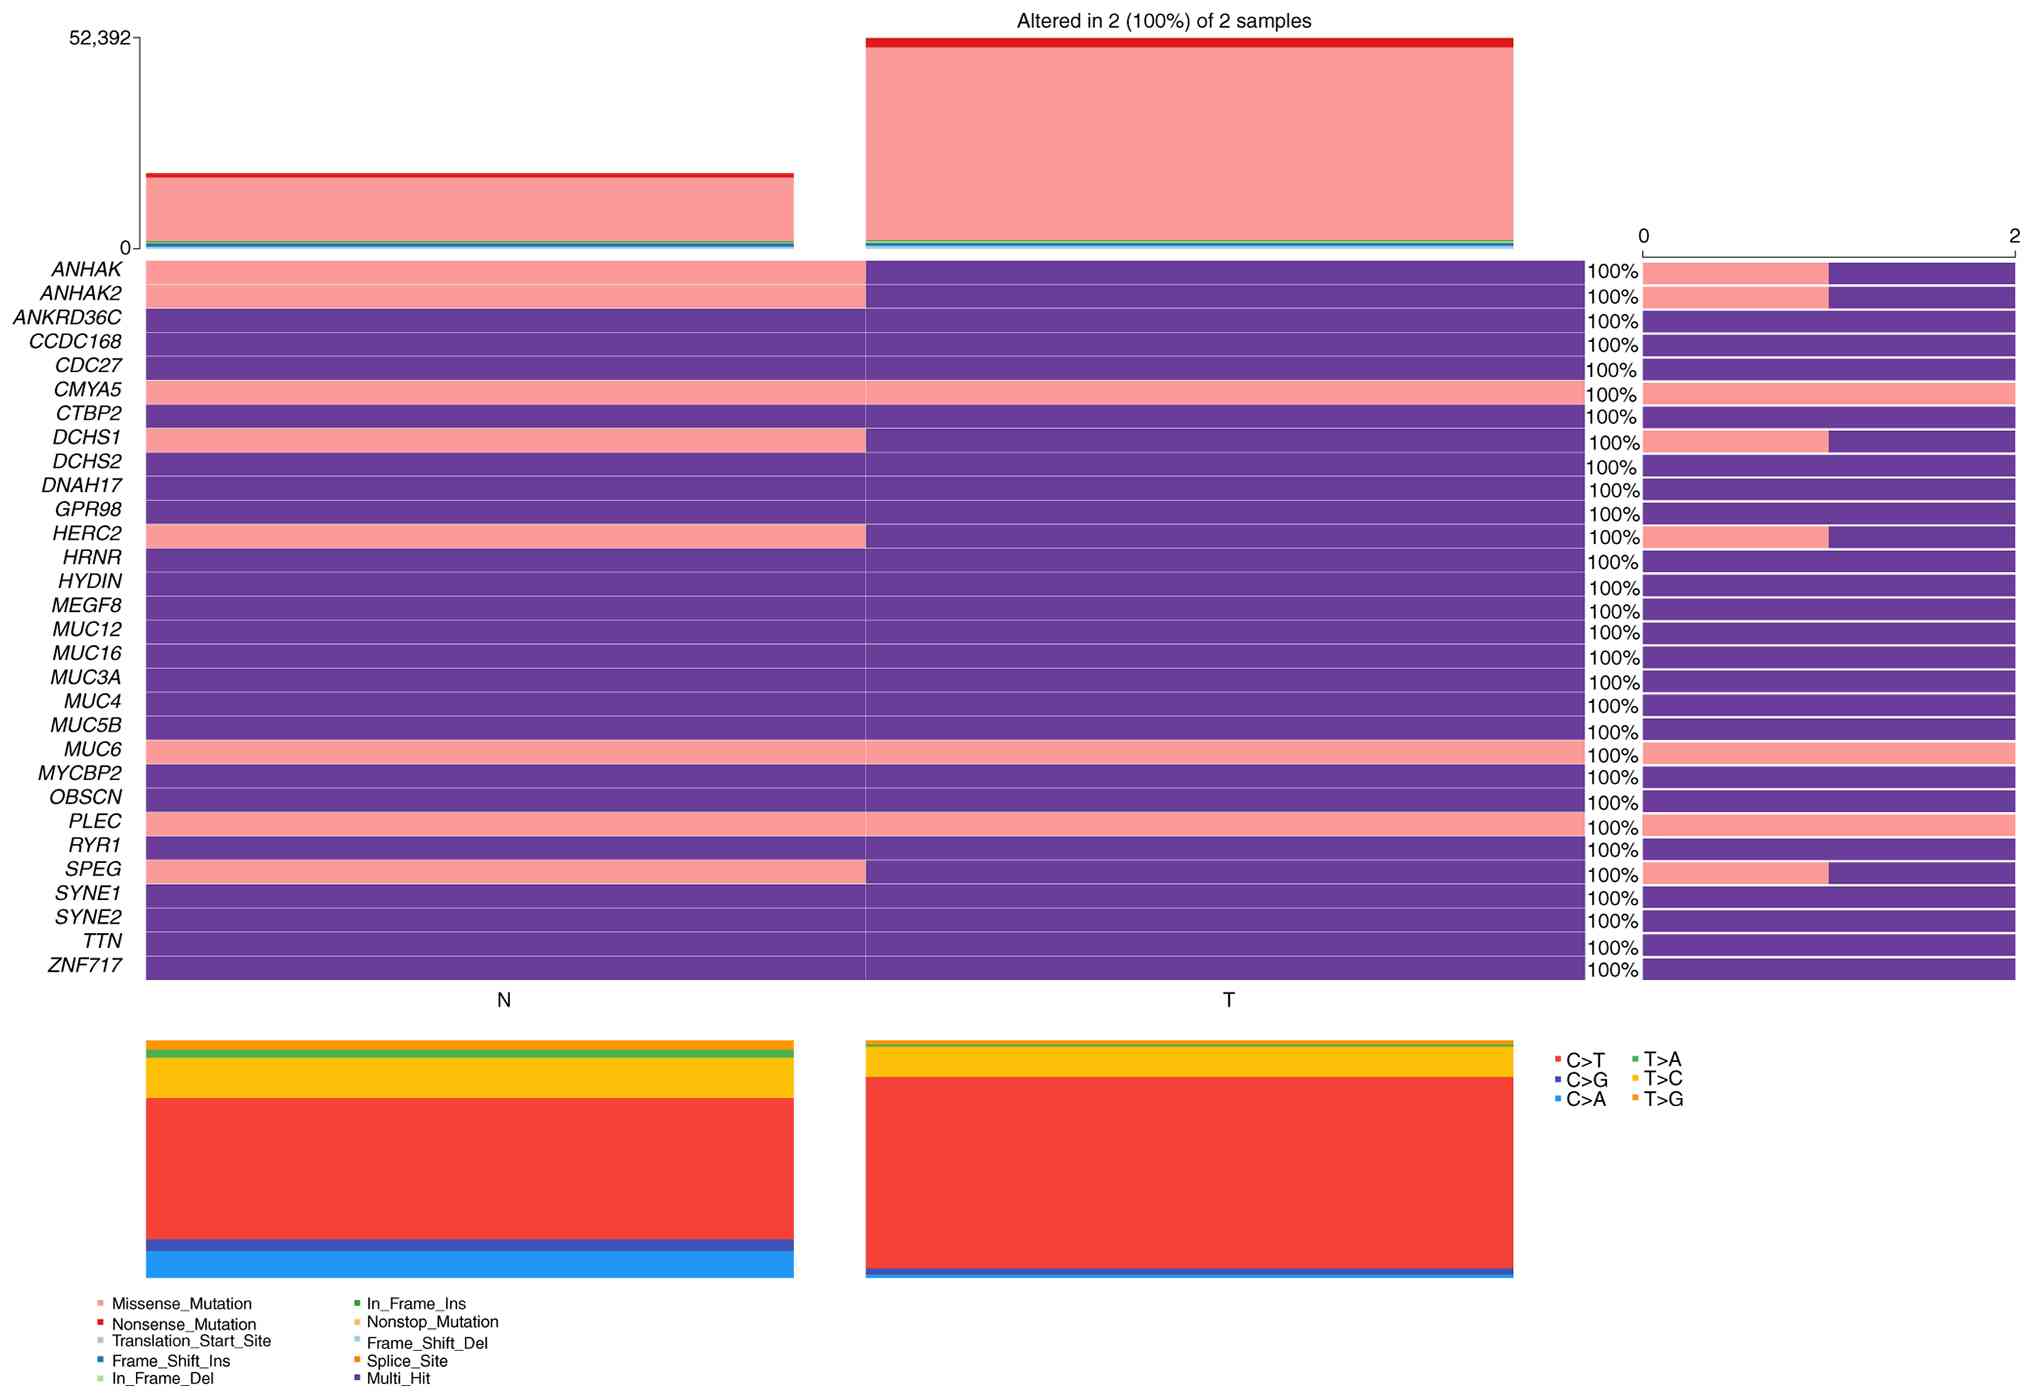
high-confidence mutation dataset annotated using ANNOVAR. A total
of 63,677 missense mutations and 3,294 nonsense mutations were
identified. Furthermore, somatic mutations were detected in genes
not previously known to be associated with PRSCC, and the following
were the top 10 types of mutant genes: TTN, ZNF717, MUC3A, MUC16,
MUC6, OBSCN, CDC27, MUC4, HYDIN and ANKRD36C (Fig. 4). Subsequently, the mutation
analysis is presented in the form of oncoplot (waterfall) graphs
(Fig. 5). An SNV is a variation
that arises from the replacement of a single nucleotide in the
genome. ‘MuTect’ was primarily used to identify somatic SNV
mutation sites. A total of 113 somatic SNVs were identified, the
majority of which were located in the intronic and CDS regions. As
presented in Table III, the
somatic SNVs were distributed across different genomic regions.
Additionally, using ‘Strelka’, a total of 26 somatic INDELs were
identified. Similarly, the majority of the somatic INDEL sites were
located in the intronic and CDS regions. Table III presents the somatic INDEL
detection results across the various genomic regions.
| Table III.Number of somatic SNVs and INDELs in
different regions of the genome. |
Table III.
Number of somatic SNVs and INDELs in
different regions of the genome.
| A, SNV |
|---|
|
|---|
| Sample | PRSCC, n |
|---|
| CDS | 44 |
| Synonymous_SNV | 13 |
| Non-synonymous
_SNV | 29 |
| Stopgain | 2 |
| Stoploss | 0 |
| Unknown | 0 |
| Intronic | 56 |
| UTR3 | 2 |
| UTR5 | 1 |
| Splicing | 0 |
| ncRNA_exonic | 3 |
| ncRNA_intronic | 2 |
| ncRNA_UTR3 | 0 |
| ncRNA_UTR5 | 0 |
| ncRNA_splicing | 0 |
| Non-frameshift
substitution | 2 |
| Upstream | 0 |
| Downstream | 0 |
| Intergenic | 3 |
| Others | 0 |
| - | - |
| Total | 113 |
|
| B,
INDELs |
|
| Sample | PRSCC,
n |
|
| CDS | 13 |
|
Frameshift_deletion | 3 |
|
Frameshift_insertion | 5 |
|
Non-frameshift_deletion | 2 |
|
Non-frameshift_insertion | 3 |
| Stopgain | 0 |
| Stoploss | 0 |
| Unknown | 0 |
| intronic | 8 |
| UTR3 | 1 |
| UTR5 | 0 |
| Splicing | 0 |
| ncRNA_exonic | 2 |
| ncRNA_intronic | 2 |
| ncRNA_UTR3 | 0 |
| ncRNA_UTR5 | 0 |
| ncRNA_splicing | 0 |
| Upstream | 0 |
| Downstream | 0 |
| Intergenic | 0 |
| Others | 0 |
| Total | 26 |
CNVs, defined as changes in the number of copies of
genomic segments, are the primary source of SVs and are classified
into duplications and deletions. The gain and loss counts of CNVs
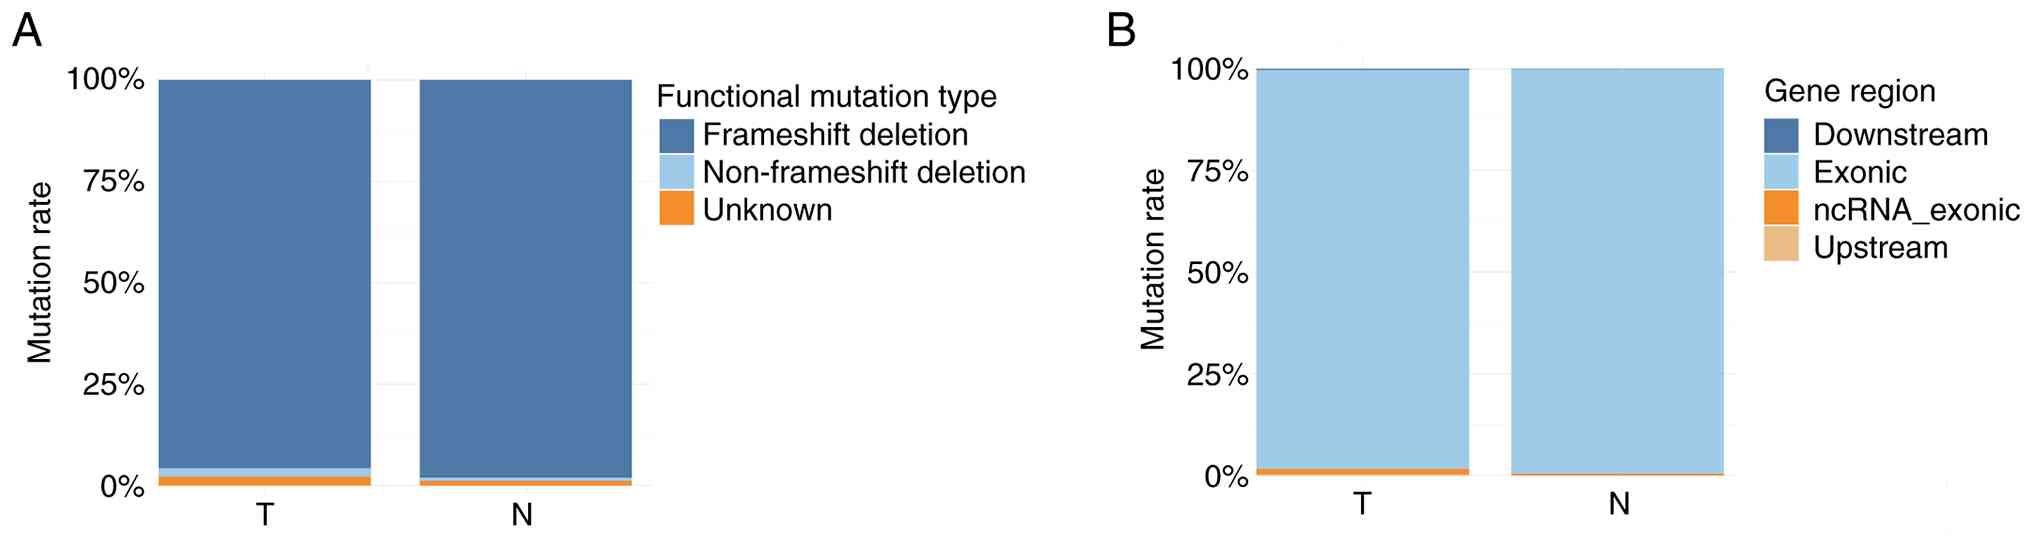
were 76 and 193 in tumor specimens, respectively. There were 356
frameshift deletions (95.7%), 8 non-frameshift deletions (2.2%),
and 8 unknown (2.2%) mutation types (Fig. 6A). Regarding the region of mutation,
365 were exonic (98.1%), 5 ncRNA exonic (1.3%), 1 upstream (0.3%)
and 1 downstream (0.3%) (Fig. 6B).
By contrast, the gain counts and loss counts of CNVs were 65 and
186 in adjacent normal specimens, respectively. There were 253
frameshift deletions (98.1%), 2 non-frameshift deletions (0.8%) and
3 unknown (1.2%) mutations (Fig.
6A). Furthermore, 257 were exonic (99.6%) and 1 ncRNA_exonic
(0.4%) (Fig. 6B).
Genomic SV is a general term for sequence variants
involving >50 base pairs. Delly was used for SV detection and to
count the various SV types. Delly can identify five types of SV
mutations: Deletion (DEL), insertion (INS), duplication (DUP),
inversion (INV) and translocation (BND). For tumor specimens, 5,894
unknown (87.6%), 595 start-loss (8.8%), 141 frameshift deletions
(2.0%), 68 non-frameshift deletions (1.0%), 24 stop-loss (0.4%) and
7 stop-gain (0.1%) functional types were identified (Fig. 7A). Regarding the distribution of the
mutations by region, 3,727 were exonic (58.9%), 1,659 intronic
(26.2%) and 945 intergenic (14.9%) mutations (Fig. 7B). Furthermore, the present study
identified 2,832 BND (42.1%), 1,936 INV (28.8%), 1,063 DEL (15.8%)
and 898 DUP (13.3%) (Fig. 7C). For
adjacent normal specimens, a total of 3,831 mutations (91.5%) were
classed as unknown, 329 start-loss (7.9%), 15 frameshift deletions
(0.4%), 8 non-frameshift deletions (0.2%), 3 stop-loss (0.07%) and
3 stop-gain (0.07%) (Fig. 7A).
Regarding the regions of mutations, 1,752 were exonic (44.6%),
1,362 intronic (34.7%) and 812 intergenic (20.7%) (Fig. 7B). Furthermore, 2,692 BND (64.3%),
763 INV (18.2%), 386 DEL (9.2%) and 348 DUP (8.3%) mutations were
identified (Fig. 7C).
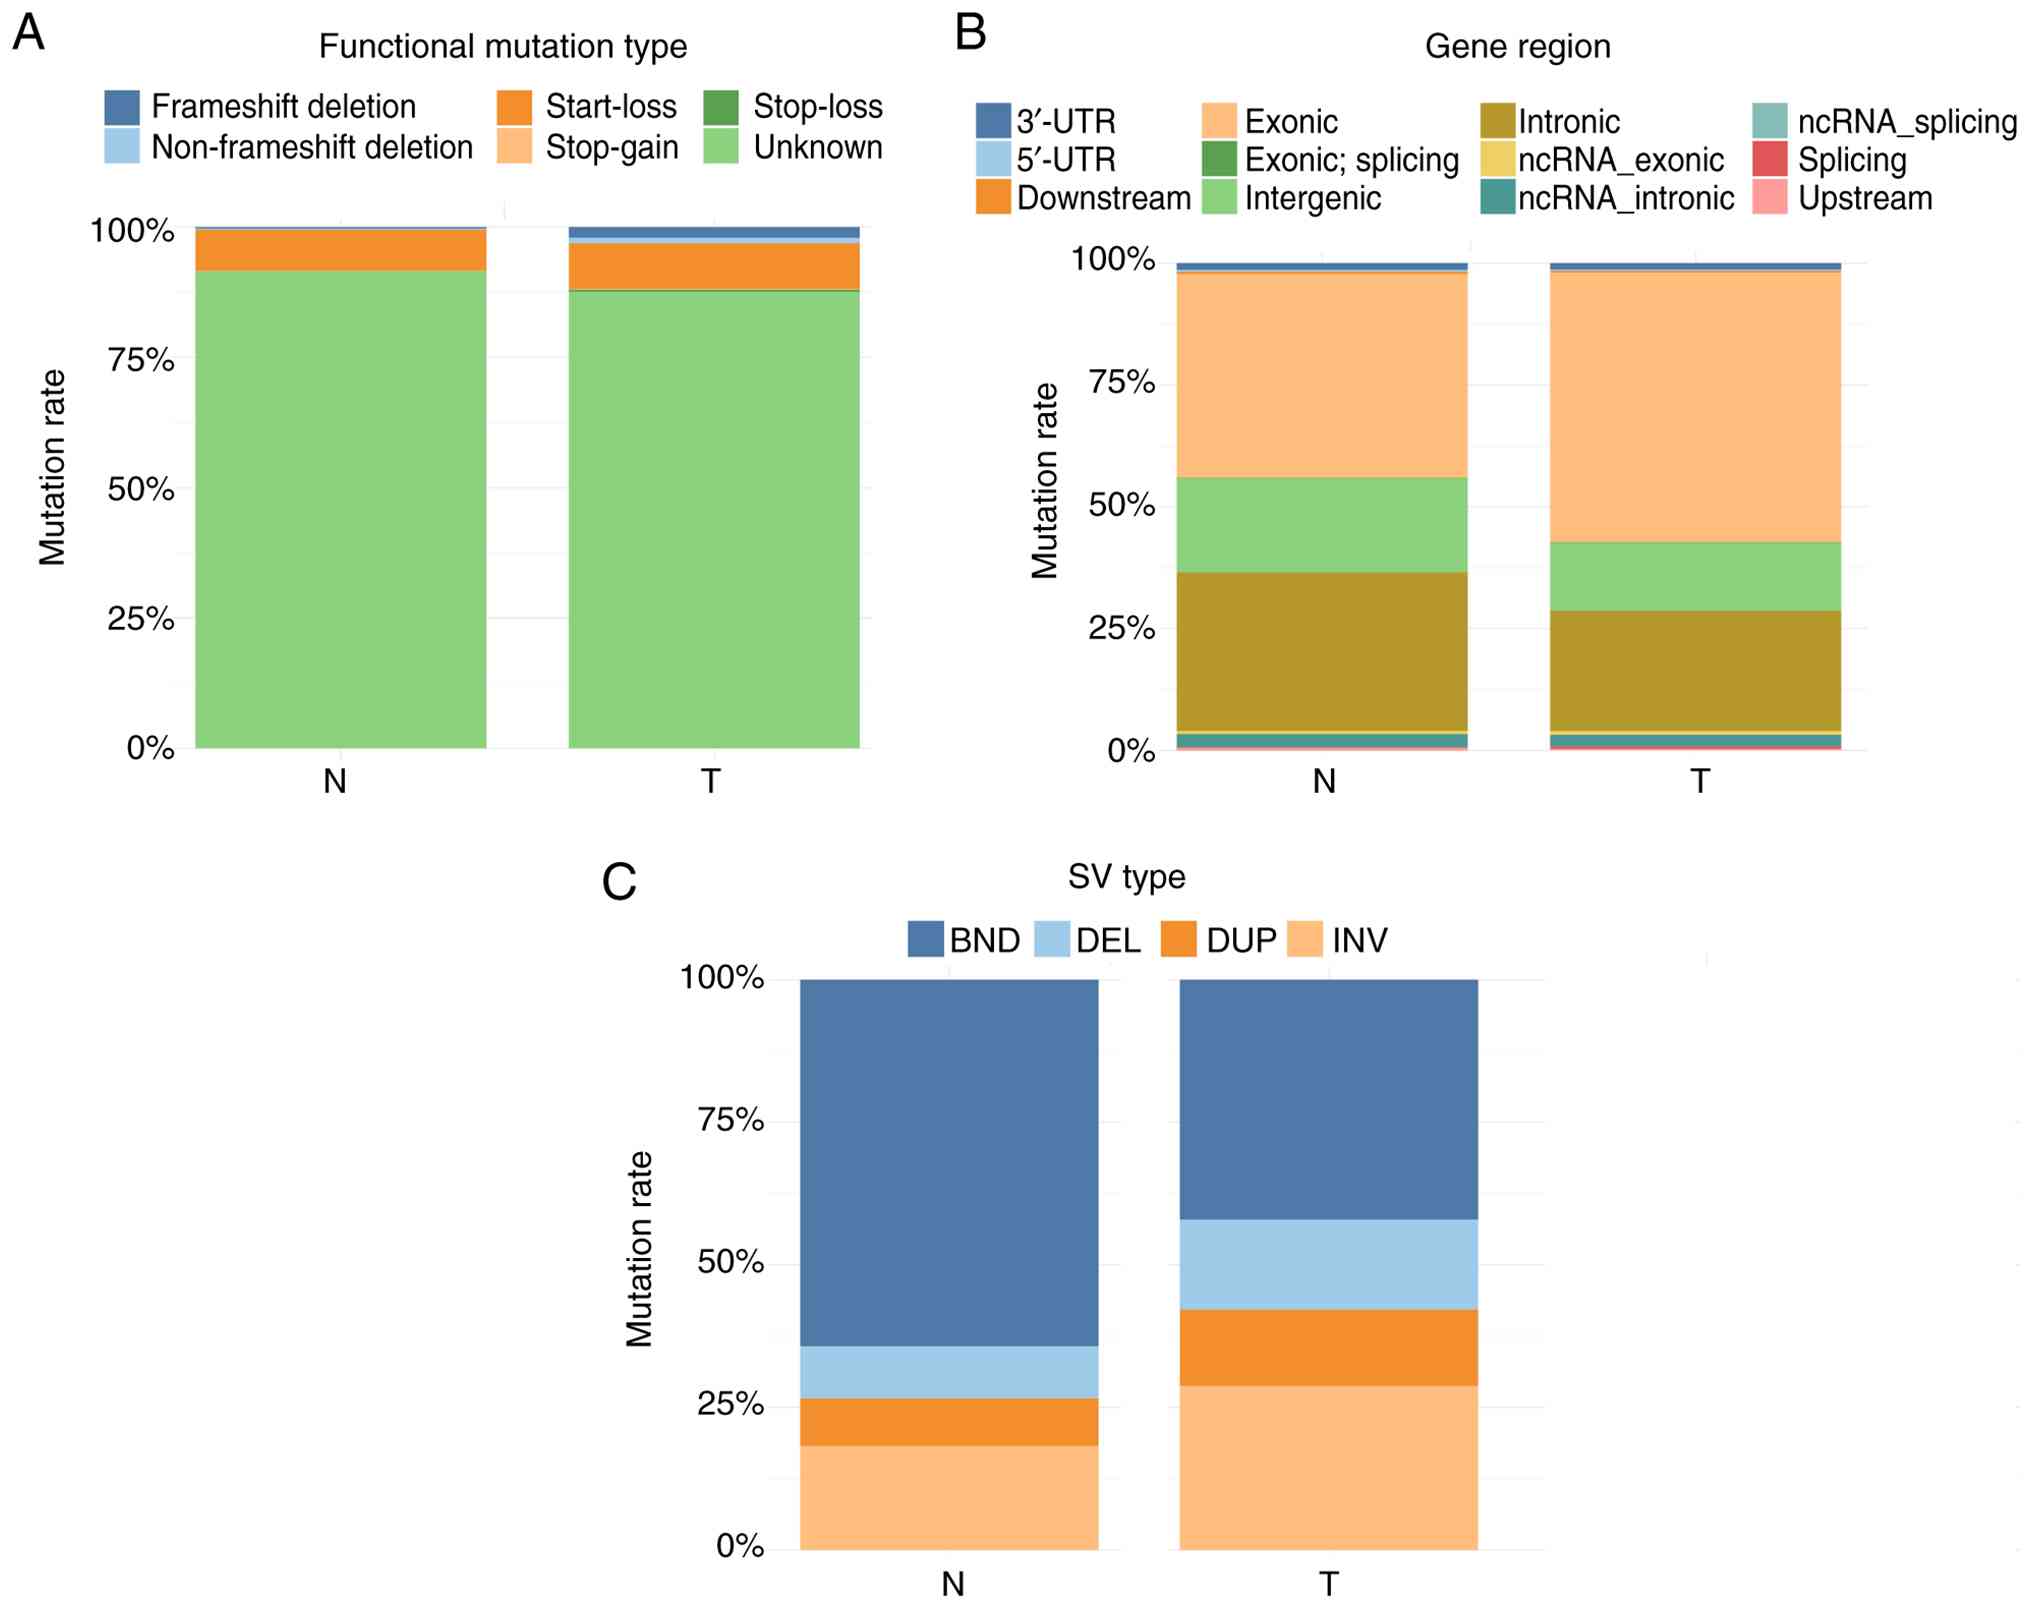 | Figure 7.Summary of the SV mutations. (A)
Distribution of the functional types of SV mutations. The
horizontal axis shows the samples, and the vertical axis shows the
relative frequency of each functional mutation type. (B)
Distribution of the SVs in the different regions of the genome. The
horizontal axis shows the samples, and the vertical axis shows the
relative frequency of the mutational regions. (C) Distribution of
the different types of SV mutations. The horizontal axis shows the
samples, and the vertical axis shows the relative frequency of each
mutation type. SV, structural variation; ncRNA, non-coding RNA;
BND, translocation; DEL, deletion; DUP, duplication; INV,
inversion; UTR, untranslated region. |
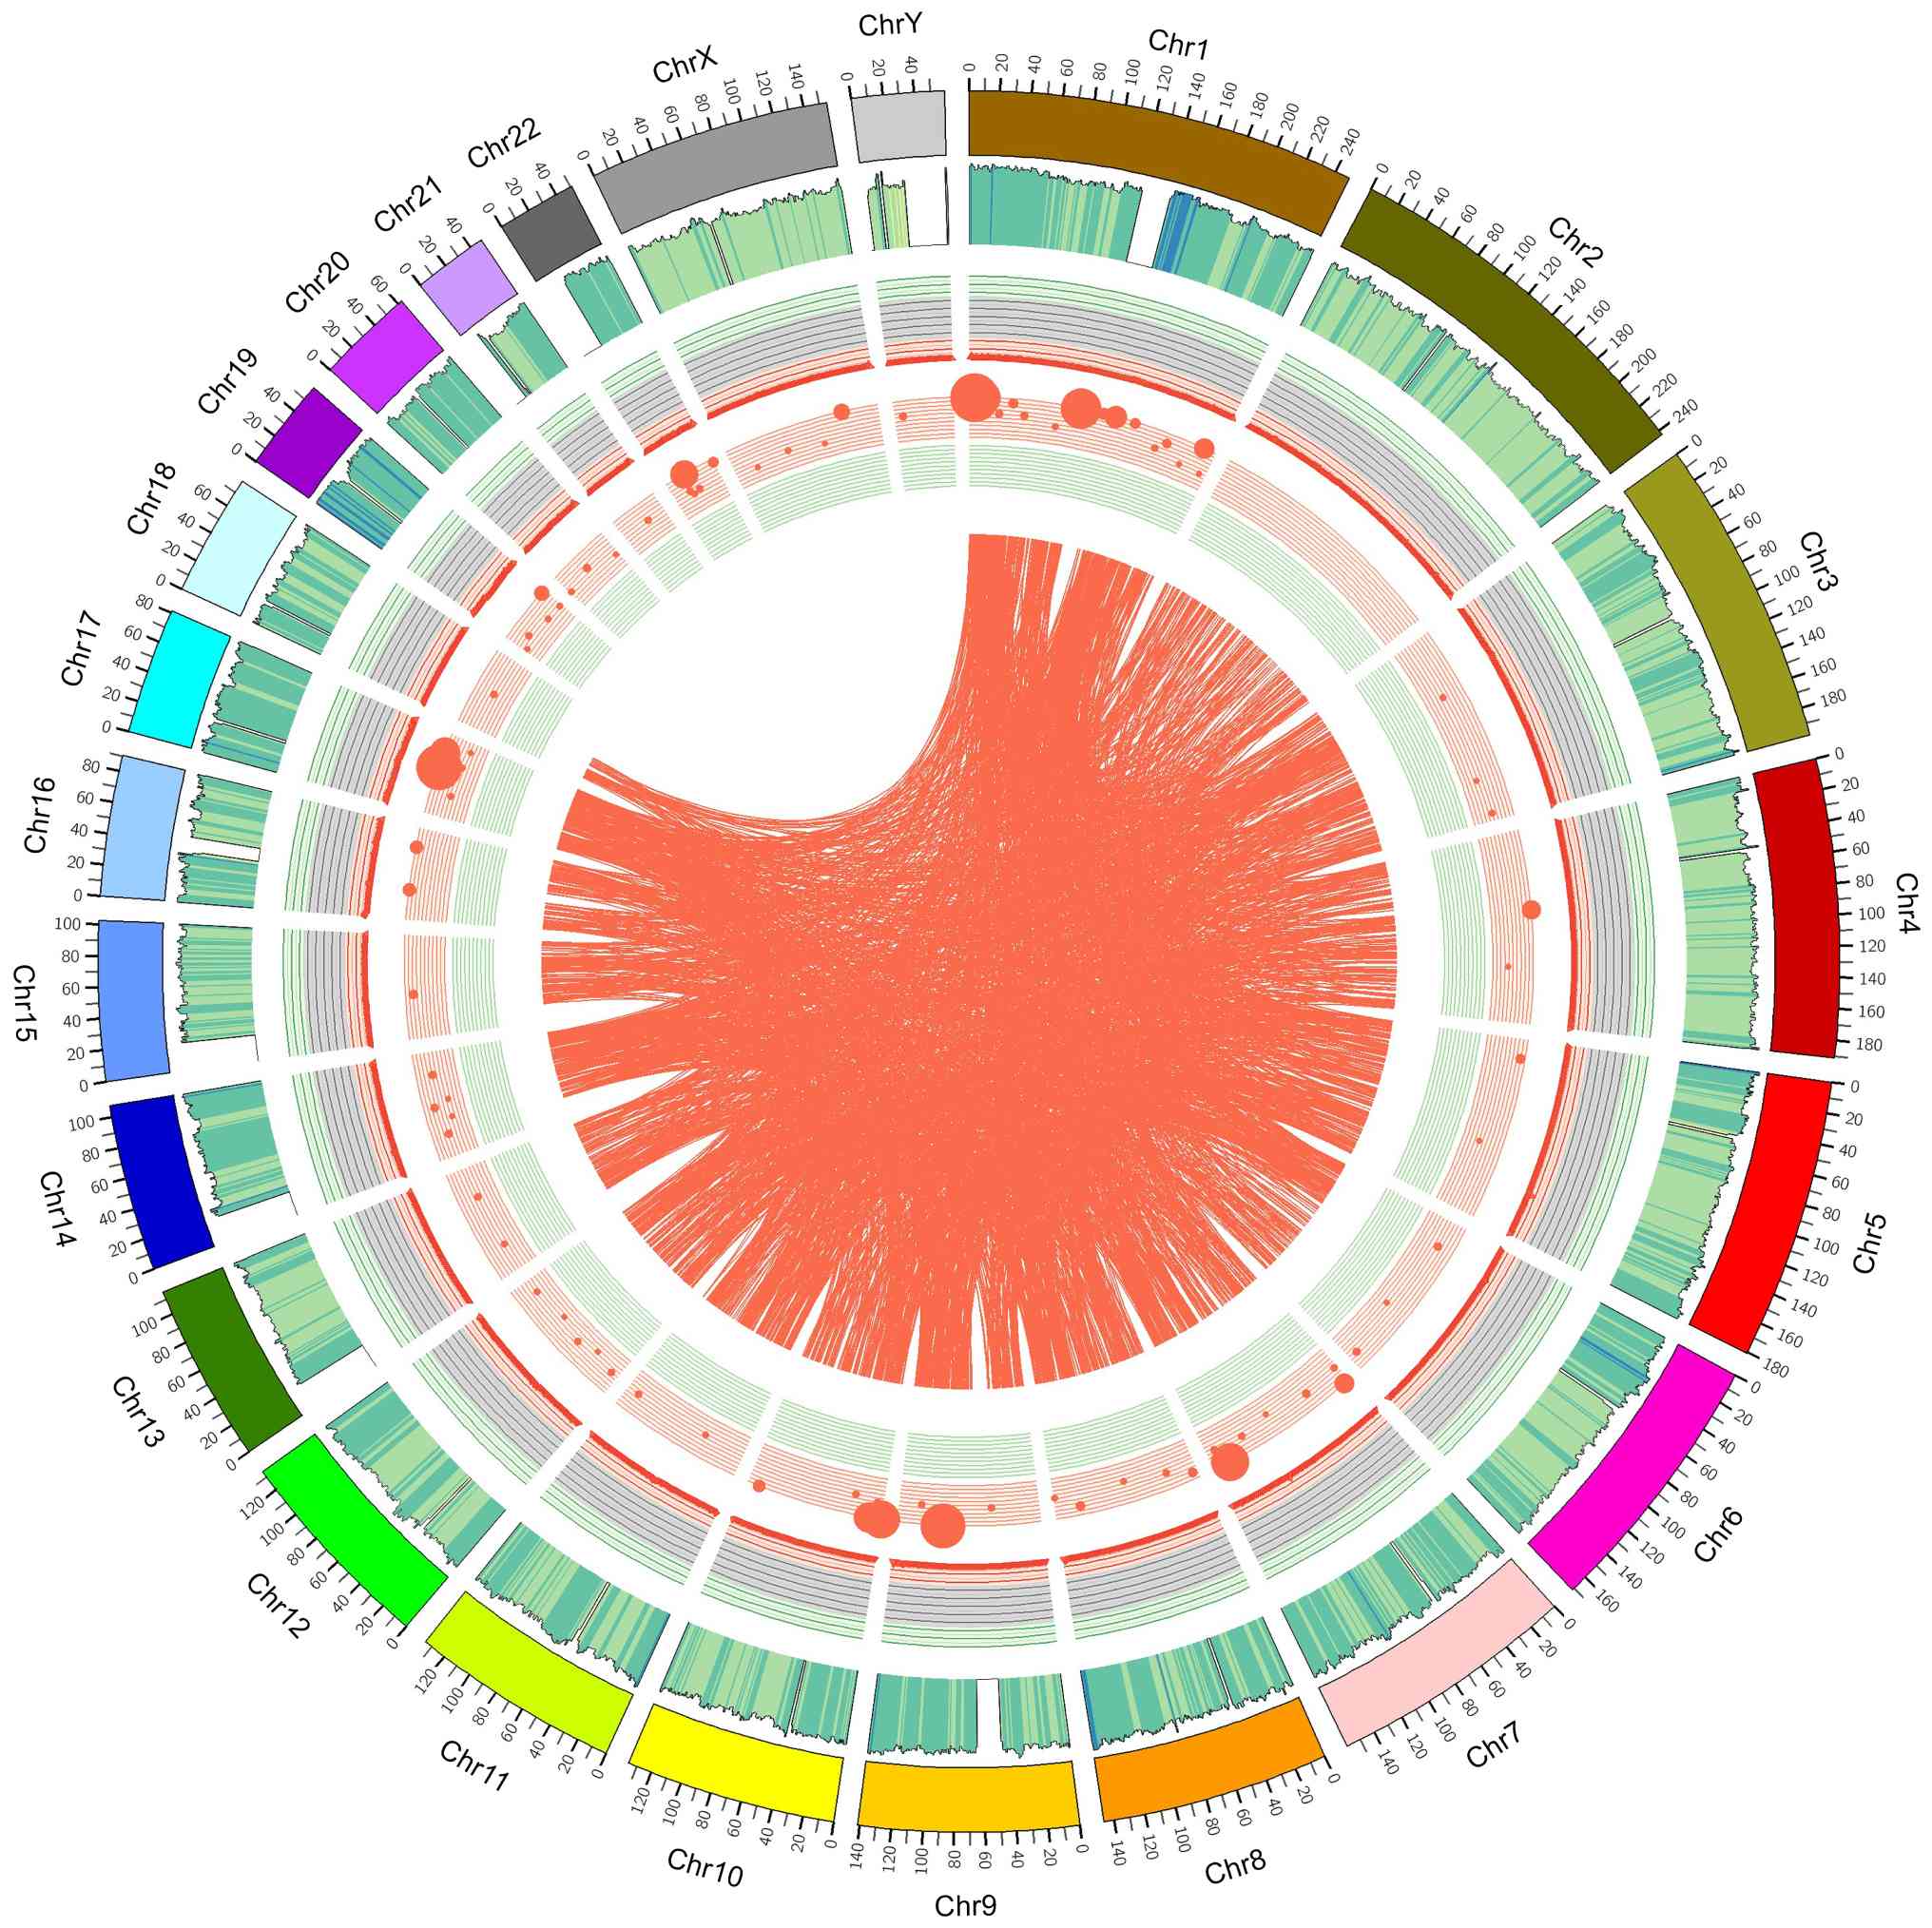
The correctness of the SNP dataset was evaluated
using the transition/transversion (Ts/Tv) ratio. Based on
permutation and combination principles, SNPs can undergo six types
of substitutions: C ↔ G, C ↔ T, A ↔ G, A ↔ T, A ↔ C, and G ↔ T.
Structural reasons make the probability of transition higher than
that of transversion. The Ts/Tv ratio across the whole gene was
~2.2, whereas it was ~3.2 in the coding region; in the present
study, 83,890 C>T substitutions were identified (~75.2%). The
distribution of chromosome-based variants was displayed as a Circos
plot to depict the somatic cell variation in the PRSCC sample
(Fig. 8).
Enrichment analysis of known
carcinogenic pathways
A total of 75 genes were associated with the
‘receptor tyrosine kinase (RTK)-Ras’ pathway, followed by 60 genes
for ‘NOTCH’ and 54 genes for ‘Wnt’. Additional carcinogenic
signaling pathways are listed in Table
SV.
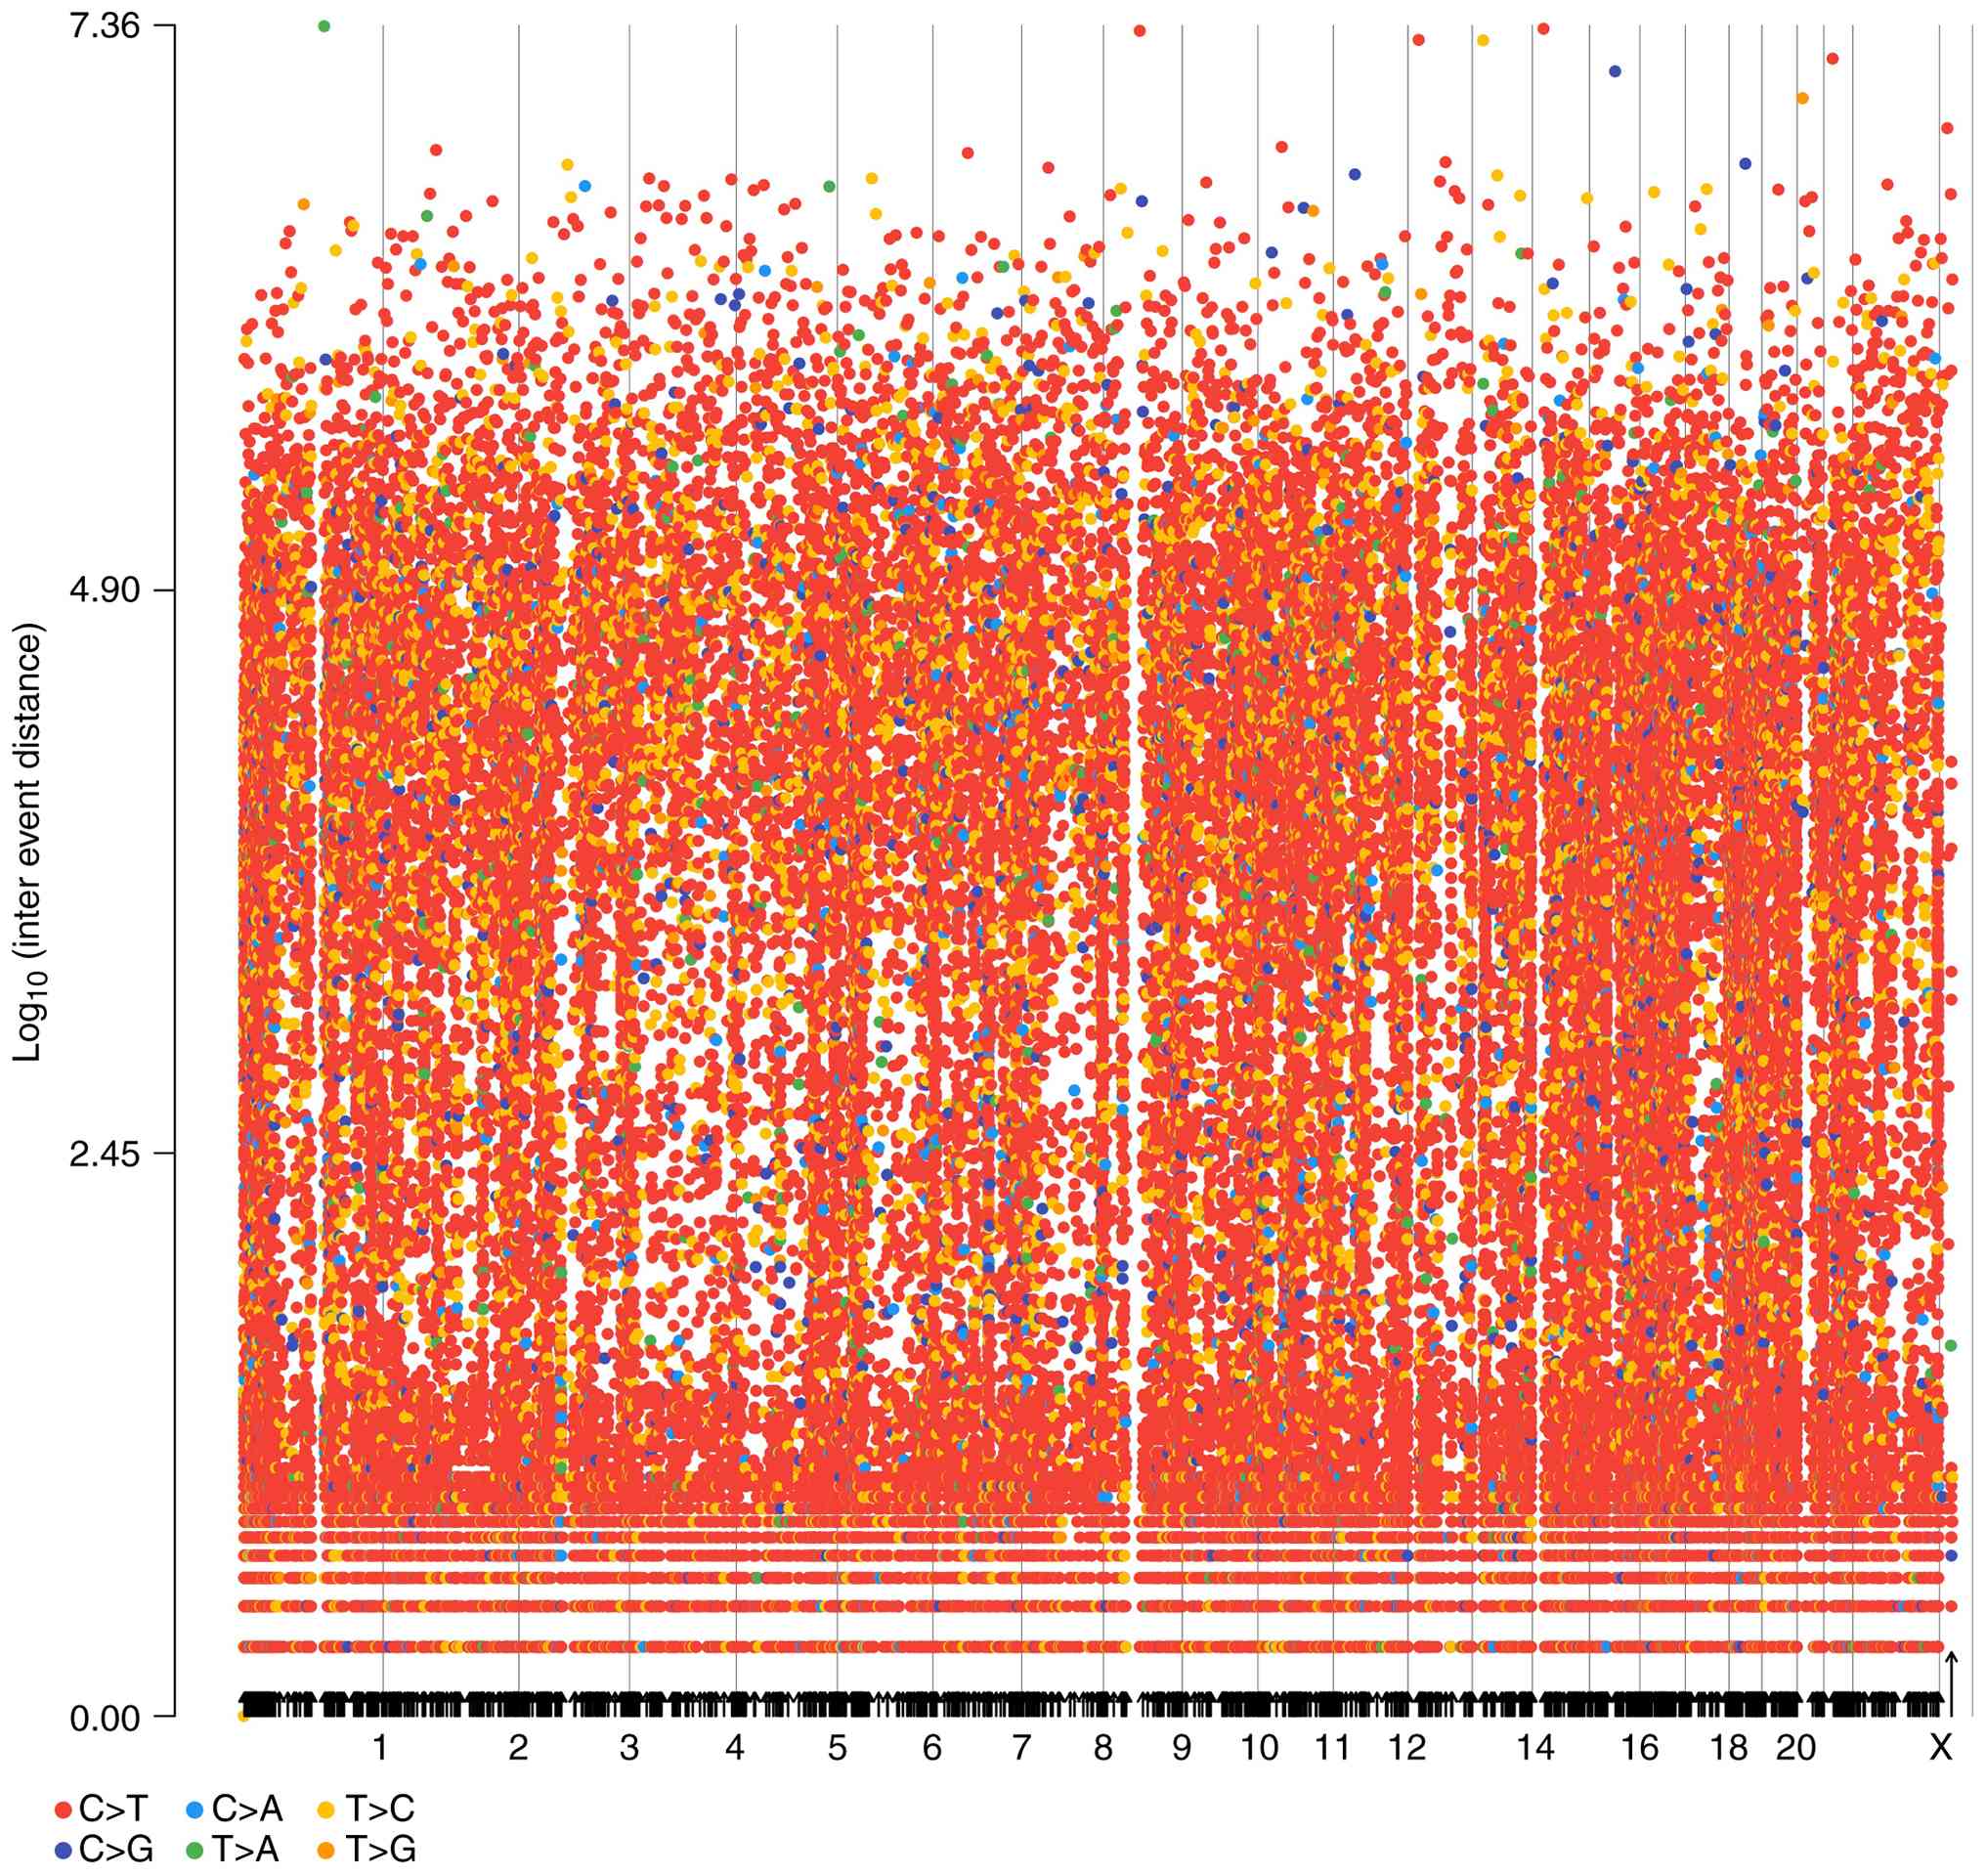
Kataegis-rainfall analysis
Clusters of mutations were identified by examining
entire cancer genome mutation catalogs. Kataegis foci,
characterized by localized substitution hypermutation, are defined
by clusters of C>T and/or C>G mutations significantly
enriched at TpCpN trinucleotides and on the same DNA strand.
Kataegis foci range from a few to thousands of mutations and are
generally located near chromosomal rearrangements. Different tumor
types influence various genomic regions. Starting from the
reference sequence, the six base substitutions were analyzed in
classes and the average intermutation distance was determined. The
rainfall plots for the tumor tissues are depicted in Fig. 9.
Analysis of predisposing genes
Predisposing genes can confer susceptibility to
disease or increase vulnerability when exposed to specific
environmental stimuli. SAMtools was used to identify germline
mutations (SNVs and INDELs) and the results were filtered against
the CGC database to identify potential cancer-predisposing genes.
The mutation annotation sites were screened after retaining the
scoring factors for harmfulness and uncertainty of significance,
and applying the filtering conditions for susceptible genes. A
total of 350 genes were identified with SIFT scores between 0–0.05.
Additionally, the SIFT score was set to 0 and the PolyPhen2_HVAR
score to 1, and the genes that deviated the most from the relative
score were used to identify genes most confidently predicted as
deleterious, yielding eight genes (DST, OR10H3, PTK2B, APOBR,
ZNF606, CCN4, ADCK1 and MYH2). Genes with scores that were
predicted to be deleterious were primarily screened based on
mutation classifications predicted by SIFT (score ≤0.05) and
PolyPhen2_HVAR (score ≥0.909) (Fig.
10A). The majority of functionally enriched pathways for
predisposing genes in PRSCC were involved in ‘developmental
processes' and ‘cellular component organization or ‘biogenesis’
(Fig. 10B). According to the KEGG
pathway analysis, PRSCC primarily indicated enrichment in ‘membrane
transport’, ‘signal transduction’ and ‘cellular community’
(Fig. 10C). Enrichment analysis
using KOG pathway analysis indicated enrichment of ‘signal
transduction mechanisms’, ‘transcription’ and ‘general function
prediction only’ (Fig. 10D).
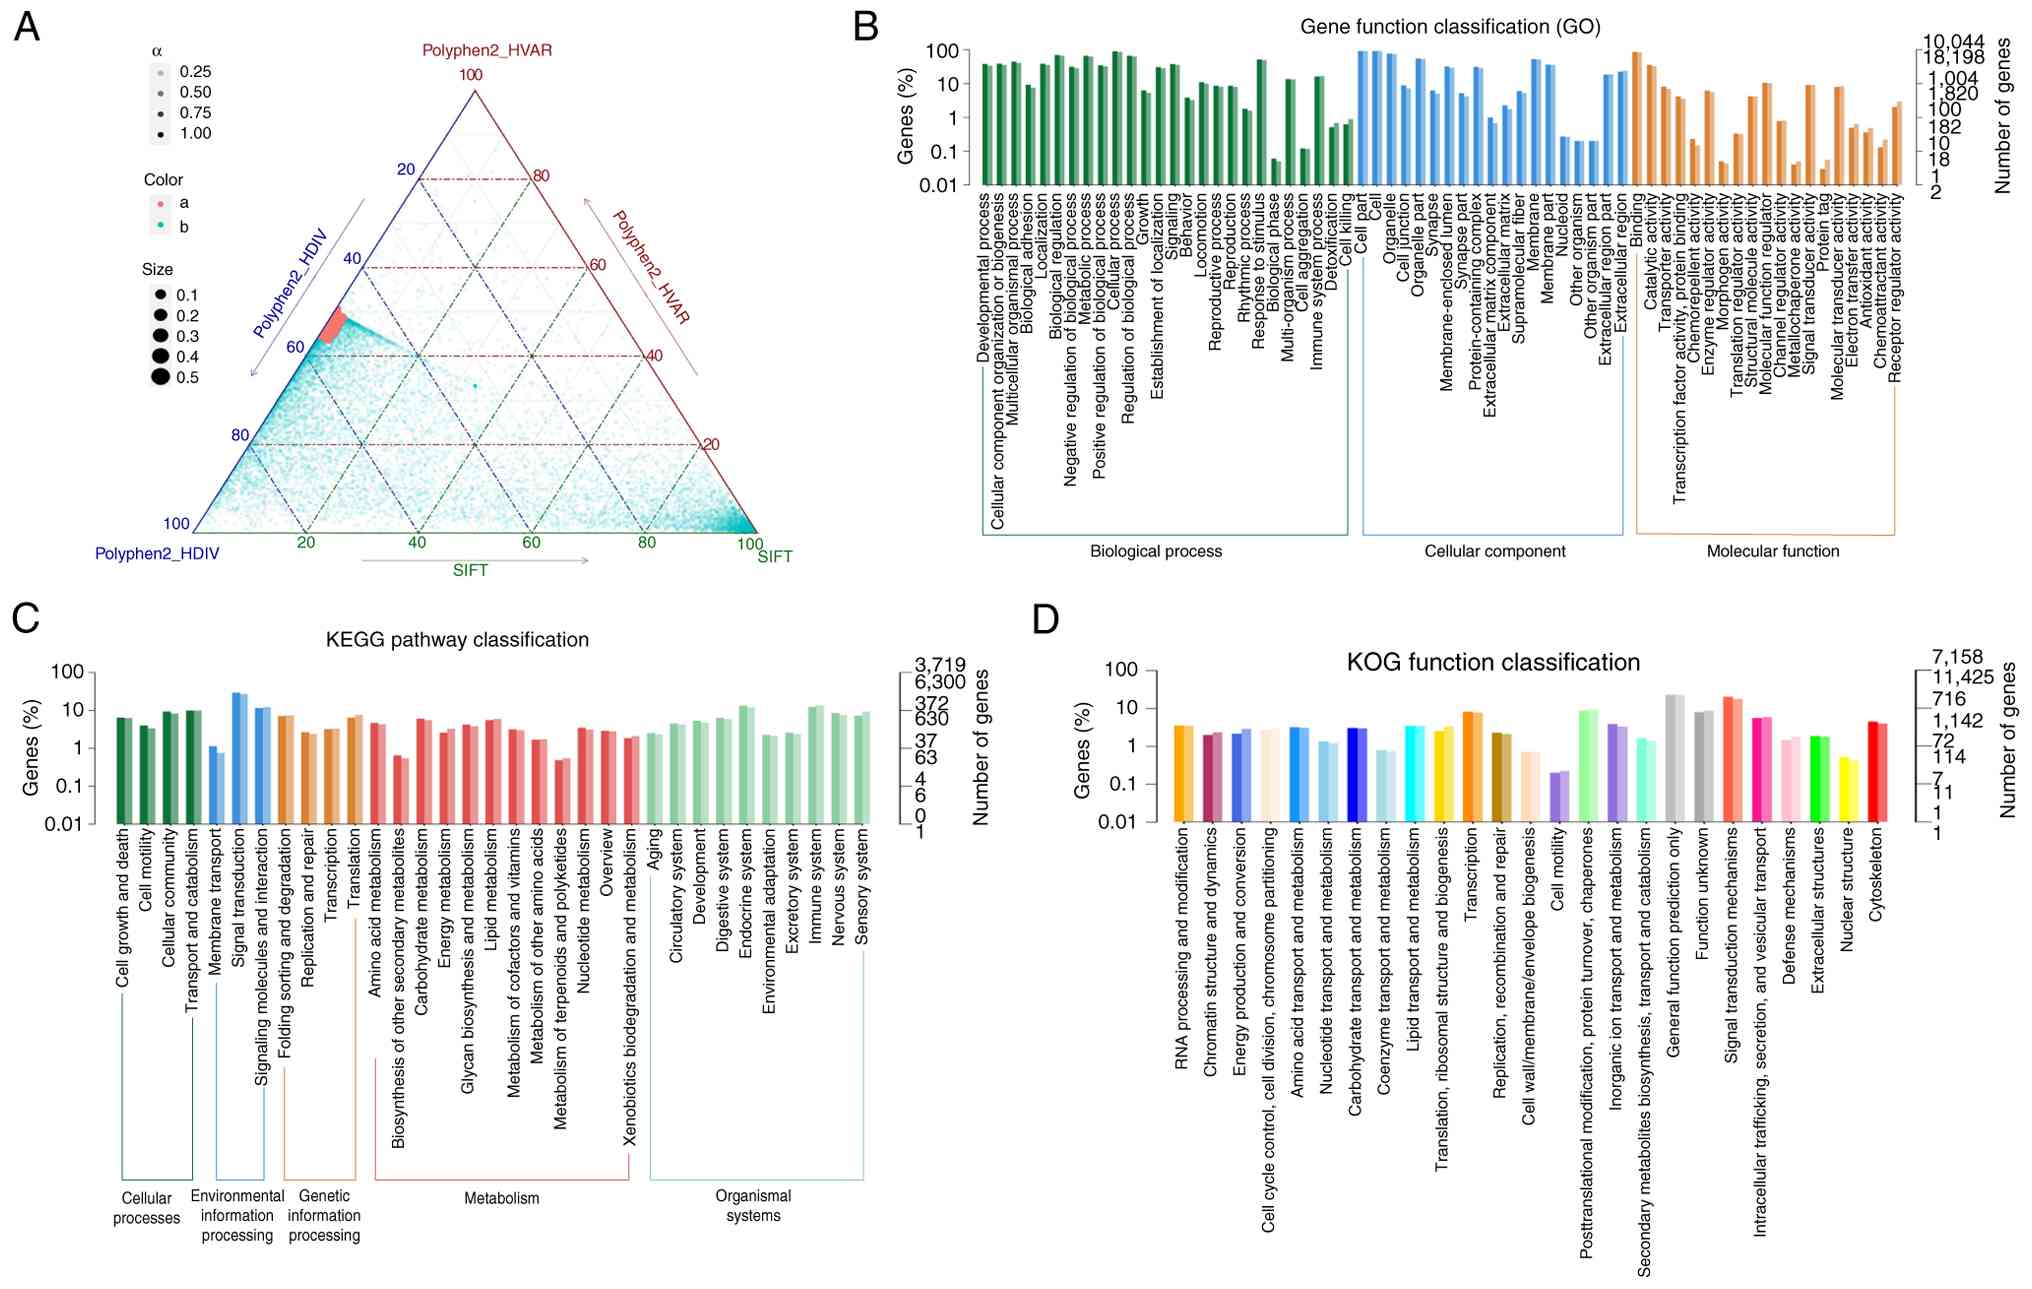 | Figure 10.SNP conservation analysis and
functional annotation of predisposing genes. (A) Ternary phase
diagram of SNP conservation analysis. The axes represent predicted
scores from PolyPhen2_HDIV, PolyPhen2_HVAR and SIFT. Gray dots
denote benign sites, while red dots indicate sites predicted as
deleterious by all three methods. Candidate genes were primarily
screened based on SIFT (score ≤0.05) and PolyPhen2_HVAR (score
≥0.909) classifications. (B) Functional classification of
predisposing genes annotated in the GO database. (C) Significantly
enriched functions are annotated in the KEGG database. (D)
Functional classification annotated in the KOG database. SNP,
single nucleotide polymorphism; GO, Gene Ontology; KEGG, Kyoto
Encyclopedia of Genes and Genomes; KOG, Eukaryotic Orthologous
Groups; HDIV, Human Diversity; HVAR, Human Variation; PolyPhen2,
Polymorphism Phenotyping v2; SIFT, Sorting Intolerant From
Tolerant. |
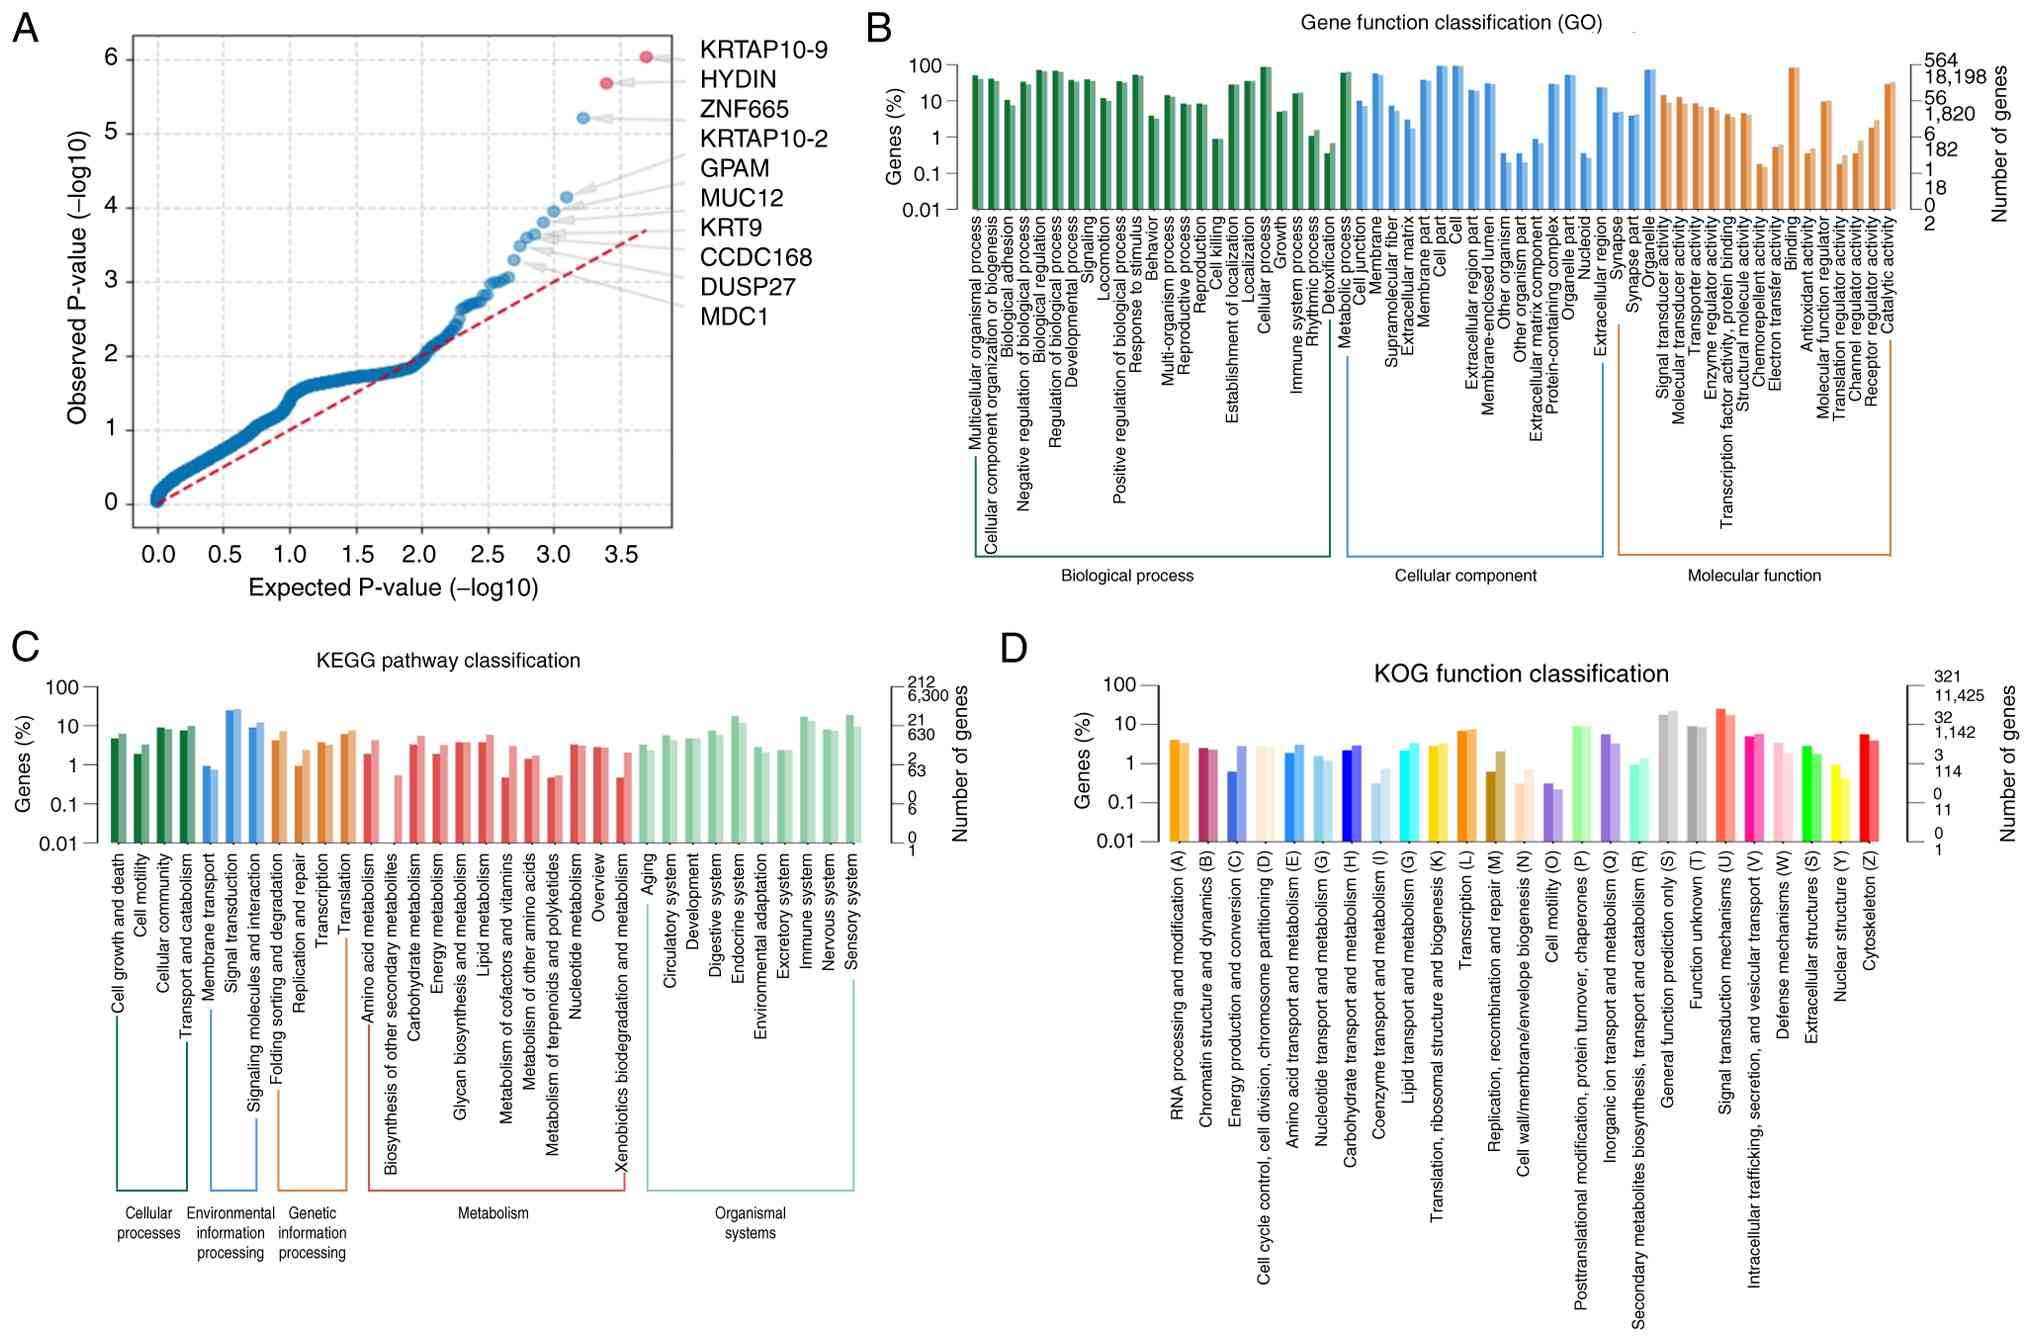
Analysis of driver genes
Previously established driver genes that exhibited
somatic variances in the tumor sample were filtered. Subsequently,
potential driver genes were identified using SNP and INDEL
information from the previous analysis of all samples. Mutations in
10 driver genes, KRTAP10-9, HYDIN, ZNF665, KRTAP10-2, GPAM, MUC12,
KRT9, CCDC168, DUSP27 and MDC1, were identified (Table SVI; Fig. 11A). The present study indicated
that the majority of functionally enriched pathways for driver
genes in PRSCC were ‘multicellular organismal process’ and
‘cellular component organization or ‘biogenesis’ (Fig. 11B). Based on KEGG pathway analysis,
PRSCC primarily indicated enrichment in ‘signal transduction’
(Fig. 11C). Enrichment analysis
using KOG demonstrated ‘signal transduction mechanisms’ as the
primarily enriched pathways (Fig.
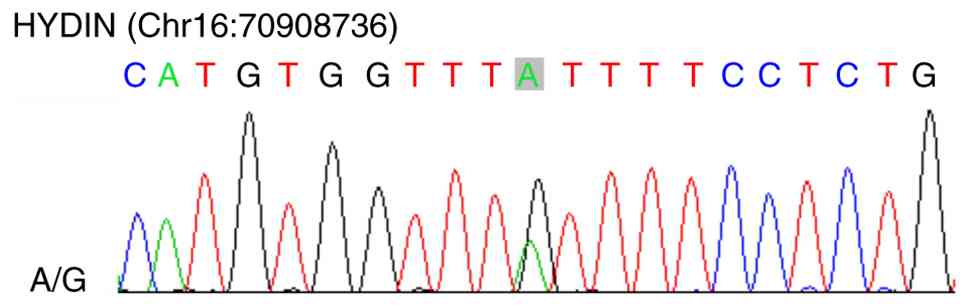
11D). Secondary verification was performed using Sanger
sequencing to identify the mutant base. Sanger sequencing of
germline DNA identified a HYDIN A/G variant (Chr16:70908736), the
first such report of this mutation in PRSCC, to the best of our
knowledge (Fig. 12).
Population-based study
Clinicopathological characteristics
The present study identified 60 patients with PRSCC
from previously published literature between 1987 and 2023. The
most common clinical manifestations were flank pain and hematuria.
Patient ages ranged from 21–84 years, with a median age of 62 years
and a mean of 57.92±15.75. There were 32 patients (53.3%) with
primary lesions in the parenchyma and 15 (25.0%) with primary
lesions in the renal pelvis. There were 19 cases (31.7%) with
tumors on the left side and 18 cases (30.0%) on the right side. The
patient demographics included 34 females (56.7%) and 26 males
(43.3%). There were 13 patients (21.7%) in the T1/T2 stage and 41
patients (68.3%) in the T3/T4 stage. There were 29 patients (48.3%)
in the lymph node (N) 0 stage and 31 patients (51.7%) in the N1
stage. A total of 29 patients (48.3%) were at the metastasis (M) 0
stage, whereas 31 patients (51.7%) were at the M1 stage. There were
18 patients (30%) with tumors <7 cm numbered and 24 patients
(40.0%) with tumors >7 cm. A total of 85% (n=51) of the patients
received surgical treatment, and 48.3% (n=29) received
chemotherapy. In addition, during the follow-up period, there were
43 cases of all-cause mortalities reported. The detailed
clinicopathological characteristics are presented in Table SVII.
Independent prognostic factors
affecting OS
According to the univariate analyses (Table SVIII), tumor size, T and M stages
were all significantly associated with a worse OS (all P<0.05).
Furthermore, Kaplan-Meier curves revealed that the patients with
T3/T4 tumors had a worse OS compared with those patients with T1/T2
tumors (P<0.0001; Fig. S3).
Multivariate analysis using a Cox proportional-hazards model was
used to identify independent prognostic factors for PRSCC.
Variables with a P-value <0.05 from the univariate analysis were
included in the multivariate analysis. The multivariate analysis of
OS demonstrated that patients with T3/T4-stage tumors had worse
survival outcomes compared with those patients with T1/T2 tumors
(HR=6.266; 95% CI, 1.779–22.080; P=0.004). The multivariate results
demonstrated that T stage was an independent prognostic factor for
OS (Table SVIII).
Discussion
PRSCC is a poorly differentiated neuroendocrine
carcinoma, which commonly demonstrates a poor prognosis. Given its
highly aggressive biological phenotype and poor clinical outcomes,
further mechanistic investigations are needed to optimize
prognostic stratification and develop effective therapeutic
strategies for PRSCC. Owing to the rarity of this malignancy,
existing research remains largely limited to retrospective case
series and individual case reports, with a lack of robust data
characterizing its genetic and molecular underpinnings (10–13,15).
To the best of our knowledge, only one cytogenetic study (16) has been conducted to date to explore
the genomic landscape of PRSCC, leaving its key oncogenic drivers
and pathogenic mechanisms largely uncharacterized. La Rosa et
al (16) reported p53 loss and
Myc amplification in a patient with PRSCC using FISH. However, the
study failed to identify the driver genes. Driver genes are genes
that are key in the occurrence and development of diseases. Once
driver genes are identified, personalized and precise medical
treatment may be provided to patients in a targeted manner. NGS
delivers notable evidence in detecting genomic changes in cancer
(20). WES is cost-effective and
delivers extensive genomic coverage (26). To the best of our knowledge, the
present study is the first to explore the driver genes of PRSCC
using WES. Additionally, the clinicopathological characteristics of
PRSCC and the independent prognostic factors affecting OS were
investigated. A novel HYDIN mutation was identified, which served
as a driver-activating mutation in patients with PRSCC. Sanger
sequencing confirmed an HYDIN A/G variant, the first of this type
reported in this gene in PRSCC. Due to the extreme rarity of PRSCC,
the WES analysis in the present study was based solely on
individual cases. The molecular features identified, particularly
the HYDIN driver mutations, require verification in larger-scale
cohorts. Furthermore, the present study observed that T stage was
an independent prognostic factor for OS in patients with PRSCC.
A total of 10 genetic variants were classified as
highly mutated in PRSCC (TTN, ZNF717, MUC3A, MUC16, MUC6, OBSCN,
CDC27, MUC4, HYDIN and ANKRD36C) based on the frequency of
mutations detected in the analysis. The molecular genesis of small
cell neuroendocrine carcinoma is of notable interest when examining
specific molecular signatures across various organs. George et
al (27) performed whole-genome
sequencing and targeted enrichment sequencing in 152 patients with
small cell lung cancer and reported that loss of the tumor
suppressors TP53 and retinoblastoma 1 (RB1) was essential for
tumorigenesis. The authors also identified a somatic genomic
rearrangement in TP73, resulting in the production of the oncogenic
variant, TP73Dex2/3 (27). Chang
et al (28) conducted a
comprehensive analysis of 61 patients with small cell carcinomas of
the bladder and reported that mutations in the TP53, RB1 and
telomerase reverse transcriptase promoters were present in nearly
all samples. The study concluded that apart from the mutations in
the RB1 and TP53 genes, the genomic changes present in small cell
carcinoma of the bladder are closer to those in urothelial
carcinoma compared with small cell lung cancer, indicating that the
majority of the changes promote tumorigenesis in an organ-specific
manner rather than a cell type-specific manner (28).
WES was performed on a small cell prostate carcinoma
case, revealing a loss of heterozygosity in the regions of tumor
suppressors TP53, RB1 and chromodomain helicase DNA-binding protein
1 (29). The recently reported
high-confidence cancer driver genes, forkhead box A1 and cell
division cycle apoptosis regulator 1, were also identified in small
cell prostate carcinoma (29).
Furthermore, Kadakia et al (30) reported that SMAD4 drove the
aggressive progression and supported the derivation of small cell
carcinoma/neuroendocrine prostate cancer from primary prostate
adenocarcinoma (transdifferentiation). Similarly, Lu et al
(9) performed WES on a patient who
progressed from metastatic prostate cancer to small cell carcinoma
and identified mutations in the TP53, RB1 and neurofibromatosis
type 2 genes. In addition, they revealed that mutations in CDC27
and runt-related transcription factor 1 may serve key roles in
tumor progression and neuroendocrine differentiation (9).
In the present study, using SIFT and Polyphen2
scores, genes with mild or benign anticipated functional effects
were filtered out, leaving the 10 potentially significant genes
with carcinogenic potential (KRTAP10-9, HYDIN, ZNF665, KRTAP10-2,
GPAM, MUC12, KRT9, CCDC168, DUSP27 and MDC1). Analysis of the
signaling pathway identified that ‘RTK-Ras’, ‘NOTCH’ and ‘Wnt’ were
common in PRSCC and have been previously identified in association
with small cell lung cancer (27).
The driver genes identified in the present study
were verified using Sanger sequencing, which revealed a novel HYDIN
mutation in PRSCC. HYDIN (axonemal central pair apparatus protein)
encodes a protein involved in the movement of cilia, and mutations
in HYDIN have been implicated in autosomal recessive primary
ciliary dyskinesia (31). At
present, HYDIN is regarded as an immune-related gene, based on its
immunogenicity as a cancer-associated antigen and its regulatory
activity in the immune microenvironment. Laske et al
(32) first reported the
association with cancer and the immunogenicity of two HYDIN
variants (KIAA1864 and MO-TES391). IgG antibodies target both
variants in a notable proportion of patients with cancer; however,
these antibody responses were uncommon among healthy individuals.
Furthermore, the study identified human leukocyte antigen
(HLA)-A*0201-restricted sequences from KIAA1864 and MO-TES391 that
cytotoxic T lymphocytes could specifically recognize. The study
concluded that patients with cancer exhibited frequent, coordinated
adaptive immune responses against HYDIN variants and proposed that
HYDIN is a novel cancer-associated antigen. This suggested that
normal HYDIN expression may inhibit tumor progression by activating
antitumor immunity, whereas HYDIN mutations in PRSCC may disrupt
this balance. It has been reported that HYDIN may regulate the
immune microenvironment, thereby influencing immune cell
infiltration and function. Wang et al (33) identified that upregulated HYDIN
expression in non-small cell lung cancer was associated with
increased infiltration of regulatory T cells (Tregs), and Tregs
inhibited the function of CD8+ T cells by secreting
factors such as IL-10 and TGF-β, thereby suppressing the antitumor
immune response.
Furthermore, HYDIN mutations have also been detected
in other types of cancer. Han et al (34) performed WES on 62 patients with
muscle-invasive bladder cancer and revealed that HYDIN (21/61; 34%)
ranked third among the top 10 most frequently mutated genes. Liu
et al (35) performed WES
and targeted sequencing on 284 patients with hereditary diffuse
gastric cancer and reported that HYDIN had a relatively high
mutation rate among somatic mutation genes. Santourlidis et
al (36) identified a total of
220 genetic regions with hypomethylation in prostate cancer and
reported that dozens of genes, including HYDIN, had hypomethylation
in the CpG islands or their surrounding regions (‘shore’) at their
5′-region in prostate cancer. HYDIN mutations were also identified
in breast cancer cases (37–39).
Yim et al (37) reported
that HYDIN was the most commonly mutated gene in both types
(paucicellular and hypercellular) of pure mucinous breast
carcinoma. Zhang et al (39) used
WES to study 11 patients with breast cancer and identified somatic
mutations in the HYDIN gene in several tumor samples. Additionally,
it has been proposed that mutations in the HYDIN gene may be
associated with the tumorigenesis of neuroendocrine tumors, which
strongly supports the results of the present study (40). HYDIN mutations have also been
detected in several other diseases, including lung (33), colorectal (41,42),
liver (43,44) and oral cancers (45), and proliferative verrucous
leukoplakia (46), as well as in
patients with liver metastases from colorectal cancer (42).
Lastly, the potential mechanisms by which HYDIN
mutations are associated with poor prognosis in PRSCC were
examined. The HYDIN mutations may increase PRSCC invasiveness
through dual effects: Abnormal immune regulation and activation of
oncogenic pathways. HYDIN mutations may lead to structural changes
in the antigenic peptides encoded by HYDIN, preventing their
effective presentation by HLA molecules. For example, according to
the findings from Laske et al (32), a KIAA1864 peptide segment
presentation defect prevented CD8+ T cells from
recognizing tumor cells, thereby promoting immune escape.
Furthermore, HYDIN mutations may downregulate antigen-processing
genes (for example, transporter associated with antigen processing
1/2), further hindering antigen presentation, enabling tumor
evasion of immune surveillance and promoting tumor progression. Li
et al (47) observed that
TGF-β receptor signaling was upregulated in patients with HYDIN
mutations. TGF-β is a well-characterized immunosuppressive factor
that promotes Treg differentiation and M2-type macrophage
polarization, thereby exacerbating the immunosuppressive
microenvironment. Furthermore, HYDIN mutations may activate the
Janus kinase (JAK)-STAT pathway, leading to increased secretion of
cytokines, including IL-6, thereby promoting tumor cell
proliferation and inhibiting T-cell function (47). The co-expression analysis in the
present study, combined with prior literature, suggests that HYDIN
mutations may induce programmed cell death-ligand 1 (PD-L1)
expression, possibly by activating the NF-κB pathway, thereby
promoting T-cell exhaustion and impairing effective control of
tumor growth. In addition, the physiological function of HYDIN is
to participate in the assembly of the central microtubules of
cilia. Mutations in HYDIN may lead to abnormal ciliary structure
and thereby activate certain carcinogenic pathways. Cilia are the
primary sites of Hedgehog signal transduction. Structural
abnormalities may lead to sustained activation of the Hedgehog
pathway and promote tumor cell proliferation. Ciliary functional
defects can disrupt the negative regulation of Wnt signaling,
leading to the nuclear accumulation of β-catenin, driving
epithelial-mesenchymal transition and enhancing tumor invasiveness.
Furthermore, Li et al (47)
reported that HYDIN mutations are associated with activation of DNA
repair pathways; however, abnormal repair efficiency may lead to
genomic instability, accumulation of additional driver mutations
and acceleration of tumor progression. In summary, existing data
support that HYDIN mutations affect the progression of PRSCC
through dual mechanisms of immune regulation and oncogenic
pathways. Mutations in the immune-related gene HYDIN not only
disrupt immune surveillance but also activate carcinogenic signals
through abnormal ciliary function, jointly leading to a poor
prognosis. However, these mechanisms are proposed models based on
literature from other types of cancer and bioinformatic predictions
and have not been functionally validated in the present study or in
PRSCC models.
Due to the dual role of HYDIN mutations in
disrupting antitumor immunity and activating oncogenic pathways
(such as Hedgehog, WNT and JAK-STAT), targeting this gene or its
downstream signaling cascades may warrant exploration as a
theoretical direction for the management of PRSCC in future
research. First, identification of HYDIN as a cancer-associated
antigen provides a rationale for immunotherapeutic interventions
(32). For example, peptide
vaccines derived from the mutant HYDIN A/G sequence
(Chr16:70908736) could be explored to elicit specific
CD8+ T-cell responses, as demonstrated in preclinical
studies targeting HYDIN variants in other types of cancer (32,34,37,47).
Notably, melanoma (47),
muscle-invasive bladder cancer (34), and pure mucinous breast carcinoma
(37) have provided direct evidence
of HYDIN immunogenic potential and feasibility as a vaccine target.
Additionally, immune checkpoint inhibitors (ICIs) may be repurposed
for PRSCC; HYDIN mutations are associated with upregulated PD-L1
expression via NF-κB activation (47), and clinical trials of
anti-programmed cell death protein-1/PD-L1 agents in HYDIN-mutant
tumors, such as melanoma (47) and
bladder cancer (34), have
demonstrated promising responses, suggesting potential efficacy in
PRSCC. Second, targeted inhibition of HYDIN-driven oncogenic
pathways might serve as a complementary theoretical approach to
immunotherapy. Small-molecule inhibitors of the Hedgehog pathway or
JAK-STAT signaling have been approved for other malignancies, such
as basal cell carcinoma (48) and
cutaneous T-cell lymphoma (49) and
may mitigate PRSCC cell proliferation and invasion induced by HYDIN
mutations. Furthermore, since HYDIN mutations disrupt ciliary
structure and function (31),
agents targeting ciliary-related signaling could be hypothetically
investigated in reversing the epithelial-mesenchymal transition and
reducing metastatic potential. Third, HYDIN mutations may serve as
a potential candidate biomarker to stratify patients for
personalized therapy. As observed in melanoma (47), the HYDIN mutation status associates
with ICI efficacy. Patients with PRSCC harboring this mutation
could be prioritized for immunotherapy, while those patients
without the HYDIN mutation may benefit from conventional
chemotherapy or pathway-specific inhibitors. Notably, these
strategies require validation in PRSCC-specific preclinical models
(such as HYDIN-mutant cell lines or patient-derived xenografts) to
confirm target engagement and safety. Future clinical trials should
also explore combinatorial approaches (such as peptide vaccines,
ICIs and pathway inhibitors) to overcome immune escape and enhance
treatment durability. The aforementioned mechanisms and therapeutic
hypotheses lack direct experimental evidence from PRSCC and should
be verified through in vitro experiments (such as antigen
presentation efficiency and pathway activation detection of mutant
cell lines) and in vivo models (such as immune infiltration
and growth curve analysis of xenograft tumors) in the future to
support their potential use as prognostic markers or immunotherapy
targets.
The present study has several limitations that need
to be addressed to strengthen the validity and generalizability of
the findings. First, due to the extreme rarity of PRSCC, the
present WES analysis relied exclusively on a single tumor sample.
Single-case WES is the main limitation of the present study. This
single-case design may have restricted the ability to confirm
whether the identified genetic alterations (including the HYDIN
driver mutation) are recurrent features of PRSCC or specific to the
individual patient. Without validation in a larger cohort, the
clinical relevance and pathogenic role of these variants
(particularly HYDIN) remain speculative. To mitigate this key
constraint, future research should prioritize expanding the sample
size through coordinated efforts. The present study proposes two
targeted strategies: i) Establish a national multi-center
collaborative network to standardize PRSCC case registration,
tissue preservation and data sharing. This network should aim to
collect at least 30–50 qualified samples within 3 years to
systematically validate the recurrence of HYDIN and other candidate
driver mutations across diverse PRSCC populations; and ii)
integrate genomic data from public databases (for example, COSMIC
and TCGA databases) and previously published PRSCC case reports to
conduct a pooled meta-analysis of genomic profiles. This approach
can complement the small sample size limitation by aggregating
scattered data, thereby enhancing statistical power to identify
consistent genetic drivers and molecular signatures of PRSCC.
Second, although potential driver mutations were identified via
WES, the detailed functional mechanisms of these variants (for
example, how HYDIN mutations disrupt immune regulation or activate
oncogenic pathways in PRSCC) and the role of passenger mutations
warrant further investigation. Primary cell cultures from PRSCC
tissues or patient-derived xenograft models would be valuable tools
to experimentally validate the functional impact of genetic
alterations.
In conclusion, PRSCC is a clinically rare, poorly
differentiated neuroendocrine carcinoma. Positive markers such as
CD56, Syn, INSM1, CgA and NSE help confirm the diagnosis of PRSCC.
A total of eight predisposing genes were identified using WES,
including DST, OR10H3, PTK2B, APOBR, ZNF606, CCN4, ADCK1 and MYH2.
Subsequently, several driver genes including KRTAP10-9, HYDIN,
ZNF665, KRTAP10-2, GPAM, MUC12, KRT9, CCDC168, DUSP27 and MDC1 were
identified. Driver gene mutations were verified using Sanger
sequencing, which identified, for the first time, a HYDIN A/G
variant in PRSCC that may have contributed to PRSCC pathogenesis.
Furthermore, T stage was an independent prognostic factor for OS in
patients with PRSCC. HYDIN may potentially serve as a prognostic
marker and a target for immunotherapy in PRSCC. However, the
functional role of HYDIN mutations in PRSCC pathogenesis remains to
be validated. Further cell and animal experiments in the future are
required to verify the results of the present study.
Supplementary Material
Supporting Data
Supporting Data
Acknowledgements
The authors would like to thank Ms Ruijuan Liu
(Henan University Minsheng College, Kaifeng, China) for reviewing
and examining this manuscript.
Funding
Funding: No funding was received.
Availability of data and materials
The data generated in the present study may be found
in the Sequence Read Archive under accession number SRR34849655 or
at the following URL: https://www.ncbi.nlm.nih.gov/sra/SRR34849655.
Authors' contributions
XL and XX conceived the present study. YW and LZ
designed the present study. YW and XL analyzed the data. XX and XL
collected the data. YW and LZ wrote the manuscript. XL and XX
reviewed the manuscript. XL, XX, YW and LZ confirm the authenticity
of the raw data. All authors read and approved the final version of
the manuscript.
Ethics approval and consent to
participate
The present study was approved by the Ethics
Committee of the Second Affiliated Hospital of Dalian Medical
University (approval no. KY2025-472-01; Dalian, China) and adhered
to the principles of the Declaration of Helsinki for research
involving human subjects. Written informed consent was obtained
from the patient for participation and for the use of their
samples.
Patient consent for publication
Written informed consent from the patient for the
publication of the obtained data.
Competing interests
The authors declare that they have no competing
interests.
References
|
1
|
Bray F, Laversanne M, Sung H, Ferlay J,
Siegel RL, Soerjomataram I and Jemal A: Global cancer statistics
2022: GLOBOCAN estimates of incidence and mortality worldwide for
36 cancers in 185 countries. CA Cancer J Clin. 74:229–263.
2024.PubMed/NCBI
|
|
2
|
Novara G, Ficarra V, Antonelli A, Artibani
W, Bertini R, Carini M, Cosciani Cunico S, Imbimbo C, Longo N,
Martignoni G, et al: Validation of the 2009 TNM version in a large
multi-institutional cohort of patients treated for renal cell
carcinoma: Are further improvements needed? Eur Urol. 58:588–595.
2010. View Article : Google Scholar : PubMed/NCBI
|
|
3
|
Rindi G, Mete O, Uccella S, Basturk O, La
Rosa S, Brosens LAA, Ezzat S, de Herder WW, Klimstra DS, Papotti M
and Asa SL: Overview of the 2022 WHO classification of
neuroendocrine neoplasms. Endocr Pathol. 33:115–154. 2022.
View Article : Google Scholar : PubMed/NCBI
|
|
4
|
Monaghan TF, Michelson KP, Suss NR,
Agudelo CW, Rahman SN, Robins DJ, Flores VX, McNeil BK, Weiss JP
and Winer AG: Primary small cell carcinoma of the kidney: Disease
characteristics and treatment outcomes. Medicines (Basel).
8:62021.PubMed/NCBI
|
|
5
|
Majhail NS, Elson P and Bukowski RM:
Therapy and outcome of small cell carcinoma of the kidney: Report
of two cases and a systematic review of the literature. Cancer.
97:1436–1441. 2003. View Article : Google Scholar : PubMed/NCBI
|
|
6
|
Wang Y, Yang H, Zhu Y, Luo W, Long Q, Fu Y
and Chen X: Establishment and validation of a nomogram to predict
overall survival for patients with primary renal neuroendocrine
tumor. Sci Rep. 15:138612025. View Article : Google Scholar : PubMed/NCBI
|
|
7
|
Moch H, Cubilla AL, Humphrey PA, Reuter VE
and Ulbright TM: The 2016 WHO classification of tumours of the
urinary system and male genital organs-part A: Renal, penile, and
testicular tumours. Eur Urol. 70:93–105. 2016. View Article : Google Scholar : PubMed/NCBI
|
|
8
|
Lee SY, Hsu HH, Lin HY, Chen YC, Wong YC,
Wang LJ, Ng KF, Chuang CK, Hung CC and Yang CW: Factors associated
with the survival of patients with primary small cell carcinoma of
the kidney. Int J Clin Oncol. 18:139–147. 2013. View Article : Google Scholar : PubMed/NCBI
|
|
9
|
Lu X, Gao W, Zhang Y, Wang T, Gao H, Chen
Q, Shi X, Lian B, Zhang W, Gao X and Li G: Case report: Systemic
treatment and serial genomic sequencing of metastatic prostate
adenocarcinoma progressing to small cell carcinoma. Front Oncol.
11:7320712021. View Article : Google Scholar : PubMed/NCBI
|
|
10
|
Chuang CK and Liao SK: A retrospective
immunohistochemical and clinicopathological study of small cell
carcinomas of the urinary tract. Chang Gung Med J. 26:26–33.
2003.PubMed/NCBI
|
|
11
|
Christopher ME, Seftel AD, Sorenson K and
Resnick MI: Small cell carcinoma of the genitourinary tract: An
immunohistochemical, electron microscopic and clinicopathological
study. J Urol. 146:382–386. 1991. View Article : Google Scholar : PubMed/NCBI
|
|
12
|
Chung CH and Park CY: Small cell carcinoma
of the kidney. Korean J Intern Med. 21:191–193. 2006. View Article : Google Scholar : PubMed/NCBI
|
|
13
|
Morgan KG, Banerjee SS, Eyden BP and
Barnard RJ: Primary small cell neuroendocrine carcinoma of the
kidney. Ultrastruct Pathol. 20:141–144. 1996. View Article : Google Scholar : PubMed/NCBI
|
|
14
|
Kanehisa M: Toward understanding the
origin and evolution of cellular organisms. Protein Sci.
28:1947–1951. 2019. View Article : Google Scholar : PubMed/NCBI
|
|
15
|
Xie K, Li XY, Liao BJ, Wu SC and Chen WM:
Primary renal small cell carcinoma: A case report. World J Clin
Cases. 10:5884–5892. 2022. View Article : Google Scholar : PubMed/NCBI
|
|
16
|
La Rosa S, Bernasconi B, Micello D, Finzi
G and Capella C: Primary small cell neuroendocrine carcinoma of the
kidney: Morphological, immunohistochemical, ultrastructural, and
cytogenetic study of a case and review of the literature. Endocr
Pathol. 20:24–34. 2009. View Article : Google Scholar : PubMed/NCBI
|
|
17
|
Cancer Genome Atlas Research Network, .
Comprehensive molecular characterization of clear cell renal cell
carcinoma. Nature. 499:43–49. 2013. View Article : Google Scholar : PubMed/NCBI
|
|
18
|
Kuroda N, Alvarado-Cabrero I, Sima R, Hes
O, Michal M, Kinoshita H, Matsuda T, Ohe C, Sakaida N, Uemura Y and
Lee GH: Renal carcinoid tumor: An immunohistochemical and molecular
genetic study of four cases. Oncol Lett. 1:87–90. 2010. View Article : Google Scholar : PubMed/NCBI
|
|
19
|
Pivovarcikova K, Agaimy A, Martinek P,
Alaghehbandan R, Perez-Montiel D, Alvarado-Cabrero I, Rogala J,
Kuroda N, Rychly B, Gasparov S, et al: Primary renal
well-differentiated neuroendocrine tumour (carcinoid):
Next-generation sequencing study of 11 cases. Histopathology.
75:104–117. 2019. View Article : Google Scholar : PubMed/NCBI
|
|
20
|
McCombie WR, McPherson JD and Mardis ER:
Next-generation sequencing technologies. Cold Spring Harb Perspect
Med. 9:a367982019. View Article : Google Scholar : PubMed/NCBI
|
|
21
|
Alexandrov LB, Nik-Zainal S, Wedge DC,
Aparicio SAJR, Behjati S, Biankin AV, Bignell GR, Bolli N, Borg A,
Børresen-Dale AL, et al: Signatures of mutational processes in
human cancer. Nature. 500:415–421. 2013. View Article : Google Scholar : PubMed/NCBI
|
|
22
|
Richards S, Aziz N, Bale S, Bick D, Das S,
Gastier-Foster J, Grody WW, Hegde M, Lyon E, Spector E, et al:
Standards and guidelines for the interpretation of sequence
variants: A joint consensus recommendation of the American college
of medical genetics and genomics and the association for molecular
pathology. Genet Med. 17:405–424. 2015. View Article : Google Scholar : PubMed/NCBI
|
|
23
|
Arnedo-Pac C, Mularoni L, Muiños F,
Gonzalez-Perez A and Lopez-Bigas N: OncodriveCLUSTL: A
sequence-based clustering method to identify cancer drivers.
Bioinformatics. 35:4788–4790. 2019. View Article : Google Scholar : PubMed/NCBI
|
|
24
|
Lawrence MS, Stojanov P, Polak P, Kryukov
GV, Cibulskis K, Sivachenko A, Carter SL, Stewart C, Mermel CH,
Roberts SA, et al: Mutational heterogeneity in cancer and the
search for new cancer-associated genes. Nature. 499:214–218. 2013.
View Article : Google Scholar : PubMed/NCBI
|
|
25
|
Moch H, Amin MB, Berney DM, Compérat EM,
Gill AJ, Hartmann A, Menon S, Raspollini MR, Rubin MA, Srigley JR,
et al: The 2022 World Health Organization classification of tumours
of the urinary system and male genital organs-part A: Renal,
penile, and testicular tumours. Eur Urol. 82:458–468. 2022.
View Article : Google Scholar : PubMed/NCBI
|
|
26
|
Schwarze K, Buchanan J, Taylor JC and
Wordsworth S: Are whole-exome and whole-genome sequencing
approaches cost-effective? A systematic review of the literature.
Genet Med. 20:1122–1130. 2018. View Article : Google Scholar : PubMed/NCBI
|
|
27
|
George J, Lim JS, Jang SJ, Cun Y, Ozretić
L, Kong G, Leenders F, Lu X, Fernández-Cuesta L, Bosco G, et al:
Comprehensive genomic profiles of small cell lung cancer. Nature.
524:47–53. 2015. View Article : Google Scholar : PubMed/NCBI
|
|
28
|
Chang MT, Penson A, Desai NB, Socci ND,
Shen R, Seshan VE, Kundra R, Abeshouse A, Viale A, Cha EK, et al:
Small-cell carcinomas of the bladder and lung are characterized by
a convergent but distinct pathogenesis. Clin Cancer Res.
24:1965–1973. 2018. View Article : Google Scholar : PubMed/NCBI
|
|
29
|
Scott AF, Mohr DW, Ling H, Scharpf RB,
Zhang P and Liptak GS: Characterization of the genomic architecture
and mutational spectrum of a small cell prostate carcinoma. Genes
(Basel). 5:366–384. 2014. View Article : Google Scholar : PubMed/NCBI
|
|
30
|
Kadakia KC, Tomlins SA, Sanghvi SK, Cani
AK, Omata K, Hovelson DH, Liu C and Cooney KA: Comprehensive serial
molecular profiling of an ‘N of 1’ exceptional non-responder with
metastatic prostate cancer progressing to small cell carcinoma on
treatment. J Hematol Oncol. 8:1092015. View Article : Google Scholar : PubMed/NCBI
|
|
31
|
Olbrich H, Schmidts M, Werner C,
Onoufriadis A, Loges NT, Raidt J, Banki NF, Shoemark A, Burgoyne T,
Al Turki S, et al: Recessive HYDIN mutations cause primary ciliary
dyskinesia without randomization of left-right body asymmetry. Am J
Hum Genet. 91:672–684. 2012. View Article : Google Scholar : PubMed/NCBI
|
|
32
|
Laske K, Shebzukhov YV, Grosse-Hovest L,
Kuprash DV, Khlgatian SV, Koroleva EP, Sazykin AY, Penkov DN,
Belousov PV, Stevanović S, et al: Alternative variants of human
HYDIN are novel cancer-associated antigens recognized by adaptive
immunity. Cancer Immunol Res. 1:190–200. 2013. View Article : Google Scholar : PubMed/NCBI
|
|
33
|
Wang Q, Zhou D, Wu F, Liang Q, He Q, Peng
M, Yao T, Hu Y, Qian B, Tang J, et al: Immune microenvironment
signatures as biomarkers to predict early recurrence of stage Ia-b
lung cancer. Front Oncol. 11:6802872021. View Article : Google Scholar : PubMed/NCBI
|
|
34
|
Han S, Li Y, Chen D, Si Z, Xu T, Du Y and
Xing N: Comprehensive genetic profile of Chinese muscle-invasive
bladder cancer cohort. Clin Genitourin Cancer. 23:1022802025.
View Article : Google Scholar : PubMed/NCBI
|
|
35
|
Liu ZX, Zhang XL, Zhao Q, Chen Y, Sheng H,
He CY, Sun YT, Lai MY, Wu MQ, Zuo ZX, et al: Whole-exome sequencing
among chinese patients with hereditary diffuse gastric cancer. JAMA
Netw Open. 5:e22458362022. View Article : Google Scholar : PubMed/NCBI
|
|
36
|
Santourlidis S, Araúzo-Bravo MJ, Erichsen
L and Bendhack ML: Epigenetics meets CAR-T-cell therapy to fight
cancer. Cancers (Basel). 16:19412024. View Article : Google Scholar : PubMed/NCBI
|
|
37
|
Yim HE, Kim JH, Ahn MS, Jung Y, Roh J,
Park SH, Kim TG, Choi JH and Kang SY: Clinicopathological and
molecular analysis of 45 cases of pure mucinous breast cancer.
Front Oncol. 10:5587602021. View Article : Google Scholar : PubMed/NCBI
|
|
38
|
Aguilar B, Abdilleh K and Acquaah-Mensah
GK: Multi-omics inference of differential breast cancer-related
transcriptional regulatory network gene hubs between young black
and white patients. Cancer Genet. 270–271. 1–11. 2023.PubMed/NCBI
|
|
39
|
Zhang Y, Cai Q, Shu XO, Gao YT, Li C,
Zheng W and Long J: Whole-exome sequencing identifies novel somatic
mutations in Chinese breast cancer patients. J Mol Genet Med.
9:1832015. View Article : Google Scholar : PubMed/NCBI
|
|
40
|
Lou X, Ye Z, Xu X, Jiang M, Lu R, Jing D,
Zhang W, Gao H, Wang F, Zhang Y, et al: Establishment and
characterization of the third non-functional human pancreatic
neuroendocrine tumor cell line. Hum Cell. 35:1248–1261. 2022.
View Article : Google Scholar : PubMed/NCBI
|
|
41
|
Yang Y, Chen J, Peng H, Xiao Z, Xu W,
Zheng M, Li Z and Cao P: Mutational profile evaluates metastatic
capacity of Chinese colorectal cancer patients, revealed by
whole-exome sequencing. Genomics. 116:1108092024. View Article : Google Scholar : PubMed/NCBI
|
|
42
|
Yi H, Liao ZW, Chen JJ, Shi XY, Chen GL,
Wu GT, Zhou DY, Zhou GQ, Huang JY, Lian L, et al: Genome variation
in colorectal cancer patient with liver metastasis measured by
whole-exome sequencing. J Gastrointest Oncol. 12:507–515. 2021.
View Article : Google Scholar : PubMed/NCBI
|
|
43
|
Akiba J, Ogasawara S and Yano H: Genetic
analyses of primary liver cancer cell lines: Correspondence with
morphological features of original tumors. Cancer Genomics
Proteomics. 21:260–271. 2024. View Article : Google Scholar : PubMed/NCBI
|
|
44
|
Kassem PH, Montasser IF, Mahmoud RM,
Ghorab RA, Abdelhakam DA, Fathi MESA, Wahed MAA, Mohey K, Ibrahim
M, Hadidi ME, et al: Genomic landscape of hepatocellular carcinoma
in Egyptian patients by whole exome sequencing. BMC Med Genomics.
17:2022024. View Article : Google Scholar : PubMed/NCBI
|
|
45
|
Lin L, Chou C, Cheng H, Chang K and Liu C:
Precise identification of recurrent somatic mutations in oral
cancer through whole-exome sequencing using multiple mutation
calling pipelines. Front Oncol. 11:7416262021. View Article : Google Scholar : PubMed/NCBI
|
|
46
|
Farah CS, Shearston K, Melton PE and Fox
SA: Genome-wide characterization of the mutational landscape of
proliferative verrucous leukoplakia. Oral Surg Oral Med Oral Pathol
Oral Radiol. 138:99–111. 2024. View Article : Google Scholar : PubMed/NCBI
|
|
47
|
Li L, Tianrui K, Chunlei L, Zhendong Q,
Xiaoyan C and Wenhong D: HYDIN mutation status as a potential
predictor of immune checkpoint inhibitor efficacy in melanoma.
Aging (Albany NY). 15:7997–8012. 2023. View Article : Google Scholar : PubMed/NCBI
|
|
48
|
Von Hoff DD, LoRusso PM, Rudin CM, Reddy
JC, Yauch RL, Tibes R, Weiss GJ, Borad MJ, Hann CL, Brahmer JR, et
al: Inhibition of the hedgehog pathway in advanced basal-cell
carcinoma. N Engl J Med. 361:1164–1172. 2009. View Article : Google Scholar : PubMed/NCBI
|
|
49
|
Kashyap A, Dai J and Ni X: Therapeutic
targeting of the janus kinase/signal transducer and activator of
transcription pathway in cutaneous T-cell lymphoma. Cancers
(Basel). 17:5682025. View Article : Google Scholar : PubMed/NCBI
|