Introduction
Diffuse large B-cell lymphoma (DLBCL) accounts for
25–30% of cases of adult non-Hodgkin lymphoma and remains a leading
cause of lymphoma-related mortality. Standard first-line
immunochemotherapy with rituximab plus cyclophosphamide,
doxorubicin, vincristine and prednisone (R-CHOP) cures a
substantial proportion of patients; however, 30–40% of patients
relapse or develop refractory disease and face poor outcomes
(1,2). Clinical indices, including the
International Prognostic Index (IPI), remain essential for initial
risk stratification but currently do not fully capture the
biological drivers of treatment failure (3).
Gene expression profiling (GEP) established the
cell-of-origin (COO) concept, and identified activated B-cell-like
(ABC) and germinal center B-cell-like (GCB) DLBCL subgroups with
distinct biological characteristics and outcomes (4,5).
Although immunohistochemistry-based algorithms (such as the Hans
classifier) have enabled broader adoption of COO assignment in
routine clinical practice, COO alone cannot encompass the full
spectrum of transcriptomic heterogeneity (6). Subsequent GEP studies have uncovered
additional programs reflecting host inflammatory response and
stromal remodeling, highlighting the contribution of the lymphoma
microenvironment (LME) to clinical behavior and therapeutic
response (7,8).
Large-scale genomic studies have further refined
DLBCL taxonomy by defining recurrent genetic subtypes (including
BN2, MCD, N1 and EZB) characterized by distinct oncogenic
dependencies and clinical trajectories (9,10).
Probabilistic classification tools now support subtype calls in
individual tumors, facilitating translational studies and
molecularly stratified trials (11). Integrative driver analyses
underscore the breadth of genetic heterogeneity, and reinforce the
need to combine tumor-intrinsic and microenvironmental features for
risk modeling (12). These
molecular insights are increasingly reflected in modern disease
frameworks, including the revised World Health Organization
classification of lymphoid neoplasms (13).
Beyond tumor-intrinsic alterations, the LME shapes
immune surveillance, therapy response and resistance.
Transcriptome-based approaches that model LME states have revealed
reproducible microenvironment-defined DLBCL subtypes with distinct
cellular compositions and outcomes (14). However, a practical cross-platform
framework linking LME states with tumor genetics, immune evasion
programs and clinical risk remains incomplete.
Recently, LymphoMAPs have described three recurring
LME archetypes: Lymph node-like (LN), fibroblast-macrophage-rich
(FMAC) and T cell-exhausted (TEX), capturing orthogonal axes of
immune and stromal remodeling across B-cell lymphomas (15). These archetypes offer an
interpretable lens to assess LME states from bulk transcriptomes
and suggest therapeutic hypotheses; however, their relationship
with established genetic subtypes and their prognostic value in
immunochemotherapy-treated DLBCL remain incompletely defined.
DLBCL can evade immune elimination through diverse
mechanisms, including impaired antigen presentation and loss of
co-stimulatory signals; notably, combined inactivation of
β2-microglobulin and CD58 provides a canonical genetic route to
escape T and natural killer cell-mediated killing (16). The present study hypothesized that
quantifying immune evasion programs in parallel with LymphoMAP
archetype inference may improve biological interpretation and help
identify clinically relevant risk states in DLBCL.
Accordingly, the present study aimed to investigate
the relationships of transcriptome-inferred LymphoMAP archetypes
with DLBCL genetic subtypes and immune evasion-associated
transcriptional programs, to derive an immune evasion-associated
index (IEAI), to assess the prognostic value of these features in
immunochemotherapy-treated patients, to develop and externally
evaluate a cross-platform transcriptomic risk score (RScore-Expr),
and to examine whether this score adds prognostic information
beyond the IPI.
Materials and methods
Study design and cohorts
The present retrospective study integrated publicly
available transcriptomic, genomic and clinical data. The full
DLBCL-2018 cohort (n=562) was obtained from the National Cancer
Institute (NCI) Genomic Data Commons publication page for ‘Genetics
and Pathogenesis of Diffuse Large B-Cell Lymphoma’ (https://gdc.cancer.gov/about-data/publications/DLBCL-2018)
and the corresponding published study (17)’, using the public log2-normalized
RNA-seq expression matrix (RNAseq_gene_expression_562.txt) together
with the matched clinical and molecular annotations provided in
Supplementary Appendix 2 of the published DLBCL-2018 study.
External validation was performed using four independent DLBCL
cohorts from the Gene Expression Omnibus (GEO; http://www.ncbi.nlm.nih.gov/geo/): GSE10846
(8), GSE31312 (18), GSE32918 (19) and GSE87371 (20). The overall study design and
analytical workflow are summarized in Fig. 1.
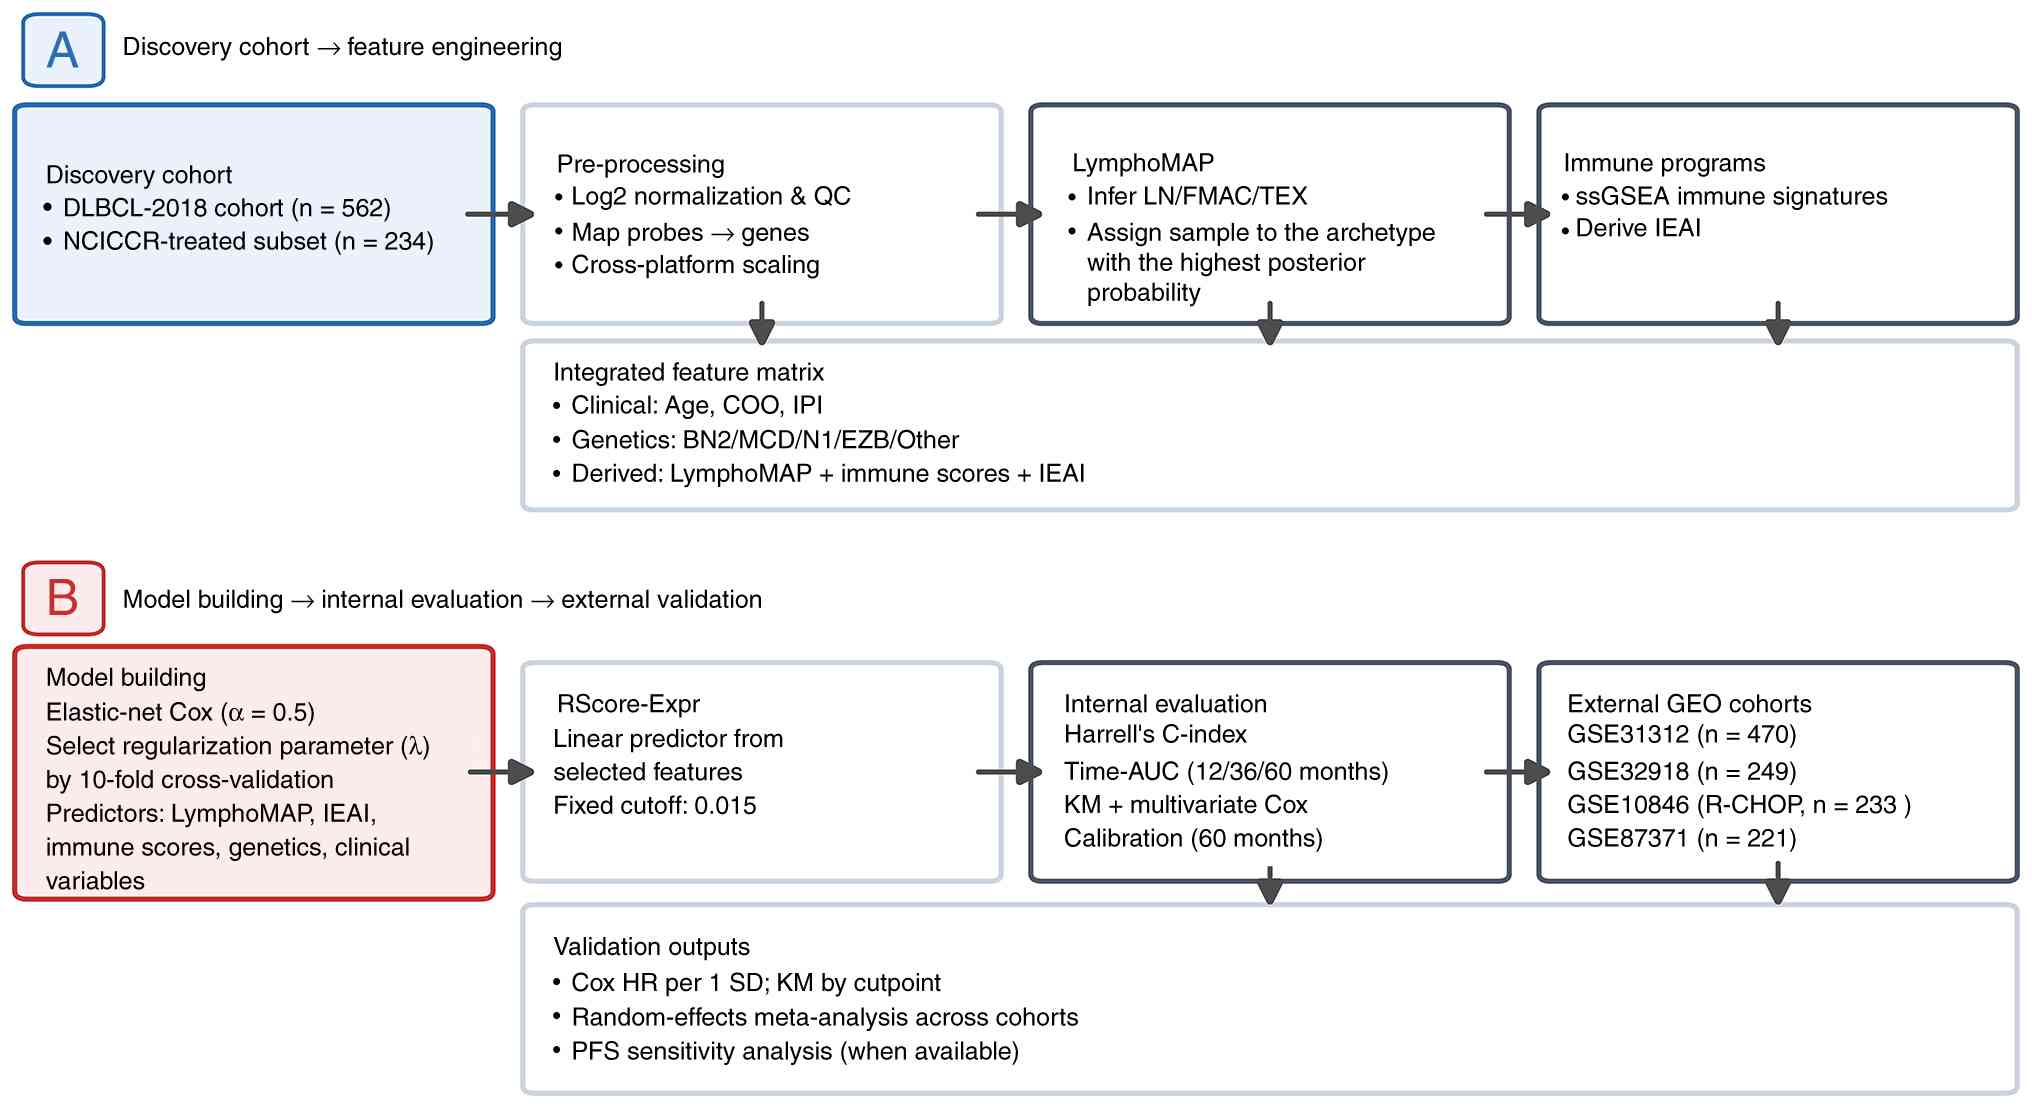 | Figure 1.Study design and analytical workflow.
(A) Discovery-cohort feature engineering. The full DLBCL-2018
cohort (n=562) was used for transcriptomic, genomic and
microenvironment association analyses, including LymphoMAP
inference, immune-program scoring and derivation of the IEAI. The
frontline immunochemotherapy-treated NCICCR subset (n=234) was used
as the discovery cohort for prognostic modeling. (B) Model
development, internal evaluation and external validation. An
elastic-net Cox model (α=0.5) with 10-fold cross-validation was
used to select the regularization parameter (λ) and derive the
transcriptomic risk score (RScore-Expr). Internal evaluation
included Harrell's C-index, time-dependent AUC, KM analysis,
multivariate Cox regression and calibration. External validation
was performed in four independent GEO cohorts using continuous HR
per 1 SD increase in RScore-Expr, random-effects meta-analysis and
PFS sensitivity analysis where available. AUC, area under the
curve; COO, cell-of-origin; DLBCL, diffuse large B-cell lymphoma;
FMAC, fibroblast-macrophage-rich; GEO, Gene Expression Omnibus; HR,
hazard ratio; IEAI, immune evasion-associated index; IPI,
International Prognostic Index; KM, Kaplan-Meier; LN, lymph
node-like; NCICCR, National Cancer Institute Center for Cancer
Research; PFS, progression-free survival; R-CHOP, rituximab plus
cyclophosphamide, doxorubicin, vincristine and prednisone; SD,
standard deviation; ssGSEA, single-sample gene set enrichment
analysis; TEX, T cell-exhausted; QC, quality control. |
Ethics statement
All analyses were performed on de-identified,
publicly available datasets. According to local regulations,
institutional review board approval and informed consent were not
required for the present study.
Transcriptomic data processing
For DLBCL-2018 data, gene-level expression was
analyzed using the log2-normalized expression matrix provided in
the public DLBCL-2018 release together with the matched clinical
and molecular sample annotations. For the external GEO validation
cohorts, processed expression matrices obtained from the GEO were
used for transcriptomic analyses; GEO data retrieval and handling
were performed in R (version 4.4.1; R Foundation for Statistical
Computing, Vienna; http://www.r-project.org/) using the GEOquery R
package (version 2.78.0; http://bioconductor.org/packages/GEOquery/). Probe
sets were mapped to gene symbols using platform annotations and
multiple probes mapping to the same gene were aggregated by median
expression. For cross-platform modeling, predictors were aligned by
gene symbol across cohorts. Predictor values were then scaled using
the mean and standard deviation (SD) of the discovery cohort,
defined as the immunochemotherapy-treated NCI Center for Cancer
Research (NCICCR) subset with overall survival (OS) data available
(n=234).
LymphoMAP archetype inference
The LymphoMAP archetypes LN, FMAC and TEX were
inferred from bulk gene expression using the published LymphoMAP
framework (17). Each sample was
assigned to the archetype with the highest posterior
probability.
Immune program scoring and IEAI
Immune programs were quantified using single-sample
gene set enrichment analysis, implemented through gene set
variation analysis (GSVA) using the GSVA R package (version 1.52.3)
(21,22). Gene sets were curated from the
Molecular Signatures Database hallmark collection using the msigdbr
R package (version 25.1.1; http://CRAN.R-project.org/package=msigdbr) and from
published immune signatures capturing antigen presentation (MHC
class I and II), cytolytic activity, T-cell exhaustion, myeloid
suppression, interferon-γ response and TGF-β signaling (23). Signature scores were centered and
scaled. An IEAI was defined to summarize the balance between
immune-suppressive and immune-recognition programs, and is
interpreted here as an immune evasion-associated transcriptional
phenotype rather than direct genomic proof of immune escape: IEAI=z
[(Exhaustion + MyeloidSuppression + TGF-β)-(MHC-I + MHC-II +
Cytolytic)], where z indicates standardization within the discovery
cohort; a higher IEAI indicates a more
immune-suppressed/antigen-presentation-low transcriptional state.
For gene-level comparisons, IEAI-high and IEAI-low cases were
defined as the upper and lower tertiles of the IEAI distribution,
respectively, and samples in the middle tertile were excluded from
the two-group analysis. Gene-level expression differences for TAP1,
TAP2, B2M, HLA-A, HLA-B, HLA-C, CIITA and CD58 between IEAI-high
and IEAI-low cases were assessed using the Wilcoxon rank-sum
test.
Public data access and preprocessing
tools
Public microarray datasets were obtained from GEO
under accession numbers GSE10846, GSE31312, GSE32918 and GSE87371.
When batch effects were suspected in cross-cohort exploratory
analyses, empirical Bayes adjustment (ComBat) was used as a
sensitivity analysis (24). Where
differential expression screening was required, linear modeling
with empirical Bayes moderation was performed using limma R package
(version 3.60.6) (25).
Cohort-level mutation and homozygous deletion frequencies for
selected antigen-presentation and immune evasion-associated genes
were extracted from the previously published appendix-level genomic
summaries of the DLBCL-2018 resource, and are presented
descriptively as genomic context only; no sample-level enrichment
analysis by IEAI stratum was performed.
Clinical and molecular covariates
Baseline clinical variables (age, sex and treatment
category) were extracted from the provided clinical annotations.
Ann Arbor stage (26), lactate
dehydrogenase (LDH) ratio, Eastern Cooperative Oncology Group
(ECOG) performance status (27) and
extranodal involvement were also used when available. The primary
clinical baseline model used IPI alone. A sensitivity analysis used
the individual IPI components (age >60 years, stage III/IV,
elevated LDH, ECOG >1 and >1 extranodal site) as the baseline
clinical model. COO (ABC vs. GCB) and genetic subtype calls (BN2,
MCD, N1, EZB and Other) followed published assignments generated
using a probabilistic classifier.
Survival endpoints
OS was defined as time from diagnosis to death from
any cause; patients alive at last follow-up were censored. For
cohorts with progression-free survival (PFS), PFS was defined as
time from diagnosis to progression/relapse or death, with censoring
at last follow-up.
Statistical analysis
Associations between categorical variables were
assessed using χ2 or Fisher's exact tests. Differences
in continuous variables across archetypes were assessed using the
Kruskal-Wallis test for overall group comparisons, as appropriate.
No post hoc pairwise comparisons were performed. Survival was
analyzed using Kaplan-Meier estimates and compared with the
log-rank test. Multivariate Cox proportional hazards models were
fitted using the survival R package (version 3.8–3; http://CRAN.R-project.org/package=survival) to
estimate hazard ratios (HRs) and 95% confidence intervals (CIs);
proportional hazards assumptions were evaluated using Schoenfeld
residuals. Associations between the IEAI and ESTIMATE-derived tumor
purity, stromal score, immune score and ESTIMATEScore were assessed
using Spearman correlation coefficients. ESTIMATE-based stromal
(28), immune and purity scores
were calculated using the estimate R package (version 1.0.13;
http://bioinformatics.mdanderson.org/estimate/rpackage.html)
in sensitivity analyses to assess whether bulk immune scores
primarily reflected tumor purity or microenvironment abundance. All
statistical tests were two-sided, and P<0.05 was considered to
indicate a statistically significant difference unless otherwise
specified. For multiple testing in gene-level expression
comparisons, Benjamini-Hochberg-adjusted Q-values were additionally
reported. Figures were generated using the ggplot2 R package
(version 4.0.1; http://cran.r-project.org/package=ggplot2).
Model development
To integrate microenvironment, immune, genetic and
clinical information, an elastic-net penalized Cox model (α=0.5)
was trained in the NCICCR-treated subset using the glmnet R package
(version 4.1–10; http://CRAN.R-project.org/package=glmnet). Candidate
predictors included LymphoMAP archetype, genetic subtype, IEAI,
immune signature scores, COO, age and IPI group. The regularization
parameter (λ) was selected by 10-fold cross-validation to maximize
the partial likelihood. The resulting linear predictor defined the
transcriptomic risk score (RScore-Expr). For visualization,
patients were dichotomized at the optimal cutpoint derived in
discovery (0.015).
Model performance evaluation
Discrimination was summarized using Harrell's
C-index and time-dependent receiver operating characteristic (ROC)
curves with area under the curve (AUC) values at 12, 36 and 60
months, using the approach of Heagerty et al (29), and implemented with the timeROC R
package (version 0.4; http://CRAN.R-project.org/package=timeROC).
Calibration at 60 months was assessed by comparing predicted and
observed survival probabilities using bootstrap resampling. Added
clinical utility beyond IPI was evaluated by comparing IPI-only,
RScore-Expr-only and IPI + RScore-Expr models using corrected
C-indices, likelihood-ratio tests, Akaike information criterion
(AIC) and decision-curve analysis at 24 and 60 months. Reporting
followed TRIPOD recommendations for prediction model development
and validation (30).
External validation and
meta-analysis
RScore-Expr was calculated in each external cohort
using the discovery model coefficients after feature alignment and
scaling. Cox models were fit within each cohort to estimate HRs per
1 SD increase in RScore-Expr. Cohort-specific estimates were
summarized using an inverse-variance weighted random-effects
meta-analysis; heterogeneity was described using Cochran's Q and
I2 statistics, but these values were not used to
determine model choice. As a complementary analysis,
cohort-specific Kaplan-Meier curves were generated using
cohort-specific median splits, but the primary external-validation
analysis treated RScore-Expr as a continuous predictor.
Results
Patient cohorts and LymphoMAP
distribution
The DLBCL-2018 cohort included 562 patients with
baseline clinical and transcriptomic data. The median age was 62
years [interquartile range (IQR) 52–70], and 242/562 (43.1%) of
patients were female. LymphoMAP archetypes were inferred for all
cases, with 179 (31.9%) classified as LN, 227 (40.4%) as FMAC and
156 (27.8%) as TEX. The distribution of genetic subtypes across the
full cohort was: BN2, 98 (17.4%); EZB, 68 (12.1%); MCD, 68 (12.1%);
N1, 18 (3.2%); and Other, 310 (55.2%) (Table SI).
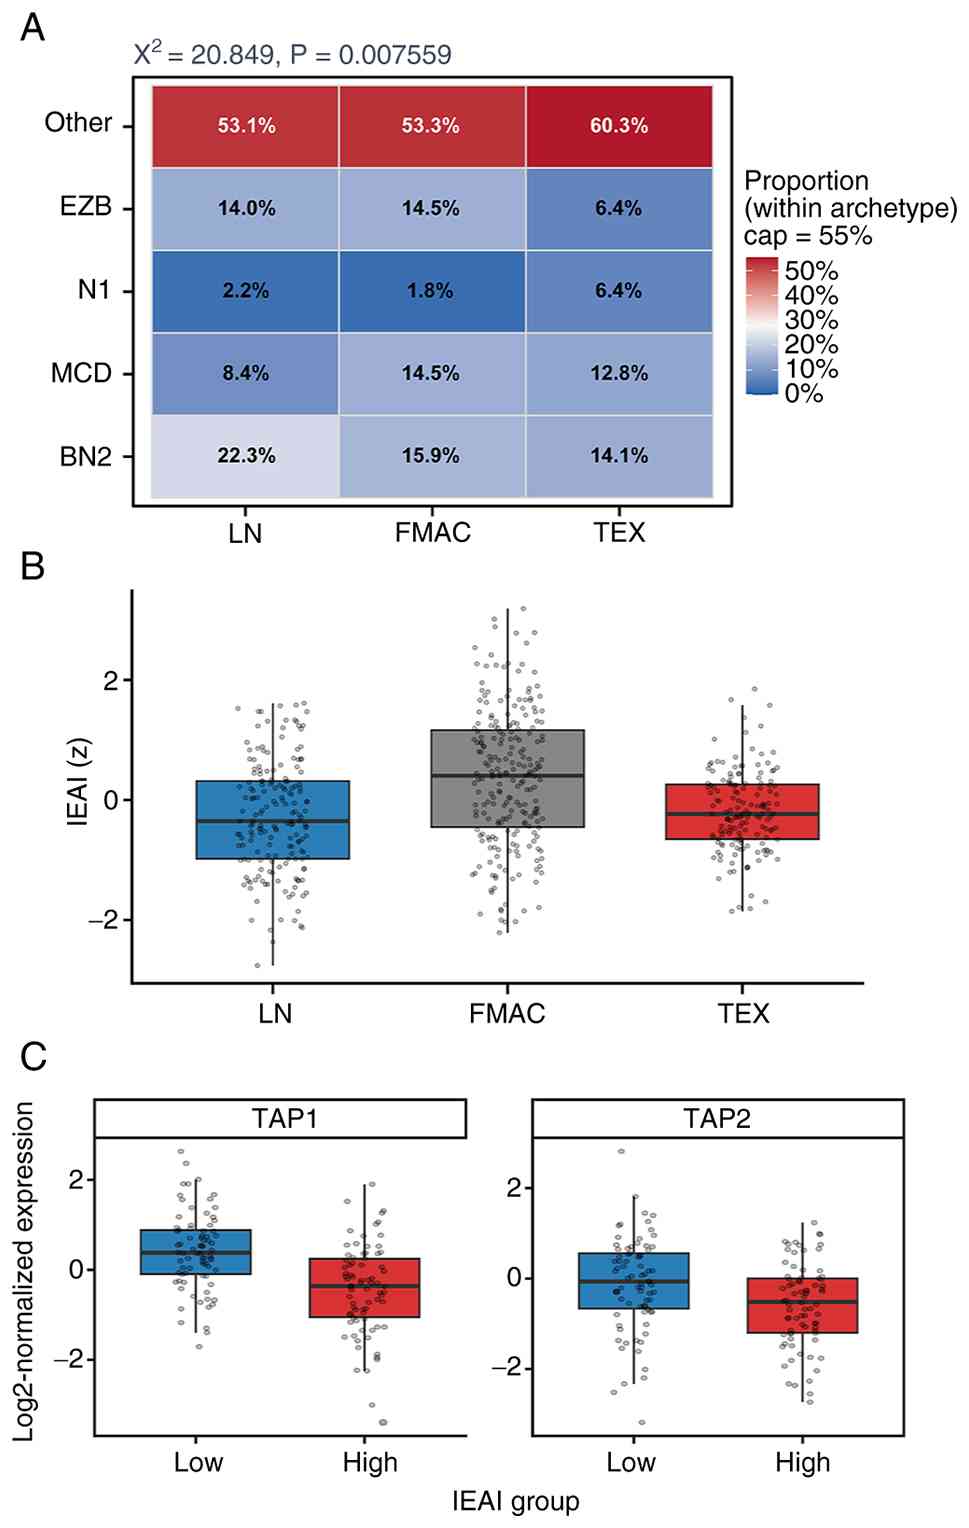
LymphoMAP archetypes associated with
genetic subtypes and IEAI
Genetic subtypes were non-randomly distributed
across LymphoMAP archetypes (χ2=20.85, P=0.0076;
Fig. 2A). Relative differences were
observed across archetypes, with BN2 more frequent in LN, FMAC
showing relatively higher proportions of MCD/EZB, and TEX
containing a larger fraction of N1/Other cases.
Immune evasion-associated programs, summarized by
the IEAI, showed distinct distributions across archetypes (Fig. 2B). LN tumors showed the lowest IEAI
values (median, −0.35), FMAC tumors showed the highest values
(median, 0.40) and TEX tumors showed intermediate-to-low values
(median, −0.23) that were closer to LN than to FMAC, indicating
that the categorical LymphoMAP archetypes and the continuous IEAI
capture overlapping but non-identical immune states (Fig. 2B; Table
SI). Exploratory expression analyses in the discovery cohort
further showed reduced TAP1 (P=1.63×10⁻⁷;
Q=1.31×10⁻⁶) and TAP2 (P=0.0030; Q=0.0122) expression in
IEAI-high cases, defined as the upper tertile of the IEAI
distribution, compared with IEAI-low cases defined as the lower
tertile (Fig. 2C; Table SII); samples in the middle tertile
were excluded from this two-group comparison. TAP1 and TAP2 encode
key components of the transporter associated with antigen
processing and are central to MHC class I antigen presentation;
thus, their reduced expression is consistent with an immune
evasion-associated state marked by impaired antigen
processing/presentation (31).
LymphoMAP archetypes are not
independently prognostic in immunochemotherapy-treated
patients
The current study subsequently focused on the
NCICCR-treated subset with immunochemotherapy and OS data (n=234).
Baseline clinical and molecular characteristics of this discovery
cohort are summarized in Table I.
In this clinically treated subset, LymphoMAP archetypes alone did
not stratify OS (log-rank P=0.67; Fig.
3A).
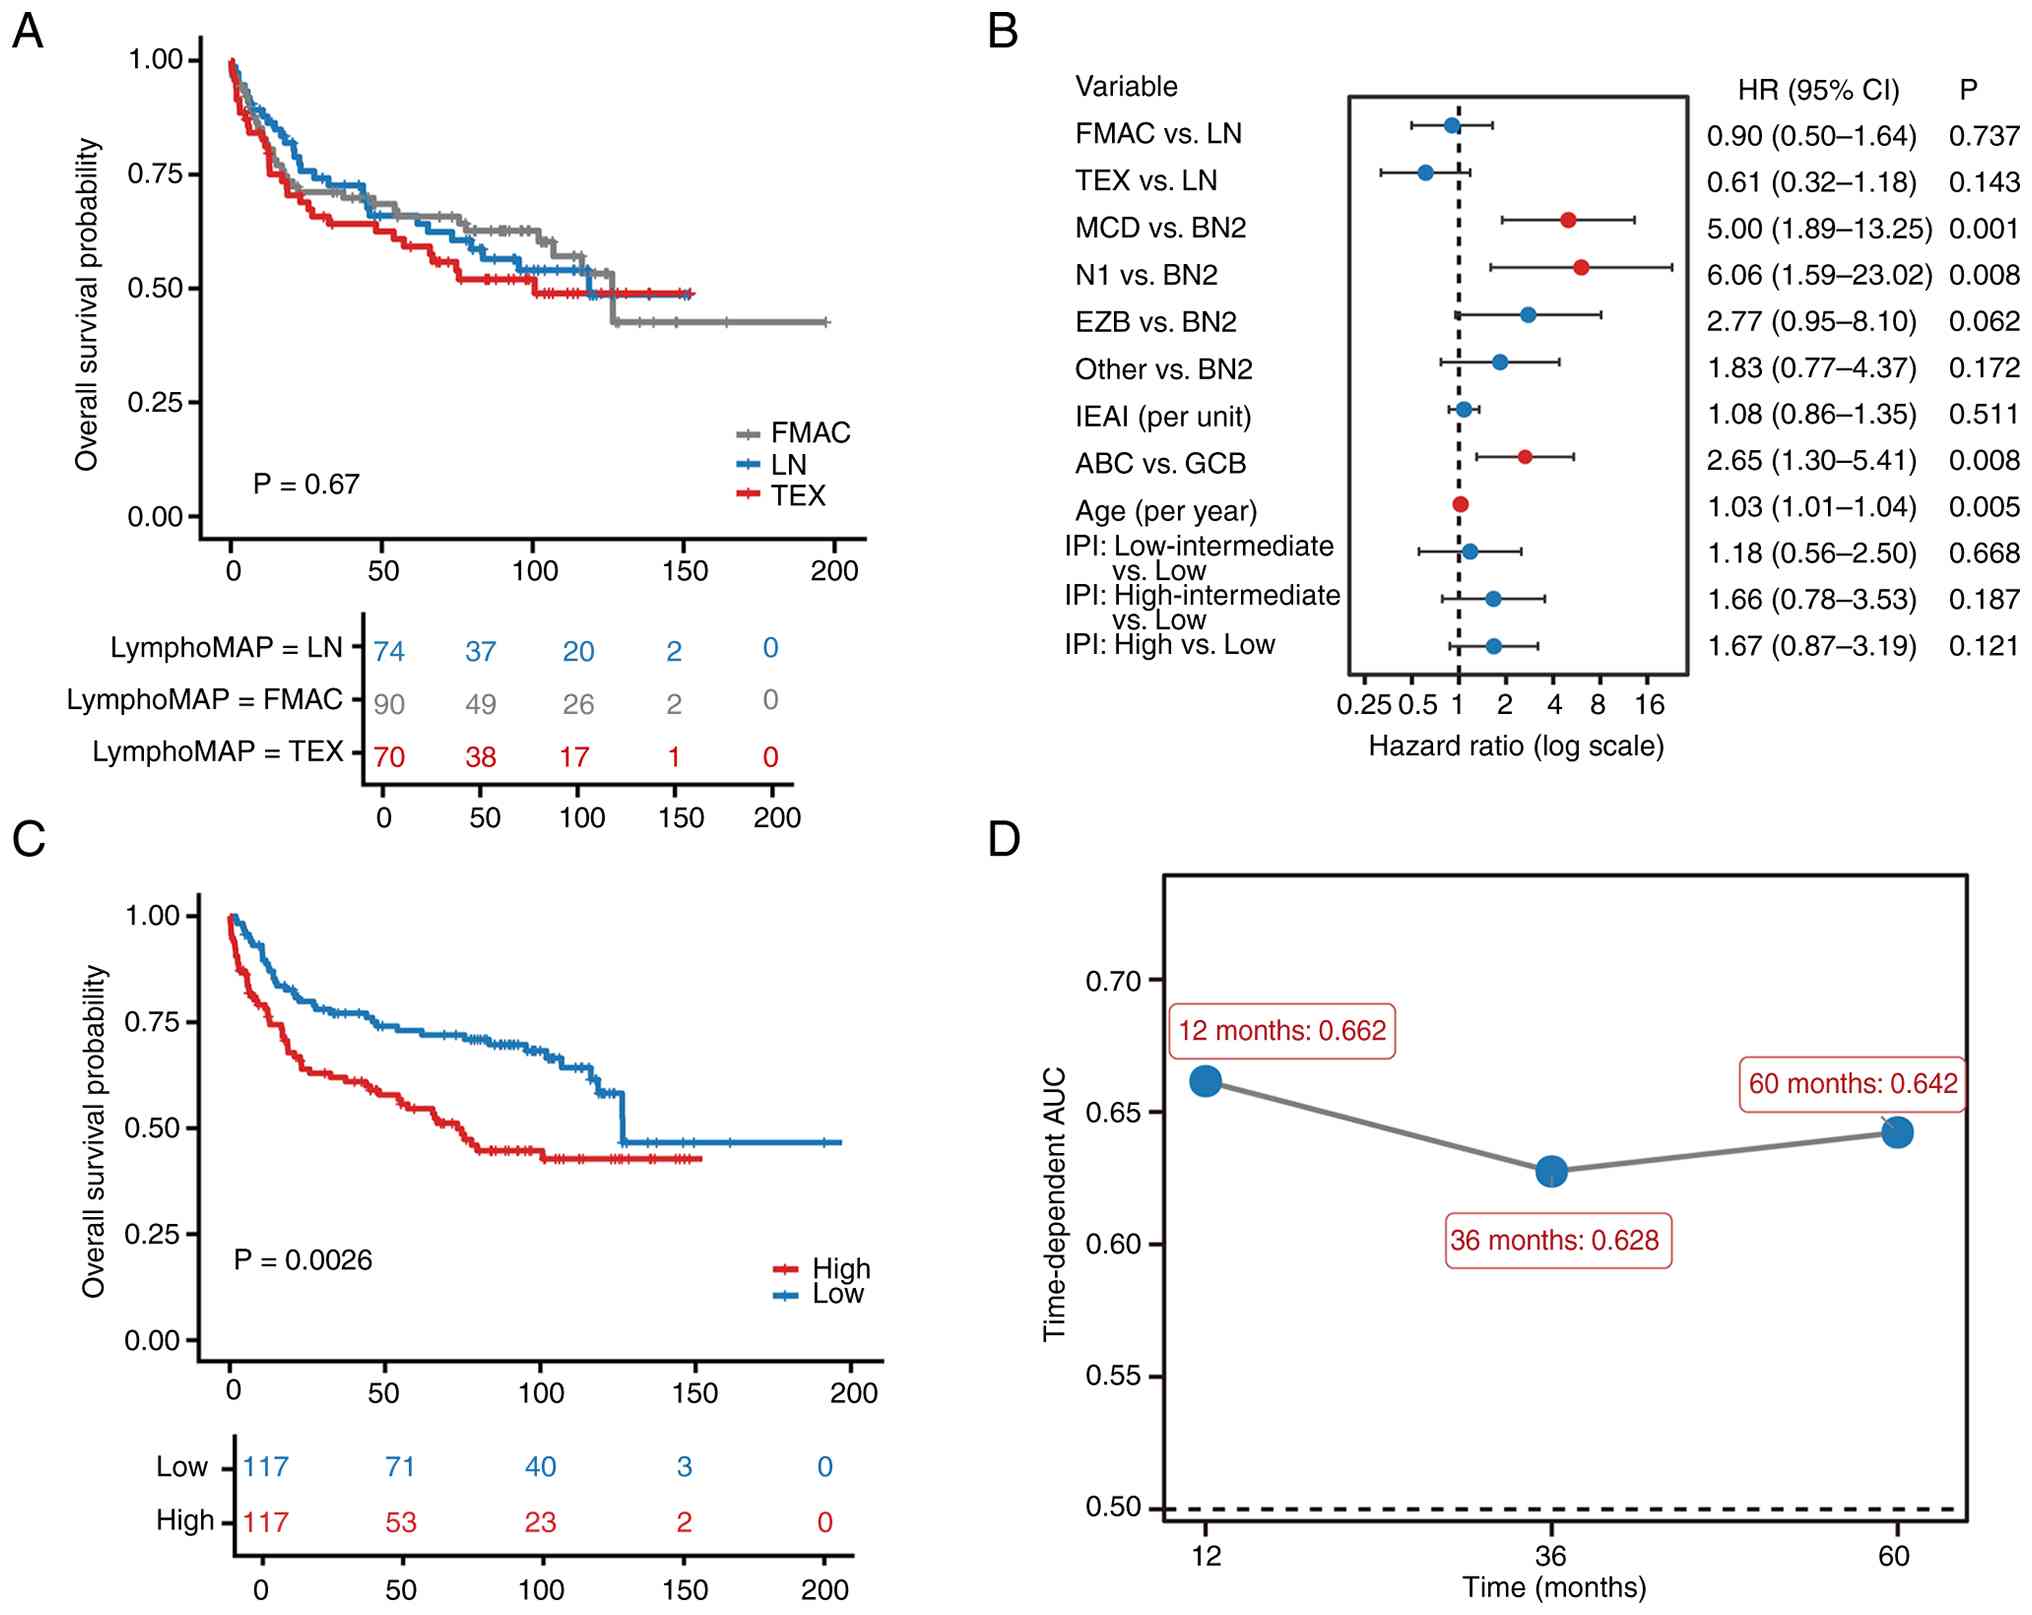 | Figure 3.Discovery-cohort prognostic analyses.
(A) Kaplan-Meier OS curves for the National Cancer Institute Center
for Cancer Research -treated discovery cohort stratified by
LymphoMAP archetype, showing no significant separation (log-rank
P=0.67). (B) Multivariate Cox regression including LymphoMAP
archetype, genetic subtype, IEAI, COO, age and IPI group. MCD and
N1 genetic subtypes, ABC COO and increasing age were associated
with inferior OS, whereas neither FMAC archetype, TEX archetype or
IEAI were independently associated with OS. (C) Kaplan-Meier OS
curves stratified by high-RScore-Expr versus low-RScore-Expr using
the prespecified discovery cutpoint, showing a significant
difference (log-rank P=0.0026). (D) Time-dependent AUC values of
RScore-Expr at 12, 36 and 60 months. ABC, activated B-cell-like;
AUC, area under the curve; COO, cell-of-origin; FMAC,
fibroblast-macrophage-rich; GCB, germinal center B-cell-like; IEAI,
immune evasion-associated index; IPI, International Prognostic
Index; LN, lymph node-like; OS, overall survival; TEX, T
cell-exhausted. |
 | Table I.Baseline characteristics of the
discovery immunochemotherapy cohort stratified by RScore-Expr
score. |
Table I.
Baseline characteristics of the
discovery immunochemotherapy cohort stratified by RScore-Expr
score.
| Characteristic | Overall
(n=234) | Low RScore-Expr
(n=117) | High RScore-Expr
(n=117) | P-value |
|---|
| Median age, years
(IQR) | 61.0
(49.0–72.0) | 57.0
(47.0–69.0) | 65.0
(54.0–73.0) | 0.0019 |
| Sex |
|
|
| 1.000 |
|
Female | 95 (40.6%) | 47 (40.2%) | 48 (41.0%) |
|
|
Male | 139 (59.4%) | 70 (59.8%) | 69 (59.0%) |
|
| Ann Arbor
stage |
|
|
| 0.793 |
|
I–II | 109 (46.6%) | 56 (47.9%) | 53 (45.3%) |
|
|
III–IV | 122 (52.1%) | 60 (51.3%) | 62 (53.0%) |
|
| LDH ratio |
|
|
| 0.481 |
| ≤1 | 97 (41.5%) | 51 (43.6%) | 46 (39.3%) |
|
|
>1 | 105 (44.9%) | 49 (41.9%) | 56 (47.9%) |
|
| ECOG |
|
|
| 0.263 |
|
0-1 | 162 (69.2%) | 83 (70.9%) | 79 (67.5%) |
|
| ≥2 | 50 (21.4%) | 21 (17.9%) | 29 (24.8%) |
|
| Extranodal
sites |
|
|
| 0.437 |
|
0-1 | 190 (81.2%) | 98 (83.8%) | 92 (78.6%) |
|
|
>1 | 30 (12.8%) | 13 (11.1%) | 17 (14.5%) |
|
| IPI group |
|
|
| 0.022 |
|
Low | 81 (34.6%) | 50 (42.7%) | 31 (26.5%) |
|
|
Low-Intermediate | 45 (19.2%) | 18 (15.4%) | 27 (23.1%) |
|
|
High-Intermediate | 44 (18.8%) | 16 (13.7%) | 28 (23.9%) |
|
|
High | 64 (27.4%) | 33 (28.2%) | 31 (26.5%) |
|
| COO |
|
|
| <0.001 |
|
ABC | 82 (35.0%) | 22 (18.8%) | 60 (51.3%) |
|
|
GCB | 110 (47.0%) | 78 (66.7%) | 32 (27.4%) |
|
| Genetic
subtype |
|
|
| 0.0039 |
|
BN2 | 42 (17.9%) | 22 (18.8%) | 20 (17.1%) |
|
|
MCD | 19 (8.1%) | 4 (3.4%) | 15 (12.8%) |
|
| N1 | 6 (2.6%) | 0 (0.0%) | 6 (5.1%) |
|
|
EZB | 50 (21.4%) | 31 (26.5%) | 19 (16.2%) |
|
|
Other | 117 (50.0%) | 60 (51.3%) | 57 (48.7%) |
|
In a multivariate Cox model including LymphoMAP
archetype, genetic subtype, IEAI, COO, age and IPI group (Table SIII; Fig. 3B), the MCD and N1 genetic subtypes,
ABC COO and increasing age were associated with inferior OS,
whereas neither FMAC or TEX archetypes nor the IEAI were
independently associated with OS.
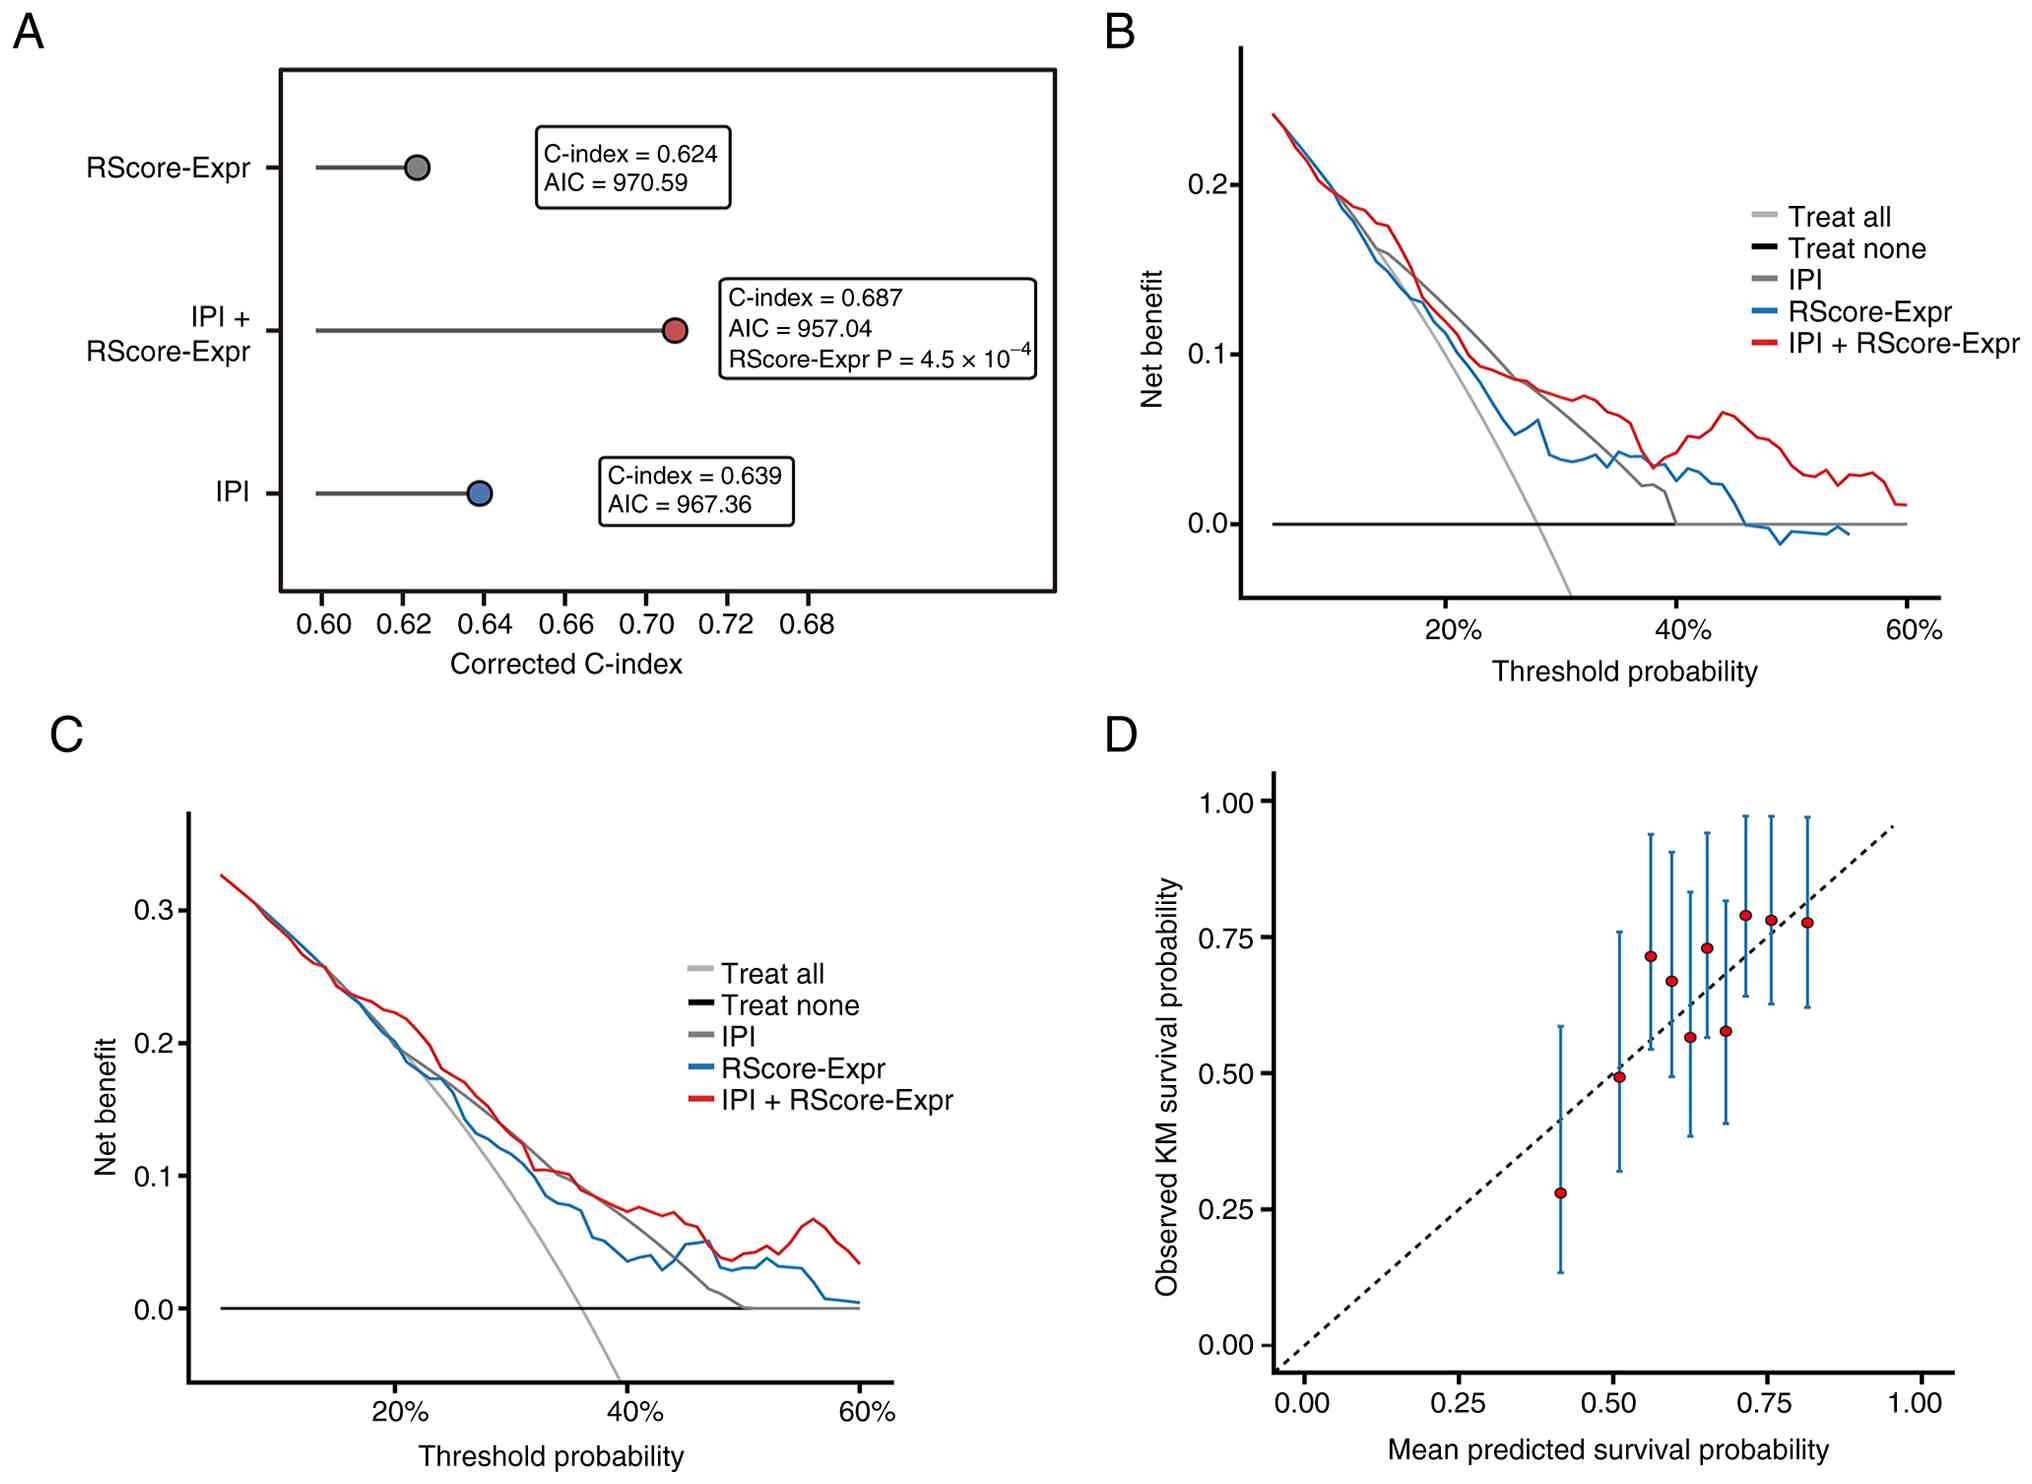
Development and internal performance
of an integrated transcriptomic risk score (RScore-Expr)
To integrate microenvironment and immune programs
with clinical and molecular features, an elastic-net Cox model was
trained in the NCICCR-treated subset, yielding a transcriptomic
risk score (RScore-Expr). Using the discovery cutpoint (0.015),
RScore-Expr stratified patients into high- and low-risk groups with
distinct survival outcomes (log-rank P=0.0026; Fig. 3C).
RScore-Expr demonstrated moderate discrimination in
the treated subset (C-index 0.624). Time-dependent AUC values were
0.662, 0.628 and 0.642 at 12, 36 and 60 months, respectively
(Fig. 3D). Modeled continuously,
higher RScore-Expr was associated with increased hazard of death
(HR per 1 SD, 1.52; 95% CI 1.21–1.89; P=2.5×10⁻⁴), with
an approximately monotonic risk increase across the score range.
Calibration at 60 months showed reasonable agreement between
predicted and observed survival (Fig.
4D).
Added value of RScore-Expr beyond IPI
and clinical utility in the discovery cohort
The present study next compared the transcriptomic
model directly against the IPI. In the discovery cohort, the
IPI-only model had a corrected C-index of 0.639, the
RScore-Expr-only model had a corrected C-index of 0.624, and the
combined IPI + RScore-Expr model improved the corrected C-index to
0.687. Adding RScore-Expr to IPI improved model fit
(likelihood-ratio χ2=12.32, P=4.48×10⁻⁴) and
reduced the AIC from 967.36 to 957.04 (Table II; Fig.
4A). Decision-curve analysis further showed that the combined
model provided higher net benefit than either model alone across
clinically relevant threshold ranges at both 24 and 60 months
(Fig. 4B and C). A sensitivity
analysis using the individual IPI components as the clinical
baseline yielded concordant results (Table II).
| Table II.Comparison of clinical and
transcriptomic prognostic models in the discovery cohort. |
Table II.
Comparison of clinical and
transcriptomic prognostic models in the discovery cohort.
| Model | Corrected
C-index | AIC | LR test vs.
baseline |
|---|
| Primary
analysis |
|
|
|
|
IPI-only | 0.639 | 967.36 | - |
|
RScore-Expr-only | 0.624 | 970.59 | - |
| IPI +
RScore-Expr | 0.687 | 957.04 |
χ2=12.32;
P=4.48×10⁻⁴ |
| Sensitivity
analysis |
|
|
|
| IPI
components-only | 0.687 | 951.83 | - |
| IPI
components +RScore-Expr | 0.707 | 945.33 | χ2=8.50;
P=0.00354 |
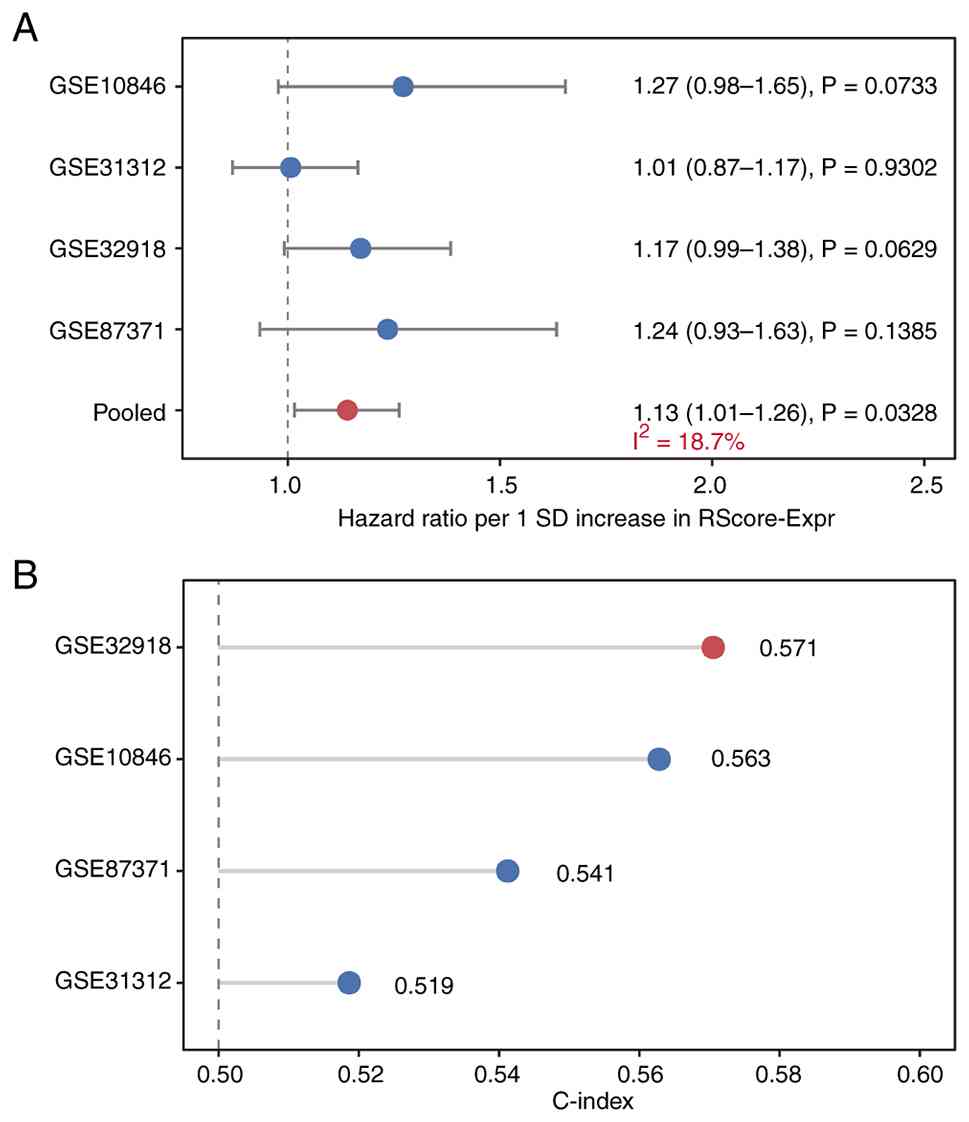
External validation across independent
cohorts
RScore-Expr was applied to four independent GEO
cohorts (GSE31312, n=470; GSE32918, n=249; GSE10846, n=233;
GSE87371, n=221; total n=1,173). Across the four external cohorts,
all cohort-specific HRs for OS were directionally >1, indicating
a consistent trend toward worse survival with higher RScore-Expr,
although none of the individual cohort-specific estimates reached
statistical significance. The strongest trends were observed in
GSE10846 (HR per 1 SD, 1.27; 95% CI, 0.98–1.65; P=0.0733) and
GSE32918 (HR, 1.17; 95% CI, 0.99–1.38; P=0.0629), whereas the
effect was minimal in GSE31312 (HR, 1.01; 95% CI, 0.87–1.17;
P=0.9302) and directionally similar but less precise in GSE87371
(HR, 1.24; 95% CI, 0.93–1.63; P=0.1385). When summarized using a
random-effects meta-analysis, the pooled association for OS was
statistically significant (HR per 1 SD, 1.13; 95% CI, 1.01–1.26;
P=0.0328; Fig. 5A; Table SIV). Fig. 5B shows the cohort-specific C-index
values for OS in the external cohorts, indicating modest but
directionally consistent discrimination across datasets.
For PFS, the direction of effect was similar across
the cohorts with available data, although neither cohort-specific
estimate reached statistical significance (GSE31312, P=0.2664;
GSE87371, P=0.0528). The pooled random-effects association also did
not reach statistical significance (HR, 1.14; 95% CI, 0.99–1.31;
P=0.0716; Table SV). The
dichotomized Kaplan-Meier plots shown in Fig. S1 are provided as complementary
visualizations, whereas calibration plots for the external
continuous models are shown in Fig.
S2. Additional supplementary analyses of antigen-processing and
immune evasion-associated genes are summarized in Tables SV and SVI. The corresponding statistical
comparisons, P-values and Q-values are reported in Table SII.
In the all-cohort analysis, IEAI-high cases showed
the strongest reductions in TAP1 and TAP2, together with lower
CIITA and HLA-A/B/C expression. In the NCICCR-treated
immunochemotherapy discovery cohort (n=234), TAP1 and TAP2 showed
the most robust differences, whereas the remaining genes showed
directionally similar but less stable differences after
multiple-testing correction. Cohort-level mutation and homozygous
deletion frequencies of selected antigen-presentation and immune
evasion-associated genes are summarized in Table SVI as descriptive genomic context.
ESTIMATE-based sensitivity analyses showed that the IEAI was only
weakly inversely correlated with estimated tumor purity in both the
full cohort (Spearman ρ=−0.142; P=7.7×10⁻⁴) and the
discovery cohort (ρ=−0.160; P=0.014), whereas the relationship with
stromal score was stronger (full cohort: ρ=0.327;
P=2.25×10⁻¹⁵; discovery cohort: ρ=0.370;
P=6.8×10⁻⁹) (Fig. S3;
Table SVII). In minimal
multivariate Cox models, adding estimated tumor purity did not
materially alter the associations of the main predictors with OS,
and tumor purity itself was not independently associated with OS
(Table SVIII). In a nested model
comparison, a likelihood-ratio test comparing Cox models with and
without tumor purity showed that adding tumor purity to the minimal
OS Cox model did not improve model fit (χ2=0.157, 1
degree of freedom, P=0.6922). The corresponding gene-level
expression patterns are visualized in Fig. S4.
Discussion
This integrative analysis linked
transcriptome-inferred LME archetypes, tumor genetic subtypes and
immune evasion-associated programs in DLBCL, and proposed a
cross-platform transcriptomic risk score (RScore-Expr). In the
DLBCL-2018 cohort, LymphoMAP archetypes were associated with
genetic subtypes and displayed distinct immune-program patterns.
While archetypes alone were not prognostic in the
immunochemotherapy-treated subset, an integrated model yielded a
risk score with moderate internal discrimination, added value
beyond IPI and a statistically supported, albeit modest,
association with survival across four external cohorts.
The biological associations between genetic subtype
and microenvironment state remain plausible. ABC-type DLBCL and MCD
tumors are frequently characterized by chronic active B-cell
receptor signaling and oncogenic MYD88 signaling, which can shape
inflammatory cytokine production and immune interactions (10,32,33).
These pathways are therapeutically actionable; an early-phase study
of Bruton tyrosine kinase inhibition (ibrutinib) demonstrated the
feasibility of molecularly informed targeting in DLBCL, and
motivate integration of tumor-intrinsic and microenvironmental
biomarkers (34).
Across the full cohort, the LN archetype exhibited
the lowest IEAI, whereas FMAC showed the highest values and TEX
overlapped substantially with LN, indicating that the IEAI is
related to, but not equivalent to, categorical LymphoMAP labels.
The IEAI used in the present study was designed to summarize
opposing immune forces by contrasting exhaustion/myeloid
suppression/TGF-β activity with antigen presentation and cytolytic
programs; TEX remains biologically consistent with a TEX state, a
well-characterized form of T-cell dysfunction arising from
persistent antigen stimulation and inhibitory receptor signaling
(35). Cytolytic activity
signatures have been linked to tumor immunogenicity and immune
engagement across multiple cancer types, including melanoma, lung
cancer and colorectal cancer (36).
Inferring LME states from bulk transcriptomes is
necessarily indirect. Nevertheless, prior work has shown that bulk
expression contains sufficient information to estimate immune and
stromal composition; for example, deconvolution approaches such as
CIBERSORT enable robust enumeration of cell subsets from tissue
expression profiles (37). In the
current ESTIMATE-based sensitivity analyses, the IEAI showed only a
weak inverse correlation with estimated tumor purity in both the
full cohort (ρ=−0.142) and the discovery cohort (ρ=−0.160), whereas
the relationship with stromal score was stronger (ρ=0.327 and
0.370, respectively), supporting that IEAI reflects bulk
microenvironment composition rather than purity alone. Moreover,
adding tumor purity to the minimal OS model did not materially
alter the estimated effects of the main predictors, and tumor
purity itself was not independently associated with outcome. The
FMAC archetype, in particular, may reflect fibroblast-macrophage
interactions. and stromal remodeling that can physically and
functionally restrict effector lymphocyte infiltration. Notably,
TGF-β signaling can contribute to immune exclusion and attenuate
responses to PD-1 or PD-L1 blockade by limiting T-cell access to
tumor nests (38). These
mechanistic considerations align with the cancer-immunity cycle
framework, where impairments in antigen presentation, priming,
trafficking and effector function can converge to create
immunologically ‘cold’ or resistant phenotypes (39).
Although RScore-Expr improved risk stratification in
the discovery cohort, external validation highlighted a common
challenge for transcriptome-derived prognostic models: Effect sizes
are often attenuated across heterogeneous cohorts and measurement
platforms. Therefore RScore-Expr was evaluated as a continuous
predictor (per 1 SD increase) and the results were summarized by
inverse-variance random-effects meta-analysis to account for
between-cohort heterogeneity. Meta-analytic approaches provide a
principled framework to combine cohort-specific HRs and to quantify
heterogeneity (40,41). The modest pooled HR observed in the
current study suggested that RScore-Expr may capture a component of
risk that is reproducible but not dominant, consistent with the
fact that outcome under R-CHOP is influenced by multiple factors,
including IPI-related clinical risk, COO, genetic subtype, and
other host- and disease-related features. Several considerations
are important for interpretation. First, median-splitting the score
within individual cohorts did not consistently yield statistically
significant separation, despite directionally consistent trends.
This is expected because dichotomizing continuous predictors can
reduce statistical power and obscure risk gradients, particularly
when cohort sizes are modest and baseline risk differs across
datasets (42). Second, the treated
subset used for model development was of moderate size, and the
model may still be susceptible to overfitting despite
regularization. General guidance on multivariate prognostic
modeling emphasizes careful internal validation, calibration
assessment and the need for external validation before clinical
application (43). The current
study followed TRIPOD reporting principles to facilitate
transparent interpretation and replication (30). A limitation of the current study is
that direct sample-to-sample concordance testing against the
original published LymphoMAP calls was not performed, and
pretreatment tumor transcriptomic data from CAR T-treated DLBCL
were not available for validation. Biologically, the present
results support the view that immune evasion-associated programs
and microenvironment remodeling are integral components of
malignant progression. Expression analyses in IEAI-high cases
highlighted reduced TAP1/TAP2 and related antigen-processing
signals, supporting an immune evasion-associated transcriptional
phenotype. However, publicly available appendix-level genomic
summaries did not allow direct sample-level enrichment testing of
HLA/B2M-related lesions by IEAI status. Immune evasion and
tumor-microenvironment crosstalk are increasingly recognized as
enabling capabilities in cancer biology (44). In the era of immunotherapy, immune
evasion-associated programs, impaired
antigen-processing/presentation signals and tumor-microenvironment
crosstalk may also help explain interpatient variability in
response to emerging strategies in lymphoma. Immune checkpoint
blockade has become a central modality in cancer therapy and is
being actively explored in aggressive lymphoma, particularly in
rational combinations (45).
Future work should focus on prospective validation
and on refining the score for clinical deployment, including robust
cross-platform normalization, harmonized endpoint definitions and
incorporation of additional modalities (for example, circulating
tumor DNA, spatial profiling or single-cell data). Notably, any
clinical implementation should preserve the continuous nature of
the score and pre-specify cutpoints to avoid optimistic bias.
Dedicated validation in pretreatment tumor-bulk datasets from CAR
T-treated DLBCL would be particularly valuable. The broader field
of checkpoint blockade and combination immunotherapy continues to
evolve, and integrating microenvironment archetypes with tumor
genetics may help guide personalized immunomodulatory approaches
(46).
In conclusion, LymphoMAP archetypes were revealed to
be biologically linked to DLBCL genetic subtype structure and to an
immune evasion-associated transcriptional axis, but were not
independently prognostic in the treated subset. The novelty of the
current study lies in integrating microenvironment archetypes, an
immune evasion-associated transcriptional index, genetic subtypes
and clinical variables into a single cross-platform transcriptomic
risk model that was externally evaluated across independent cohorts
and benchmarked against IPI. This integrated framework identifies a
modest but reproducible risk signal and provides a more
interpretable basis for future molecular risk stratification in
DLBCL.
Supplementary Material
Supporting Data
Supporting Data
Acknowledgements
Not applicable.
Funding
Funding: No funding was received.
Availability of data and materials
The data generated in the present study may be
requested from the corresponding author.
Authors' contributions
XC wrote the original draft, performed the formal
analyses, curated and harmonized the publicly available clinical,
transcriptomic and genomic datasets, and contributed to study
conceptualization. YZ contributed to study conceptualization,
supervised the analytical methodology and investigation, and
critically revised the manuscript. JZ contributed to acquisition
and organization of the publicly available datasets, review of the
analytical results and critical revision of the manuscript. SJ
contributed to interpretation of the results, review of the
analytical framework, figure preparation based on the analytical
findings and critical revision of the manuscript. LW contributed to
study design refinement, interpretation of the results,
methodological review and critical revision of the manuscript. XC
and YZ confirm the authenticity of all the raw data. All authors
read and approved the final manuscript.
Ethics approval and consent to
participate
Not applicable.
Patient consent for publication
Not applicable.
Competing interests
The authors declare that they have no competing
interests.
References
|
1
|
Vannata B, Conconi A, Winkler J, Cascione
L, Casaluci GM, Nassi L, Moia R, Pirosa MC, Moccia AA, Stathis A,
et al: Late relapse in patients with diffuse large B-cell lymphoma:
Impact of rituximab on their incidence and outcome. Br J Haematol.
187:478–487. 2019. View Article : Google Scholar : PubMed/NCBI
|
|
2
|
Coiffier B and Sarkozy C: Diffuse large
B-cell lymphoma: R-CHOP failure-what to do? Hematology Am Soc
Hematol Educ Program. 2016:366–378. 2016. View Article : Google Scholar : PubMed/NCBI
|
|
3
|
A predictive model for aggressive
non-Hodgkin's lymphoma. N Engl J Med. 329:987–994. 1993. View Article : Google Scholar : PubMed/NCBI
|
|
4
|
Alizadeh AA, Eisen MB, Davis RE, Ma C,
Lossos IS, Rosenwald A, Boldrick JC, Sabet H, Tran T, Yu X, et al:
Distinct types of diffuse large B-cell lymphoma identified by gene
expression profiling. Nature. 403:503–511. 2000. View Article : Google Scholar : PubMed/NCBI
|
|
5
|
Rosenwald A, Wright G, Chan WC, Connors
JM, Campo E, Fisher RI, Gascoyne RD, Muller-Hermelink HK, Smeland
EB, Giltnane JM, et al: The use of molecular profiling to predict
survival after chemotherapy for diffuse large-B-cell lymphoma. N
Engl J Med. 346:1937–1947. 2002. View Article : Google Scholar : PubMed/NCBI
|
|
6
|
Hans CP, Weisenburger DD, Greiner TC,
Gascoyne RD, Delabie J, Ott G, Müller-Hermelink HK, Campo E,
Braziel RM, Jaffe ES, et al: Confirmation of the molecular
classification of diffuse large B-cell lymphoma by
immunohistochemistry using a tissue microarray. Blood. 103:275–282.
2004. View Article : Google Scholar : PubMed/NCBI
|
|
7
|
Monti S, Savage KJ, Kutok JL, Feuerhake F,
Kurtin P, Mihm M, Wu B, Pasqualucci L, Neuberg D, Aguiar RC, et al:
Molecular profiling of diffuse large B-cell lymphoma identifies
robust subtypes including one characterized by host inflammatory
response. Blood. 105:1851–1861. 2005. View Article : Google Scholar : PubMed/NCBI
|
|
8
|
Lenz G, Wright G, Dave SS, Xiao W, Powell
J, Zhao H, Xu W, Tan B, Goldschmidt N, Iqbal J, et al: Stromal gene
signatures in large-B-cell lymphomas. N Engl J Med. 359:2313–2323.
2008. View Article : Google Scholar : PubMed/NCBI
|
|
9
|
Schmitz R, Wright GW, Huang DW, Johnson
CA, Phelan JD, Wang JQ, Roulland S, Kasbekar M, Young RM, Shaffer
AL, et al: Genetics and pathogenesis of diffuse large B-cell
lymphoma. N Engl J Med. 378:1396–1407. 2018. View Article : Google Scholar : PubMed/NCBI
|
|
10
|
Chapuy B, Stewart C, Dunford AJ, Kim J,
Kamburov A, Redd RA, Lawrence MS, Roemer MGM, Li AJ, Ziepert M, et
al: Molecular subtypes of diffuse large B cell lymphoma are
associated with distinct pathogenic mechanisms and outcomes. Nat
Med. 24:679–690. 2018. View Article : Google Scholar : PubMed/NCBI
|
|
11
|
Wright GW, Huang DW, Phelan JD, Coulibaly
ZA, Roulland S, Young RM, Wang JQ, Schmitz R, Morin RD, Tang J, et
al: A probabilistic classification tool for genetic subtypes of
diffuse large B cell lymphoma with therapeutic implications. Cancer
Cell. 37:551–568.e514. 2020. View Article : Google Scholar : PubMed/NCBI
|
|
12
|
Reddy A, Zhang J, Davis NS, Moffitt AB,
Love CL, Waldrop A, Leppa S, Pasanen A, Meriranta L,
Karjalainen-Lindsberg ML, et al: Genetic and functional drivers of
diffuse large B cell lymphoma. Cell. 171:481–494.e415. 2017.
View Article : Google Scholar : PubMed/NCBI
|
|
13
|
Swerdlow SH, Campo E, Pileri SA, Harris
NL, Stein H, Siebert R, Advani R, Ghielmini M, Salles GA, Zelenetz
AD and Jaffe ES: The 2016 revision of the World Health Organization
classification of lymphoid neoplasms. Blood. 127:2375–2390. 2016.
View Article : Google Scholar : PubMed/NCBI
|
|
14
|
Kotlov N, Bagaev A, Revuelta MV, Phillip
JM, Cacciapuoti MT, Antysheva Z, Svekolkin V, Tikhonova E,
Miheecheva N, Kuzkina N, et al: Clinical and biological subtypes of
B-cell lymphoma revealed by microenvironmental signatures. Cancer
Discov. 11:1468–1489. 2021. View Article : Google Scholar : PubMed/NCBI
|
|
15
|
Li X, Singhal K, Deng Q, Chihara D,
Russler-Germain D, Harkins RA, Henderson J, Arita K, Kizhakeyil A,
Sun R, et al: Large B cell lymphoma microenvironment archetype
profiles. Cancer Cell. 43:1347–1364.e1313. 2025. View Article : Google Scholar : PubMed/NCBI
|
|
16
|
Challa-Malladi M, Lieu YK, Califano O,
Holmes AB, Bhagat G, Murty VV, Dominguez-Sola D, Pasqualucci L and
Dalla-Favera R: Combined genetic inactivation of β2-Microglobulin
and CD58 reveals frequent escape from immune recognition in diffuse
large B cell lymphoma. Cancer Cell. 20:728–740. 2011. View Article : Google Scholar : PubMed/NCBI
|
|
17
|
Schmitz R, Wright GW, Huang DW, Johnson
CA, Phelan JD, Wang JQ, Roulland S, Kasbekar M, Young RM, Shaffer
AL, et al: Genetics and pathogenesis of diffuse large B-cell
lymphoma. N Engl J Med. 378:1396–1407. 2018. View Article : Google Scholar : PubMed/NCBI
|
|
18
|
Visco C, Li Y, Xu-Monette ZY, Miranda RN,
Green TM, Li Y, Tzankov A, Wen W, Liu WM, Kahl BS, et al:
Comprehensive gene expression profiling and immunohistochemical
studies support application of immunophenotypic algorithm for
molecular subtype classification in diffuse large B-cell lymphoma:
A report from the International DLBCL Rituximab-CHOP Consortium
Program Study. Leukemia. 26:2103–2113. 2012. View Article : Google Scholar : PubMed/NCBI
|
|
19
|
Barrans SL, Crouch S, Care MA, Worrillow
L, Smith A, Patmore R, Westhead DR, Tooze R, Roman E and Jack AS:
Whole genome expression profiling based on paraffin embedded tissue
can be used to classify diffuse large B-cell lymphoma and predict
clinical outcome. Br J Haematol. 159:441–453. 2012. View Article : Google Scholar : PubMed/NCBI
|
|
20
|
Dubois S, Tesson B, Mareschal S, Viailly
PJ, Bohers E, Ruminy P, Etancelin P, Peyrouze P, Copie-Bergman C,
Fabiani B, et al: Refining diffuse large B-cell lymphoma subgroups
using integrated analysis of molecular profiles. EBioMedicine.
48:58–69. 2019. View Article : Google Scholar : PubMed/NCBI
|
|
21
|
Subramanian A, Tamayo P, Mootha VK,
Mukherjee S, Ebert BL, Gillette MA, Paulovich A, Pomeroy SL, Golub
TR, Lander ES and Mesirov JP: Gene set enrichment analysis: A
knowledge-based approach for interpreting genome-wide expression
profiles. Proc Natl Acad Sci USA. 102:15545–15550. 2005. View Article : Google Scholar : PubMed/NCBI
|
|
22
|
Hänzelmann S, Castelo R and Guinney J:
GSVA: Gene set variation analysis for microarray and RNA-seq data.
BMC Bioinformatics. 14:72013. View Article : Google Scholar : PubMed/NCBI
|
|
23
|
Liberzon A, Birger C, Thorvaldsdóttir H,
Ghandi M, Mesirov JP and Tamayo P: The Molecular Signatures
Database (MSigDB) hallmark gene set collection. Cell Syst.
1:417–425. 2015. View Article : Google Scholar : PubMed/NCBI
|
|
24
|
Johnson WE, Li C and Rabinovic A:
Adjusting batch effects in microarray expression data using
empirical Bayes methods. Biostatistics. 8:118–127. 2007. View Article : Google Scholar : PubMed/NCBI
|
|
25
|
Ritchie ME, Phipson B, Wu D, Hu Y, Law CW,
Shi W and Smyth GK: limma powers differential expression analyses
for RNA-sequencing and microarray studies. Nucleic Acids Res.
43:e472015. View Article : Google Scholar : PubMed/NCBI
|
|
26
|
Carbone PP, Kaplan HS, Musshoff K,
Smithers DW and Tubiana M: Report of the committee on Hodgkin's
disease staging classification. Cancer Res. 31:1860–1861.
1971.PubMed/NCBI
|
|
27
|
Oken MM, Creech RH, Tormey DC, Horton J,
Davis TE, McFadden ET and Carbone PP: Toxicity and response
criteria of the Eastern cooperative oncology group. Am J Clin
Oncol. 5:649–655. 1982. View Article : Google Scholar : PubMed/NCBI
|
|
28
|
Yoshihara K, Shahmoradgoli M, Martínez E,
Vegesna R, Kim H, Torres-Garcia W, Treviño V, Shen H, Laird PW,
Levine DA, et al: Inferring tumour purity and stromal and immune
cell admixture from expression data. Nat Commun. 4:26122013.
View Article : Google Scholar : PubMed/NCBI
|
|
29
|
Heagerty PJ, Lumley T and Pepe MS:
Time-dependent ROC curves for censored survival data and a
diagnostic marker. Biometrics. 56:337–344. 2000. View Article : Google Scholar : PubMed/NCBI
|
|
30
|
Collins GS, Reitsma JB, Altman DG and
Moons KG: Transparent reporting of a multivariable prediction model
for individual prognosis or diagnosis (TRIPOD): The TRIPOD
statement. Ann Intern Med. 162:55–63. 2015. View Article : Google Scholar : PubMed/NCBI
|
|
31
|
Neefjes J, Jongsma ML, Paul P and Bakke O:
Towards a systems understanding of MHC class I and MHC class II
antigen presentation. Nat Rev Immunol. 11:823–836. 2011. View Article : Google Scholar : PubMed/NCBI
|
|
32
|
Davis RE, Ngo VN, Lenz G, Tolar P, Young
RM, Romesser PB, Kohlhammer H, Lamy L, Zhao H, Yang Y, et al:
Chronic active B-cell-receptor signalling in diffuse large B-cell
lymphoma. Nature. 463:88–92. 2010. View Article : Google Scholar : PubMed/NCBI
|
|
33
|
Ngo VN, Young RM, Schmitz R, Jhavar S,
Xiao W, Lim KH, Kohlhammer H, Xu W, Yang Y, Zhao H, et al:
Oncogenically active MYD88 mutations in human lymphoma. Nature.
470:115–119. 2011. View Article : Google Scholar : PubMed/NCBI
|
|
34
|
Wilson WH, Young RM, Schmitz R, Yang Y,
Pittaluga S, Wright G, Lih CJ, Williams PM, Shaffer AL, Gerecitano
J, et al: Targeting B cell receptor signaling with ibrutinib in
diffuse large B cell lymphoma. Nat Med. 21:922–926. 2015.
View Article : Google Scholar : PubMed/NCBI
|
|
35
|
Wherry EJ: T cell exhaustion. Nat Immunol.
12:492–499. 2011. View Article : Google Scholar : PubMed/NCBI
|
|
36
|
Rooney MS, Shukla SA, Wu CJ, Getz G and
Hacohen N: Molecular and genetic properties of tumors associated
with local immune cytolytic activity. Cell. 160:48–61. 2015.
View Article : Google Scholar : PubMed/NCBI
|
|
37
|
Newman AM, Liu CL, Green MR, Gentles AJ,
Feng W, Xu Y, Hoang CD, Diehn M and Alizadeh AA: Robust enumeration
of cell subsets from tissue expression profiles. Nat Methods.
12:453–457. 2015. View Article : Google Scholar : PubMed/NCBI
|
|
38
|
Mariathasan S, Turley SJ, Nickles D,
Castiglioni A, Yuen K, Wang Y, Kadel EE III, Koeppen H, Astarita
JL, Cubas R, et al: TGFβ attenuates tumour response to PD-L1
blockade by contributing to exclusion of T cells. Nature.
554:544–548. 2018. View Article : Google Scholar : PubMed/NCBI
|
|
39
|
Chen DS and Mellman I: Oncology meets
immunology: The cancer-immunity cycle. Immunity. 39:1–10. 2013.
View Article : Google Scholar : PubMed/NCBI
|
|
40
|
DerSimonian R and Laird N: Meta-analysis
in clinical trials. Control Clin Trials. 7:177–188. 1986.
View Article : Google Scholar : PubMed/NCBI
|
|
41
|
Higgins JP, Thompson SG, Deeks JJ and
Altman DG: Measuring inconsistency in meta-analyses. BMJ.
327:557–560. 2003. View Article : Google Scholar : PubMed/NCBI
|
|
42
|
Harrell FE Jr, Lee KL and Mark DB:
Multivariable prognostic models: Issues in developing models,
evaluating assumptions and adequacy, and measuring and reducing
errors. Stat Med. 15:361–387. 1996. View Article : Google Scholar : PubMed/NCBI
|
|
43
|
Hanahan D and Weinberg RA: Hallmarks of
cancer: the next generation. Cell. 144:646–674. 2011. View Article : Google Scholar : PubMed/NCBI
|
|
44
|
Topalian SL, Drake CG and Pardoll DM:
Immune checkpoint blockade: A common denominator approach to cancer
therapy. Cancer Cell. 27:450–461. 2015. View Article : Google Scholar : PubMed/NCBI
|
|
45
|
Gao L and Gross DS: Using genomics and
proteomics to investigate mechanisms of transcriptional silencing
in Saccharomyces cerevisiae. Brief Funct Genomic Proteomic.
5:280–288a. 2006. View Article : Google Scholar : PubMed/NCBI
|
|
46
|
Pardoll DM: The blockade of immune
checkpoints in cancer immunotherapy. Nat Rev Cancer. 12:252–264.
2012. View Article : Google Scholar : PubMed/NCBI
|