Introduction
Gastric cancer is a markedly genetically
heterogeneous malignant tumor, which notably affects human life and
health. Among all cancer types, gastric cancer ranks fifth in both
incidence rate (4.9%) and mortality rate (6.8%) (1). It is reported that >95% of
pathological subtypes of gastric cancer are stomach adenocarcinoma
(STAD), and numerous patients with gastric cancer have local or
remote metastases when they are diagnosed (2). Although the level of early detection
and overall therapy continues to improve, the management of
progressive gastric cancer remains challenging (3). Its overall efficacy is still
unsatisfactory, and new treatments are needed (4).
Immunotherapy has improved the treatment of advanced
gastric cancer, but only some patients can benefit from this
therapy (5). The biggest challenge
with immunotherapy is the wide variation in patient efficacy
(6). Some tumor tissues are
tolerant or resistant to immunotherapy, leading to the new clinical
concepts of cold and hot tumors (7). Tumors characterized by a high density
of surrounding T cells and immune cells, which typically respond
well to immunotherapy, are classified as ‘hot’ tumors. By contrast,
‘cold’ tumors are characterized by sparse immune cell infiltration
and poor T cell abundance, and are generally resistant to
immunotherapy (8,9). The molecular targets currently used to
guide immunotherapy are mainly limited to programmed death ligand-1
(PD-L1) expression levels, microsatellite instability-high and
tumor mutational burden (10).
These molecular targets, despite some progress, remain
controversial (11). STAD tissue
stroma is infiltrated by a large number of T lymphocytes, which
means that the occurrence of STAD may be more closely related to
the tumor microenvironment (TME) (12). Therefore, there is a need to screen
for more molecular markers through the comprehensive analysis of
the TME to differentiate hot and cold tumors to guide STAD
precision immunotherapy.
Cellular senescence is the entry of cells into a
state of irreversible proliferative arrest and a specific state of
tumor suppression (13). As with
other cellular life activities, the onset and progression of
cellular senescence are regulated in a sophisticated manner
(14). Although the specific
mechanisms regulating cellular senescence are not clear, several
bioactive substances and their constituent signaling pathways are
recognized to participate in the induction, maintenance and
termination of senescence, such as p53, p21, p16, p38 and p27
(15). Long non-coding RNAs
(lncRNAs) perform numerous functions in life activities, including
epigenetics, cell cycle and cellular differentiation (16). LncRNAs are involved in almost all
types of diseases, among which the most studied are tumorigenic
diseases (17). There is an
inextricable link between tumors and senescence (18). Cellular senescence serves a dual
role in tumor initiation and progression, acting as either a tumor
suppressor or a driver of malignant transformation. Previous
studies have shown that certain lncRNAs have been found to appear
specifically in senescent cells, interacting with genes or proteins
and participating in the regulatory mechanisms of senescence as a
node on the senescence signaling pathway (19,20).
LncRNA OVAAL, which is notably expressed in ovarian cancer cells,
binds PTBP1 competitively with p27 mRNA and inhibits p27
expression, thereby circumventing tumor cell senescence (21). In breast cancer cells, lncRNA PANDAR
can regulate the cell cycle G1/S transition by recruiting Bmi1 to
the p16 promoter region (22).
Recent studies have elucidated that senescence-related lncRNAs
(SenRLs) may be utilized as prognostic markers for a variety of
cancers, including ovarian cancer (23), colon cancer (24) and head and neck squamous cell
carcinoma (25).
A limitation of prior studies is that they have not
validated the capacity of corresponding signatures to discriminate
immune phenotypes linked to immunotherapeutic benefit. How to
precisely identify patients who may derive clinical benefit from
such treatments and establish a reliable prognostic stratification
system for STAD remains an urgent clinical issue. In the present
study, the involvement of SenRLs in STAD prognosis and tumor immune
infiltration was investigated using bioinformatic analyses.
Notably, the ability of SenRLs to distinguish hot and cold tumor
phenotypes was further evaluated, with the ultimate aim of
providing a novel reference indicator for precise STAD
immunotherapy by identifying immune phenotypes associated with
immunotherapy responsiveness. To the best of our knowledge, the
signature established in the present study represents the first
lncRNA-based prognostic signature in STAD that simultaneously
incorporates SenRLs and hot/cold tumor classification.
Materials and methods
Datasets and preprocessing
RNA-sequencing (RNA seq) datasets, metadata and
clinical information for 375 STAD samples and 32 control samples
were obtained from The Cancer Genome Atlas (TCGA) database
(https://portal.gdc.cancer.gov/). The
RNA-seq dataset and metadata files were processed using the Perl
script (version 1.7.8) (https://bioperl.org/) to obtain the gene expression
matrix, followed by ID transformation to obtain the corresponding
gene names. STAD samples with indeterminate clinical stages and
survival time <30 days were excluded.
Obtaining SenRLs
Human senescence genes were obtained from the Human
Ageing Genomic Resources database (https://genomics.senescence.info/) (Table SI). To create the senescent gene
expression matrix file, the limma R package (version 3.56.0)
(https://bioconductor.org/packages/release/bioc/html/limma.html)
was used to determine the intersection of senescent genes with the
gene expression matrix. Pearson correlation analysis was applied to
analyze the co-expression of lncRNAs and senescence-related genes.
The expression of lncRNAs and senescence-related genes was defined
as function variables, and the correlation between them was tested
to obtain correlation coefficients and P-values. The SenRLs were
extracted with |Correlation Coefficient|>0.4 as well as
P<0.001 (26). Cytoscape
(version 3.6.1) (https://cytoscape.org/) was used to visualize the
coexpression network.
SenRLs survival data acquisition
The sample name, survival time and survival status
were the only information kept in the clinical data of STAD cases
that were obtained from the TCGA database. The survival times were
sorted in ascending order to remove samples with unclear survival
times. Next, survival status was sorted in ascending order, and
samples with unclear survival status were deleted. The processed
survival information was merged with the SenRLs expression data to
produce SenRLs survival data for STAD for subsequent analysis.
Identification and verification of
risk models
Using R software packages (version 4.3.1; RStudio,
Inc.), patients within the SenRLs survival data file were split
into training and test sets at random. Univariate Cox regression
was performed to screen STAD prognostic SenRLs based on P<0.05.
Kaplan-Meier analyses were also conducted requiring KM <0.05 and
plotted forest plots using the survival (version 3.4–0; http://cran.r-project.org/package=survival) and
survminer (version 0.4.9; http://cran.r-project.org/package=survminer) R
packages. Next, these SenRLs were further included in a
multivariate Cox regression to get the key lncRNAs applied to
create the prognostic risk model and to get the regression
coefficients. Risk scores were calculated utilizing the regression
coefficients and expression values of SenRLs. The median risk score
was used to divide patients into different risk groups. The Sankey
diagrams were made using the R tool ggalluvial (version 0.12.5)
(https://cran.r-project.org/package=ggalluvial).
Survival analysis was then carried out using the survminer (version
0.4.9; http://cran.r-project.org/package=survminer) R
package. To examine the survival disparities between the two
groups, Kaplan-Meier survival curves were charted. Receiver
operating characteristic (ROC) curves were produced using timeROC
(version 0.4; http://cran.r-project.org/package=timeROC), and area
under the curve (AUC) values were calculated to compare the role of
different factors in predicting outcomes. Scatterplot3D (version
0.3–44; http://cran.r-project.org/package=scatterplot3d)
R package was applied to create principal component analysis (PCA)
plots. Univariate and multivariate Cox regression analyses were
carried out on risk value as well as clinicopathological
information to clarify whether risk values were independent
prognostic indicators.
Nomogram and gene set enrichment
analysis (GSEA)
With the rms (version 6.7–1; http://cran.r-project.org/package=rms) R package, a
clinically useful nomogram was developed and validated. Calibration
curves were applied to demonstrate the predictive power of the
nomogram. To further investigate the biological functions and
pathways associated with the prognostic SenRLs signature, Gene
Ontology (GO) and Kyoto Encyclopedia of Genes and Genomes (KEGG)
enrichment analyses were performed using the GSEA software (version
4.1.0; http://www.gsea-msigdb.org/gsea/index.jsp). The
analysis was conducted with the following parameters: the
phenotypic file was set to h_vs._1, the permutation type was
adjusted to phenotype, the number of simulations was fixed to 1,000
and the plot graphs for the top sets of each phenotype were set to
5. Significantly enriched pathways were identified based on a
nominal P-value <0.05 and a false discovery rate (FDR)
<0.25.
Reverse transcription-quantitative PCR
(RT-qPCR) assay of tissue specimens
STAD tissue specimens and paired paraneoplastic
tissue specimens were acquired from 15 patients treated at Xingtai
People's Hospital (Xingtai, China) and identified as STAD by
postoperative pathology between March 2025 and September 2025. All
included STAD cases were exclusively identified as the intestinal
type according to Lauren's classification (1965) (27), with pathological diagnoses
established in accordance with the WHO Classification of Tumours of
the Digestive System (28). To
ensure diagnostic accuracy, the histological subtyping and final
diagnosis were independently reviewed and confirmed by two senior
pathologists from Xingtai People's Hospital. The patients with STAD
included 8 males and 7 females, aged 41 to 68 years. All patients
were strictly screened, with no history of other malignant tumors
and no prior radiotherapy, chemotherapy, targeted therapy or
immunotherapy. The Xingtai People's Hospital Ethics Committee
approved the study (approval no. 2025-048). Written informed
consent was voluntarily obtained from each patient or their
authorized family member. The present study was conducted in
accordance with The Declaration of Helsinki. Tissue samples were
collected immediately after the operation, quickly frozen with
liquid nitrogen and then carefully transported and kept in a
refrigerator at −80°C.
Total RNA was extracted using TRIzol®
reagent (Invitrogen; Thermo Fisher Scientific, Inc.) according to
the manufacturer's protocol. First-strand cDNA was synthesized
using the Takara PrimeScript RT Kit (Takara Bio, Inc.) following
the manufacturer's instructions. RT-qPCR detection employed the
SYBR Premix Ex Taq™ Kit (Takara Bio, Inc.), strictly
adhering to the manufacturer's operating procedures. The primers
used in this procedure were synthesized by Sangon Biotechnology
Co., Ltd., and Table I lists the
primer sequences. The following are the thermal cycling conditions
employed for qPCR: An initial denaturation step at 95°C for 5 min;
followed by 40 cycles, each consisting of 5 sec denaturation at
95°C, 30 sec annealing at 60°C and 30 sec extension at 72°C;
concluding with a final extension step at 72°C for 2 min. The
relative amounts of genes were analyzed by 2−∆∆Cq
(29) with GAPDH and ACTB as
internal reference. A paired t-test was employed to compare the
expression levels of these SenRLs between STAD tissues and paired
paracancerous tissues.
 | Table I.Reverse transcription-quantitative
PCR primer details. |
Table I.
Reverse transcription-quantitative
PCR primer details.
| Primer | Sequence | Tm, °C | Product size,
bp |
|---|
| AL139147.1-F |
CTCTACCAATGTGATGCGAATGA | 59.40 | 193 |
| AL139147.1-R |
GGCTCTCTGTTTGTCTGTTATTTGT | 60.30 |
|
| LINC02057-F |
TAAGGCAGGCTTCGGAAATGAG | 61.21 | 129 |
| LINC02057-R |
GTGAATGATGTCCAGCTTTTTGGTC | 61.62 |
|
| AL353804.2-F |
GGAATAATGTGAAAACACTTGAGCA | 59.08 | 177 |
| AL353804.2-R |
CTCTAATAGTAAGAAAACTGAGTCCTG | 57.73 |
|
| AC005363.2-F |
CATTTGTAGCCAGCGTTTACTCCT | 60.73 | 134 |
| AC005363.2-R |
TTATTTATCAAGAGCCACACTGCGA | 60.86 |
|
| AC093801.1-F |
AAGCTCCCTACAGCATCCAC | 59.46 | 102 |
| AC093801.1-R |
GCCACACATTGTCTCATGTTCATAC | 60.67 |
|
| ACTB-F |
CAGTCGGTTGGAGCGAGCAT | 62.84 | 135 |
| ACTB-R |
TGGCTTTTAGGATGGCAAGGGAC | 63.03 |
|
| GAPDH-F |
AACAGCCTCAAGATCATCAGCAA | 61.16 | 104 |
| GAPDH-R |
GTCATGAGTCCTTCCACGATACC | 61.08 |
|
Immune cell infiltration and drug
sensitivity analysis
The immune infiltration landscape of each STAD
sample was quantified utilizing CIBERSORT (version 1.03)
(https://cibersort.stanford.edu/). For
immune cell analysis and visualization using bubble plots the
following were utilized: XCELL, TIMER, QUANTISEQ, MCPCOUNTER, EPIC,
CIBERSORT-ABS and CIBERSORT on TIMER2.0 (http://timer.cistrome.org/). Following this, the
limma, ggplot2 (version 3.4.2) (https://ggplot2.tidyverse.org), ggpubr (version 0.6.0;
http://rpkgs.datanovia.com/ggpubr/)
and ggextra (version 0.10.1; http://github.com/daattali/ggExtra) R packages were
utilized to determine the association between the immune
infiltration and the model. According to the Genomics of Drug
Sensitivity in Cancer (https://www.cancerrxgene.org/), the half-maximal
inhibitory concentration (IC50) differences across groups were
compared, and the results are presented as box plots.
Cluster analysis based on SenRLs
Using the ConsensusClusterPlus (version 1.66.0;
http://bioconductor.org/packages/ConsensusClusterPlus/)
in R software, consensus clustering was carried out utilizing the
expression of key prognostic SenRLs. The pheatmap (version 1.0.12;
http://cran.r-project.org/package=pheatmap) R package
was used to build heatmaps for clustering. PCA and t-distributed
stochastic neighbor embedding (t-SNE) analysis were carried out
using the Rtsne (version 0.16; http://cran.r-project.org/package=Rtsne) R package.
Utilizing the survival (version 3.5–7; http://cran.r-project.org/package=survival) and
survminer R packages, survival analysis was performed for clusters,
and survival curves were plotted. Utilizing single sample GSEA with
the GSVA (version 1.48.3; http://bioconductor.org/packages/GSVA/) R package,
enrichment scores of immunological pathways were calculated. The
TME of the two clusters was scored and compared using the estimate
(version 1.8.2; http://bioconductor.org/packages/estimate/), limma and
BiocManager (version 1.30.22; http://cran.r-project.org/package=BiocManager) R
packages. Immunocheckpoint gene analysis was performed for both
clusters using ggplot2 and ggpubr R packages.
Multi-model machine learning
validation and Shapley additive exPlanations (SHAP) analysis
To further validate the reliability and
interpretability of the established prognostic SenRLs signature,
multi-model machine learning and SHAP analysis were performed. A
total of four distinct classification models were constructed:
Random Forest (RF), Gradient Boosting Machine (GBM), Support Vector
Machine (SVM) and K-Nearest Neighbors (KNN). Subsequently, SHAP
analysis was conducted using the SHAP Python package (version
0.44.0; http://github.com/slundberg/shap).
Statistical analysis
Survival analyses utilizing the Kaplan-Meier method
were performed for different groups or clusters. A weighted test
(Renyi test) was used to compare the survival differences between
the high and low lncRNAs expression groups. Clinical information
was analyzed through GraphPad Prism (version 8.0; Dotmatics) using
the χ2 test. Statistical analysis was performed
utilizing R software (version 4.3.1; RStudio, Inc.). P<0.05 was
considered to indicate a statistically significant difference.
Results
STAD prognostic SenRLs screening
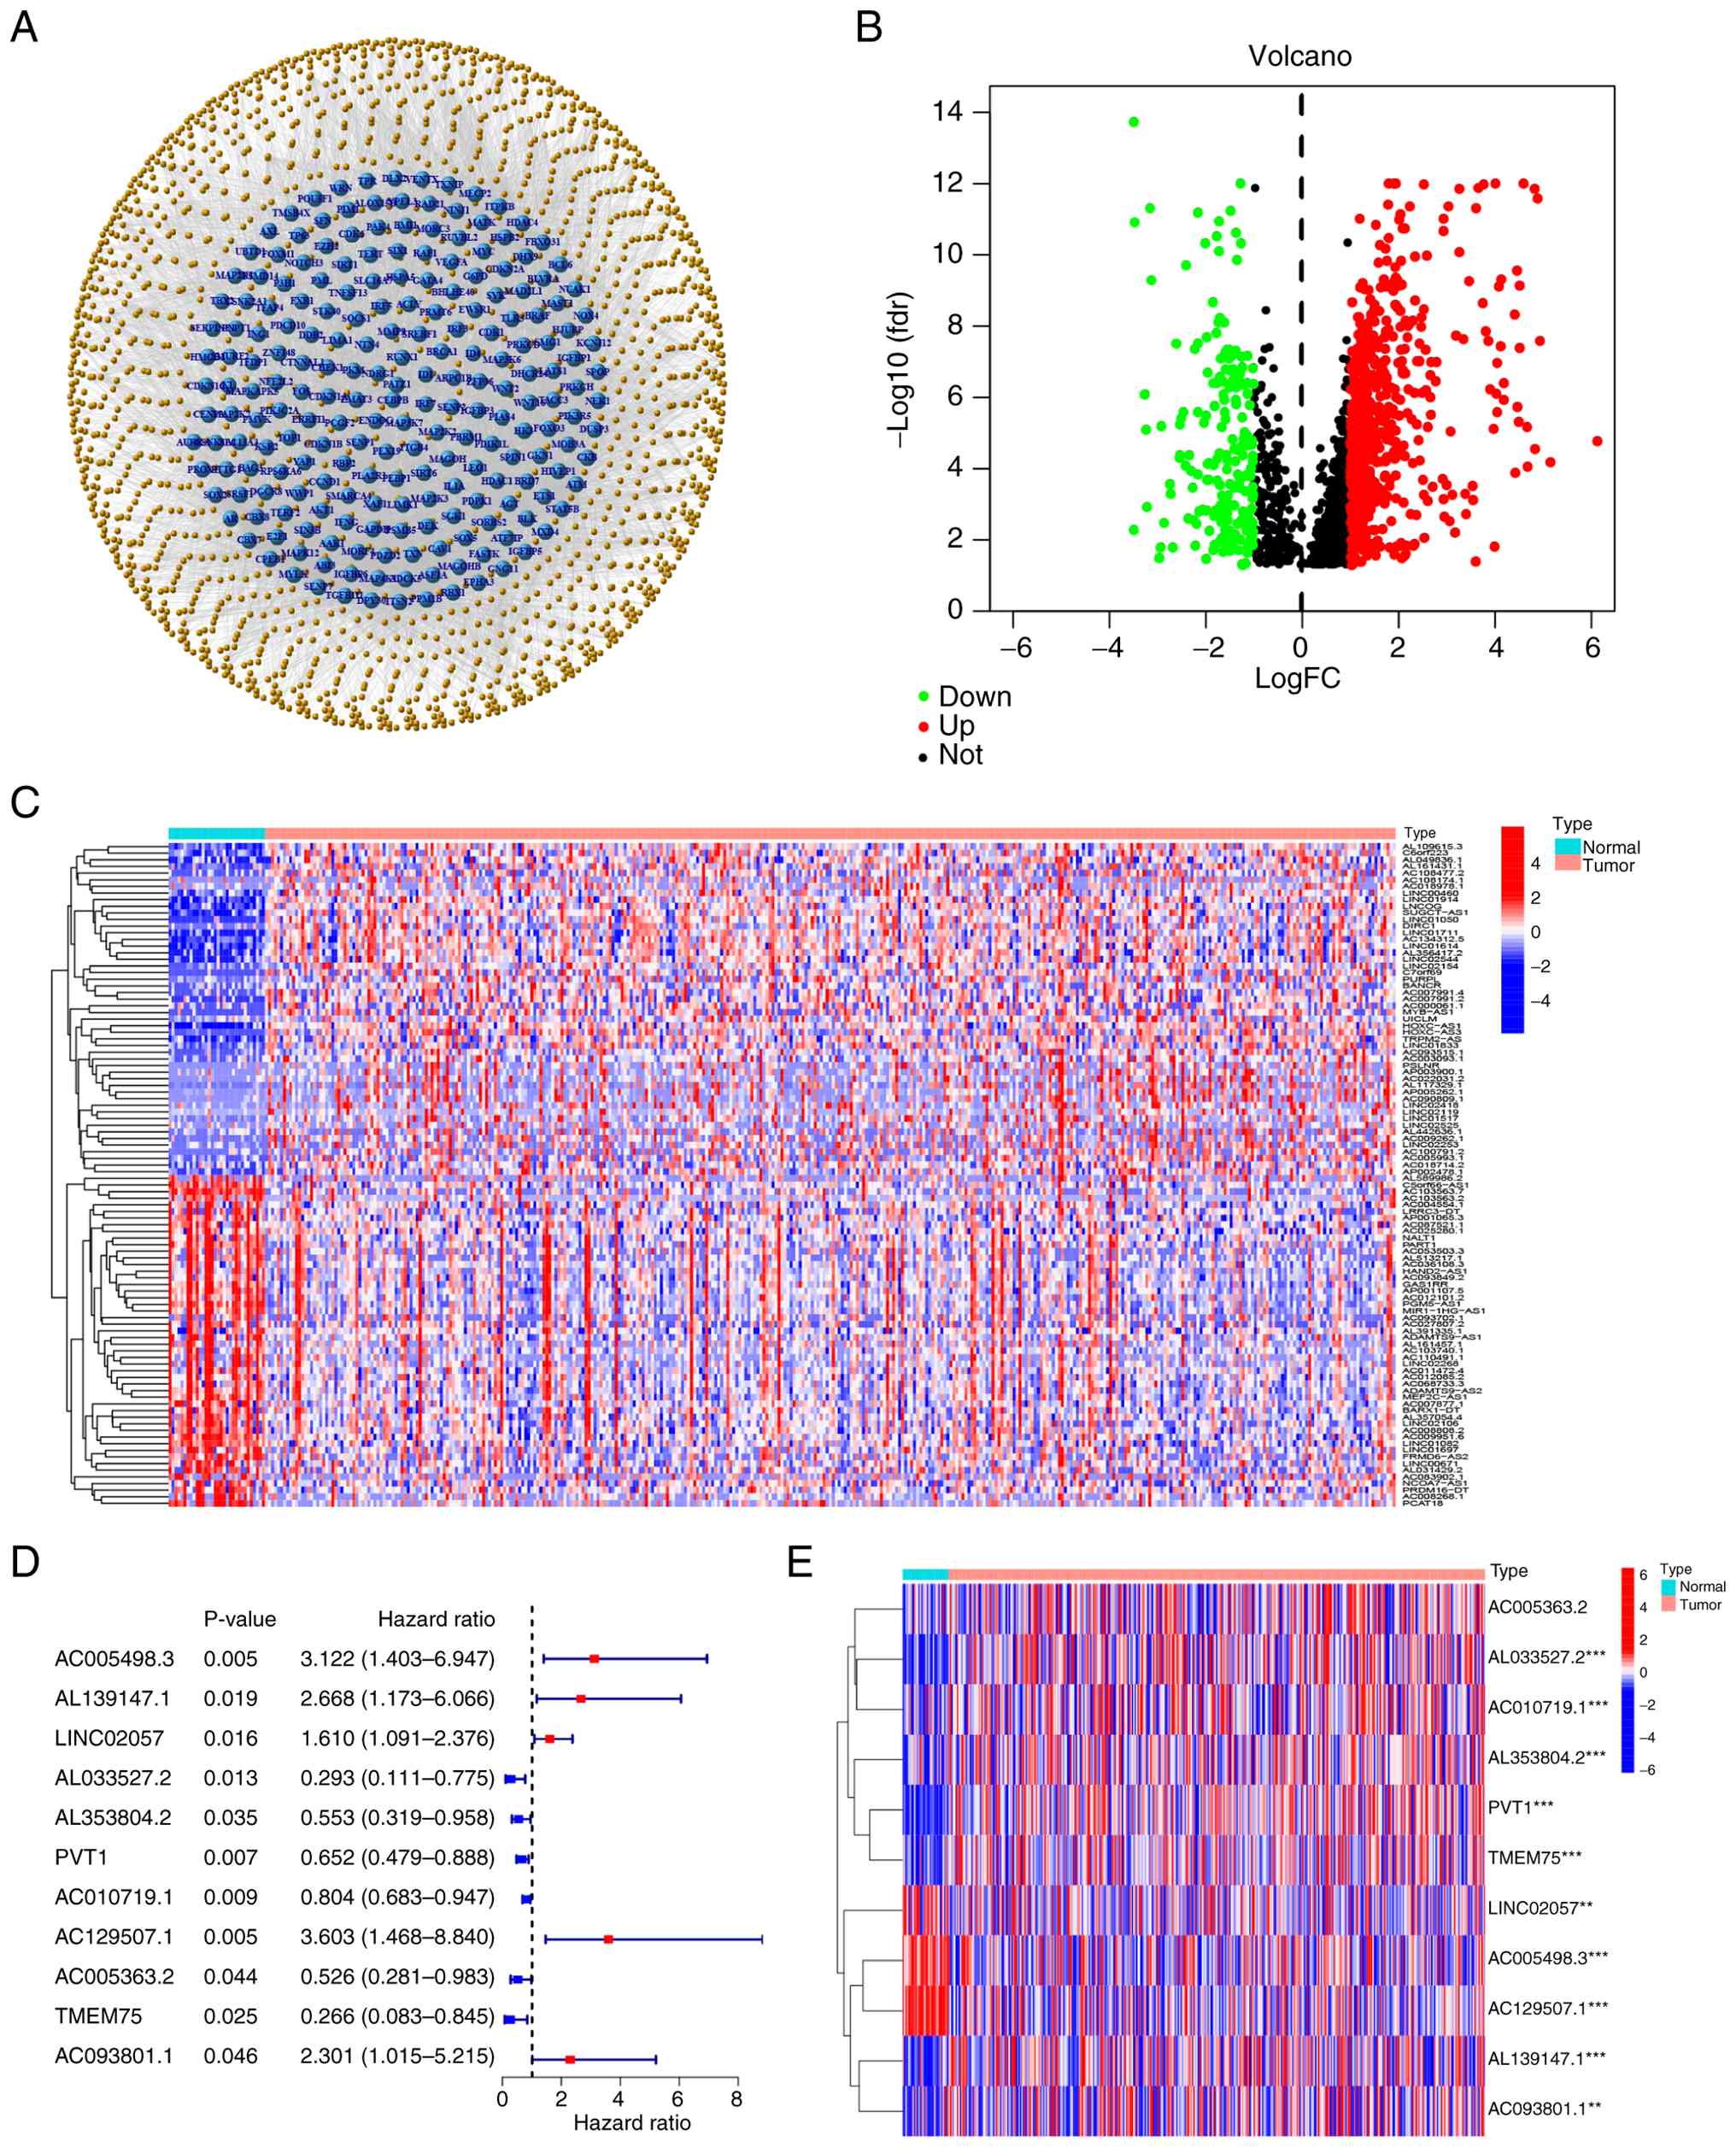
Co-expression analysis among cellular
senescence-associated genes and lncRNAs revealed 1,619 SenRLs,
visualized as a network (Fig. 1A).
The expression differences of SenRLs in STAD and normal samples
were examined [|log2 fold change|>1 and false discovery rate
(FDR)<0.05]. The findings demonstrated that there were
variations in the expression levels of 789 SenRLs, with 192 lncRNAs
exhibiting low expression and 597 lncRNAs exhibiting high
expression. The results were visualized with a volcano plot
(Fig. 1B). Heatmaps were
constructed to demonstrate the expression density of 100 of these
SenRLs (Fig. 1C). The survival of
patients with STAD was notably correlated with 11 SenRLs, according
to univariate Cox regressions and Kaplan-Meier analysis (P<0.05;
KM<0.05; Table SII). A total of
six of these were protective lncRNAs [hazard ratio (HR)<1], and
the other five were risk-related lncRNAs (HR>1) (Fig. 1D). Heatmaps were used to display the
expression of 11 SenRLs in patients with STAD and normal samples
(Fig. 1E).
Development and assessment of STAD
prognostic models
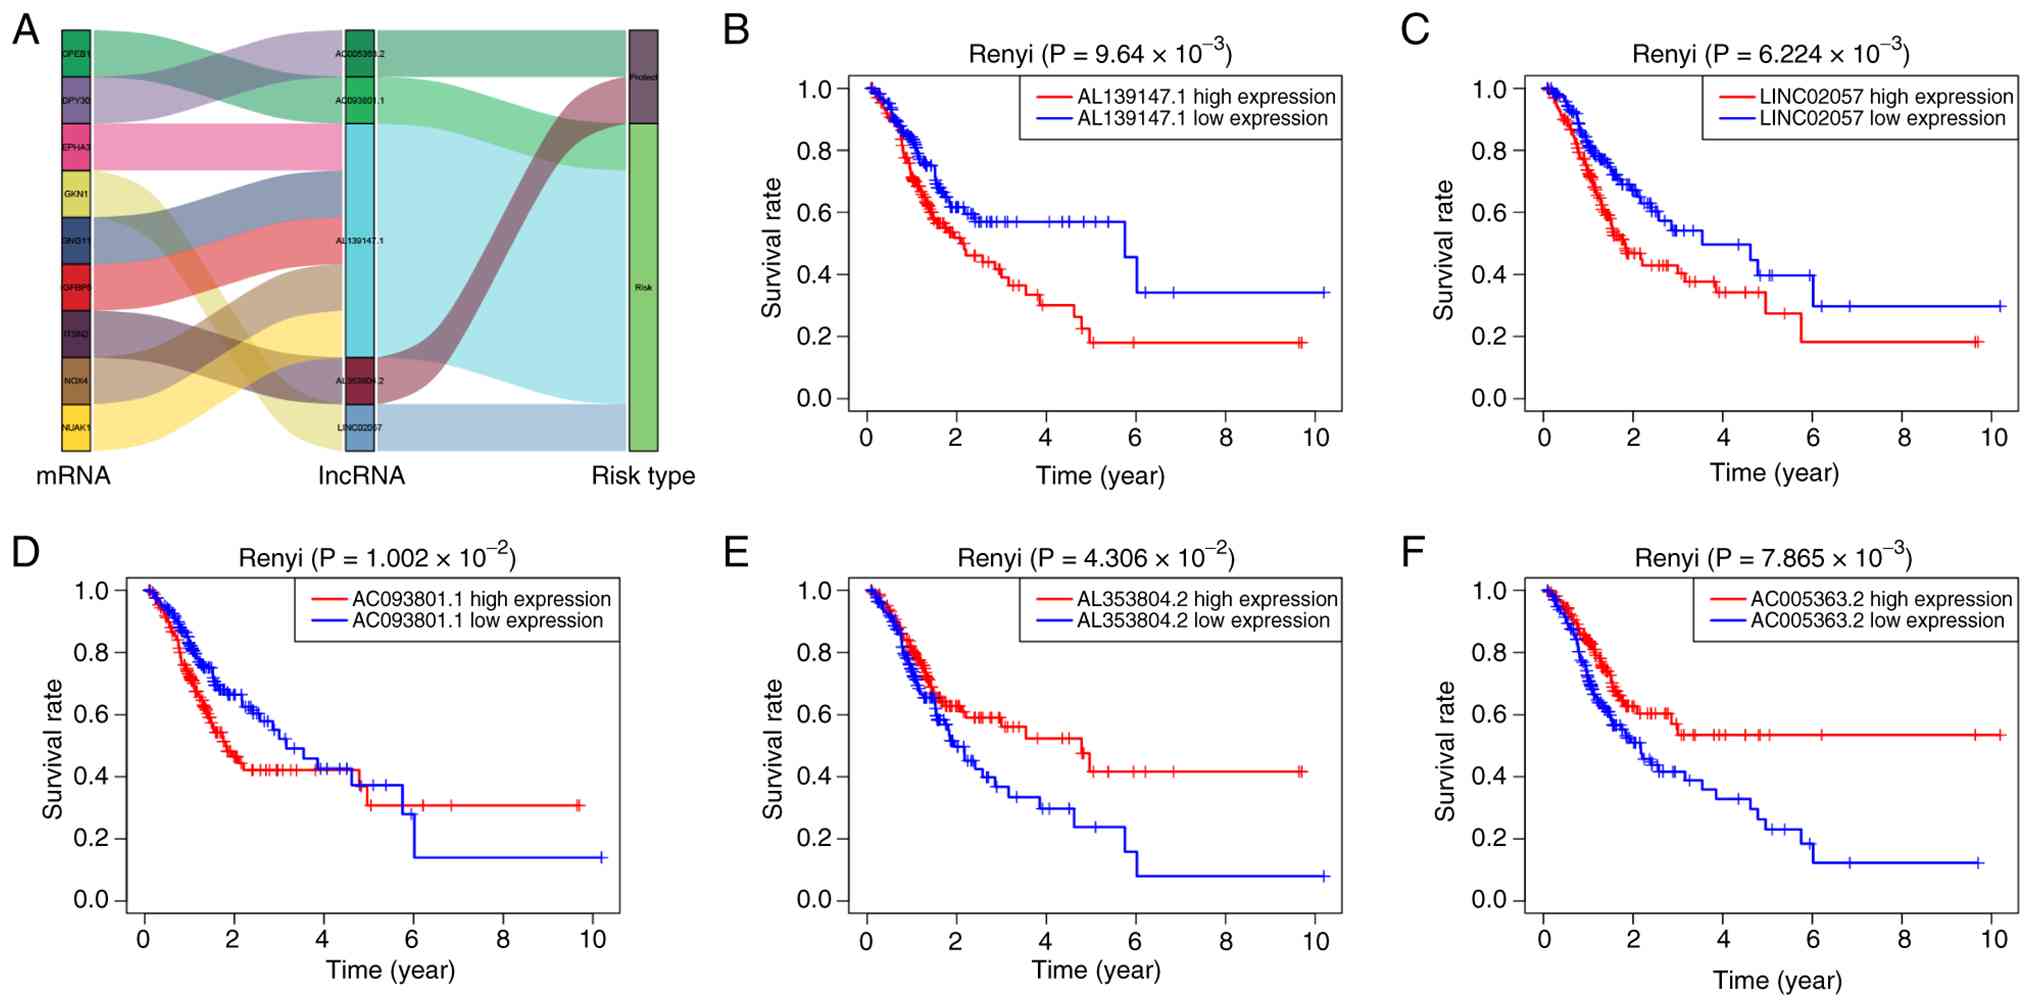
A total of five key prognostic SenRLs (AL139147.1,
LINC02057, AC093801.1, AL353804.2 and AC005363.2) were screened by
multivariate Cox regression analysis (P<0.05; Table SIII). AL353804.2 and AC005363.2
were protective lncRNAs, and the remaining three were risk-related
lncRNAs (Fig. 2A). Kaplan-Meier
survival curves were plotted, utilizing the expression of each of
these five lncRNAs. The Renyi test was employed to compare survival
differences between high- and low-expression groups, given its
robustness in handling survival curve crossovers. The high
expression group of AL139147.1, LINC02057 and AC093801.1 showed
poorer overall survival (OS) (P<0.05), as demonstrated in
Fig. 2B-D. The AL353804.2 and
AC005363.2 high-expression groups had a prolonged survival time
(P<0.05; Fig. 2E and F).
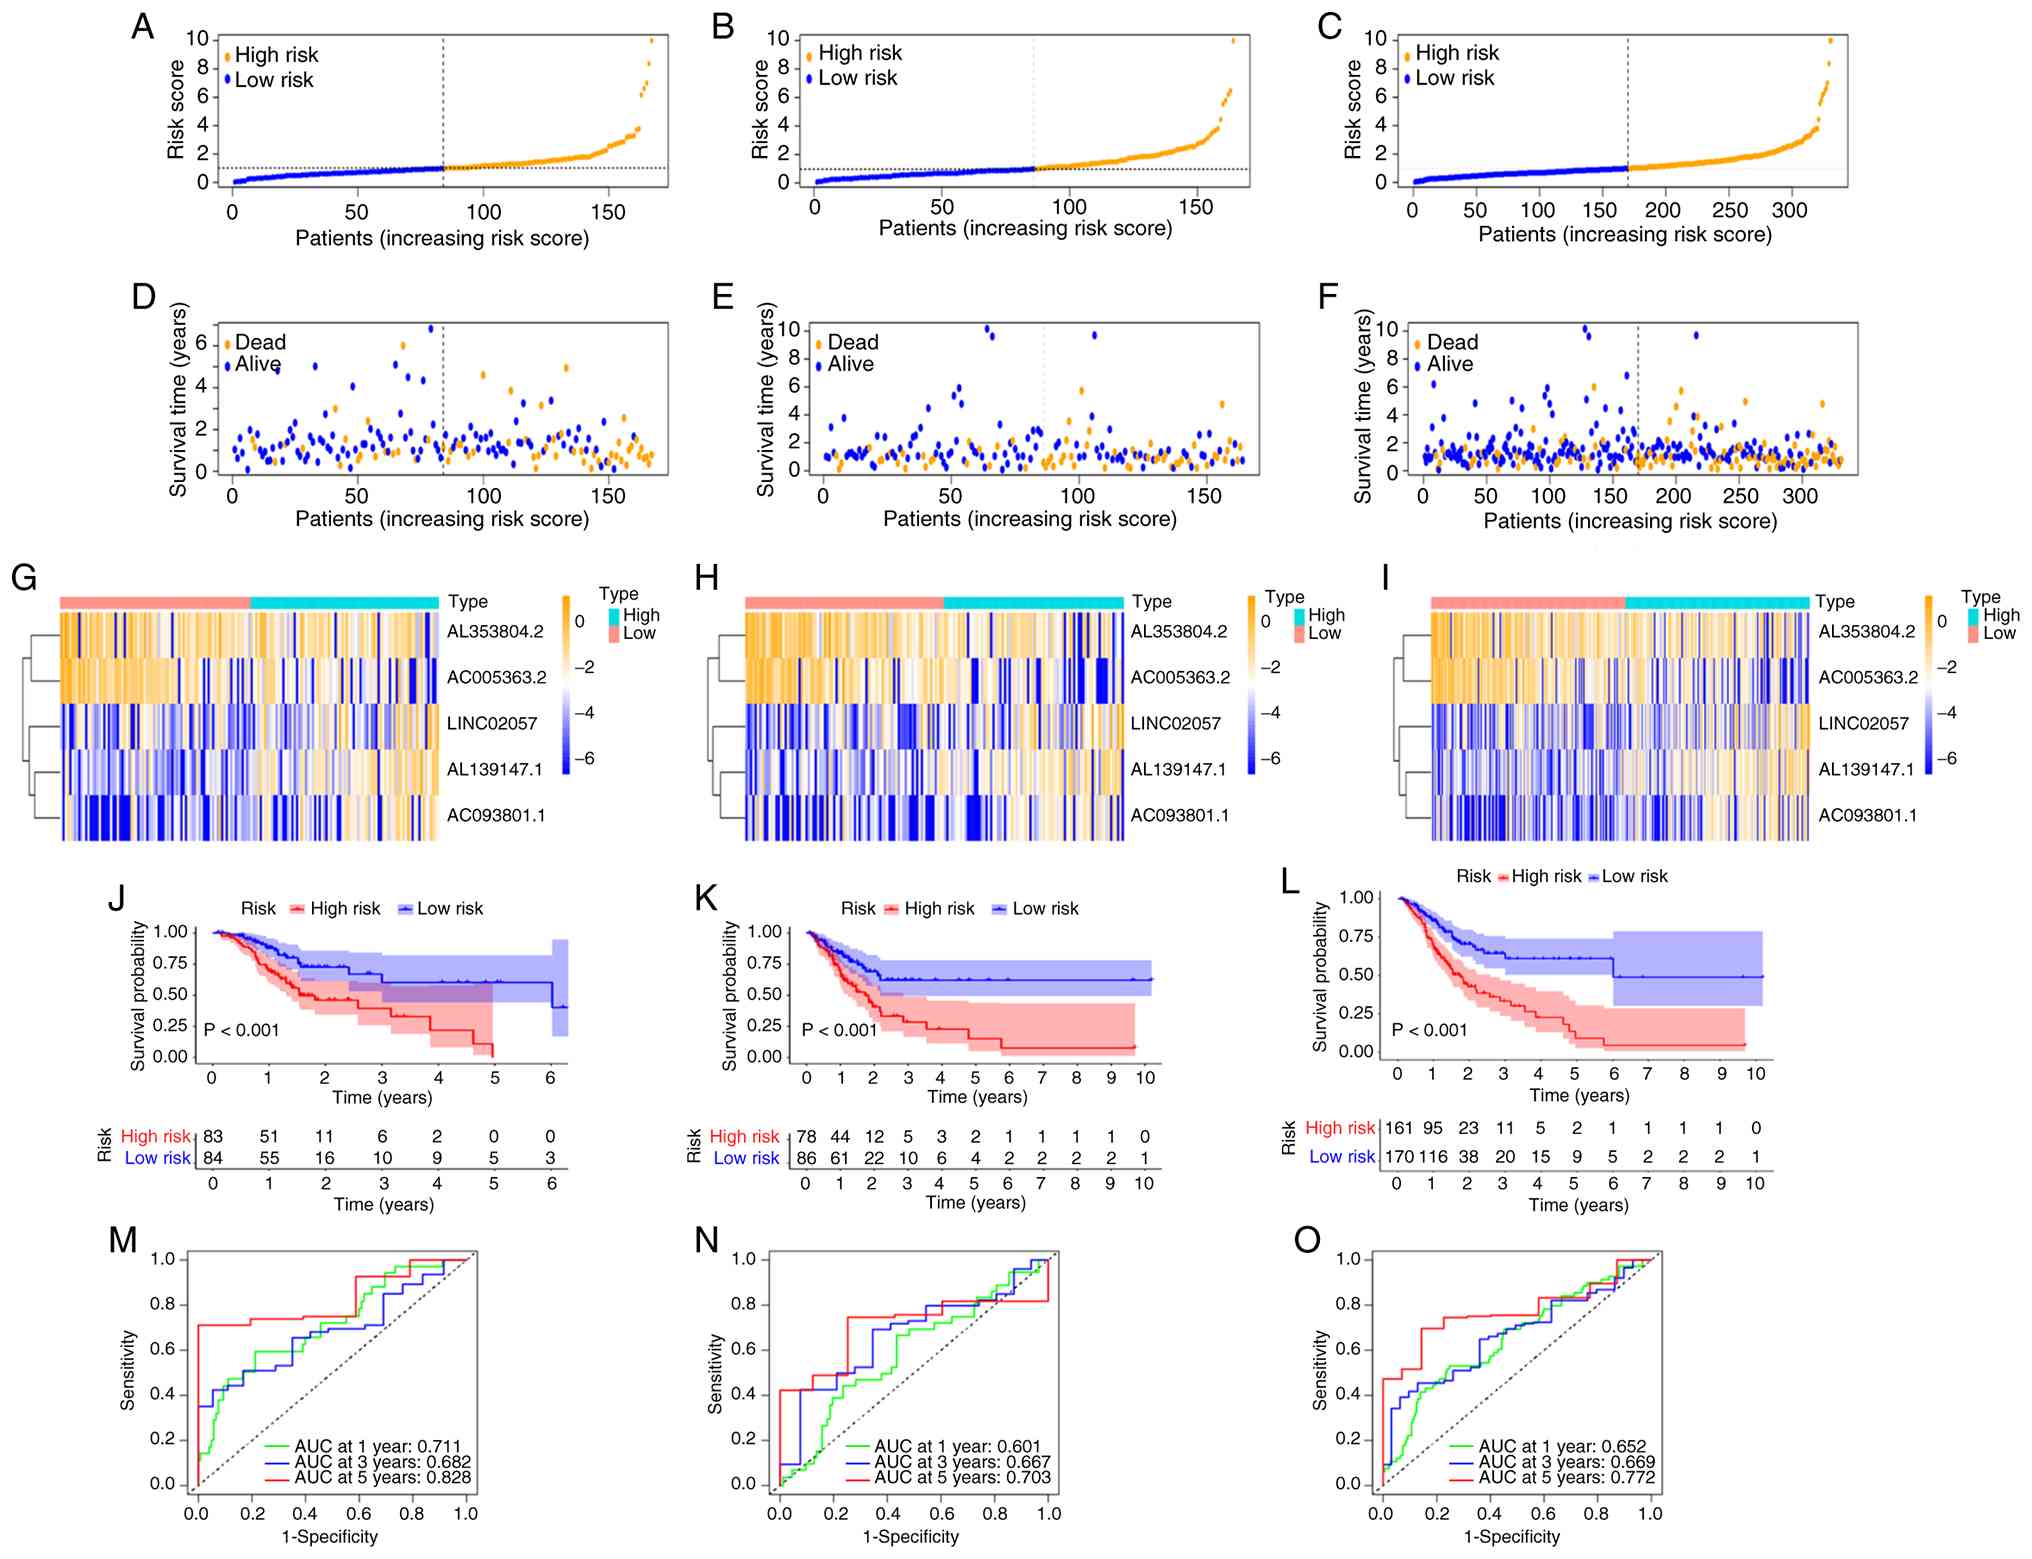
Based on these five lncRNAs, the prognostic SenRLs
signature was established. Risk score=(coef 1.81069714813647 × expr
AL139147.1) + (coef 0.950768101588694 × expr LINC02057) + (coef
1.17094750602435 × expr AC093801.1) + (coef-1.06513974991373 × expr
AL353804.2) + (coef-1.25744132430942 × expr AC005363.2). coef
denotes the regression coefficient derived from multivariate Cox
regression analysis, and expr indicates the expression level of
each SenRL. The allocation of risk score distribution, survival
status and expression of the five lncRNAs were determined in the
two groups of patients from the TCGA dataset (Fig. 3A-I). The results indicate that the
risk score determines the prognosis of STAD, and patients with
high-risk values had worse survival status. In the high-risk group,
the expression of LINC02057, AL139147.1 and AC093801.1 was notably
greater, while the expression of AC005363.2 and AL353804.2 was
decreased. Kaplan-Meier survival analysis was performed in the
present study for the training set, test set and whole set,
respectively (Fig. 3J-L). The
results all displayed that the OS of patients in the high-risk
group was significantly lower (P<0.05). For the training set,
test set and whole set, the 5-year AUC values were 0.828, 0.703 and
0.772, respectively (Fig. 3M-O).
The 5-year ROC of the SenRLs signature had notable predictive
efficacy.
Verification of the SenRLs
signature
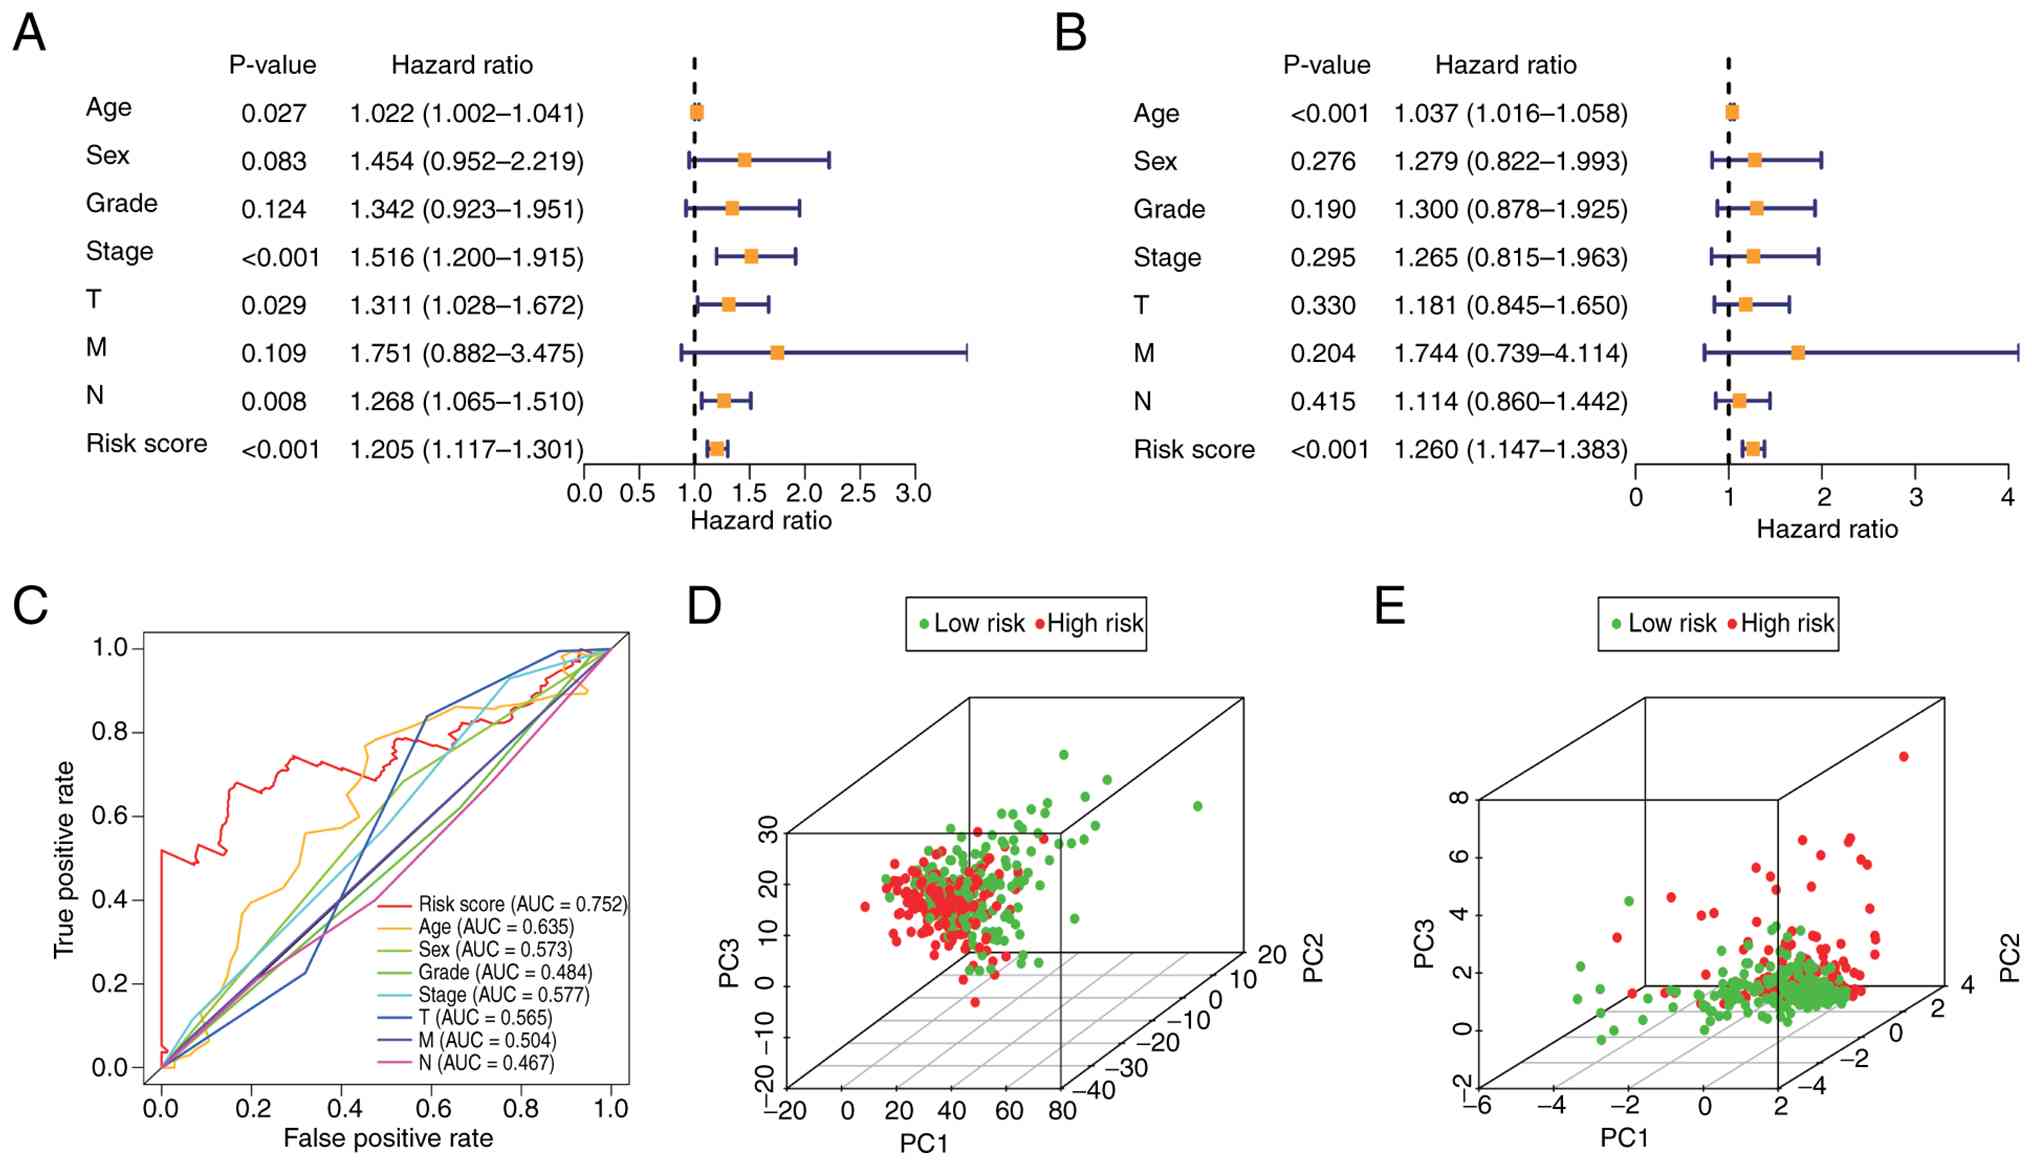
As demonstrated in the univariate Cox regression
analysis (Fig. 4A), the risk score
was significantly associated with patient prognosis (P<0.001).
Furthermore, the multivariate Cox regression analysis (Fig. 4B), which adjusted for other clinical
covariates, confirmed that the risk score remained a significant
prognostic indicator (P<0.001). These results suggest that the
SenRLs signature is an independent factor affecting patient
prognosis. The AUC of the risk score was 0.752, which was greater
than that of the other medical factors (Fig. 4C), indicating the notable accuracy
of the model. Next, PCA was performed based on all the SenRLs
identified via univariate Cox regression and the 5 key prognostic
SenRLs, respectively. As shown in Fig.
4D, all the SenRLs could not effectively discriminate between
the high and low-risk groups; however, based on the key prognostic
SenRLs signature, there was a significant distribution distinction
between the two groups (Fig. 4E);
therefore, the PCA findings further support the accuracy of the
model.
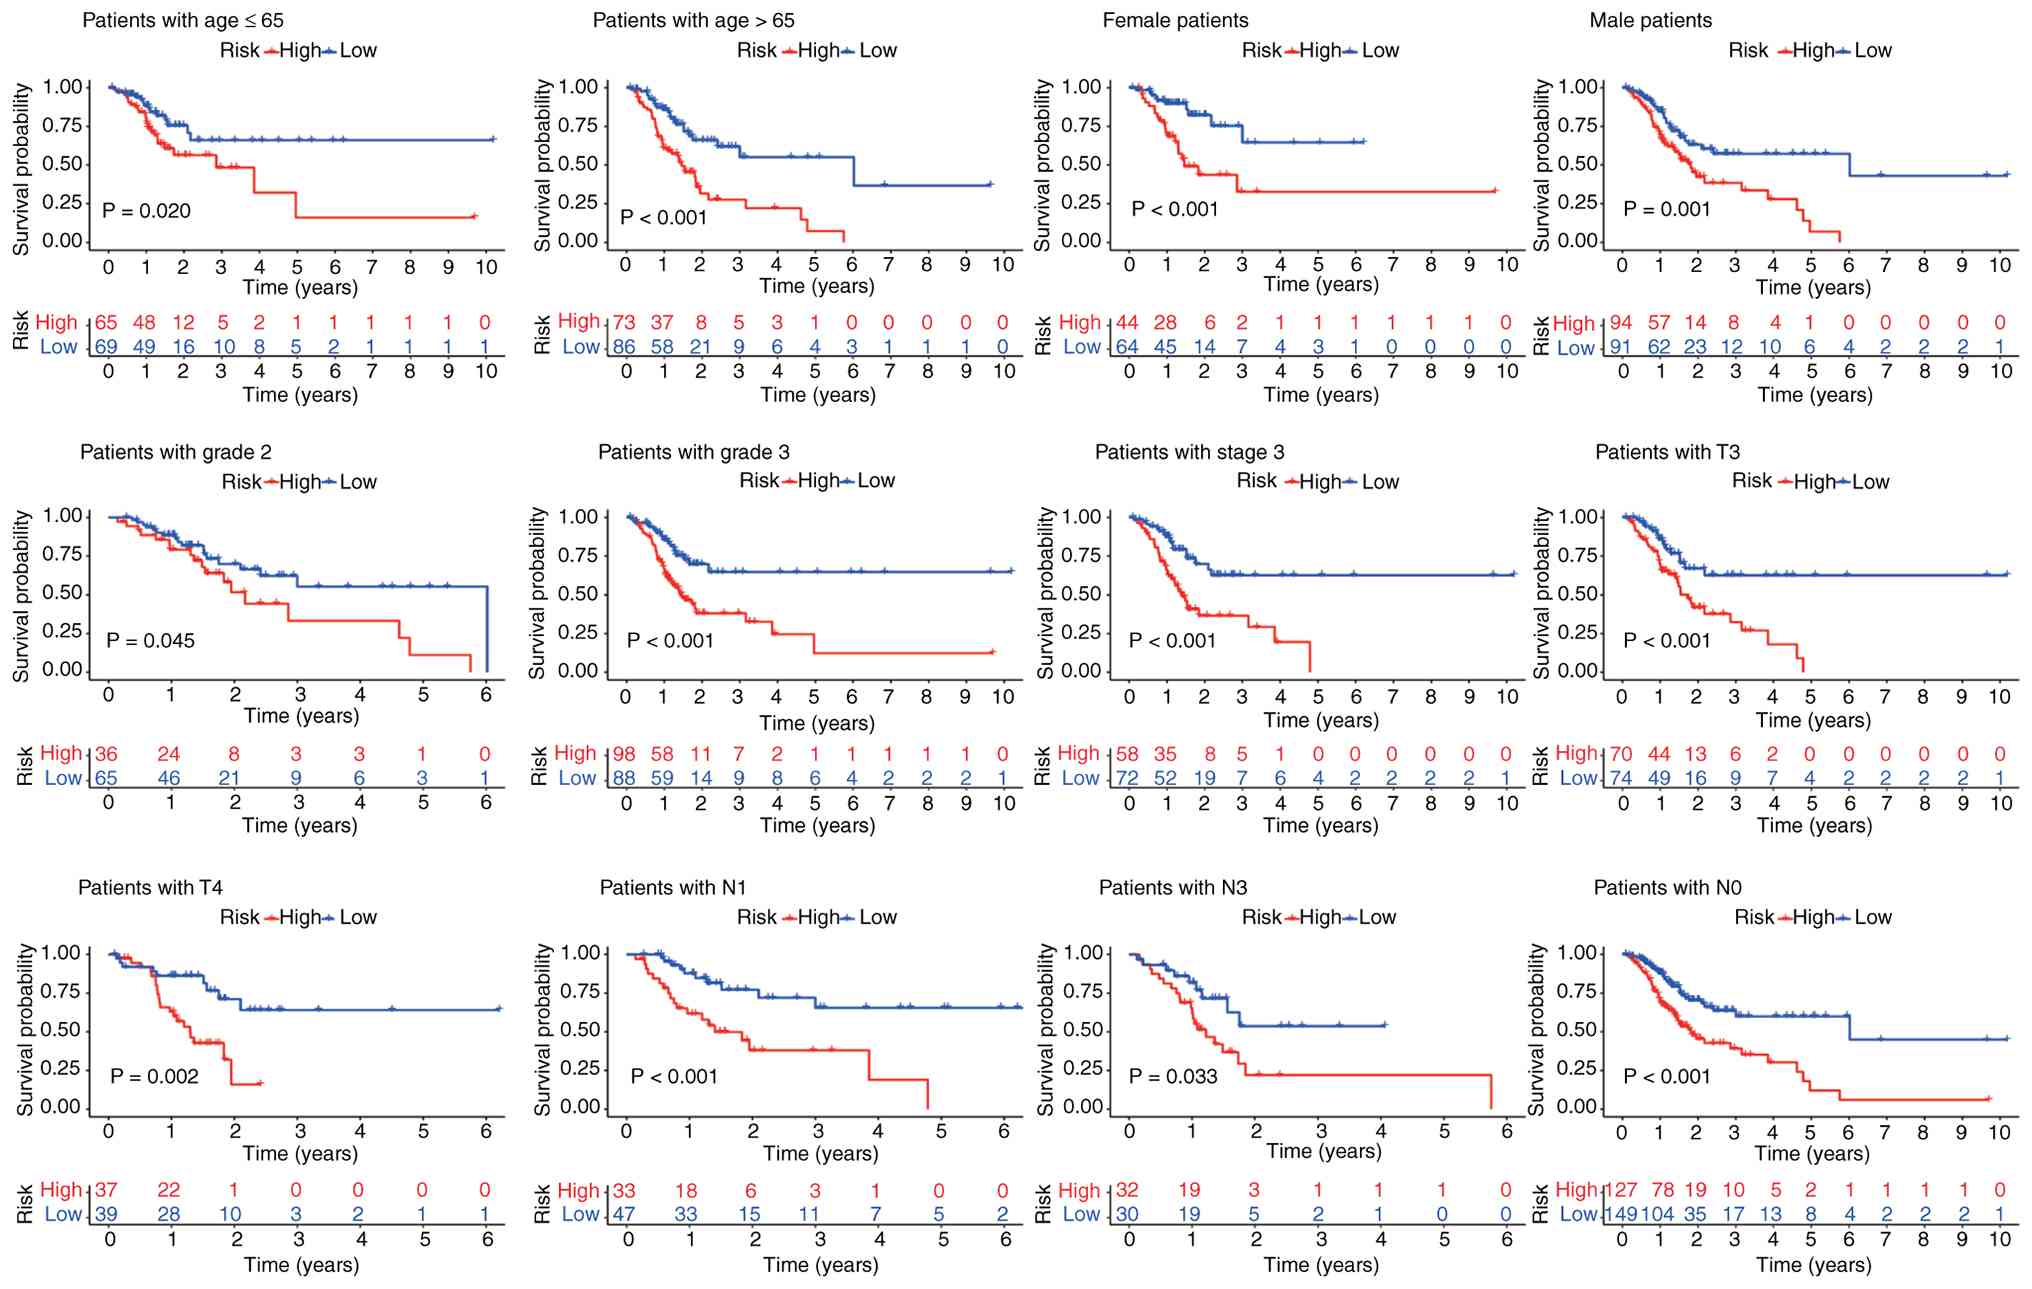
Relationship between SenRLs signature
and clinicopathological factors
The clinical indicators (including age, gender,
tumor grade, and TNM stage) were subdivided, and Kaplan-Meier
survival curves were plotted for the subgroups stratified by these
clinical indicators. The model was found to apply to clinical
factors such as age, sex, grade 2, grade 3, T3 and T4 staging
(Fig. 5). However, there was no
statistical difference in OS in some subtypes, such as grade 1, T1
and T2. This may be related to the overly refined subgroup typology
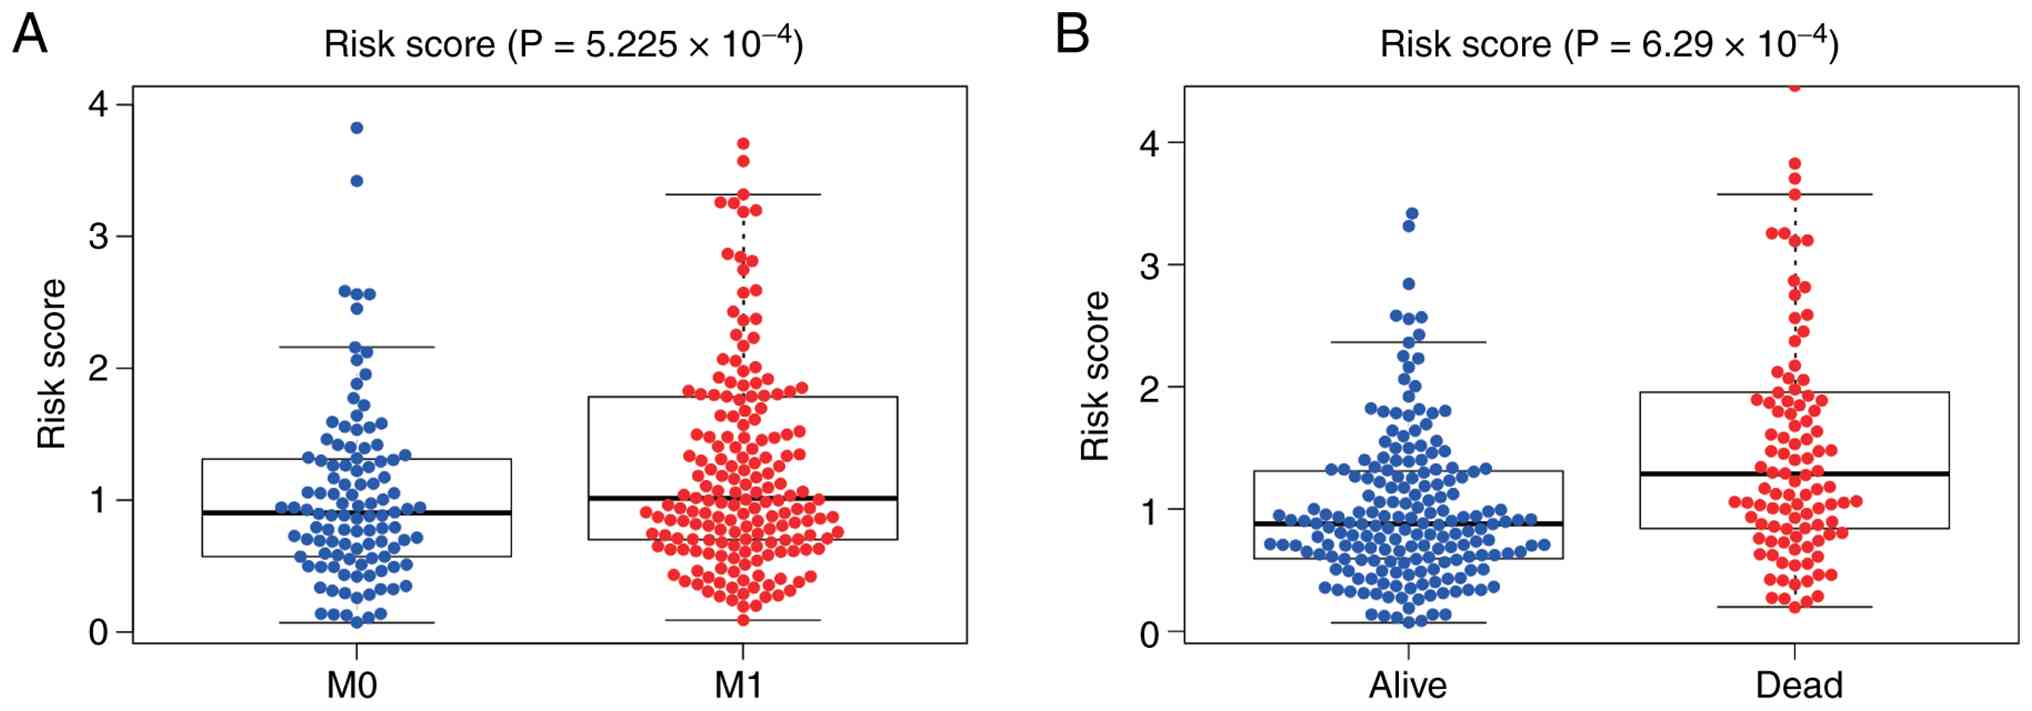
and the small number of patient cases in the subgroup. Next, the
relationship between risk values and clinicopathological parameters
was analyzed to learn more about the function of the SenRLs
signature in the development of STAD. Patients who developed
distant metastases had significantly higher risk values than those
without distant metastases (P<0.001; Fig. 6A). In addition, the survival status
was lower for patients with STAD with high-risk values (P<0.001;
Fig. 6B). Risk values in STAD are
notably linked to distant metastases and death, and the SenRLs
signature may be involved in STAD disease progression.
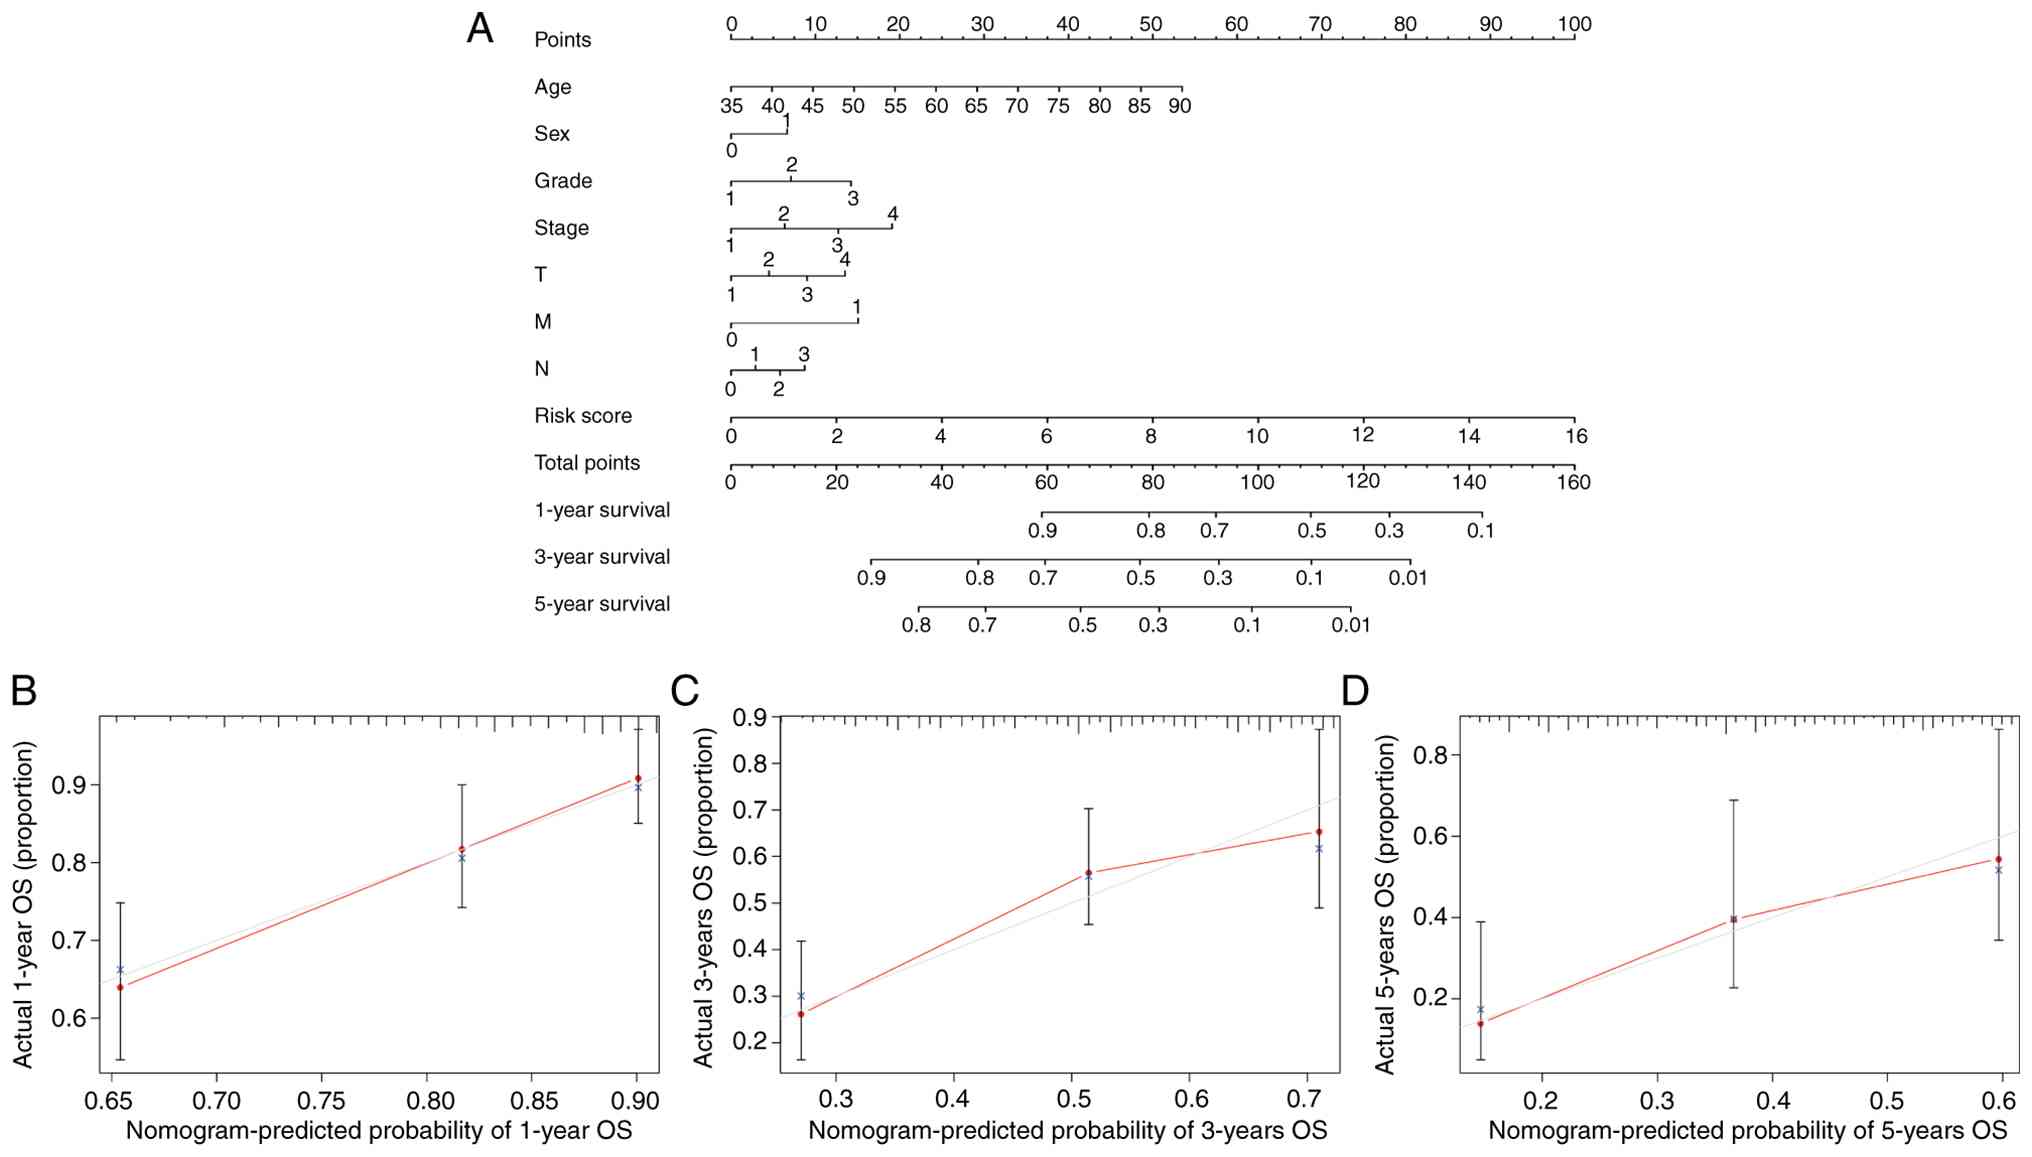
Establishment of a nomogram
To achieve individualized prognosis prediction of
patients with STAD, a nomogram was constructed combining risk score
and clinical variables (Fig. 7A).
There was a high agreement between the expected and actual observed
values, as demonstrated by the calibration curves, which revealed
that the predicted curves for survival were all around the standard
curves (Fig. 7B-D). Therefore, the
nomogram combining medical factors and risk score is effective in
forecasting patient OS.
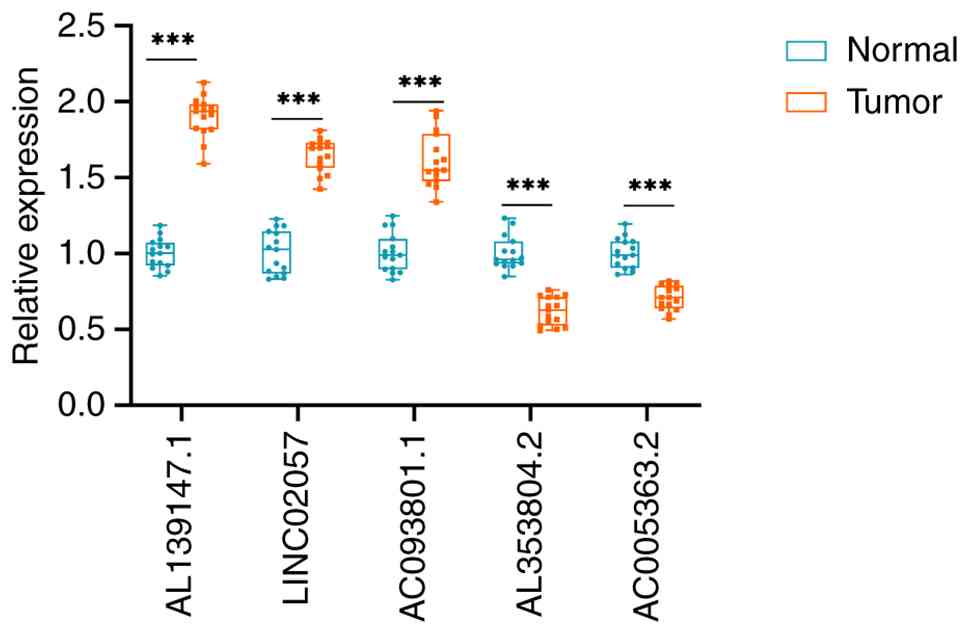
RT-qPCR to confirm lncRNAs
expression
The present study quantified the expression of five
key prognostic lncRNAs using RT-qPCR in 15 pairs of STAD tissue
specimens and paracancerous tissue specimens in order to further
test the viability of the SenRLs signature. The results are shown
in Fig. 8, and the expression of
LINC02057, AL139147.1 and AC093801.1 was significantly greater in
STAD than in paracancerous tissues. The expression of AC005363.2
and AL353804.2 was significantly decreased in STAD tissues. The
tissue expression profiles of these lncRNAs are consistent with the
bioinformatics findings, thus confirming the reliability and
accuracy of the above analysis results.
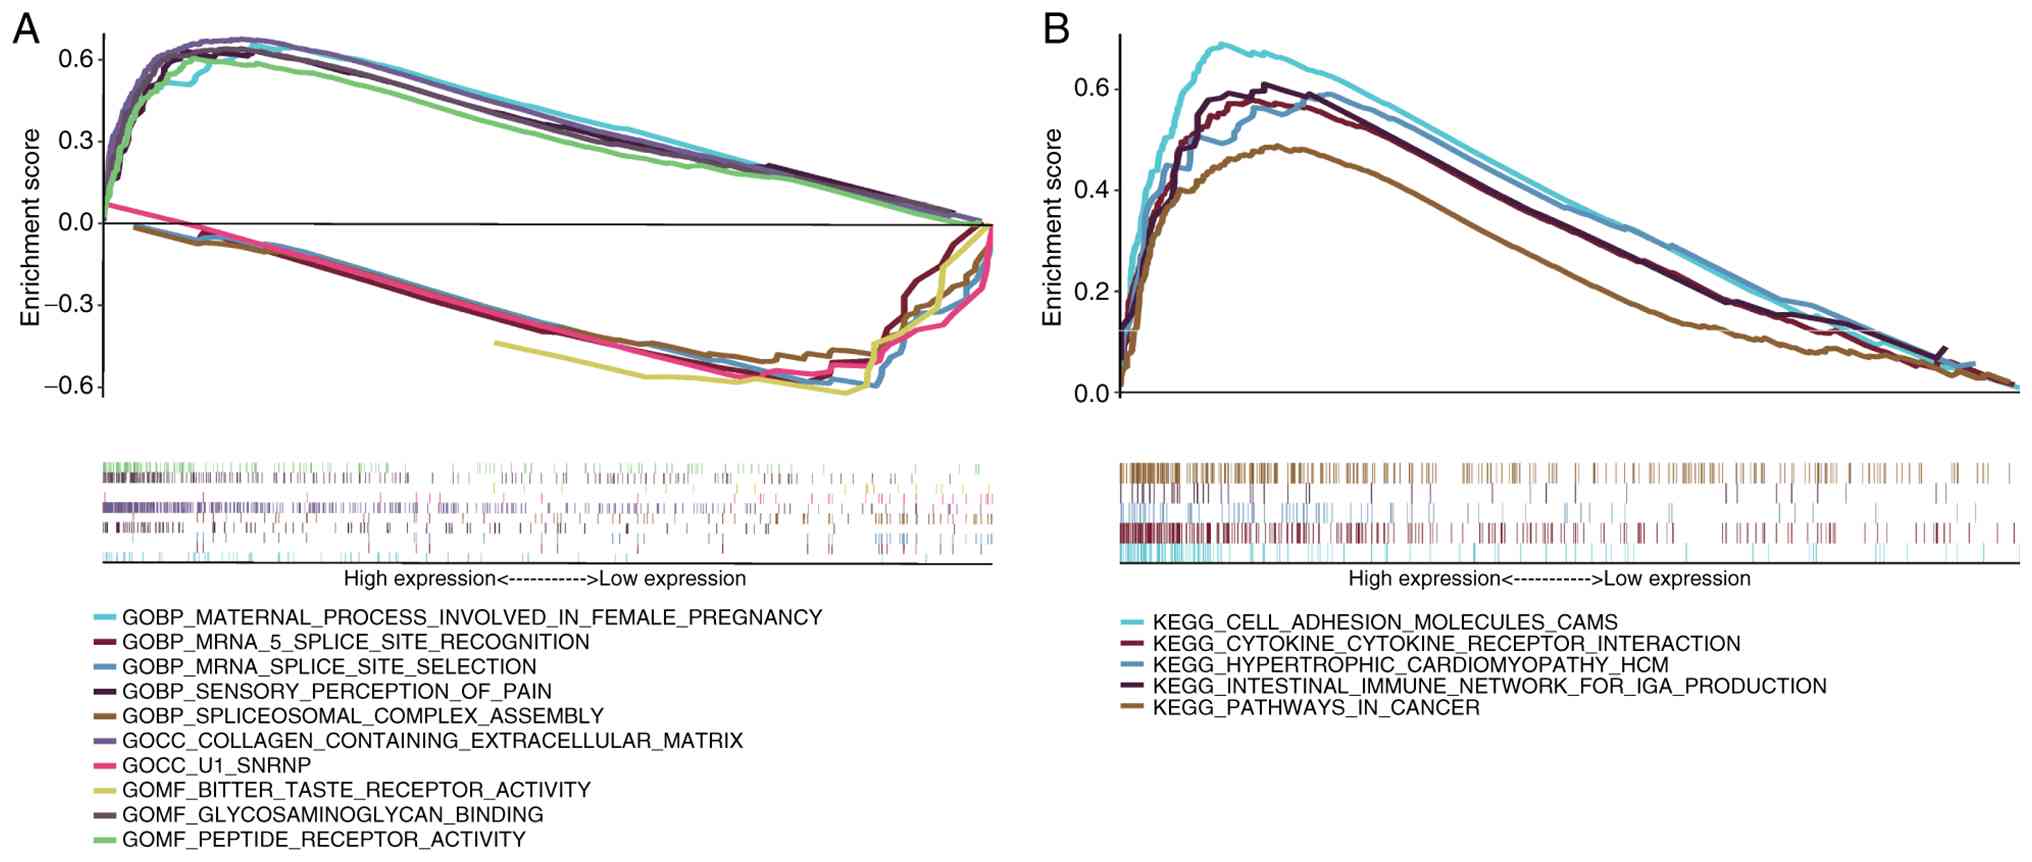
GSEA
Next the specific signaling pathways involved in
prognostic SenRLs was investigated by enrichment analysis. Through
GO analysis, it could be seen that the signaling pathways, such as
‘collagen-containing extracellular matrix’, ‘peptide receptor
activity’ and ‘glycosaminoglycan binding’, were enriched in the
high-risk group. The low-risk group was enriched for signaling
pathways such as ‘mRNA splice site selection’, ‘mRNA 5 splice site
recognition’ and ‘spliceosomal complex assembly’ (P<0.05;
FDR<0.25; Fig. 9A). Further
analysis by KEGG showed that signaling pathways such as the
‘intestinal immune network of IgA production’, ‘cytokine-cytokine
receptor interaction’ and ‘cell adhesion molecules cams’ were
enriched in the high-risk group (P<0.05; FDR<0.25; Fig. 9B). No significant differences in
KEGG gene concentration were observed in the low-risk group. The
immune response-related signaling pathways were markedly enriched
in the high-risk group, suggesting that prognostic SenRLs may
influence STAD development through immune pathways. Next,
immunological analysis was performed in the model.
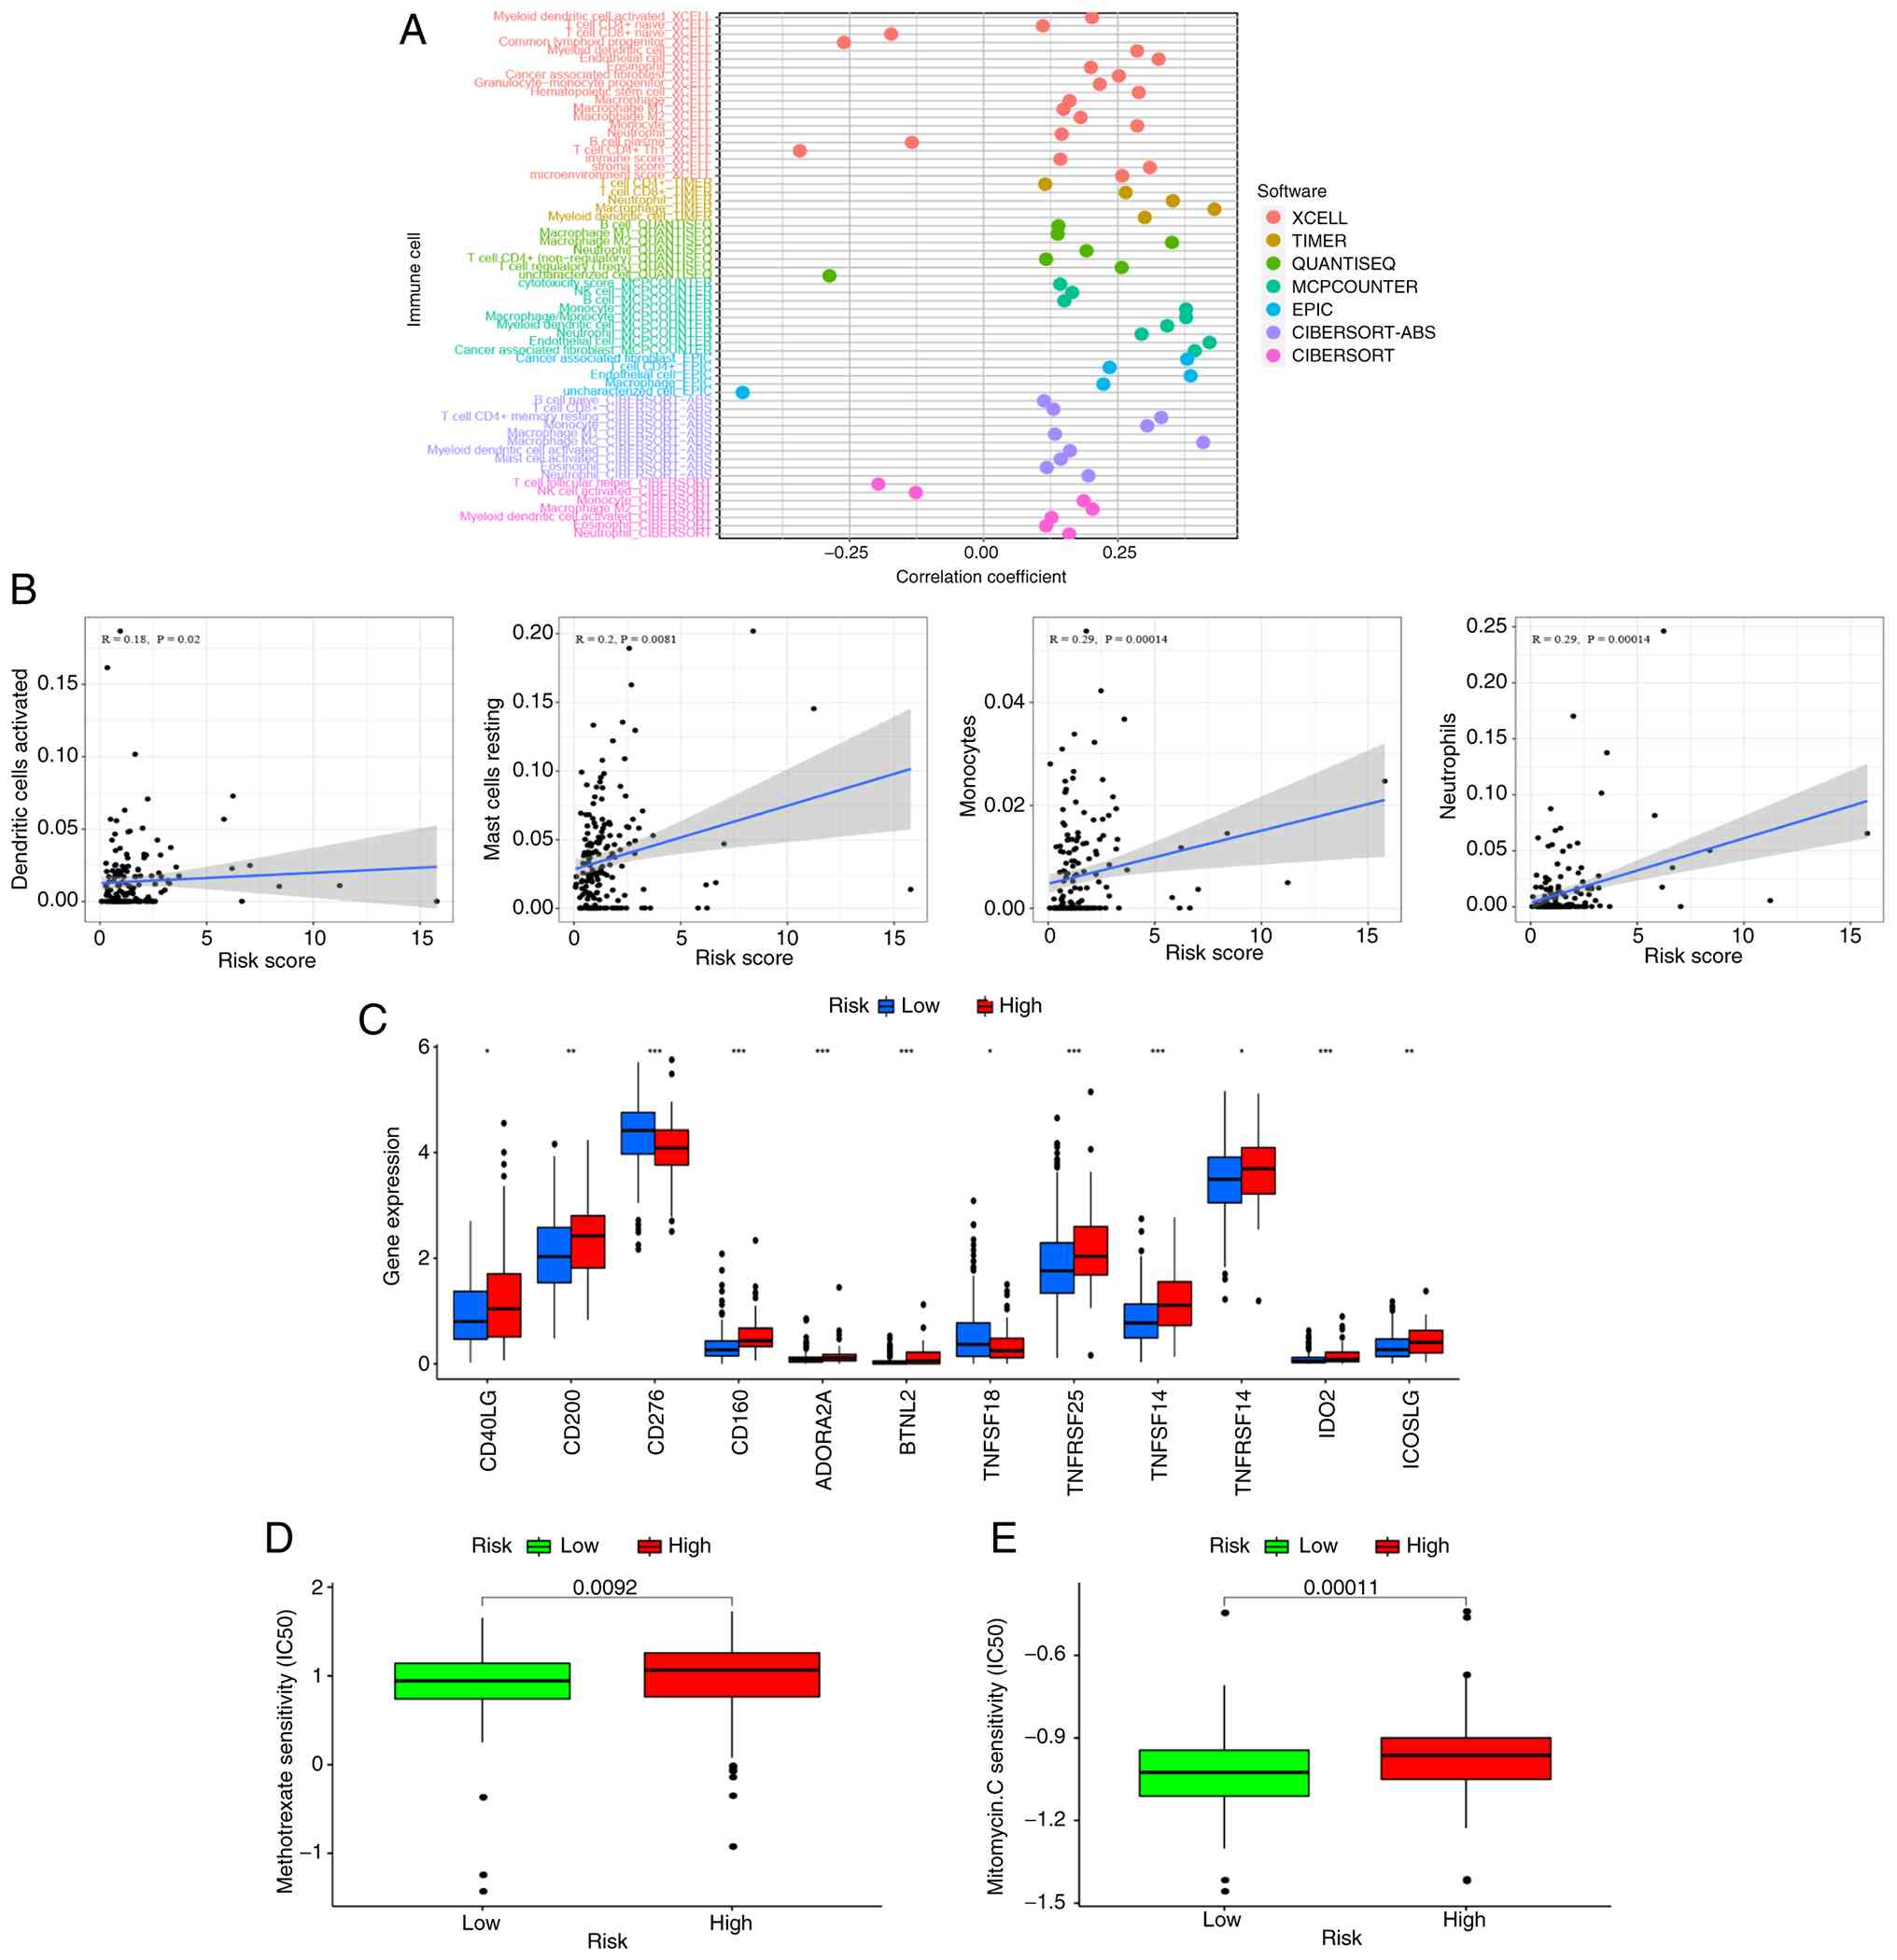
Immunoscape and treatment
The relative proportions of 22 immunological
infiltrating cells were analyzed using CIBERSORT, and the results
were displayed as a bar chart (Fig.
S1). A correlation analysis of immune cells was performed using
seven working platforms, including XCELL, TIMER and QUANTISEQ. As
shown in the bubble plot in Fig.
10A, the high-risk group had more immune cell infiltration,
such as Monocyte, Myeloid dendritic cell, B cell naive, T cell
CD8+, Macrophage, NK cell and B cell (P<0.05, Table SIV). The study further analyzed the
correlation between risk score and immune cell infiltration. It
showed that the risk score was positively correlated with most
immune cell infiltration, such as dendritic cells activated, mast
cells resting, monocytes and neutrophils (P<0.05; Fig. 10B). Therefore, this demonstrated
that the SenRLs signature-based risk score is effective in
distinguishing different features of immune cells in STAD.
Immune checkpoint inhibitor (ICI) selectively
enhances host immune response to malignancies by modulating the TME
(30). It was observed how
immunological checkpoints were expressed in patients with STAD. The
high-risk group had high expression levels of the majority of
immune checkpoint genes, including CD40LG, CD200 and
ICOSLG (P<0.05; Fig.
10C). This implies that patients with STAD can be grouped by
the SenRLs risk patterns to select appropriate checkpoint
inhibitors for them. The IC50 values for the chemotherapeutic
medications methotrexate and mitomycin C differed significantly
between the two groups, with the high-risk group having higher IC50
values (P<0.01; Fig. 10D and
E). Therefore, the SenRLs signature could be used as a
potential predictor of drug sensitivity for oncology treatment.
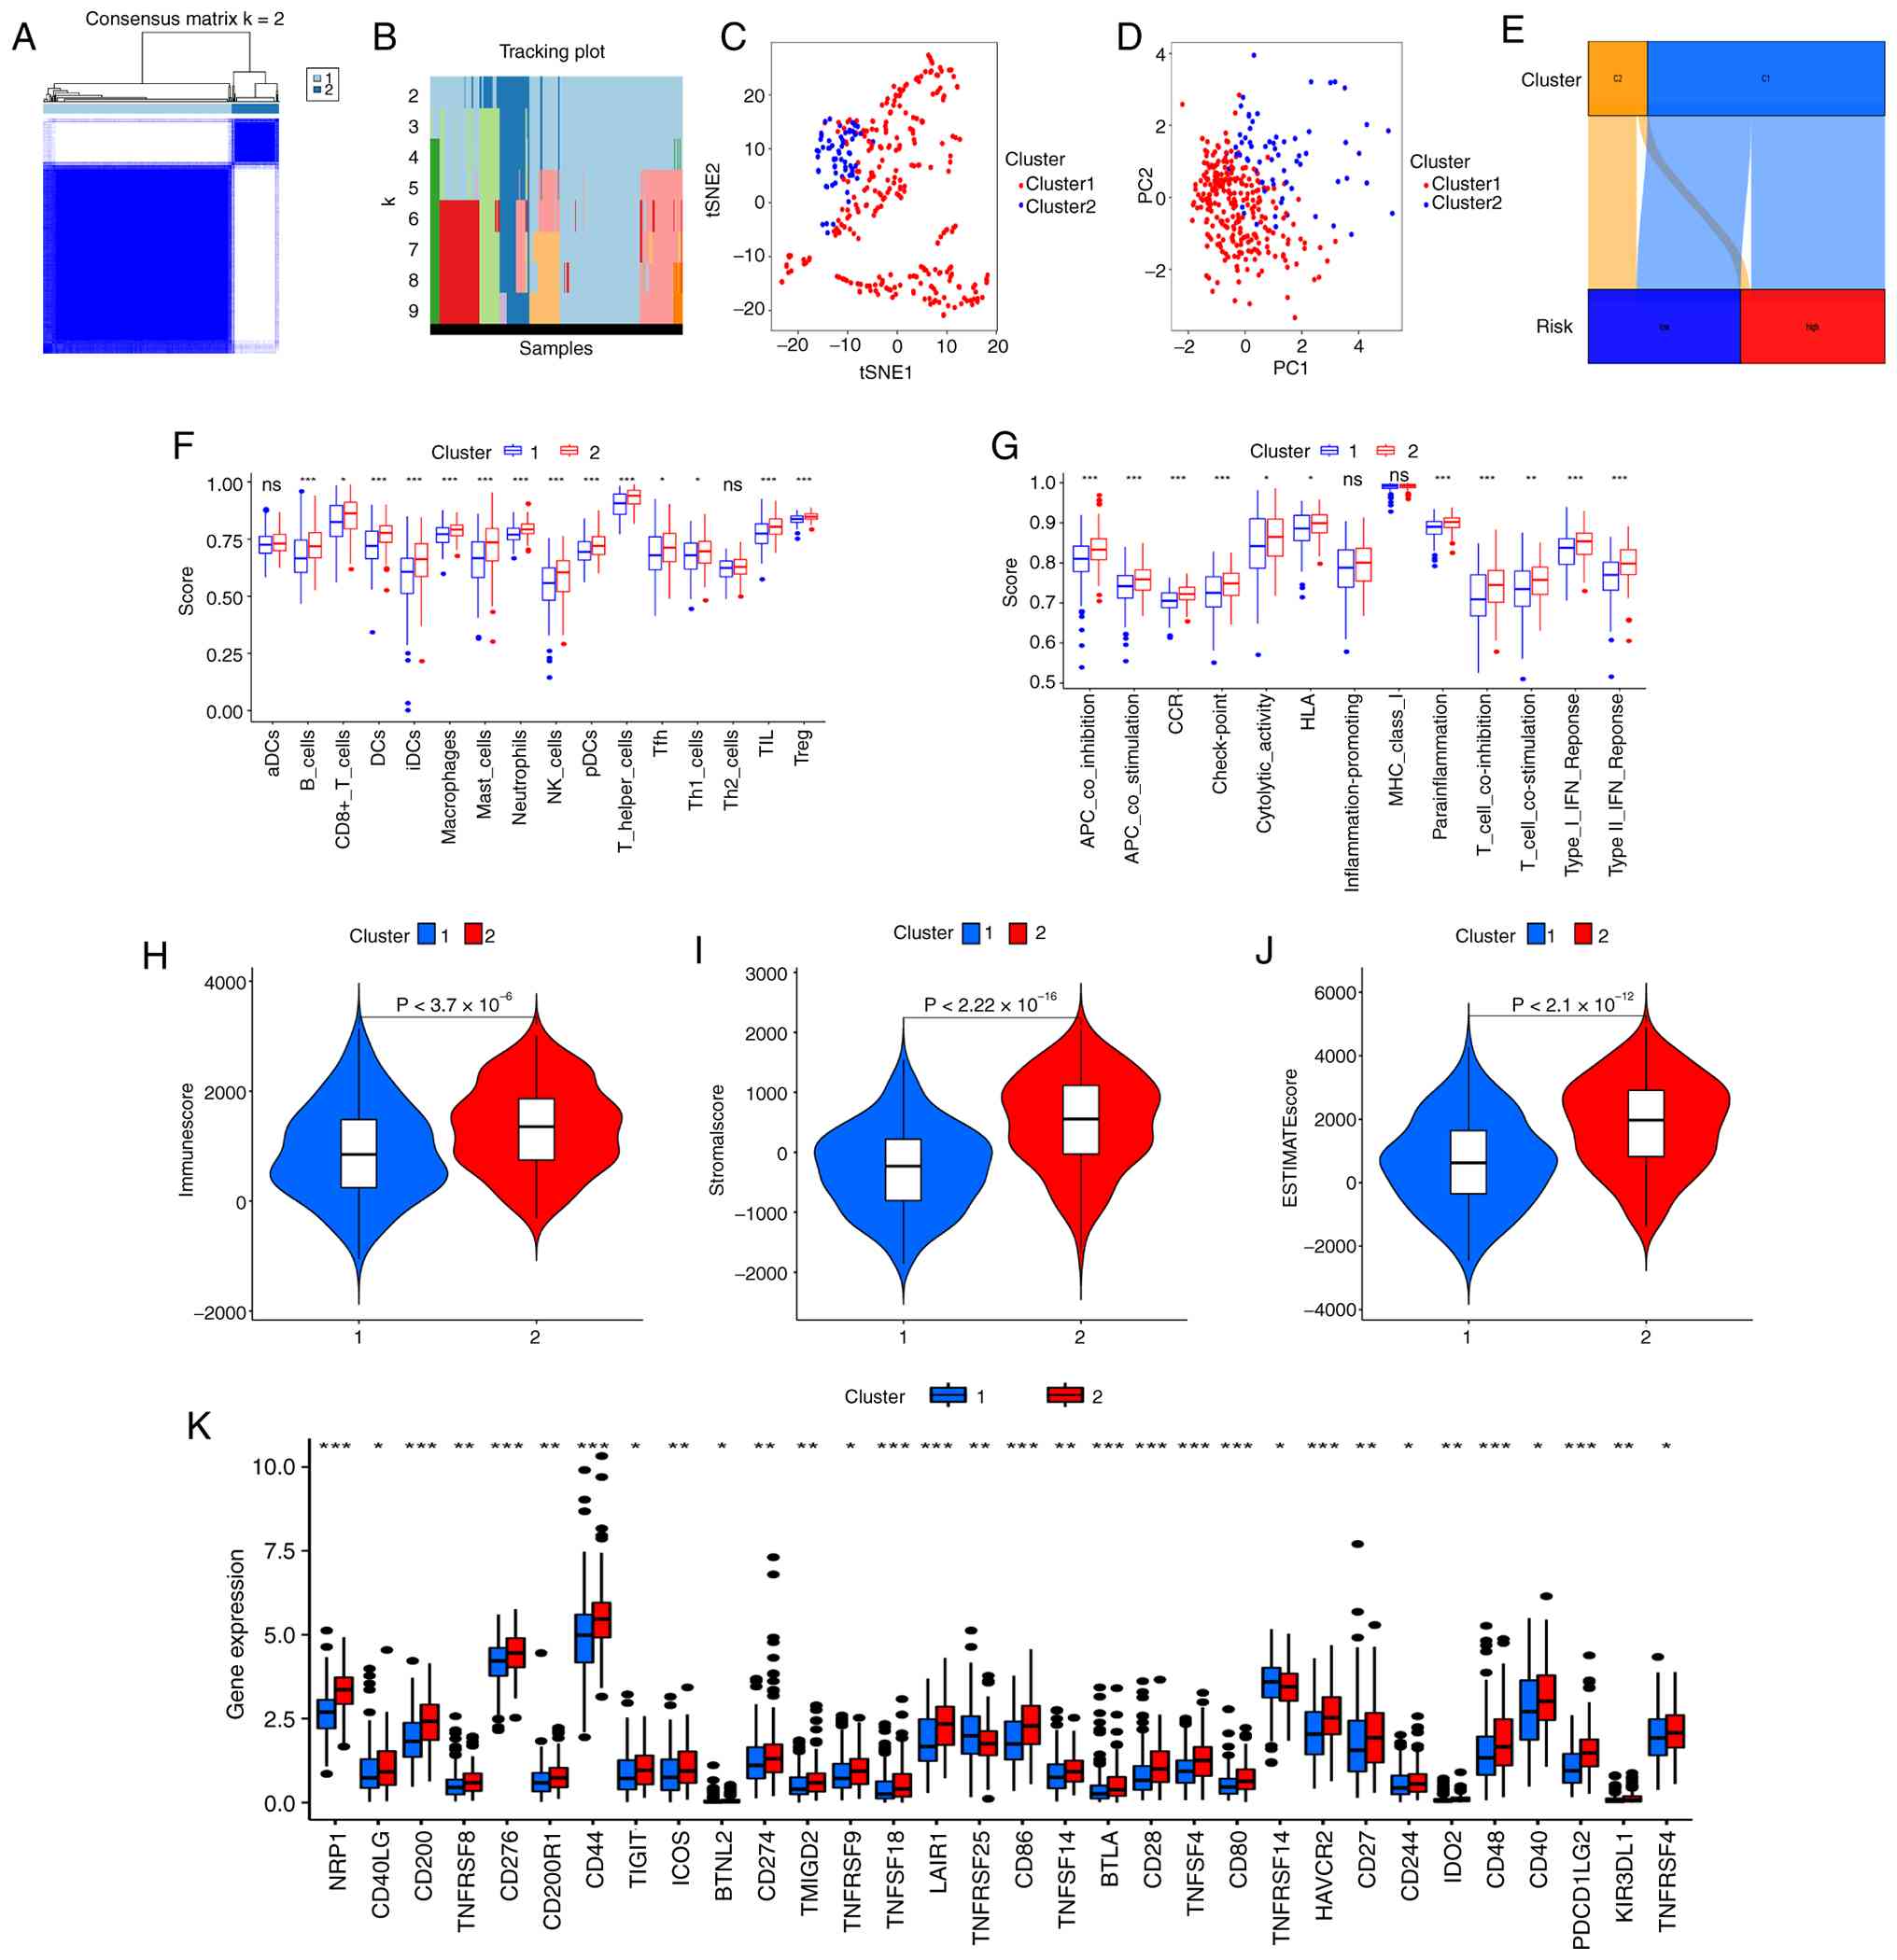
Hot and cold tumor classification in
STAD
Clustering analysis of STAD samples was performed
depending on the SenRLs signature to improve the characterization
of the subtypes of cold and hot tumors in the samples. Combining
the matrix clustering heatmap, cumulative distribution function
(CDF) and area change beneath the CDF plot, the sub-groups at K=2
(the highest intra-group correlation) were selected as the
clustering result in this study (Fig.
11A and B and Fig. S2). The
samples were divided into 2 groups, named Cluster 1 and Cluster 2,
respectively. Both t-SNE and PCA showed that the above division
could better classify the samples into two clusters (Fig. 11C and D). The OS of the two
clusters was compared, and the OS of Cluster 2 was superior to
Cluster 1, but no significant difference was found (P=0.188;
Fig. S3). Cluster subtyping cannot
be used as a prognostic indicator, and the risk score of the SenRLs
signature remains the main OS predictor. In addition, charts were
developed to understand the correlation of clustering with risk
groups, and according to Fig. 11E,
Cluster 1 is linked to high risk, whereas Cluster 2 is linked to
low risk.
The examination of the various platforms showed
discrimination in the immune cell infiltration of the clusters
(P<0.01; Table SV). The
enrichment scores for the immunological pathways and immune cells
were calculated. These findings revealed that a variety of immune
cells, such as regulatory T cells (Treg), T follicular helper cells
(Tfh), T helper (Th)1 cells, dendritic cells (DCs), immature DCs
(iDCs), plasmacytoid DCs (pDCs) and CD8+ T cells, had elevated
enrichment scores in Cluster 2 (P<0.05; Fig. 11F). T cell co-stimulation and other
immune function enrichment fractions were notably greater in
Cluster 2 (P<0.01; Fig. 11G),
suggesting that Cluster 2 is more important in immune cell function
regulation. Compared with Cluster 1, Cluster 2 had significantly
greater immune, stromal and estimate scores (P<0.01; Fig. 11H-J). The two clusters have
different TME, and immunotherapy is dependent on TME (31). Most of the immune checkpoint genes,
including PDCD1LG2 (also called programmed death ligand-2,
PD-L2), HAVCR2 (also called T-cell Immunoglobulin and
Mucin Domain-containing Protein 3, TIM3) and CD274
(also called PD-L1), were upregulated in Cluster 2
(P<0.05; Fig. 11K). A tumor is
defined as ‘hot’ if it contains abundant tumor-reactive immune
cells, displays an active immune microenvironment and exhibits high
expression of immune checkpoints (8,9). In
the present study, Cluster 2 showed marked immune cell
infiltration, a more active TME (with greater enrichment of immune
function-related pathways and higher immune/stromal/estimate
scores), and elevated immune checkpoint expression. Based on these
canonical immunological features, Cluster 2 is likely to be more
responsive to immunotherapy and can therefore be classified as a
hot tumor. By contrast, Cluster 1 exhibited immunotherapy
resistance and can be categorized as a cold tumor.
Multi-model validation and SHAP
analysis
To verify the robustness of the model,
cross-validation was performed using four different algorithms, and
all AUC values were >0.7. The RF and GBM models achieved the
highest AUC of 0.849, indicating excellent and stable predictive
performance (Fig. S4A). The mean
absolute SHAP value of each SenRL served as a metric for its
relative importance; AL139147.1 exhibited the highest value
(0.0412) (Fig. S4B). This ranking
of importance was consistent with the results of the multivariate
Cox regression, in which AL139147.1 showed the highest coefficient
(1.811), validating the logical consistency of the signature.
Additionally, the SHAP waterfall plot visualized the additive
prediction process (Fig. S4C).
Starting from a base value of E[f(x)]=0.913, the final
prediction reached f(x)=0.978. AL139147.1, AC093801.1 and
LINC02057 emerged as positive contributors, whereas AC005363.2 and
AL353804.2 contributed negatively, a pattern consistent with the
risk model. Collectively, these data confirm that the model relies
on distinct, biologically plausible feature contributions rather
than randomness, substantiating its validity and
interpretability.
Discussion
Cellular senescence is the basic unit of senescence
in the whole organism, and senescent cells contribute to the
gradual aging of the organism through the release of inflammatory
signals (32). At the same time,
cellular senescence can eliminate abnormal cells and prevent the
further release of tissue-damaging factors from degenerated cells.
This is an important mechanism by which the organism performs
self-clearance and maintains a healthy microenvironment and immune
response (32). LncRNAs have a
notable role in the regulatory mechanism of cellular senescence.
LncRNA Pvt1b is a mediator of p53-dependent growth arrest, and
Pvt1b expression is cis-regulated by p53, which causes lung
adenocarcinoma and sarcoma cells to undergo senescence (33).
Numerous senescence-related gene signatures have
been established to predict the prognosis of patients with
malignant tumors, including gastric cancer (34), colon adenocarcinoma (35) and prostate cancer (36). However, most previous studies have
been mainly based on mRNA expression profiles. Given the marked
regulatory roles of lncRNAs in tumor cell senescence, the
development of a SenRLs prognostic signature for STAD remains
warranted. In the present study, a STAD prognostic risk model was
built utilizing five SenRLs (AL139147.1, LINC02057, AC093801.1,
AL353804.2 and AC005363.2). The ROC curves indicated that the
SenRLs signature had an excellent predictive performance for 5-year
OS in patients with STAD. SenRLs performed better as an independent
prognostic indicator than traditional clinicopathological factors.
Furthermore, the risk values for the prognostic prediction model
were shown to be linked to metastasis stage and survival status,
suggesting that the SenRLs signature is linked to STAD progression.
Using RT-qPCR, the expression of SenRLs was validated, and the
outcomes further supported the validity of the bioinformatics
analysis findings. The present study constructed a nomogram by
combining risk score, age and TNM staging in order to achieve
individualized prediction of OS in patients with STAD. The newly
developed nomogram can effectively predict the risk of patient
death and is expected to assist in the development of clinical
treatment strategies.
The malignant phenotype of tumors is determined not
only by tumor cell-intrinsic activity but also by immune cells
recruited and activated in the tumor-associated microenvironment
(37). In the present study, GSEA
demonstrated that the SenRLs signature is mainly involved in immune
response-associated pathways. Next, the link between the SenRLs
signature and TME was further investigated. The high-risk score was
significantly correlated with the majority of immune cells.
Furthermore, it was noted that the infiltration abundance of
neutrophils, activated dendritic cells, resting mast cells and
monocytes rose with the climbing risk score. The above increased
immune cells can be associated with a poorer outcome in patients
with STAD. Previous studies have revealed that high density of
monocytes, activated dendritic cells and resting mast cells are
relatively unfavorable signals for the prognosis of patients with
gastric cancer (38–40), which is consistent with the present
findings. A previous study demonstrated that patients with gastric
cancer had a considerable increase in neutrophil infiltration in
their tumor tissues, according to flow cytometry analyses. In
addition, neutrophils promote tumor progression through
immunosuppressive pathways (41).
Based on the analysis of drug IC50 values the present study, the
model can be used as a possible predictor of drug sensitivity for
chemotherapy therapies.
Tumor cells prevent immune cells from killing cancer
cells by initiating immunosuppressive mechanisms, a condition that
occurs mainly in hot tumors. To address this situation, emerging
ICI therapies or other immunotherapies can target immune cells
(mainly T cells) around tumor cells, thus triggering an immune
response that kills the hot tumor (42). However, in cold tumors, the
aforementioned ICI or immunotherapy is not notably effective. This
is mainly due to the lack of effective mutant proteins on the cell
surface of cold tumors to activate and attract immune cells
(43). STAD is a markedly
gene-heterogeneous malignancy, which makes conventional
clinicopathological assessment unable to reliably predict the
effect of immunotherapy (44).
Consensus clustering was used in the present study to divide the
STAD samples into two clusters based on the SenRLs risk signature.
Notably, the ESTIMATE score for Cluster 2 was significantly greater
than Cluster 1, and the two clusters had a different TME. Cluster 2
is more susceptible to infiltration by immune cells, especially T
cells and dendritic cells, such as Treg, Tfh, Th1 cells, iDCs,
pDCs, DCs and CD8+ T cells. In addition, Cluster 2 has a greater
role in controlling immune cell functions, such as T cell
co-stimulation. It has been confirmed that the immune effect of the
body against tumors is mainly a T cell-mediated specific cellular
immune response (45). The most
potent antigen-presenting cells in the organism, dendritic cells,
play a notable part in the antitumor immune response (46). Immature dendritic cells in
vivo transform and mature after uptake of foreign antigens.
They then activate CD8+ T cells via major histocompatibility
complex I molecules, thereby inducing an immune response (47). Compared with drug therapy, patients
with tumors treated with dendritic cell vaccines as well as
activated T cells after surgery have notably longer OS (48), and tumor immunotherapy based on them
will likely be one of the most effective therapies (49). Notably, the present study showed
that Cluster 2 had high expression levels of immunological
checkpoints, including PDCD1LG2 (also called PD-L2),
HAVCR2 (also called TIM3) and CD274 (also
called PD-L1). The comprehensive multi-dimensional immune
characterization performed in the present study, encompassing
immune cell infiltration, immune function enrichment, TME scoring
and immune checkpoint expression, provides robust and consistent
in silico evidence that the SenRLs signature can effectively
distinguish hot and cold tumor phenotypes, supporting its potential
value in predicting immunotherapy responsiveness. Cluster 2
exhibited a higher TME score, greater immune cell infiltration and
pathway enrichment, as well as elevated expression of immune
checkpoints, suggesting that it may be more sensitive to
immunotherapy and thus can be defined as a hot tumor. By contrast,
Cluster 1 can be classified as a cold tumor. Notably, Cluster
typing based on the SenRLs risk signature can effectively
discriminate between hot and cold tumors, this represents a unique
advantage of the present study, as existing STAD prognostic models
(whether lncRNA-based or senescence-related) fail to integrate
these two dimensions to address the unmet clinical need for
immunotherapy stratification (34,50,51).
This capability will facilitate more accurate identification of
patients who may benefit from STAD immunotherapy.
Among the five identified lncRNAs, only LINC02057
was previously linked to prognosis in lung and esophageal cancers
(52,53), aligning with the present observation
of its risk-associated elevation. To the best of our knowledge, the
present study is the first to characterize LINC02057 as a SenRL in
STAD and to explore its utility in distinguishing tumor immune
phenotypes. Furthermore, the present signature represents the first
model to integrate SenRLs with hot/cold tumor classification for
guiding immunotherapy stratification, effectively bridging a gap in
existing literature.
Due to the lack of suitable external cohorts with
complete 5-year OS and lncRNA profiles, multi-model ROC validation
and SHAP analysis were performed as robust validation strategies.
High AUC values across multiple algorithms verified the stability
of the signature. SHAP analysis revealed that AL139147.1
contributed most notably to the prognostic model, which was
consistent with the results of multivariate Cox regression. This
consistency confirms that the selection of key SenRLs was not
arbitrary but based on their actual contributions to STAD
prognosis, supporting the validity and stability of the signature.
Risk-associated SenRLs exerted positive contributions, whereas
protective SenRLs showed negative contributions, a pattern
consistent with the risk model. These SHAP results were in line
with the bioinformatic and RT-qPCR findings, further validating the
accuracy of the signature and clarifying the impact of each SenRL
on STAD prognosis.
The present study has several limitations. First, a
cohort directly treated with immunotherapy was not included, owing
to the limited availability of public STAD cohorts with documented
immunotherapy administration and complete follow-up data. In future
studies, clinical samples from patients with STAD receiving
immunotherapy will be collected to further validate the predictive
value of the SenRLs signature for immunotherapy response. Second,
detailed stratified analysis of STAD subtypes was not performed due
to incomplete subtype annotations in TCGA dataset. In subsequent
research, complete subtype data from public databases will be
integrated to validate the applicability of the SenRLs signature
across different STAD subtypes. Finally, the sample size for
RT-qPCR validation was relatively small, primarily due to the
strict inclusion and exclusion criteria, as well as the limited
availability of voluntarily enrolled cases during the study period.
It is acknowledged that this small sample size may limit the
statistical power of the present validation results. Consequently,
future studies with larger, multicenter cohorts are warranted to
further validate the expression patterns and clinical significance
of these five key SenRLs.
In conclusion, based on five SenRLs (AL139147.1,
LINC02057, AC093801.1, AL353804.2, AC005363.2), the present study
identified a novel prognostic model of STAD. Notably, the SenRLs
signature facilitates the discrimination of hot and cold tumors in
STAD by identifying immune phenotypes associated with immunotherapy
sensitivity. This will better screen the population for the
benefits of immunotherapy and save medical resources while
achieving individualized immunotherapy.
Supplementary Material
Supporting Data
Supporting Data
Acknowledgements
Not applicable.
Funding
The present study was supported by Xingtai Key R&D Program
Project (grant no. 2025ZC072).
Availability of data and materials
The data generated in the present study may be
requested from the corresponding author.
Authors' contributions
FK conceived and designed the study and revised the
manuscript. CH, BH, LL and XW performed the data collection,
analysis and experiments. Part of the data analysis was assisted by
XK, PZ and QZ. CH wrote the manuscript. FK and CH confirm the
authenticity of all the raw data. All authors read and approved the
final manuscript.
Ethics approval and consent to
participate
The present study was approved by the Ethics
Committee of Xingtai People's Hospital (approval no. 2025-048), and
all studies were conducted in accordance with relevant guidelines.
All patients agreed and signed the informed consent form. The study
was conducted in accordance with The Declaration of Helsinki.
Patient consent for publication
Not applicable.
Competing interests
The authors declare that they have no competing
interests.
References
|
1
|
Bray F, Laversanne M, Sung H, Ferlay J,
Siegel RL, Soerjomataram I, Jemal A and Torre LA: Global cancer
statistics 2022: GLOBOCAN estimates of incidence and mortality
worldwide for 36 cancers in 185 countries. CA Cancer J Clin.
74:229–263. 2024.PubMed/NCBI
|
|
2
|
Ajani JA, D'Amico TA, Bentrem DJ, Corvera
CU, Das P, Enzinger PC, Enzler T, Gerdes H, Gibson MK, Grierson P,
et al: Gastric cancer, version 2.2025, NCCN clinical practice
guidelines in oncology. J Natl Compr Canc Netw. 23:169–191. 2025.
View Article : Google Scholar : PubMed/NCBI
|
|
3
|
Sundar R, Nakayama I, Markar SR, Shitara
K, van Laarhoven HWM, Janjigian YY and Smyth EC: Gastric cancer.
Lancet. 405:2087–2102. 2025. View Article : Google Scholar : PubMed/NCBI
|
|
4
|
Christodoulidis G, Koumarelas KE and
Kouliou MN: Revolutionizing gastric cancer treatment: The potential
of immunotherapy. World J Gastroenterol. 30:286–289. 2024.
View Article : Google Scholar : PubMed/NCBI
|
|
5
|
Kanaji S, Urakawa N, Harada H, Ikeda T,
Koterazawa Y, Aoki T, Sawada R, Otowa Y, Goto H, Hasegawa H, et al:
Multidisciplinary treatment for advanced gastric cancer. Int J Clin
Oncol. 30:1268–1275. 2025. View Article : Google Scholar : PubMed/NCBI
|
|
6
|
Luo D, Liu Y, Lu Z and Huang L: Targeted
therapy and immunotherapy for gastric cancer: Rational strategies,
novel advancements, challenges, and future perspectives. Mol Med.
31:522025. View Article : Google Scholar : PubMed/NCBI
|
|
7
|
Liu YT, Wang YL, Wang S, Li JJ, He W, Fan
XJ and Wan XB: Turning cold tumors into hot tumors to ignite
immunotherapy. Mol Cancer. 24:2542025. View Article : Google Scholar : PubMed/NCBI
|
|
8
|
Kong X, Ou S, Wei Z, Ye X, Chen S, Shi X
and Zhang R: Transforming the ‘cold’ tumors to ‘hot’ tumors:
Strategies for immune activation. Biochem Pharmacol.
241:1171942025. View Article : Google Scholar : PubMed/NCBI
|
|
9
|
Wu B, Zhang B, Li B, Wu H and Jiang M:
Cold and hot tumors: From molecular mechanisms to targeted therapy.
Signal Transduct Target Ther. 9:2742024. View Article : Google Scholar : PubMed/NCBI
|
|
10
|
Sun F, Gao X, Wang W, Zhao X, Zhang J and
Zhu Y: Predictive biomarkers in the era of immunotherapy for
gastric cancer: Current achievements and future perspectives. Front
Immunol. 16:15999082025. View Article : Google Scholar : PubMed/NCBI
|
|
11
|
Yasuda T and Wang YA: Gastric cancer
immunosuppressive microenvironment heterogeneity: Implications for
therapy development. Trends Cancer. 10:627–642. 2024. View Article : Google Scholar : PubMed/NCBI
|
|
12
|
Sun F, Gao X, Li T, Zhao X and Zhu Y:
Tumor immune microenvironment remodeling after neoadjuvant therapy
in gastric cancer: Update and new challenges. Biochim Biophys Acta
Rev Cancer. 1880:1893502025. View Article : Google Scholar : PubMed/NCBI
|
|
13
|
Marin I, Boix O, Garcia-Garijo A, Sirois
I, Caballe A, Zarzuela E, Ruano I, Attolini CS, Prats N,
Lopez-Dominguez JA, et al: Cellular senescence is immunogenic and
promotes antitumor immunity. Cancer Discov. 13:410–431. 2023.
View Article : Google Scholar : PubMed/NCBI
|
|
14
|
Yasuda T, Baba H and Ishimoto T: Cellular
senescence in the tumor microenvironment and context-specific
cancer treatment strategies. FEBS J. 290:1290–1302. 2023.
View Article : Google Scholar : PubMed/NCBI
|
|
15
|
Fakhri S, Zachariah Moradi S, DeLiberto LK
and Bishayee A: Cellular senescence signaling in cancer: A novel
therapeutic target to combat human malignancies. Biochem Pharmacol.
199:1149892022. View Article : Google Scholar : PubMed/NCBI
|
|
16
|
Chen LL and Kim VN: Small and long
non-coding RNAs: Past, present, and future. Cell. 187:6451–6485.
2024. View Article : Google Scholar : PubMed/NCBI
|
|
17
|
Kadian LK, Verma D, Lohani N, Yadav R,
Ranga S, Gulshan G, Pal S, Kumari K and Chauhan SS: Long non-coding
RNAs in cancer: Multifaceted roles and potential targets for
immunotherapy. Mol Cell Biochem. 479:3229–3254. 2024. View Article : Google Scholar : PubMed/NCBI
|
|
18
|
Jin P, Duan X, Li L, Zhou P, Zou CG and
Xie K: Cellular senescence in cancer: Molecular mechanisms and
therapeutic targets. MedComm (2020). 5:e5422024. View Article : Google Scholar : PubMed/NCBI
|
|
19
|
Chatterjee M and Viswanathan P: Long
noncoding RNAs in the regulation of p53-mediated apoptosis in human
cancers. Cell Biol Int. 45:1364–1382. 2021. View Article : Google Scholar : PubMed/NCBI
|
|
20
|
Tavares E, Silva J, Pessoa J,
Nóbrega-Pereira S and Bernardes de Jesus B: The impact of long
noncoding RNAs in tissue regeneration and senescence. Cells.
13:1192024. View Article : Google Scholar
|
|
21
|
Sang B, Zhang YY, Guo ST, Kong LF, Cheng
Q, Liu GZ, Thorne RF, Zhang XD, Jin L and Wu M: Dual functions for
OVAAL in initiation of RAF/MEK/ERK prosurvival signals and evasion
of p27-mediated cellular senescence. Proc Natl Acad Sci USA.
115:E11661–E11670. 2018. View Article : Google Scholar : PubMed/NCBI
|
|
22
|
Sang Y, Tang J, Li S, Li J, Zhang Y, Chen
L, Han L and Wang X: LncRNA PANDAR regulates the G1/S transition of
breast cancer cells by suppressing p16(INK4A) expression. Sci Rep.
6:223662016. View Article : Google Scholar : PubMed/NCBI
|
|
23
|
Fan SB, Xie XF, Wei W and Hua T:
Senescence-Related LncRNAs: Pioneering indicators for ovarian
cancer outcomes. Phenomics. 4:379–393. 2024. View Article : Google Scholar : PubMed/NCBI
|
|
24
|
Cao L, Chen F, Xu L, Zeng J, Wang Y, Zhang
S, Ba Y and Zhang H: Prognostic cellular senescence-related lncRNAs
patterns to predict clinical outcome and immune response in colon
cancer. Front Immunol. 15:14501352024. View Article : Google Scholar : PubMed/NCBI
|
|
25
|
Chen L, Lin J, Wen Y, Lan B, Xiong J, Fu
Y, Chen Y and Chen CB: A senescence-related lncRNA signature
predicts prognosis and reflects immune landscape in HNSCC. Oral
Oncol. 149:1066592024. View Article : Google Scholar : PubMed/NCBI
|
|
26
|
Schober P, Boer C and Schwarte LA:
Correlation coefficients: Appropriate use and interpretation.
Anesth Analg. 126:1763–1768. 2018. View Article : Google Scholar : PubMed/NCBI
|
|
27
|
Lauren P: The two histological main types
of gastric carcinoma: Diffuse and so-called intestinal-type
carcinoma. Acta Pathol Microbiol Scand. 64:31–49. 1965. View Article : Google Scholar : PubMed/NCBI
|
|
28
|
Nagtegaal ID, Odze RD, Klimstra D, Paradis
V, Rugge M, Schirmacher P, Washington KM, Carneiro F and Cree IA;
WHO Classification of Tumours Editorial Board, : The 2019 WHO
classification of tumours of the digestive system. Histopathology.
76:182–188. 2020. View Article : Google Scholar : PubMed/NCBI
|
|
29
|
Livak KJ and Schmittgen TD: Analysis of
relative gene expression data using real-time quantitative PCR and
the 2(−Delta Delta C(T)) method. Methods. 25:402–408. 2001.
View Article : Google Scholar : PubMed/NCBI
|
|
30
|
Marin-Acevedo JA, Kimbrough EO and Lou Y:
Next generation of immune checkpoint inhibitors and beyond. J
Hematol Oncol. 14:452021. View Article : Google Scholar : PubMed/NCBI
|
|
31
|
Binnewies M, Roberts EW, Kersten K, Chan
V, Fearon DF, Merad M, Coussens LM, Gabrilovich DI,
Ostrand-Rosenberg S, Hedrick CC, et al: Understanding the tumor
immune microenvironment (TIME) for effective therapy. Nat Med.
24:541–550. 2018. View Article : Google Scholar : PubMed/NCBI
|
|
32
|
Roger L, Tomas F and Gire V: Mechanisms
and regulation of cellular senescence. Int J Mol Sci. 22:131732021.
View Article : Google Scholar : PubMed/NCBI
|
|
33
|
Tesfaye E, Martinez-Terroba E, Bendor J,
Winkler L, Olivero C, Chen K, Feldser DM, Zamudio JR and Dimitrova
N: The p53 transcriptional response across tumor types reveals core
and senescence-specific signatures modulated by long noncoding
RNAs. Proc Natl Acad Sci USA. 118:e20255391182021. View Article : Google Scholar : PubMed/NCBI
|
|
34
|
Zhou L, Niu Z, Wang Y, Zheng Y, Zhu Y,
Wang C, Gao X, Gao L, Zhang W, Zhang K, et al: Senescence as a
dictator of patient outcomes and therapeutic efficacies in human
gastric cancer. Cell Death Discov. 8:132022. View Article : Google Scholar : PubMed/NCBI
|
|
35
|
Lv MY, Cai D, Li CH, Wang Y, Zhang X, Liu
H, Chen J, Wu Q and Zhang Z: Senescence-based colorectal cancer
subtyping reveals distinct molecular characteristics and
therapeutic strategies. MedComm (2020). 4:e3332023. View Article : Google Scholar : PubMed/NCBI
|
|
36
|
Wu Y, Xu R, Wang J and Luo Z: Precision
molecular insights for prostate cancer prognosis: Tumor immune
microenvironment and cell death analysis of senescence-related
genes by machine learning and single-cell analysis. Discov Oncol.
15:4872024. View Article : Google Scholar : PubMed/NCBI
|
|
37
|
Zeng D, Li M, Zhou R, Zhang J, Sun H, Shi
M, Bin J, Liao Y, Rao J and Liao W: Tumor microenvironment
characterization in gastric cancer identifies prognostic and
immunotherapeutically relevant gene signatures. Cancer Immunol Res.
7:737–750. 2019. View Article : Google Scholar : PubMed/NCBI
|
|
38
|
Urakawa S, Yamasaki M, Goto K, Haruna M,
Hirata M, Morimoto-Okazawa A, Kawashima A, Iwahori K, Makino T,
Kurokawa Y, et al: Peri-operative monocyte count is a marker of
poor prognosis in gastric cancer: Increased monocytes are a
characteristic of myeloid-derived suppressor cells. Cancer Immunol
Immunother. 68:1341–1350. 2019. View Article : Google Scholar : PubMed/NCBI
|
|
39
|
Yang X, Lei P, Huang L, Tang X, Wei B and
Wei H: Prognostic value of LRRC4C in colon and gastric cancers
correlates with tumour microenvironment immunity. Int J Biol Sci.
17:1413–1427. 2021. View Article : Google Scholar : PubMed/NCBI
|
|
40
|
Zhao Y, Hu S, Zhang J, Guo Y, Li Y, Wu L,
Zhang L and Wang X: Glucoside xylosyltransferase 2 as a diagnostic
and prognostic marker in gastric cancer via comprehensive analysis.
Bioengineered. 12:5641–5654. 2021. View Article : Google Scholar : PubMed/NCBI
|
|
41
|
Wang TT, Zhao YL, Peng LS, Chen N, Chen W,
Lv YP, Liu FY, Zhang JY, Cheng P, Teng YS, et al: Tumour-activated
neutrophils in gastric cancer foster immune suppression and disease
progression through GM-CSF-PD-L1 pathway. Gut. 66:1900–1911. 2017.
View Article : Google Scholar : PubMed/NCBI
|
|
42
|
Duan Q, Zhang H, Zheng J and Zhang L:
Turning cold into hot: Firing up the tumor microenvironment. Trends
Cancer. 6:605–618. 2020. View Article : Google Scholar : PubMed/NCBI
|
|
43
|
Galon J and Bruni D: Approaches to treat
immune hot, altered and cold tumours with combination
immunotherapies. Nat Rev Drug Discov. 18:197–218. 2019. View Article : Google Scholar : PubMed/NCBI
|
|
44
|
Chen Y, Sun Z, Chen W, Liu C, Chai R, Ding
J, Liu W, Feng X, Zhou J, Shen X, et al: The immune subtypes and
landscape of gastric cancer and to predict based on the whole-slide
images using deep learning. Front Immunol. 12:6859922021.
View Article : Google Scholar : PubMed/NCBI
|
|
45
|
Chopp L, Redmond C, O'Shea JJ and Schwartz
DM: From thymus to tissues and tumors: A review of T-cell biology.
J Allergy Clin Immunol. 151:81–97. 2023. View Article : Google Scholar : PubMed/NCBI
|
|
46
|
Heras-Murillo I, Adán-Barrientos I, Galán
M, Wculek SK and Sancho D: Dendritic cells as orchestrators of
anticancer immunity and immunotherapy. Nat Rev Clin Oncol.
21:257–277. 2024. View Article : Google Scholar : PubMed/NCBI
|
|
47
|
MacNabb BW, Chen X, Tumuluru S, Godfrey J,
Kasal DN, Yu J, Jongsma MLM, Spaapen RM, Kline DE and Kline J:
Dendritic cells can prime anti-tumor CD8+ T cell responses through
major histocompatibility complex cross-dressing. Immunity.
55:982–997. 2022. View Article : Google Scholar : PubMed/NCBI
|
|
48
|
Shimizu K, Kotera Y, Aruga A, Takeshita N,
Katagiri S, Ariizumi S, Takahashi Y, Yoshitoshi K, Takasaki K and
Yamamoto M: Postoperative dendritic cell vaccine plus activated
T-cell transfer improves the survival of patients with invasive
hepatocellular carcinoma. Hum Vaccin Immunother. 10:970–976. 2014.
View Article : Google Scholar : PubMed/NCBI
|
|
49
|
Fu C, Ma T, Zhou L, Mi QS and Jiang A:
Dendritic cell-based vaccines against cancer: Challenges, advances
and future opportunities. Immunol Invest. 51:2133–2158. 2022.
View Article : Google Scholar : PubMed/NCBI
|
|
50
|
He J, Fu Z, Zou B, Lei X, Lei L, Yang Q
and Li G: Identification the cellular senescence associated lncRNA
LINC01579 in gastric cancer. J Cell Mol Med. 29:e703602025.
View Article : Google Scholar : PubMed/NCBI
|
|
51
|
Ding X, Zhang Y and You S: A novel
prognostic model based on telomere-related lncRNAs in gastric
cancer. Transl Cancer Res. 13:4608–4624. 2024. View Article : Google Scholar : PubMed/NCBI
|
|
52
|
Lei Q, Fan BF, Zhu XR, Cui BW, Kong JX, Ma
ZR, Xie XQ and Wang WW: Immune infiltration and drug treatment
response of angiogenesis-related LncRNA in lung adenocarcinoma.
Medicine (Baltimore). 104:e429582025. View Article : Google Scholar : PubMed/NCBI
|
|
53
|
Ma Y, Sun Y, Zhao X, Li J, Fu X, Gong T
and Zhang X: Identification of m5C-related lncRNAs signature to
predict prognosis and therapeutic responses in esophageal squamous
cell carcinoma patients. Sci Rep. 13:144992023. View Article : Google Scholar : PubMed/NCBI
|