Introduction
Pancreatic ductal adenocarcinoma (PDAC) is one of
the most aggressive solid malignancies, with an overall 5-year
survival rate of ~13% in the United States (1,2).
Global epidemiological analyses project PDAC to surpass breast and
colorectal cancer as the second-leading cause of cancer mortality
by 2030 (3). While surgical
resection with adjuvant fluorouracil- or gemcitabine-based regimens
remains the cornerstone for localized disease, >80% of patients
present with unresectable tumors at diagnosis (4). The intractability of PDAC is driven by
immunosuppressive stroma, early perineural and vascular metastasis,
and rapid development of chemoresistance (5). These factors collectively contribute
to PDAC retaining the lowest 5-year relative survival rate among
solid tumors, with minimal improvement despite advances in
precision medicine.
G protein-coupled receptors (GPCRs) represent the
most successful class of druggable targets in biomedicine, with
>100 FDA-approved therapeutics modulating GPCR activity
(6,7). GPCRs transduce extracellular signals
into intracellular responses by activating downstream signaling and
transcriptional networks. Their dysregulation drives
tumor-promoting processes, including chronic inflammation,
metastasis, immune evasion, angiogenesis and chemoresistance
(8). Notably, the Rho/ROCK/F-actin
pathway, a conserved downstream effector of GPCR activation, serves
as a key mechanistic bridge to the Hippo pathway (9). This signaling nexus directly couples
GPCR stimulation to the nuclear translocation and transcriptional
activity of YAP1.
YAP1, a conserved transcriptional coactivator
downstream of the Hippo signaling pathway, orchestrates fundamental
physiological processes including cell proliferation, tissue
regeneration and organ size control in mammals (10). While oncogenic KRAS mutations
initiate >90% of PDAC, previous evidence reveals that the
transcriptional coactivator YAP1 not only amplifies KRAS-driven
tumor progression through feedforward signaling loops, but also
enables KRAS-independent survival upon therapeutic KRAS suppression
(11,12). This functional redundancy
underscores a key vulnerability in PDAC biology: Tumors exploit
YAP1-mediated transcriptional reprogramming to bypass targeted KRAS
inhibition, thereby sustaining proliferation and chemoresistance
(13). Thus, delineating the
GPCR-YAP1 regulatory axis could inform innovative treatment
strategies for this intractable malignancy.
Given the roles of GPCR signaling and YAP1-mediated
mechanotransduction in PDAC pathogenesis, the present study aims to
elucidate the functional interplay between the GPCR HRH1 and YAP1.
We hypothesize that an HRH1-YAP1 regulatory axis underpins tumor
progression and therapeutic resistance in PDAC. To elucidate this
putative axis, we integrate multi-omics analyses of TCGA, ICGC, and
GEO cohorts with experimental validation in cell lines.
Furthermore, we employ Mendelian randomization to assess the causal
link between HRH1 inhibition and PDAC risk. The present study aimed
to construct a machine learning-based prognostic model for refined
patient stratification.
Materials and methods
Dataset acquisition
To systematically identify GPCRs associated with
pancreatic cancer prognosis, the present study integrated multiple
genomic resources. GPCR-related genes were curated from
WikiPathways (IDs: WP24, WP58, WP80, WP117, WP247, WP334, WP455,
WP501; www.wikipathways.org), while
prognostic genes and highly expressed transcripts in pancreatic
adenocarcinoma were retrieved from UALCAN (https://ualcan.path.uab.edu) and GEPIA2 (http://gepia2.cancer-pku.cn), respectively (Table SI, Table SII, Table SIII). Transcriptomic profiles (TPM
format), clinical information and somatic mutation data for 178
patients with pancreatic cancer were acquired from TCGA-PAAD cohort
using the ‘TCGAbiolinks’ R package (version 2.36.0;
bioconductor.org/). ‘TCGAvisualize_oncoprint’ function was employed
to generate a heatmap illustrating gene mutation frequencies. For
independent validation, RNA-seq data and clinical records from the
PACA-AU cohort were retrieved from the ICGC database (https://dcc.icgc.org). Raw read counts were converted
to TPM values using the ‘count2tpm’ function in the ‘IOBR’ package
(version 0.99.9; github.com/). Additionally, two microarray
datasets (GSE28735 and GSE183795) based on the GPL6244 platform
were incorporated to assess the predictive performance of the model
(14,15). Clinical metadata and RMA-normalized
expression matrices were downloaded from the GEO data portal
(https://www.ncbi.nlm.nih.gov/geo). To
ensure data comparability, the present study applied rigorous
harmonization procedures. All transcriptomic data were
log2-transformed [log2(x+1)]. For batch effect correction, the
present study used the ComBat algorithm as implemented in the sva R
package (v3.56.0, Bioconductor). Specifically, microarray datasets
(GSE28735 and GSE183795) were based on RMA-normalized expression
matrices, while RNA-seq data from TCGA and ICGC were converted to
TPM (Transcripts Per Million) format before log2 transformation and
batch correction.
To evaluate the expression profiles of HRH1 in
matched tumor and adjacent non-tumor tissue samples, bulk RNA-seq
datasets were retrieved from the GEO and ArrayExpress (https://www.ebi.ac.uk/biostudies/arrayexpress)
databases, including GSE183795 (85 pairs), GSE62452 (42 pairs),
GSE15471 (35 pairs), GSE101448 (18 pairs), GSE16515 (15 pairs),
GSE196009 (6 pairs) and E-MTAB-6690 (65 pairs) (14,16–21).
Additionally, transcriptomic data from GSE26088 were analyzed to
evaluate HRH1 expression across 19 pancreatic cancer cell lines and
one normal pancreatic ductal epithelial cell line (HPDE). PL5, also
called Panc 04.03, is a pancreatic cancer cell line (https://www.ncbi.nlm.nih.gov/geo/query/acc.cgi?acc=GSM640500;
http://www.cellosaurus.org/CVCL_1636). To investigate
the regulatory relationship between YAP1 and HRH1 across diverse
cancer types, transcriptomic datasets from the GEO were utilized,
specifically: Human endothelial cells (GSE211726), breast cancer
(GSE59232), neuroblastoma (GSE130401), liver cancer (GSE137915) and
renal clear cell carcinoma (GSE146354) (22–25).
For single-cell resolution analysis, the CRA001160 dataset
containing both normal and pancreatic cancer tissues was employed
to compare HRH1 expression across distinct cell populations.
Single-cell RNA sequencing data were analyzed with Seurat (v5.3.0;
Bioconductor) in R, employing analytical approaches consistent with
established protocols (26). Gene
expression levels were quantified based on mean unique molecular
identifier (UMI) counts.
Tumor mutational burden (TMB) calculation.
TMB was calculated using somatic mutation data derived from
whole-exome sequencing. Specifically, the present study retrieved
the harmonized masked somatic mutation data from TCGA database via
the ‘TCGAbiolinks’ R package. To compute TMB, the present study
first filtered the mutation annotation format file to retain only
protein-altering somatic variants, including missense, non-sense,
splice-site and frameshift indel mutations. Variants classified as
germline, silent or located in non-coding regions were excluded.
TMB was defined as the total number of qualifying somatic mutations
divided by the effective coding region size. Given that TCGA exome
capture kits cover ~38 Mb of the coding genome, the present study
used this value as the denominator, consistent with prior
TCGA-based TMB studies (27,28).
TMB values are reported in units of mutations per megabase
(mut/Mb), with TMB-high cases defined as those exhibiting ≥ 10
muts/Mb (29).
Two-sample Mendelian randomization analysis.
‘TwoSampleMR’ package (version 0.6.14) from the Comprehensive R
Archive Network (CRAN, cran.r-project.org/) was used to investigate
potential causal relationships between exposure to fexofenadine
therapy (GWAS ID: ukb-b-10433; UK Biobank, http://www.ukbiobank.ac.uk/) and pancreatic cancer
(GWAS ID: ebi-a-GCST90018893; GWAS Catalog, http://www.ebi.ac.uk/gwas/). Fexofenadine therapy
served as the exposure variable. Instrumental variables (IVs) were
initially selected using a significance threshold of
P<4.5×10⁻⁵. To mitigate the effects of linkage
disequilibrium, IV clumping was performed with an r2
threshold of 0.001 and a clumping distance cut-off of 10,000
kilobases. Weak IVs, characterized by an F-statistic <10, were
subsequently excluded. Given the established associations of
obesity, smoking and alcohol consumption with pancreatic cancer
risk, IVs potentially associated with these confounding factors
were identified through association queries in the GeneAtlas
database (geneatlas.roslin.ed.ac.uk/) and subsequently excluded
(5). The inverse-variance weighted
(IVW) method served as the primary Mendelian randomization (MR)
analysis. Secondary MR analyses employed the following methods:
MR-Egger regression, weighted median, weighted mode and simple
mode. Pleiotropy was assessed using the MR-Egger intercept test.
Sensitivity analyses included leave-one-out validation and
Cochran's Q statistic to evaluate the heterogeneity among
single-nucleotide polymorphisms (SNPs).
Cell culture and transfection
The non-cancerous control cell line hTERT-HPNE
(Zhejiang Meisen Cell Technology Co., Ltd.) was cultured in
complete DMEM at 37°C within a humidified atmosphere containing 5%
CO2. The present study obtained all cell culture media,
FBS and PDAC cell lines from Procell Life Science & Technology
Co., Ltd. Cell lines were cultured under standardized conditions:
ASPC1 and BXPC3 in RPMI 1640, CFPAC1 in Iscove's Modified
Dulbecco's Medium (IMDM), while PANC1, MIAPaCa-2, Capan-2 and
SW1990 were propagated in DMEM.
To knock down target gene expression, transient
transfection of siRNAs was carried out with Lipofectamine
3000® (Invitrogen; Thermo Fisher Scientific, Inc.) as
per the manufacturer's guidelines. Briefly, 20 µM siRNA duplex was
mixed with 6 µl Lipofectamine 3000 in serum-free medium and
incubated at room temperature for 15 min to form complexes. The
mixture was then added dropwise to cells seeded in 6-well plates
containing 2 ml complete growth medium. Cells were maintained at
37°C for 12 h, after which the transfection medium was replaced
with fresh complete medium. Experiments were conducted 48 h
post-transfection to allow sufficient knockdown of target genes.
The following small interfering (si)RNA duplexes (Shanghai
GenePharma Co., Ltd.) were employed: For HRH1 silencing, i)
5′-GGACAAGUGUGAGACAGACTT-3′ (sense) and 5′-GUCUGUCUCACACUUGUCCTT-3′
(antisense); ii) 5′-GCUCUGGUUCUAUGCCAAGAU-3′ (sense) and
5′-AUCUUGGCAUAGAACCAGAGC-3′ (antisense); for YAP1 knockdown,
5′-GUCAGAGAUACUUCUUAAATT-3′ (sense) and 5′-UUUAAGAAGUAUCUCUGACTT-3′
(antisense). A non-targeting control siRNA
(5′-UUCUCCGAACGUGUCACGUTT-3′ (sense) and
5′-ACGUGACACGUUCGGAGAAUTT-3′ (antisense) served as a negative
control.
Pharmacological modulation of HRH1
activity
Fexofenadine (cat. no. HY-B0801; MedChemExpress) was
employed as a selective HRH1 antagonist, while histamine (cat. no.
HY-B1204; MedChemExpress) served as the HRH1 agonist.
Cell proliferation assay and
cytotoxicity assay
A seeding density of 2,000 cells/well was used in
96-well plates. Following incubation at 37°C for 2 h, the culture
medium was replaced with Cell Counting Kit-8 (CCK-8; cat. no.
GK10001; GlpBio Technology) working solution (medium: CCK-8=10: 1)
and incubated for 3 h. Absorbance at 450 nm was measured at 24-h
intervals for up to 96 h.
For cytotoxicity assessment, tumor cells were seeded
at a density of 4,000 cells per well in 96-well plates and cultured
at 37°C for 24 h prior to treatment with gemcitabine. (cat. no.
GC16805; GlpBio Technology) at concentrations of 1×10⁻⁶,
1×10⁻³, 1×10⁻², 1×10-¹, 1, 10, 100, and 1,000
µM. Following 48 h of drug incubation at 37°C, optical density (OD)
signals were measured. Cell viability was calculated with the
formula: Cell viability=(OD of gemcitabine-exposed group-blank
OD)/(OD of untreated control group-blank OD). The IC50
was determined by non-linear regression analysis using GraphPad
Prism (version 9.00; GraphPad Software, Dotmatics).
Reverse transcription-quantitative PCR
(RT-qPCR)
Total RNA was extracted from cells using the Seven
RNAkey Reagent (cat. no. SM139-02; Sevenbio) and reverse
transcribed into cDNA with the Sevenbio cDNA Synthesis kit (cat.
no. SM135-02), following the manufacturer's protocol. Gene
expression analysis was performed on a 7500 Fast Real-Time PCR
System (Applied Biosystems; Thermo Fisher Scientific, Inc.) using
SYBR Green qPCR MasterMix (Sevenbio). 36B4 (RPLP0) was selected as
the internal reference gene for qPCR analysis because it exhibits
stable and consistent expression in pancreatic cancer cell lines,
which has been widely validated in pancreatic cancer gene
expression studies (30–35). CTGF (also known as CCN2) and CYR61
(also known as CCN1) are key downstream effector genes in the YAP1
signaling pathway (36). All primer
sequences provided below are presented from the 5′ to 3′direction.
The primer sequences used for qPCR were as follows: 36B4 forward
(F): GCAGCATCTACAACCCTGAAG; 36B4 reverse (R): CAC TGGCAACATTGCGGAC;
CYR61 F: CCCGTTTTGGTAGATTCTGG; CYR61 R: GCTGGAATGCAACTTCGG; CTGF F:
ACCGACTGGAAGACACGTTTG; CTGF R: CCAGGTCAGCTTCGCAAGG; ANKRD1 F:
GTGTAGCACCAGATCCATCG; ANKRD1 R: CGGTGAGACTGAACCGCTAT; YAP1 F:
CAGACAGTGGACTAAGCATGAG; YAP1 R: CAGGGTGCTTTGGTTGATAGT A; HRH1 F:
GCTGGGCTACATCAACTCCAC; HRH1 R: CCCTTAGGAGCGAATATGCAGAA. The
thermocycling conditions were 95°C for 30 sec (initial
denaturation), followed by 40 cycles of 95°C for 10 sec
(denaturation) and 60°C for 30 sec (annealing/extension).
Fluorescence signals were collected during the annealing/extension
step. Relative gene expression levels were quantified using the
2−ΔΔCq method, with normalization to the internal
reference gene 36B4 to minimize experimental variability (37).
Western blot analysis
Western blotting was performed according to
established protocols (38).
Briefly, cells were lysed using RIPA buffer (cat. no. SW104-02;
Sevenbio) followed by sonication using a JY92-IIN ultrasonic cell
disruptor (Ningbo Scientz Biotechnology Co., Ltd.) on ice at 20–25
kHz, 30% output power with cycles of 3 sec pulse and 3 sec
interval, repeated for a total of 3 cycles to minimize protein
denaturation. The resulting supernatants were collected, quantified
using the BCA assay (Sevenbio), and denatured with 5× loading
buffer (Beyotime Biotechnology). Protein samples containing 20 µg
of total protein per lane were separated by SDS-PAGE using 7.5%
polyacrylamide resolving gels. Following electrophoresis and
transfer, PVDF membranes (MilliporeSigma) were blocked with 5%
non-fat milk at room temperature for 2 h, then incubated with
primary antibodies overnight at 4°C. Primary antibodies against
YAP1 (1:10,000; cat no. 13584-1-AP) and β-actin (1:10,000; cat no.
66009-1-Ig) were purchased from Proteintech Group, Inc., with
β-actin used as the loading control for normalization. After
washing, the membranes were incubated for 2 h at room temperature
with the appropriate HRP-conjugated secondary antibody (Proteintech
Group, Inc.) diluted 1:100,000. Specifically, goat anti-mouse IgG
(cat. no. SA00001-1) was used for mouse primary antibodies, while
goat anti-rabbit IgG (cat. no. SA00001-2) was employed for rabbit
primary antibodies. This was followed by protein band detection
using an enhanced chemiluminescence detection kit from Beyotime
Biotechnology and imaging with the ImageQuant 800 system
(Cytiva).
ChIP-Atlas database analysis
Here, YAP1 ChIP-seq, H3K4me3, H3K27ac and ATAC-seq
datasets were retrieved from the ChIP-Atlas database
(chip-atlas.org/) to investigate the binding sites of YAP1 at the
HRH1 promoter region. Based on the GENCODE database (GRCh38
assembly; http://www.gencodegenes.org/human/), the HRH1 RefSeq
sequence is located on chromosome 3 at position
11,154,493-11,263,557 (https://genome.ucsc.edu/cgi-bin/hgSearch?search=HRH1&db=hg38).
The downloaded BigWig files were visualized using the ‘Integrative
Genomics Viewer’ (IGV; version 2.19.4; Broad Institute), with
detailed dataset identifiers and download links provided in
Table SIV. Since the ChIP-seq data
presented in the present study were obtained exclusively from the
ChIP-Atlas database, none of the cell lines were cultured or
experimentally manipulated in the present study. Notably, the
‘PCa3’ in Table SIV refers to
patient-derived prostate cancer organoids, which are
well-characterized models derived from advanced prostate cancer
metastases (39,40). Their genomic characterization (copy
number alterations, mutations) and functional data are publicly
accessible via the MSKCC cBioportal (http://www.cbioportal.org) and the NCBI PMC repository
(pmc.ncbi.nlm.nih.gov/articles/PMC4237931/).
Enrichment analysis
Pathway enrichment patterns were evaluated through
GSEA implemented in the clusterProfiler R package (version 4.16.0;
Bioconductor), analyzing transcriptomic data from TCGA-PAAD cohort
(41). The Molecular Signatures
Database was utilized to acquire predefined gene signatures,
specifically the Cordenonsi_YAP_Conserved (M2871) and YAP1_UP
(M2845) gene sets. Patients were stratified into high- and
low-expression groups based on HRH1 levels and differentially
expressed genes (DEGs) were identified using the ‘limma’ package
(version 3.21, Bioconductor). The false discovery rate (FDR) was
used for multiple-testing correction, with thresholds of
FDR<0.05 and |log2FC|>1. Functional annotation of DEGs was
conducted using Metascape (https://metascape.org/) to elucidate enriched
biological pathways.
Chemotherapy response prediction
To predict chemosensitivity in TCGA-PAAD cohort, the
present study employed the ‘oncoPredict’ R package (version 1.2;
CRAN), a computational tool that integrates genomic features with
drug response profiles (42).
Training data were derived from the Cancer Cell Line Encyclopedia
(CCLE; http://sites.broadinstitute.org/ccle/) and the Cancer
Therapeutics Response Portal (CTRP; http://portals.broadinstitute.org/ctrp/), enabling the
calculation of chemotherapy resistance scores for each patient.
Tumor microenvironment (TME)
characterization and immunotherapy response prediction
The cellular composition of the TME was analyzed
using the ‘deconvo_tme’ function within the ‘IOBR’ R package
(43). This module integrates six
well-established, publicly available deconvolution algorithms for
the inference of cellular abundances from bulk transcriptomic data:
CIBERSORT, MCP-counter, EPIC, xCell, quantTIseq and TIMER (44–49).
Furthermore, ssGSEA was performed to compute
cellular enrichment scores for each patient using the
‘calculate_sig_score’ algorithm (50). Gene reference sets utilized for
ssGSEA quantification were derived from authoritative literature
(51–55). The TIDE computational method was
employed to calculate the Immune Checkpoint Inhibitor (ICI)
resistance score (55). Patients
exhibiting high TIDE scores demonstrate susceptibility to immune
evasion and exhibit lower response rates to immunotherapy.
Machine learning-based prognostic
model construction
To develop a robust and generalizable prognostic
signature, the present study utilized the OmniLearn R package,
which facilitates automated model construction across distinct
machine learning algorithms (https://github.com/Feng-Rommel/OmniLearn). In line
with previous reports (56), the
present study implemented 101 specific algorithmic configurations
(Table SV) to establish the
prognostic model. These configurations were derived from 10 core
survival modeling methods: Random Survival Forest (RSF), CoxBoost,
stepwise Cox regression, Lasso, Ridge, Elastic Net (Enet), Survival
Support Vector Machines (survival-SVM), Generalized Boosted
Regression Modeling (GBM), Supervised Principal Components
(SuperPC) and Partial Least Squares Cox regression (plsRcox).
Models were established using single algorithms or paired
combinations. In the combined strategy, genes were initially
screened using the ‘RunML’ function (mode: ‘Variable’). Algorithms
yielding <3 candidate features were excluded from further
modeling, while those with ≥3 features proceeded to model
construction using the ‘RunML’ function (mode: ‘Model’).
Single-method models were constructed directly using the ‘RunML’
function (mode: ‘Model’).
Specific parameter settings for these ten core
algorithms are described below. For stepwise Cox regression, all
three directionality strategies (‘forward’, ‘backward’ and ‘both’)
were tested. Penalized regression models (Lasso, Ridge, Enet) were
fitted using the ‘glmnet’ package via the ‘cv.glmnet’ function,
with the regularization parameter λ tuned through 10-fold
cross-validation (CV). The elastic net mixing parameter α was
systematically swept from 0 to 1 in increments of 0.1 (α=0: Ridge;
α=1: Lasso; 0<α <1: Enet). Survival-SVM was implemented using
the ‘survivalsvm’ package. GBM models were trained with the ‘gbm’
package under ten-fold CV. SuperPC, an extension of PCA adapted for
survival outcomes, was executed via the ‘superpc’ package, with
tuning performed using the ‘superpc.cv’ function (ten-fold CV). The
plsRcox model was optimized using the ‘cv.plsRcox’ function from
the ‘plsRcox’ package. Finally, RSF was implemented with the
‘randomForestSRC’ package using the ‘rfsrc’ function, fixing ntree
to 500 and nodesize to 5 based on empirical validation to balance
computational efficiency and predictive stability.
Following the construction of distinct prognostic
models using TCGA-PAAD dataset (n=178) as the training set, risk
scores for both the training cohort (TCGA-PAAD) and an external
validation cohort (ICGC-PACA-AU; n=95) were calculated using the
‘CalPredictScore’ function. Subsequently, model performance was
evaluated by computing the C-index via the ‘RunEval’ function. To
ensure robustness, the optimal model was selected based on the
highest mean C-index across both TCGA-PAAD and ICGC-PACA-AU
cohorts. Finally, two microarray datasets (GSE28735 and GSE183795)
were merged to constitute an additional external validation set
(14,15). Time-dependent calibration was
assessed using the Brier score at 1–4 years via the ‘pec’ package
(Version 2025.06.24). This machine learning framework enables
unbiased identification of robust prognostic biomarkers while
mitigating overfitting through ensemble-based feature
selection.
Statistical analysis
Uni- and multivariate Cox proportional hazards
regression analyses, Kaplan-Meier (KM) curve generation and
log-rank testing for survival differences were performed using the
‘survival’ (version 3.8–3; CRAN) and ‘survminer’ (version 0.5.1;
CRAN) packages. Principal component analysis (PCA) was implemented
via the ‘stats’ package and time-dependent receiver operating
characteristic (ROC) evaluation was conducted using the ‘timeROC’
package (version 0.4; CRAN). For comparisons involving only two
groups, unpaired Student's t-test or the Wilcoxon rank-sum test was
used, as appropriate. When a single control group was compared
against multiple treatment groups, statistical significance was
assessed by one-way ANOVA followed by Dunnett's post hoc test. The
correlation between two variables was investigated using a
non-parametric Spearman test. All statistical tests are two-tailed.
Data from experiments are presented as mean ± standard deviation
(SD). All statistical analyses were performed in R (version 4.5.1),
and P<0.05 was considered to indicate a statistically
significant difference.
Results
Expression and prognostic significance
of HRH1 in pancreatic cancer
To identify potential therapeutic targets for PDAC,
the present study intersected three gene sets: 381 GPCR genes,
1,285 genes significantly associated with prognosis (log-rank
P<0.01) in TCGA-PAAD cohort and 2,456 genes markedly upregulated
(log2FC >2) in PDAC from the same cohort. This analysis yielded
two candidate genes, GPRC5A and HRH1 (Fig. 1A). Due to the lack of specific
pharmacological agents targeting GPRC5A, HRH1 was chosen as the
main focus of this investigation because it has targeted inhibitors
(57).
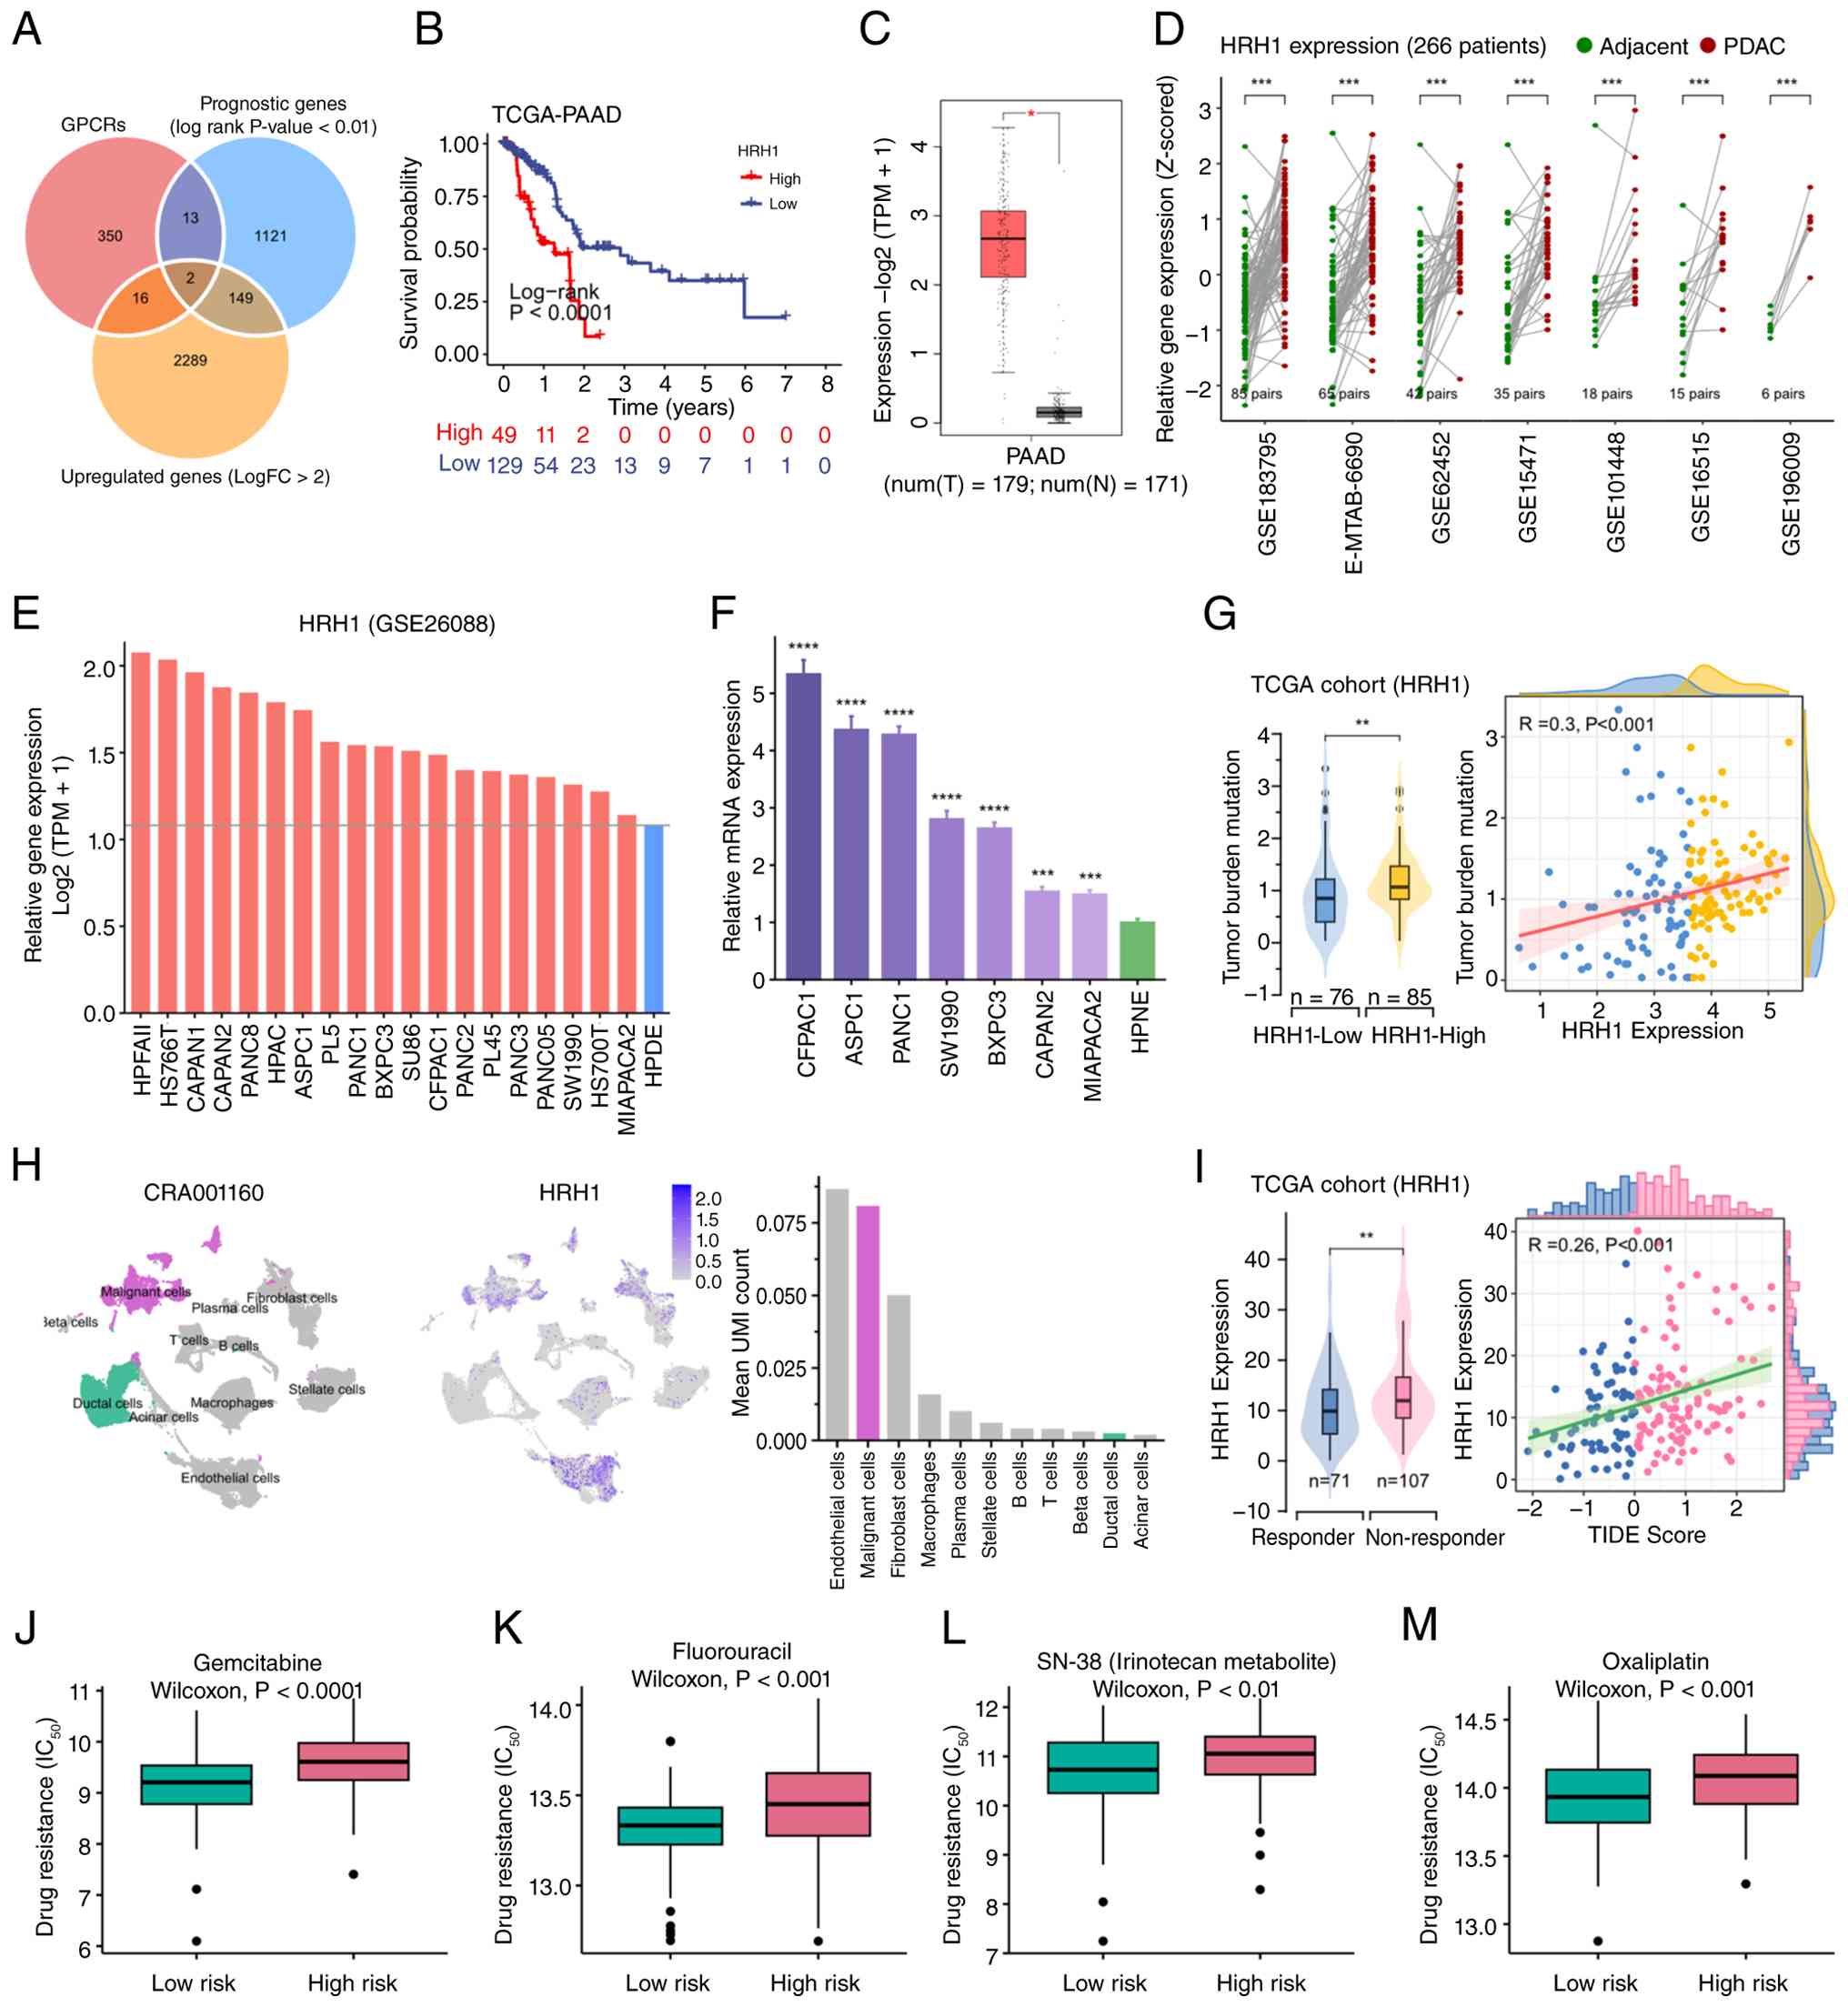 | Figure 1.HRH1 is associated with prognosis,
chemotherapy resistance and immunotherapy resistance in PDAC. (A)
Venn analysis identified GPCR-related genes that are highly
expressed and associated with prognosis in PDAC. (B) Kaplan-Meier
analysis indicated the prognostic value of HRH1. (C) Online
analysis using the GEPIA2 database showed HRH1 expression in
pancreatic cancer and normal tissue (one-way ANOVA; *P<0.05).
(D) HRH1 expression in tumor tissues and matched adjacent normal
tissues. Data were obtained from 266 patients across seven cohorts
(Wilcoxon rank-sum test; ***P<0.001). (E) Sequencing data from
GSE26088 revealed that HRH1 expression was higher in 19 pancreatic
cancer cell lines when compared with the normal pancreatic cell
line (HPDE). (F) Reverse transcription quantitative-PCR analysis of
HRH1 expression. Each of the 7 PDAC cell lines was compared with
the control HPNE cell line. Statistical significance was assessed
by one-way ANOVA followed by Dunnett's post hoc test
(****P<0.0001; ***P<0.001). (G) Relationship between HRH1
expression and tumor mutation burden (Wilcoxon rank-sum test;
**P<0.01). (H) In the CRA001160 dataset, HRH1 expression across
different cell types, displayed using UMAP plot, feature plot and
bar plot reflecting mean UMI count. (I) Relationship between HRH1
expression and TIDE score (Wilcoxon rank-sum test, **P<0.01).
Association between HRH1 expression and resistance to (J)
Gemcitabine, (K) Fluorouracil, (L) SN-38 and (M) Oxaliplatin.
Statistical comparisons were performed using the Wilcoxon rank-sum
test. GPCRs, G protein-coupled receptors; PDAC, pancreatic ductal
adenocarcinoma; UMAP, Uniform Manifold Approximation and
Projection. |
KM analysis in TCGA-PAAD cohort revealed that high
expression of HRH1 was significantly associated with unfavorable
overall survival (Fig. 1B). Both
univariate and multivariate Cox regression analyses further
identified HRH1 as an independent prognostic factor in pancreatic
cancer (Fig. S1). Analysis using
the GEPIA2 online platform confirmed significant overexpression of
HRH1 in PDAC samples (Fig. 1C).
Moreover, bulk RNA sequencing of 266 matched patient samples across
seven independent cohorts demonstrated consistently higher HRH1
expression in tumor tissues relative to adjacent non-tumor
counterparts (Fig. 1D). Analysis of
the GSE26088 dataset revealed that HRH1 expression was elevated
across 19 pancreatic cancer cell lines relative to the normal
pancreatic ductal epithelial cell line HPDE (Fig. 1E). qPCR validated increased HRH1
expression in seven PDAC cell lines compared with the non-cancerous
HPNE cell line (Fig. 1F). At
single-cell resolution, malignant cells exhibited higher average
UMI counts for HRH1 than normal ductal cells (Fig. 1H).
HRH1 as a druggable vulnerability in
PDAC
TMB analysis suggested a positive association
between high HRH1 expression and increased mutation load (Fig. 1G). Evaluation using the ‘TIDE’
algorithm revealed a positive association between HRH1 expression
and TIDE score, implying that high HRH1 expression may be
associated with diminished ICI efficacy (Fig. 1I). Additionally, chemoresistance
prediction analysis indicated that high HRH1 expression (stratified
by median expression) was associated with resistance to multiple
chemotherapeutic agents, including gemcitabine, fluorouracil,
SN-38, oxaliplatin, doxorubicin, platinum-based drugs, mitomycin
and vincristine (Figs. 1J-M,
S2).
To further investigate the potential therapeutic
relevance of HRH1 in PDAC, the present study performed MR analysis.
The IVW method indicated that fexofenadine treatment is associated
with a reduced risk of pancreatic cancer (OR=1.71×10⁻²⁰;
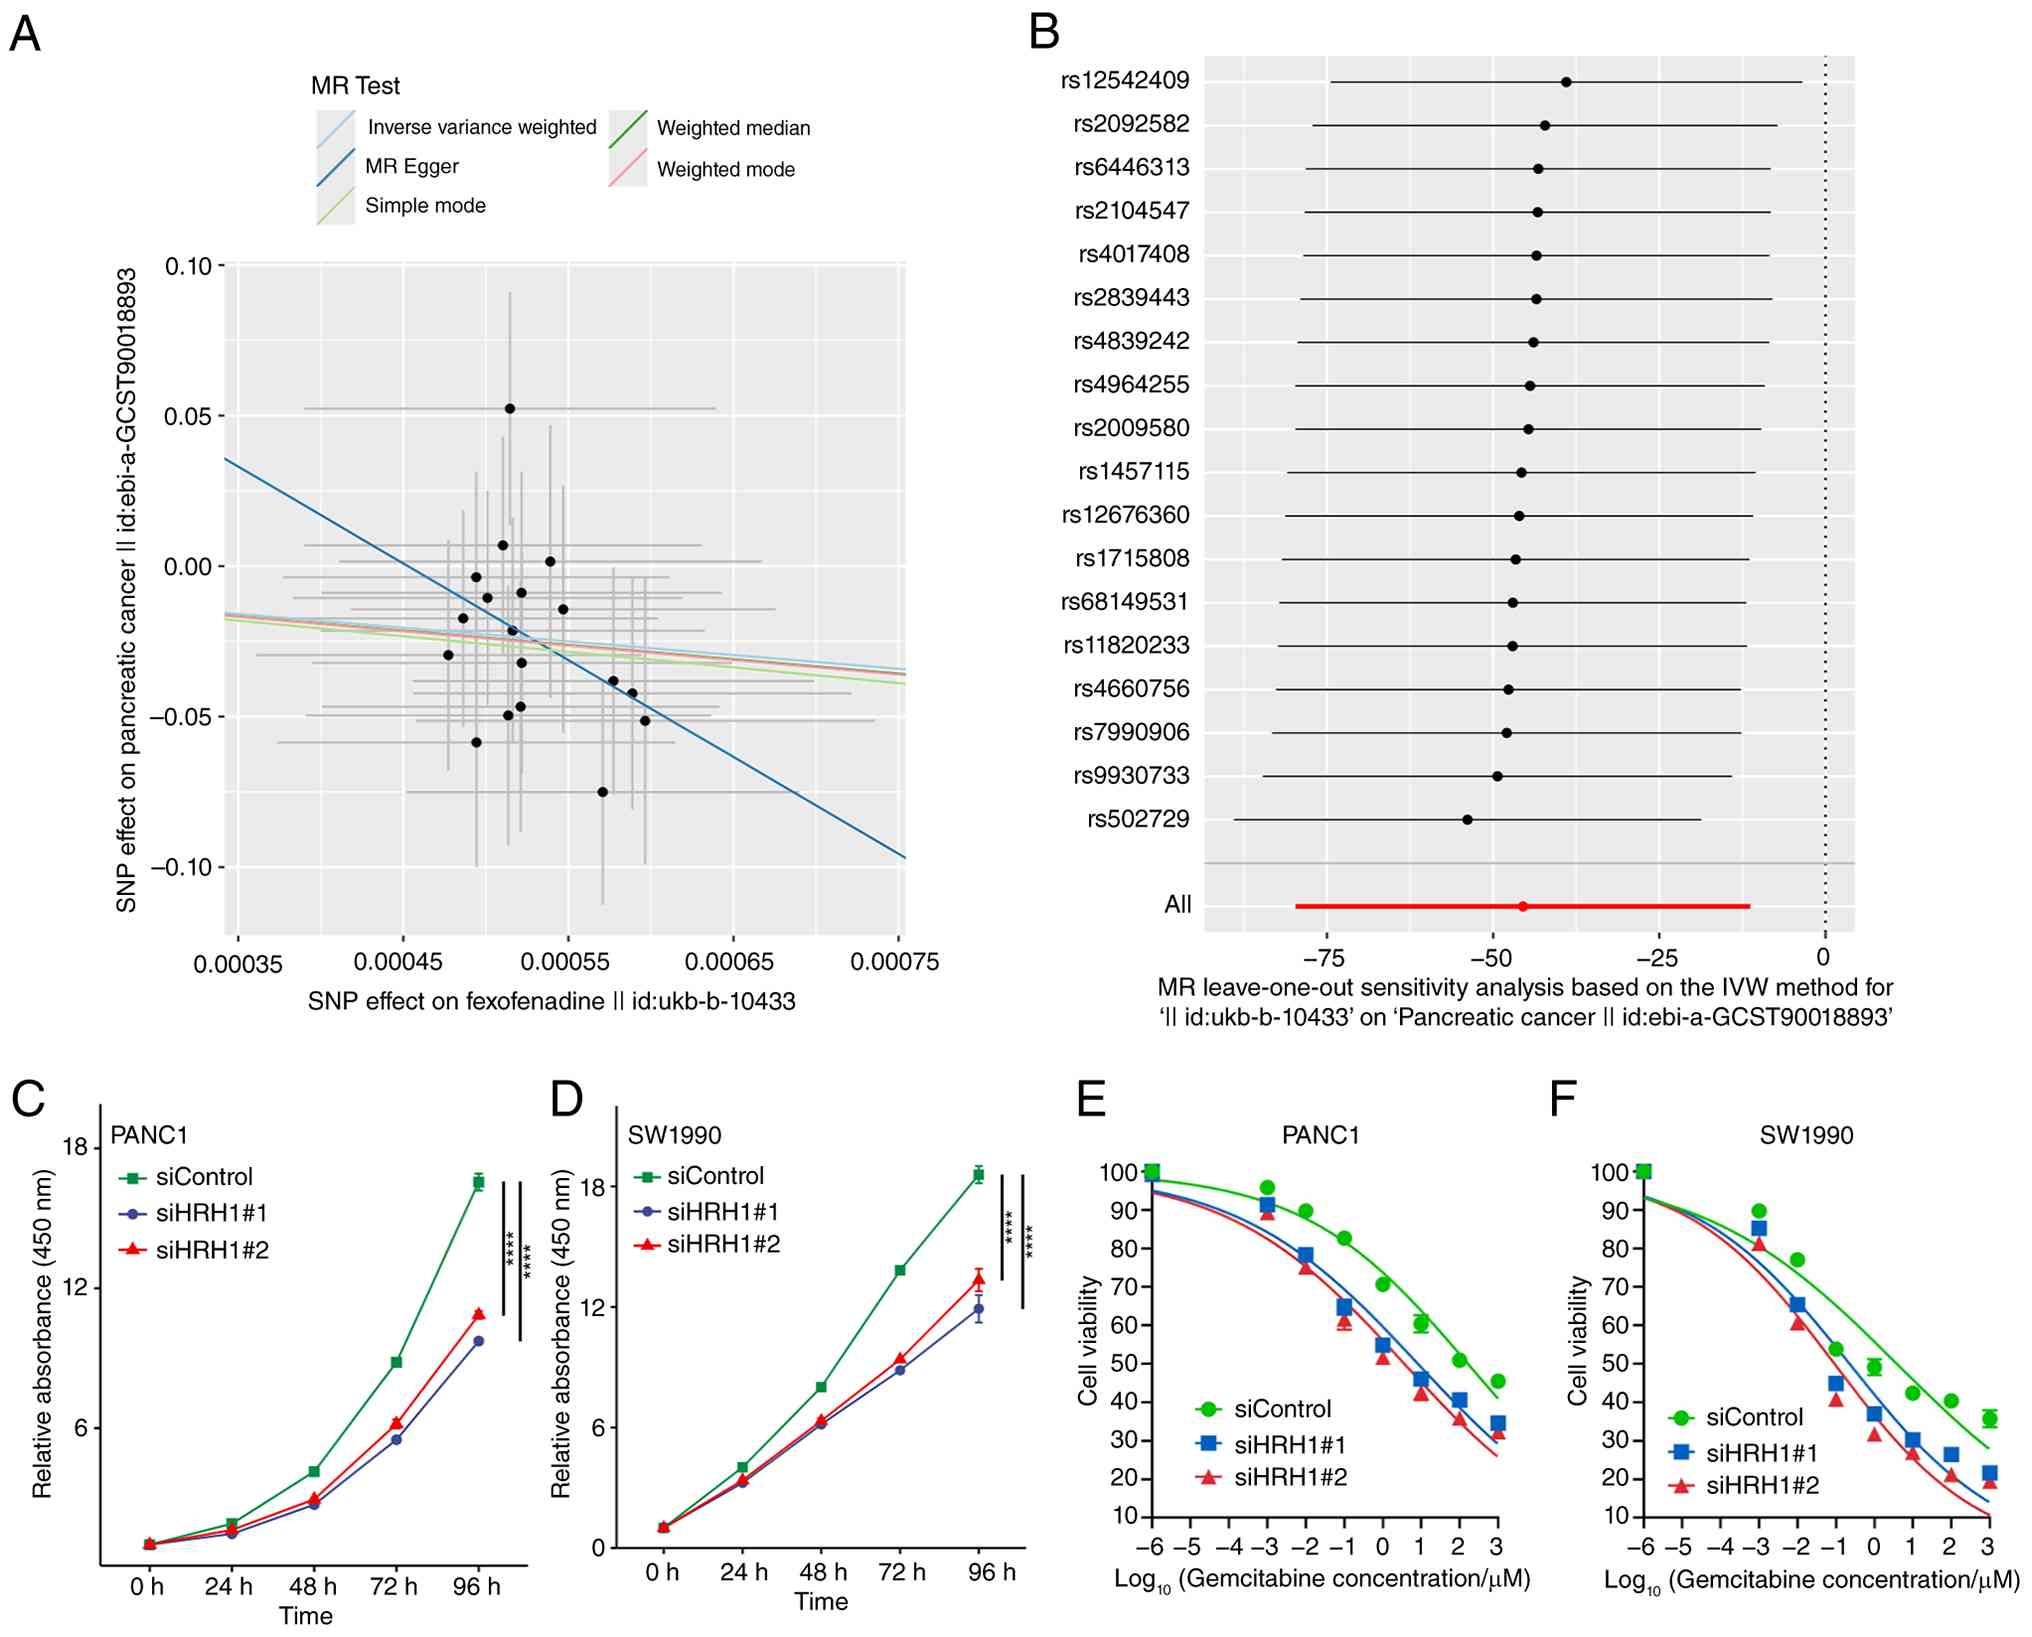
Figs. 2A, 3A; Table
SVI). Leave-one-out sensitivity analysis confirmed the
robustness of these findings (Fig.
2B). The analysis showed no significant heterogeneity (MR-Egger
Q=9.224) and no evidence of horizontal pleiotropy (Fig. S3B; Table SVII).
Following HRH1 knockdown using siRNA, the
proliferation of PANC-1 and SW1990 cells was inhibited compared
with control cells (Fig. 2C and D).
In PANC1 cells, silencing HRH1 enhanced sensitivity to gemcitabine
(Fig. 2E). The IC50 for
the siControl group was 163.9 µM, whereas it was markedly reduced
to 8.226 µM and 3.645 µM in the siHRH1#1 and siHRH1#2 groups,
respectively (Fig. 2E). A similar
potentiation of gemcitabine cytotoxicity was observed in SW1990
cells upon HRH1 knockdown. The IC50 value for the
siControl group was 3.827 µM, which decreased to 0.2241 µM and
0.09096 µM in the siHRH1#1 and siHRH1#2 groups, respectively
(Fig. 2F). The RT-qPCR validation
data for HRH1 knockdown efficiency are provided in Fig. 3E and F. Collectively, these results
underscore HRH1 as a promising therapeutic target in pancreatic
cancer.
Positive feedback loop between HRH1
and YAP1
To investigate the signaling pathways activated by
HRH1 in PDAC, the present study divided samples into high and low
expression groups based on the median expression of HRH1 and
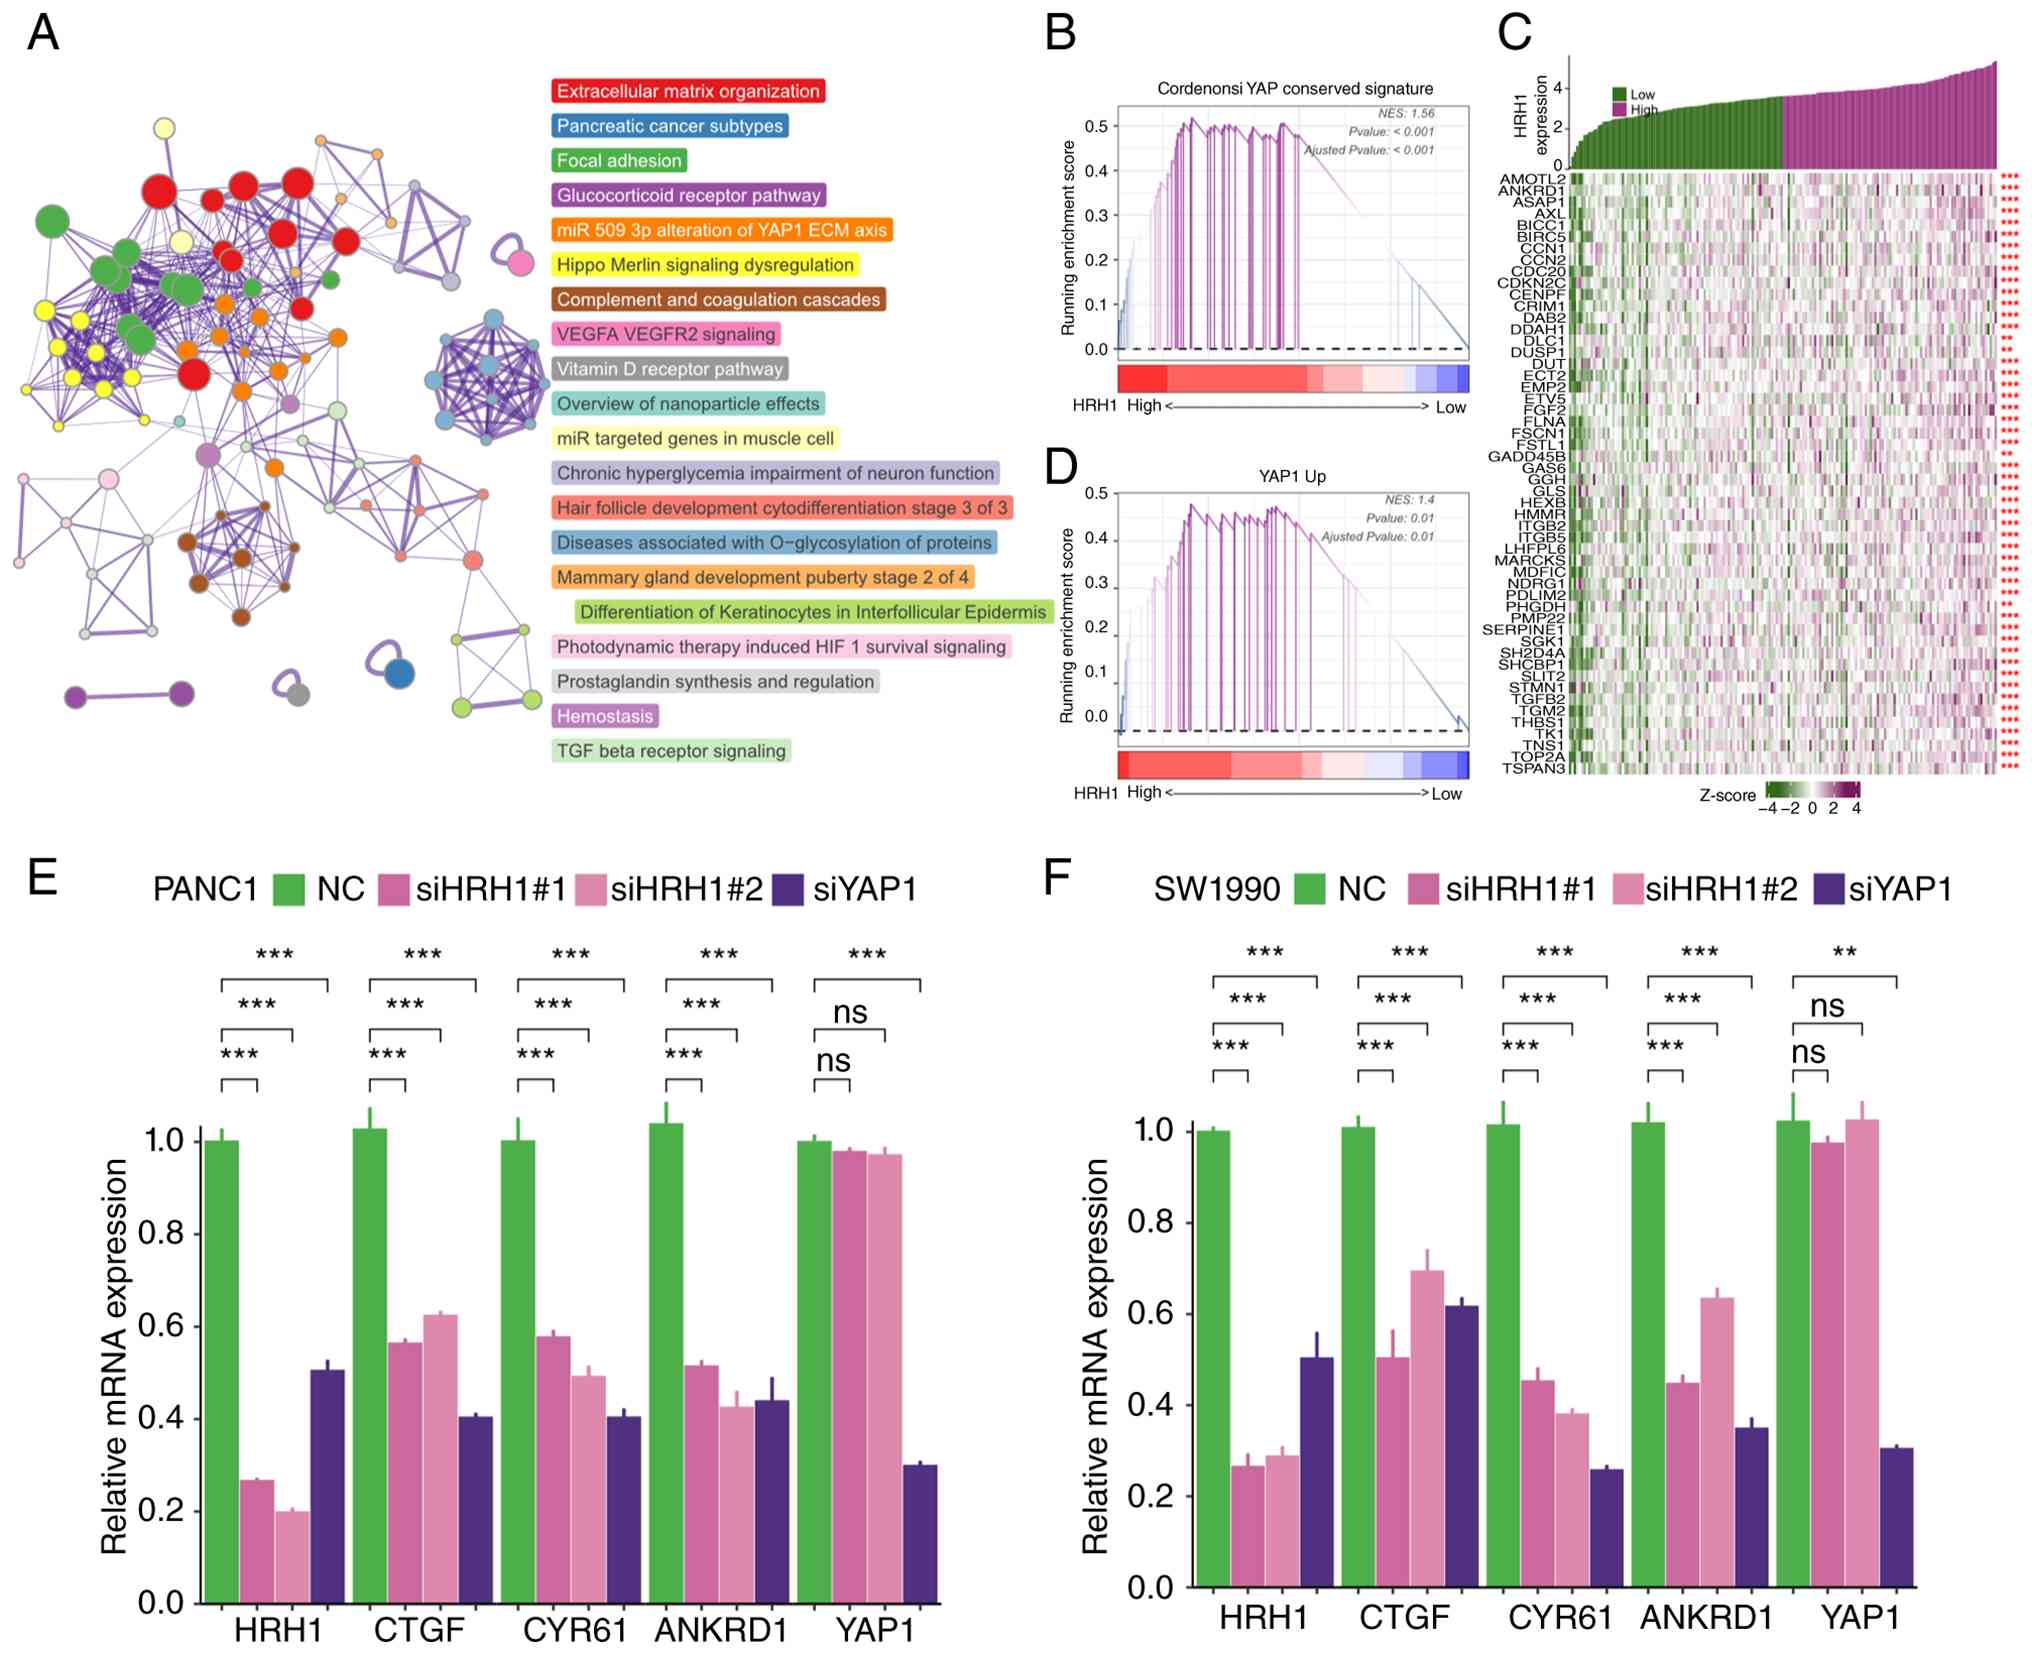
identified DEGs between the two groups. Metascape enrichment
analysis revealed that upregulated DEGs in the high HRH1 expression
group were associated with YAP1 signaling (Fig. 3A). GSEA analysis indicated a
positive correlation between HRH1 and the ‘Cordenosi YAP conserved
signature’ as well as the ‘YAP1 up signature’ (Fig. 3B and D). In TCGA-PAAD cohort, HRH1
expression showed a positive correlation with the expression of
multiple target genes of the YAP1 signaling pathway (Fig. 3C). Knockdown of HRH1 in human
endothelial cells downregulated multiple YAP1 target genes,
including CCN1 and CCN2 (Fig.
S4A). These results indicated that HRH1 promotes activation of
the YAP1 signaling pathway in endothelial cells. In PANC1 and
SW1990 cells, knockdown of HRH1 resulted in decreased expression of
CTGF, CYR61 and ANKRD1, while the transcriptional levels of YAP1
remained largely unchanged (Fig. 3E and
F), indicating that HRH1 may influence YAP1 pathway activity by
affecting YAP1 protein stability rather than its transcription in
pancreatic cancer cells. Furthermore, in breast cancer (MDA-MB-231;
GSE59232), neuroblastoma (NLF; GSE130401), liver cancer (HepG2;
GSE137915), and renal clear cell carcinoma (RCC4; GSE146354),
silencing YAP1 led to a significant decrease in HRH1 expression at
the transcriptome level (Fig.
S4B-E). Similarly, through qPCR experiments, it was confirmed
that knockdown of YAP1 in PANC1 and SW1990 cells led to decreased
expression of HRH1 mRNA (Fig. 3E and
F).
YAP1 is a transcriptional co-activator that binds to
TEA domain transcription factors (TEAD) proteins and anchors to the
promoter regions of target genes to regulate downstream expression
(58). Further analysis using
ChIP-Atlas data indicated enrichment of H3K4me3 (an active promoter
marker) and H3K27ac (an enhancer/promoter marker) in the genomic
region ~1,000 bp upstream of the HRH1 transcription start site
(59,60). This region also exhibited high
signal in ATAC-seq (open chromatin), suggesting it is likely the
promoter region of HRH1 (Fig. 4A).
YAP1 ChIP-seq data revealed peaks in the HRH1 promoter region,
indicating direct binding of YAP1 to the HRH1 promoter (Fig. 4A). In PA-TU-8902 (pancreatic cancer
cells) and PCa3 (prostate cancer cells), knockdown of YAP1 and TAZ
led to reduced chromatin accessibility in the HRH1 promoter region
(Fig. 4B). Notably, although not
all cell lines in Fig. 4A and B are
pancreatic cancer-derived, YAP1 binding to the HRH1 promoter was
consistently detected across these diverse cell types, indicating
that this regulatory mechanism is broadly active across multiple
human cancer types and not restricted to pancreatic cancer
cells.
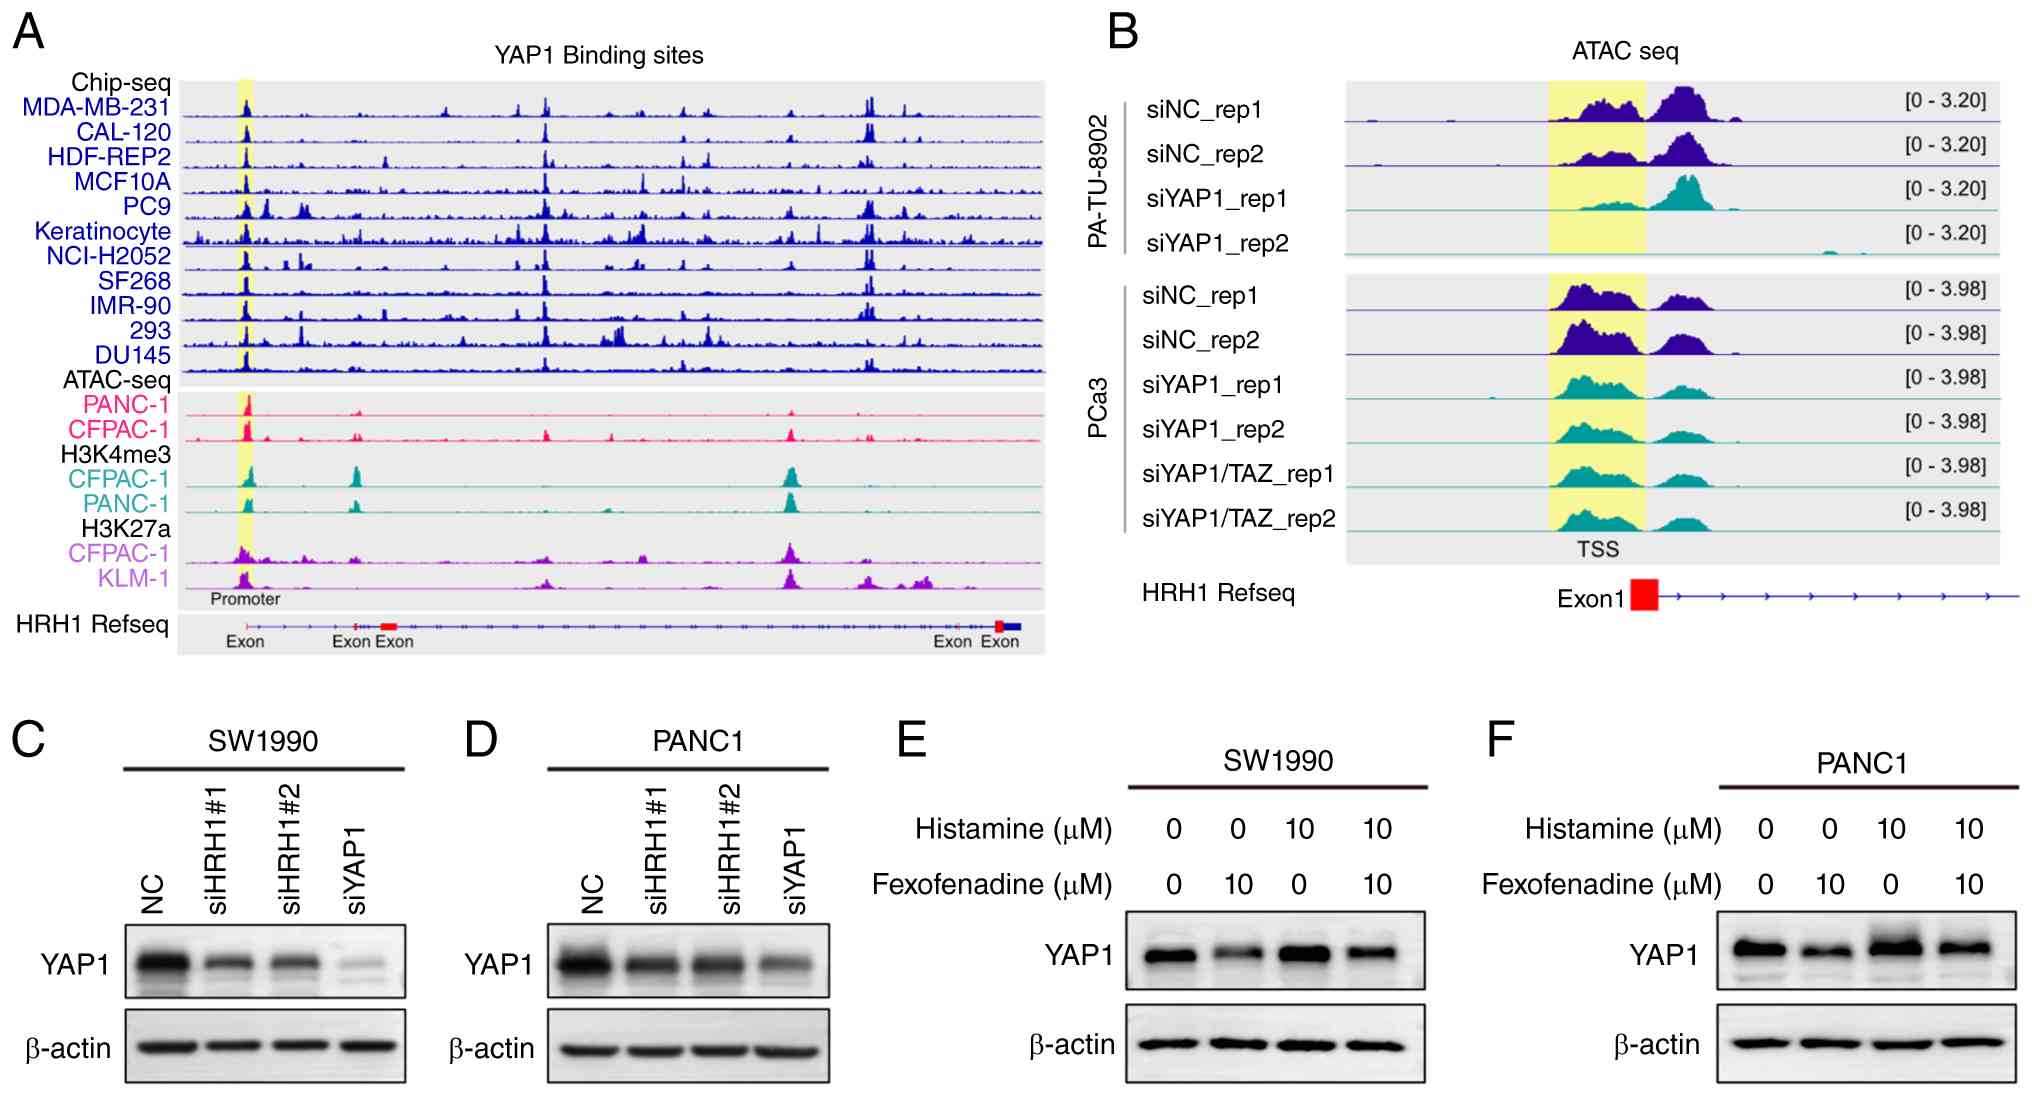 | Figure 4.The reciprocal regulation between
YAP1 and HRH1. (A) YAP1 binds to the promoter region of HRH1. The
ChIP-seq data for H3K4me3, H3K27ac and YAP1, as well as ATAC-seq
data, were obtained from the ChIP-Atlas database. (B) In PA-TU-8902
and PCa3 cells, knockdown of YAP1 and TAZ resulted in reduced
chromatin accessibility at the HRH1 promoter region. ATAC-seq data
for PA-TU-8902 and PCa3 were obtained from the ChIP-Atlas database.
Knockdown of HRH1 and YAP1 led to a marked reduction in YAP1
protein levels in (C) SW199 and (D) PANC10 cells. The observed
molecular weights of β-actin and YAP1 were ~42 and 75 kDa,
respectively. Relative YAP1 expression levels, normalized to
β-actin and the NC, are provided in Table SVIII. Treatment of (E) SW1990 and
(F) PANC1 cells with fexofenadine and histamine resulted in altered
expression of YAP1. Relative YAP1 expression levels, normalized to
β-actin and the Control group, are provided in Table SIX. si, small interfering; NC,
negative control. |
GPCR activation transmits signals through the
Rho/ROCK/F-actin pathway, thereby regulating YAP1 activity
(61). Western blot analysis showed
that knockdown of HRH1 in PANC1 and SW1990 cells decreased YAP1
protein expression levels (Fig. 4C and
D; Table SVIII). Moreover,
inhibition of HRH1 with fexofenadine decreased YAP1 expression
compared with the control group, while activation of histamine
receptors with histamine increased YAP1 expression. Co-treatment
with fexofenadine and histamine also led to decreased YAP1
expression, though to a lesser extent than with fexofenadine alone
(Fig. 4E and F; Table SIX). Taken together, these findings
indicate that HRH1 stabilizes and activates YAP1 signaling, whereas
YAP1 knockdown downregulates HRH1 transcription, potentially
through direct binding to the HRH1 promoter region.
Development of a prognostic model
based on HRH1/YAP1 signaling
Given the key role of the HRH1/YAP1 signaling axis
in pancreatic cancer, the present study employed 101 distinct
machine learning algorithms to construct prognostic models based on
HRH1, YAP1 and YAP1 downstream genes associated with HRH1
expression (listed in Fig. 3D). A
prognostic model was first constructed based on TCGA-PAAD training
cohort, and individual risk scores were then generated for patients
in both TCGA-PAAD and ICGC-PACA-AU cohorts, with the latter serving
as an independent validation set. Batch effects were removed across
different datasets (Fig. S5). The
C-index was employed as the main evaluation metric to determine the
model's predictive performance, reflecting the likelihood of
agreement between model predictions and actual observed outcomes.
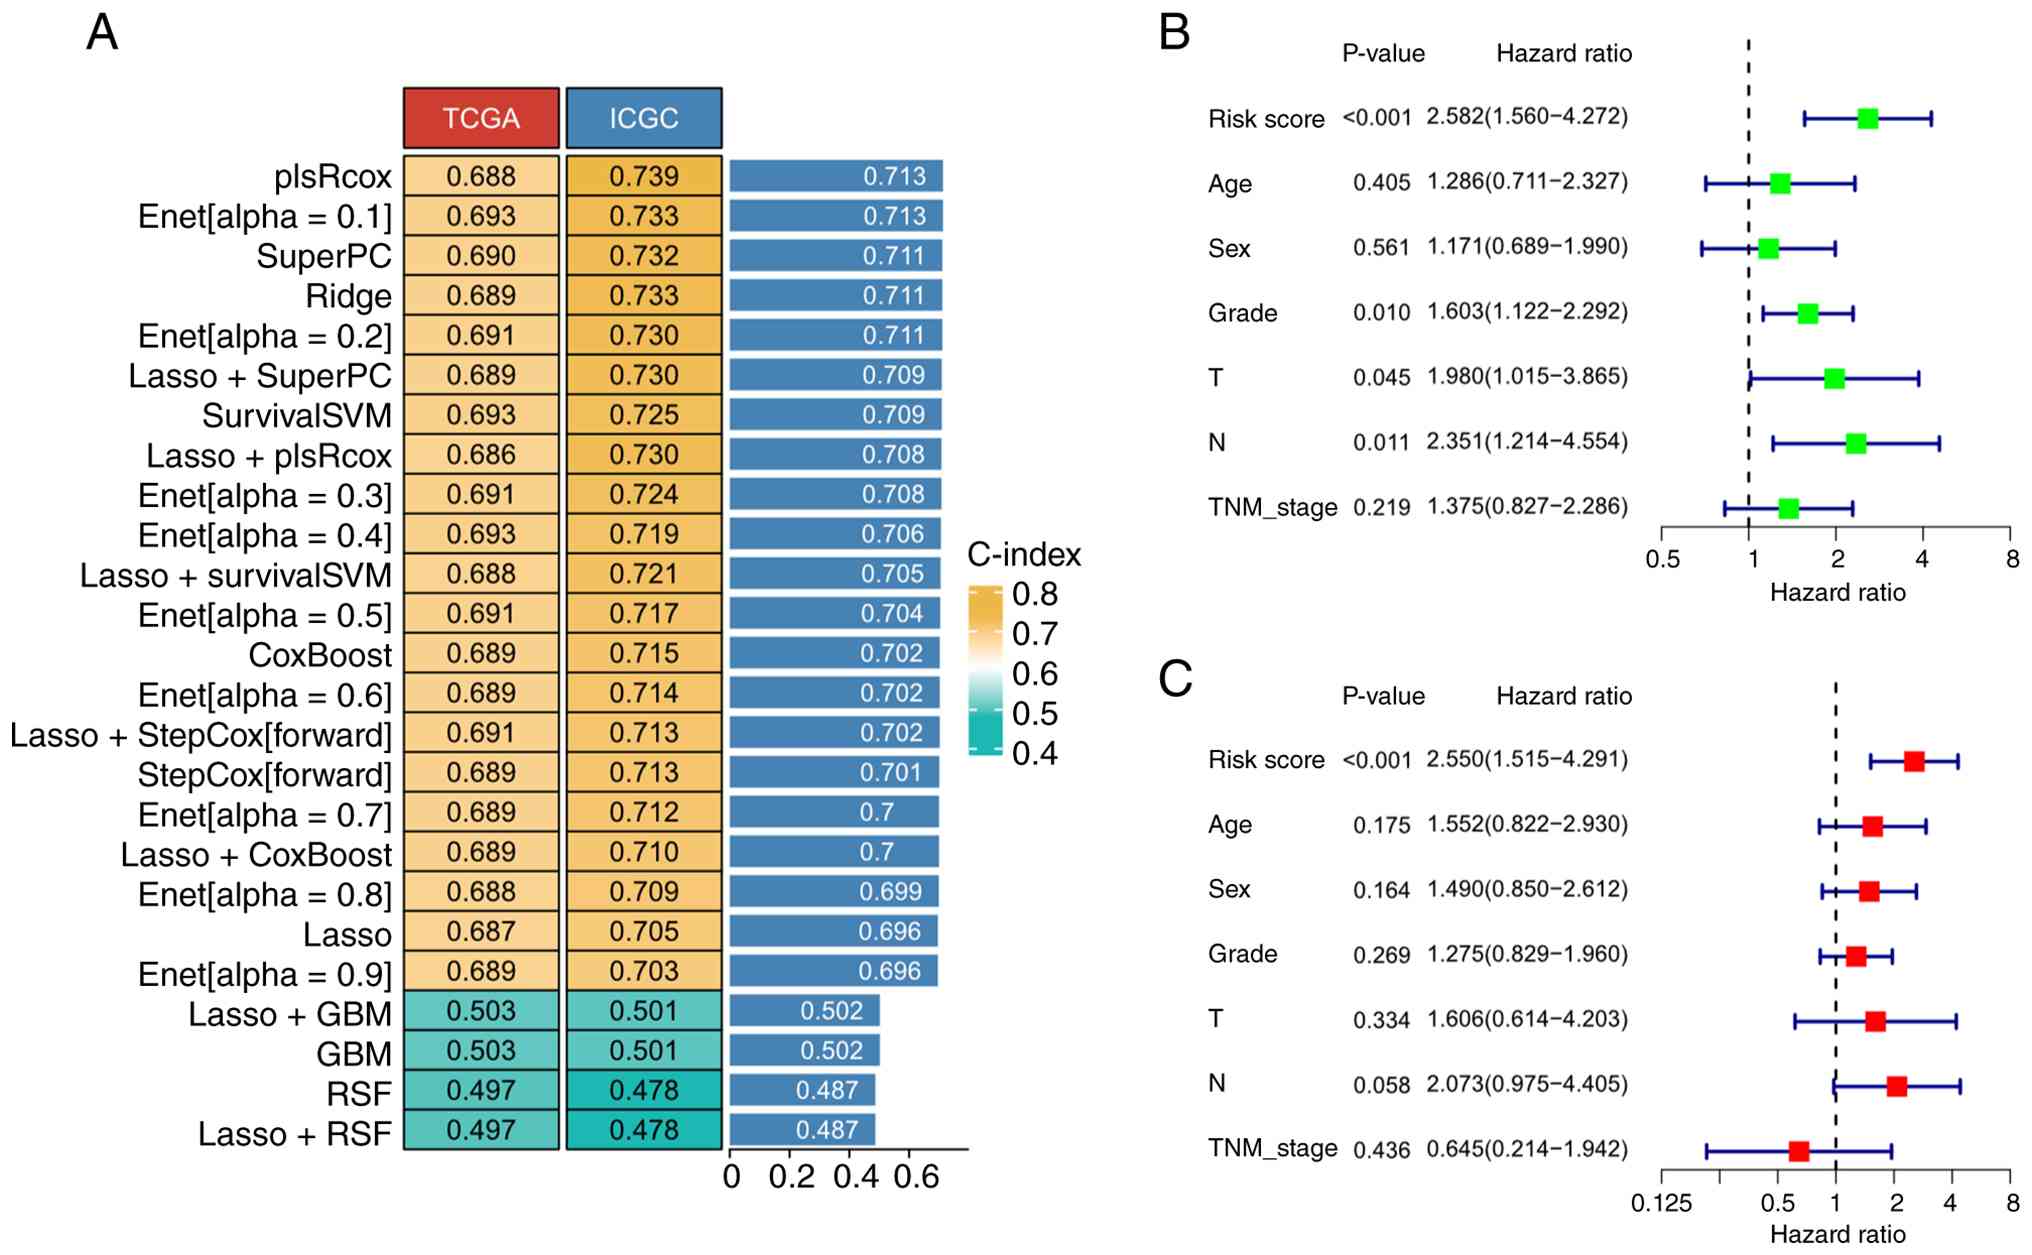
Among the 101 algorithms evaluated, 25 models were successfully
constructed. In TCGA cohort, the mean C-index was 0.659 (SD=0.069),
while in the ICGC cohort, the mean C-index was 0.683 (SD=0.08;
Fig. 5A). Among these, the
‘plsRcox’ approach, which combines partial least squares regression
with Cox regression, achieved optimal predictive performance,
exhibiting a mean C-index of 0.713. The HRH1/YAP1 signaling-derived
prognostic signature comprises eight genes. Risk scores were
computed based on a weighted linear combination of expression
levels from eight signature genes, defined as: risk score=(0.032 ×
HRH1) + (0.015 × YAP1) + (0.227 × ECT2) + (0.215 × ITGB5) + (0.207
× SHCBP1) + (0.108 × MAML2) + (0.032 × YWHAZ) + (0.147 × ITGA2).
Analysis revealed that the risk score based on HRH1/YAP1 signaling
emerged as an independent determinant of overall survival in
pancreatic cancer patients, as shown by univariate and multivariate
Cox regression (Fig. 5B and C).
To further validate the robustness of the model, two
additional GEO datasets (GSE28735 and GSE183795), which were not
used during model training, were employed as external validation
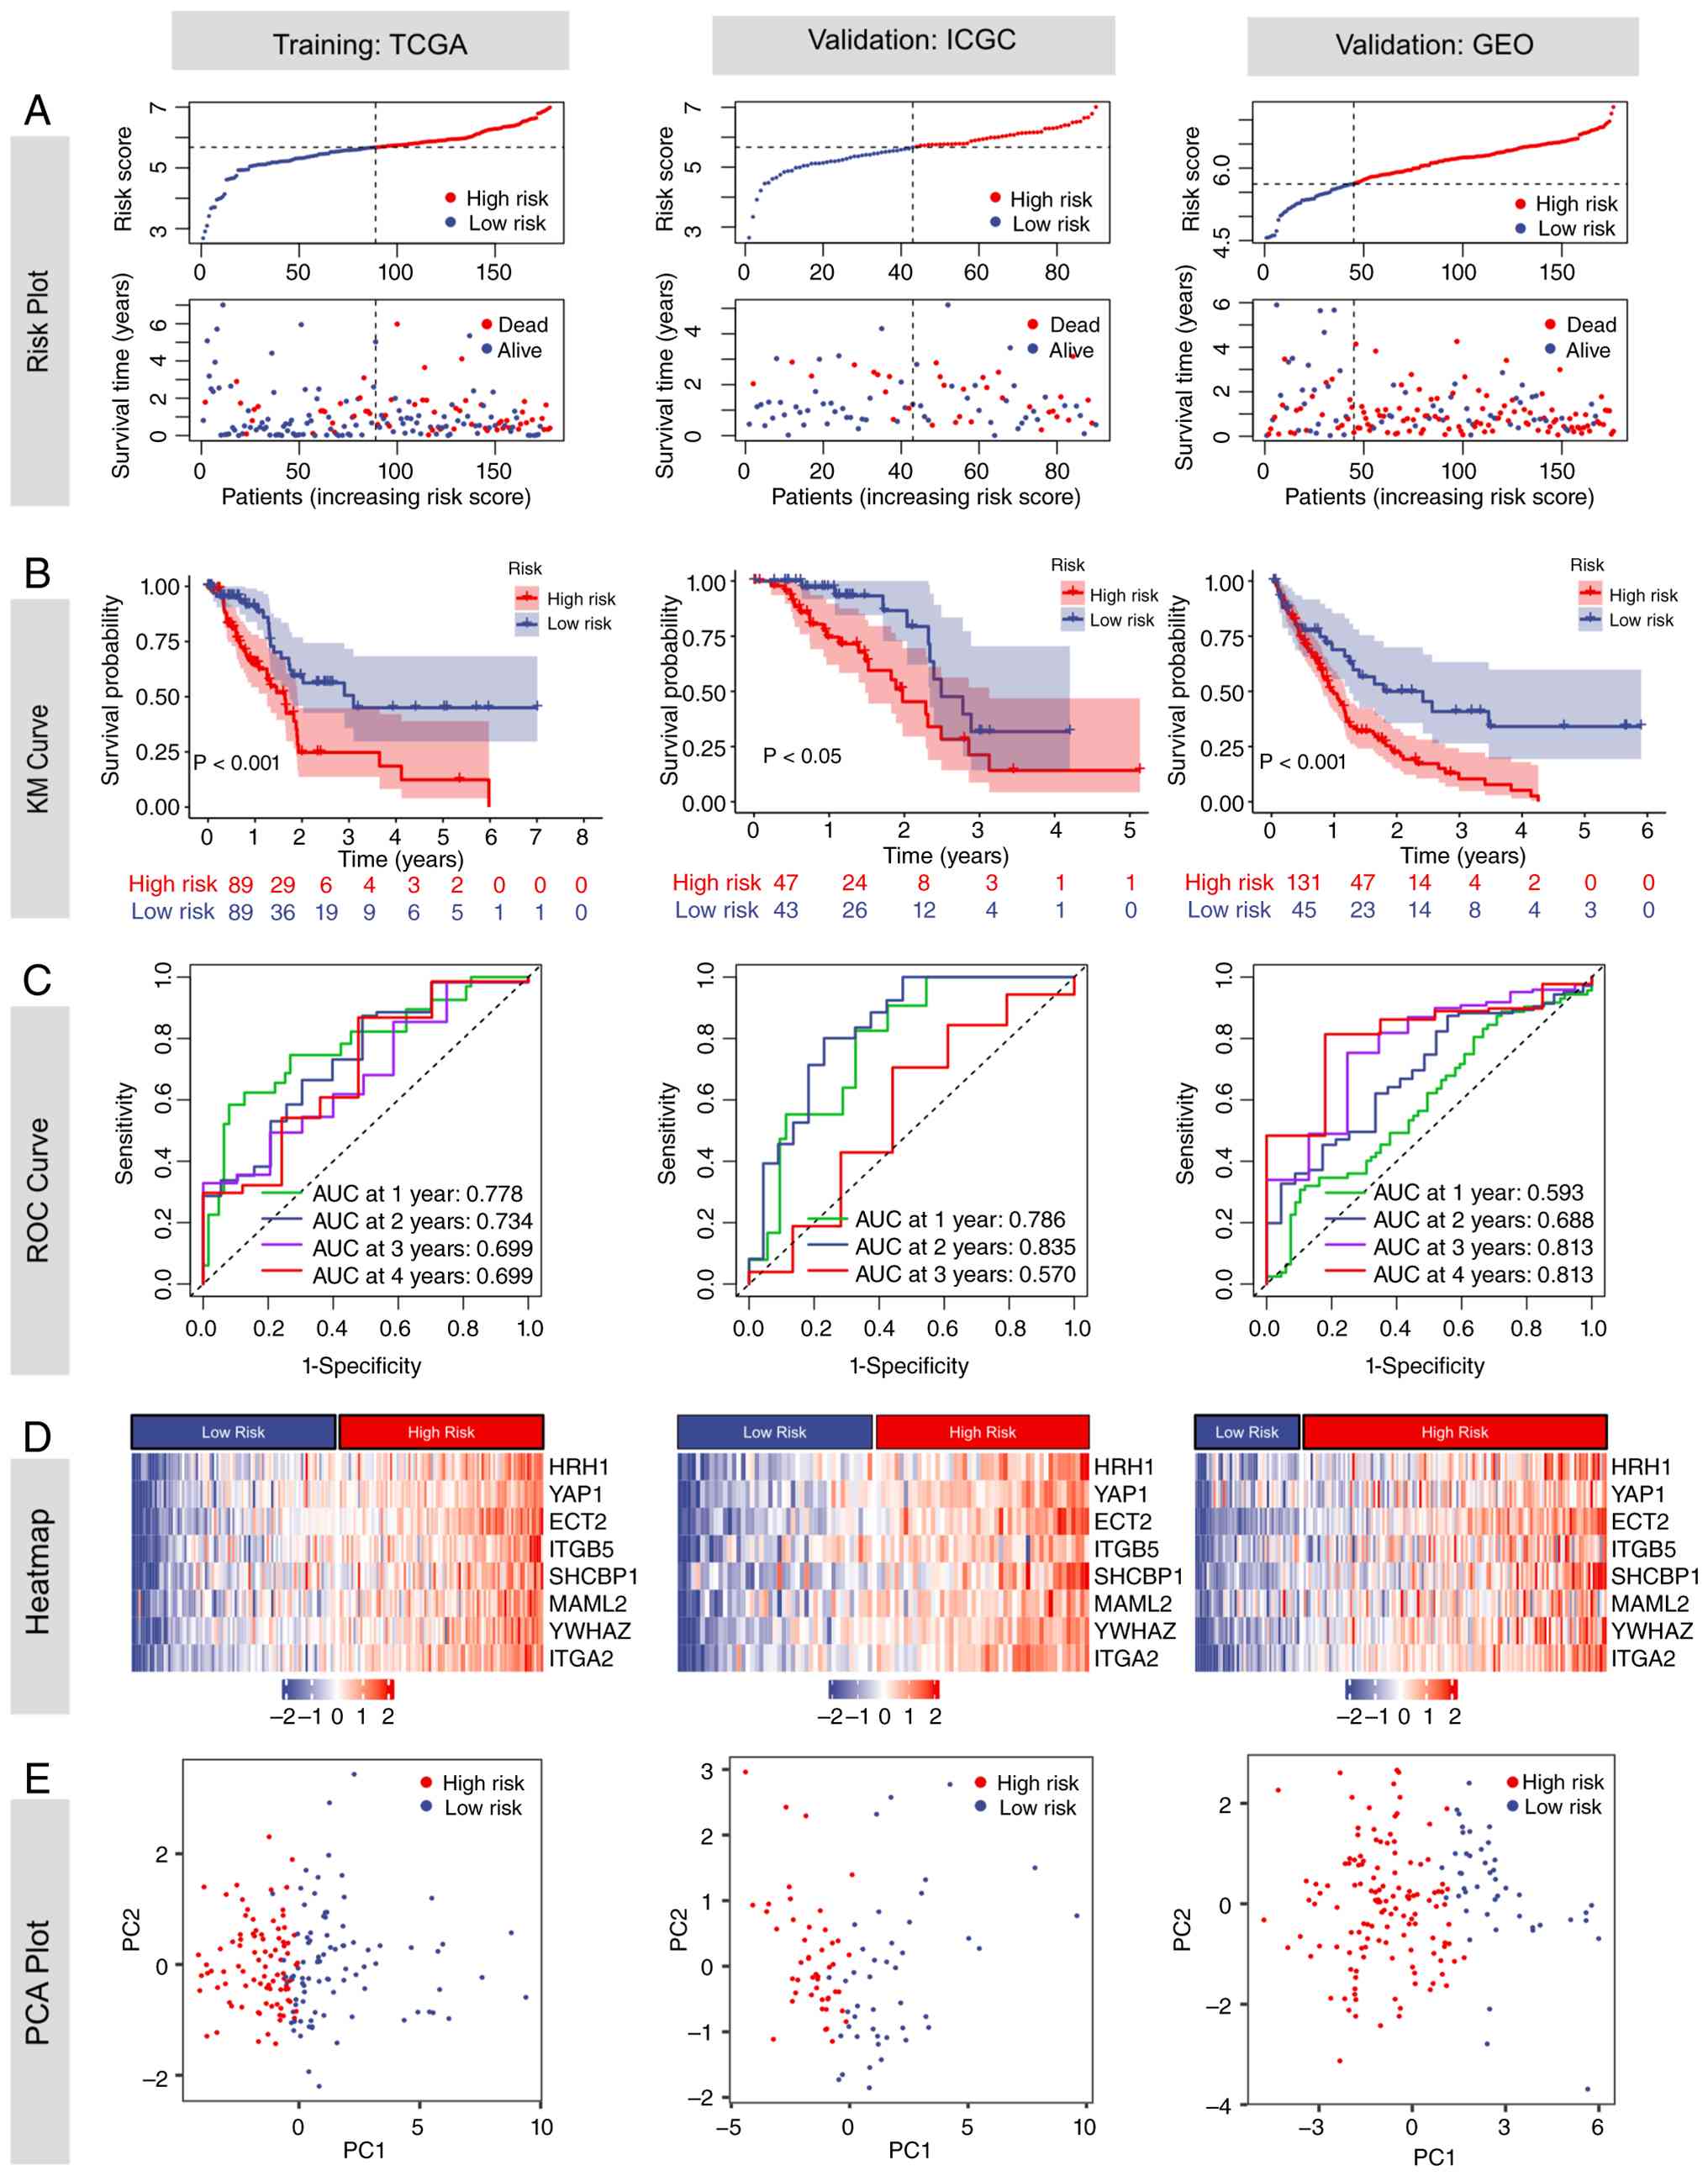
sets. Higher risk scores were associated with increased mortality
(Fig. 6A). Using the median risk
score of 6.171 from TCGA-PAAD training cohort as the cut-off, both
the training and validation sets were stratified into high- and
low-risk groups. KM analysis revealed significantly worse survival
in the high-risk group, with log-rank P<0.001 in TCGA-PAAD and
GEO cohorts, and P<0.05 in the ICGC-PACA-AU cohort (Fig. 6B). Time-dependent ROC analysis
demonstrated that the AUC values for predicting 1-, 2-, 3- and
4-year survival were 0.778/0.734/0.699/0.699 in TCGA-PAAD,
0.786/0.835/0.570/NA in ICGC-PACA-AU and 0.593/0.688/0.813/0.813 in
GEO, respectively (Fig. 6C). The
time-dependent Brier scores for 1-, 2-, 3- and 4-year overall
survival prediction were 0.143, 0.185, 0.190, and 0.182 in
TCGA-PAAD cohort; 0.115, 0.185, 0.202, and 0.182 in the
ICGC-PACA-AU cohort; and 0.242, 0.187, 0.128, and 0.100 in the GEO
cohort, respectively. Lower Brier scores indicate improved
calibration and predictive accuracy (Fig. S6). Heatmap analysis demonstrated a
positive correlation between all model genes and the risk score
(Fig. 6D). PCA analysis showed
clear separation between high- and low-risk groups, with
non-overlapping distributions in the scatter plot (Fig. 6E).
High-risk scores are associated with
high TMB, chemoresistance and immunosuppression
Previous studies have reported that targeting HRH1
can enhance the sensitivity to ICIs by upregulating MHC-I
expression in pancreatic cancer, while targeting YAP1 increases
chemosensitivity to gemcitabine (62,63).
Inspired by these findings, the present study further investigated
the association between the HRH1/YAP1 signaling-related risk score
and sensitivity to both chemotherapeutic agents and ICIs. As
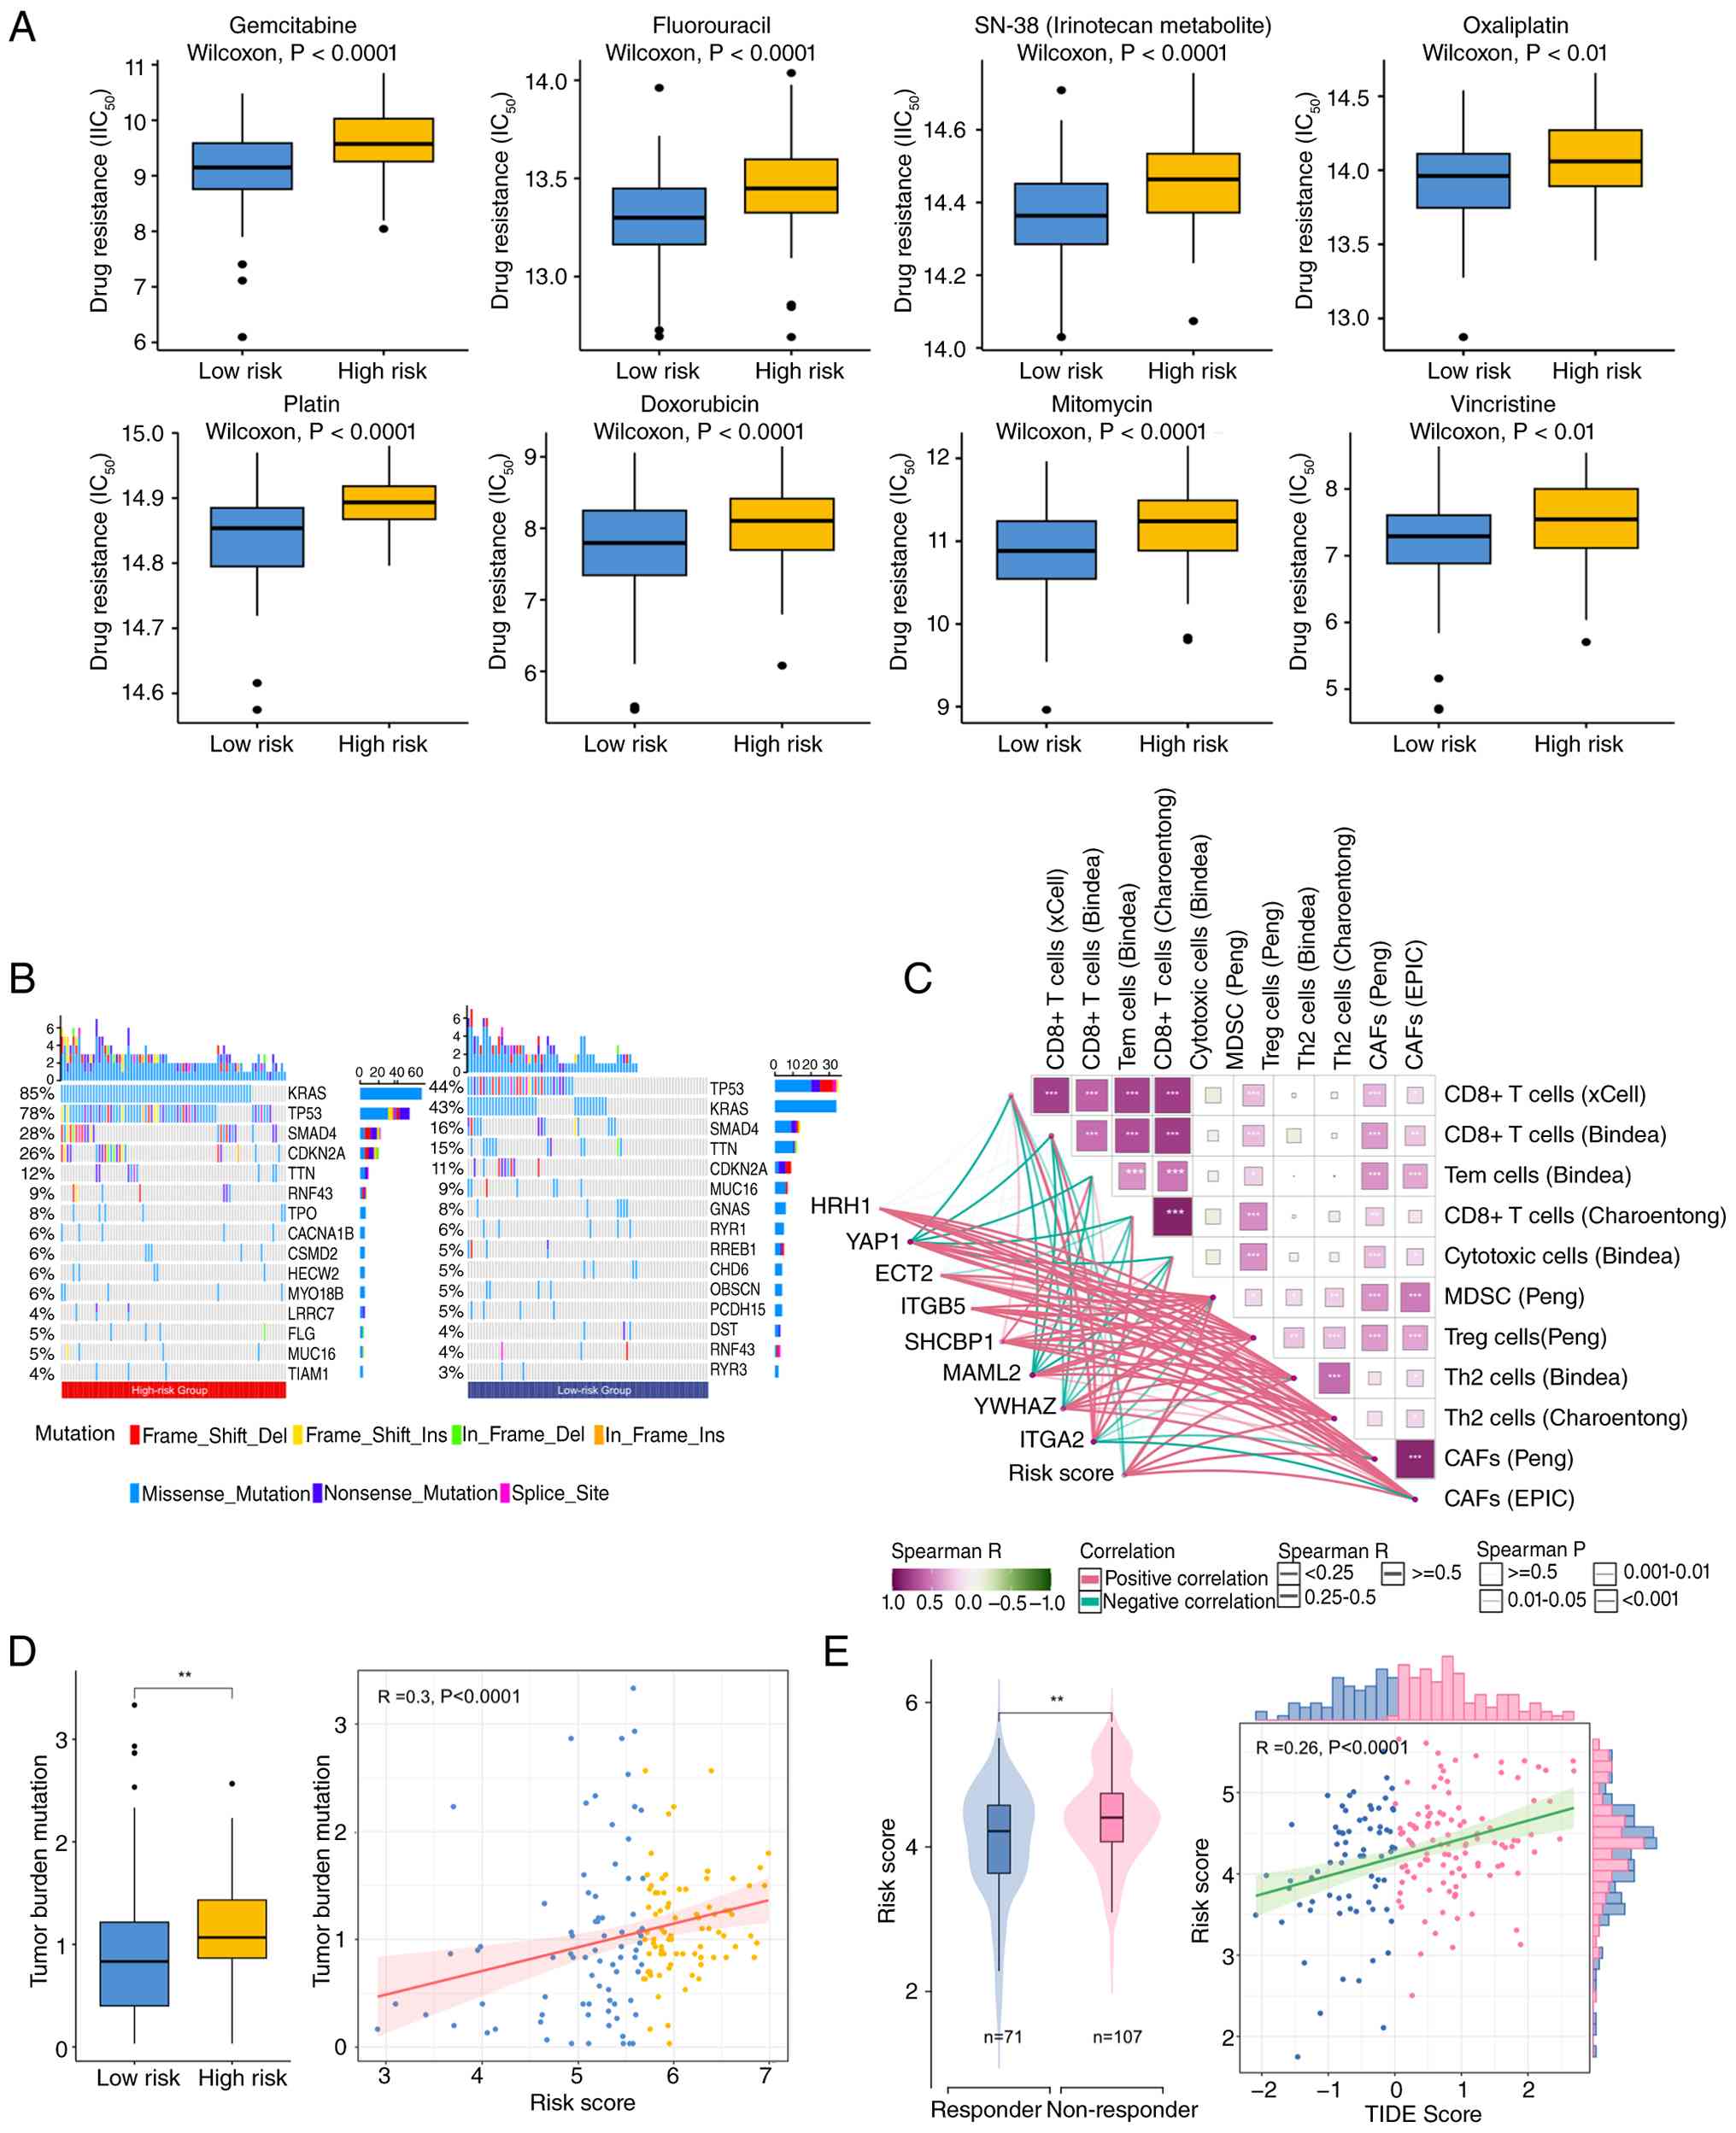
illustrated in Fig. 7A, high-risk
patients demonstrated markedly elevated IC50 levels for
standard chemotherapeutic agents used in PDAC treatment. These
included gemcitabine, fluorouracil, SN-38 (the active derivative of
irinotecan), and oxaliplatin, along with other commonly
administered drugs such as platinum-based compounds, doxorubicin,
mitomycin and vincristine. Further analysis revealed a higher
mutation frequency of the pancreatic cancer driver gene KRAS in the
high-risk group (85 vs. 44%), with similar trends observed for TP53
(78 vs. 44%), SMAD4 (26 vs. 16%) and CDKN2A (26 vs. 11%). The
heightened chemoresistance and worse prognosis evident in high-risk
patients may be partially attributable to mutations within these
genes (Fig. 7B) (5,64).
Although TMB is generally associated with improved
response to immunotherapy, with a typical cut-off for TMB-high
defined as 10 muts/Mb (65–67). The present analysis revealed a
positive correlation between the risk score and TMB. However, the
majority of samples demonstrated a TMB below 4 muts/Mb. This
suggests that these patients are unlikely to respond favorably to
ICIs (Fig. 7D). The present
analysis of the TME further revealed that a high risk score was
associated with an enriched presence of immunosuppressive cells,
including myeloid-derived suppressor cells (MDSCs),
cancer-associated fibroblasts (CAFs), regulatory T cells (Tregs)
and T helper 2 cells (Th2 cells) (Figs.
7C and S7). In contrast, this
high-risk phenotype was characterized by a significant decrease in
CD8+ T cells. The TIDE algorithm, designed to forecast
responses to ICI treatment, yielded elevated scores in the
high-risk group (Fig. 7E). Elevated
TIDE values are associated with a greater likelihood of unfavorable
therapeutic outcomes. Therefore, although pancreatic cancer is
generally considered an ‘immune-cold’ tumor with limited response
to ICIs, the low-risk group benefiting from immunotherapy.
Discussion
PDAC has a 5-year survival rate of merely 13% and
limited therapeutic advancements over the past four decades
(2). Its recalcitrance stems from
an immunosuppressive TME, early metastatic dissemination and rapid
acquisition of chemoresistance. These factors collectively render
conventional therapy ineffective for the majority of patients
(68). It is increasingly
recognized that tumors are not merely passive entities evading host
control but are active ‘hijackers’ of systemic homeostasis
(69). They achieve this by
producing and releasing a wide array of neuroendocrine mediators,
including classical neurotransmitters, biogenic amines (such as
histamine) and hormones. These substances reprogram central
regulatory axes and reset the body's physiological state to create
an environment that favors tumor expansion. For instance, serotonin
promotes the proliferation and progression of cholangiocarcinoma by
upregulating tryptophan hydroxylase 1 (TPH1) expression and
dysregulating its metabolic pathway in tumor cells (70). Targeting serotonin synthesis with
telotristat ethyl or blocking specific 5-hydroxytryptamine (5-HT)
receptors represents a promising therapeutic strategy for advanced
cholangiocarcinoma. Similarly, melanoma promotes the secretion of
pituitary hormones through autocrine and paracrine pathways, and
these hormones in turn drive melanoma cell proliferation, invasion
and malignant progression via activating downstream signaling
cascades (71). For instance,
cholangiocarcinoma cells actively usurp the physiological serotonin
metabolic pathway (70). They
upregulate TPH1 (the rate-limiting enzyme for serotonin synthesis)
and downregulate MAO-A (the serotonin-degrading enzyme), leading to
pathological overproduction of serotonin. Instead of serotonin
acting as a homeostatic regulator, cholangiocarcinoma cells express
all 5-HT receptor subtypes to establish an autocrine loop that
drives cell proliferation and progression, thereby rewiring normal
physiological regulation to create a pro-TME. Melanoma cells
secrete thyrotropin-releasing hormone and thyroid-stimulating
hormone (TSH) via autocrine and paracrine pathways (71). These hormones act through
functionally expressed melanocortin-1 receptor and TSH receptors,
respectively, to drive malignant progression (72). Activation of these receptors
initiates cAMP signaling and MAPK pathway cascades, while crosstalk
with the PI3K/Akt pathway potentiates melanoma proliferation,
invasion and transformation. The present study identified HRH1, a G
protein-coupled receptor, as a key regulator of PDAC progression,
operating through a previously unrecognized positive regulatory
loop with the transcriptional coactivator YAP1. These findings not
only illuminate a novel signaling axis driving PDAC pathogenesis
but also provide a rationale for repurposing existing HRH1
antagonists (fexofenadine) as targeted therapies, alongside a
prognostic model to guide patient stratification.
GPCRs represent a major drug target class, with ~34%
of all currently marketed Food and Drug Administration-approved
drugs acting through direct or indirect modulation of GPCR activity
(8). GPCRs control Hippo signaling
and YAP1 transactivation in a G protein-dependent manner (73). Ligand-stimulated GPCRs coupled to
Gα12/13, Gαq/11 or Gαi/o suppress LATS1/2 kinase activity, reduce
YAP1 phosphorylation and drive its nuclear entry to boost
TEAD-mediated transcription. By contrast, Gαs-coupled GPCRs trigger
PKA signaling that enhances LATS1/2-dependent YAP1 phosphorylation,
sequestering YAP1 in the cytoplasm and silencing its
transcriptional function. The present study integrated analysis of
multiple cohorts established that HRH1 is substantially upregulated
in PDAC. This upregulation was evident at both bulk and single-cell
resolution and was specifically enriched in malignant cells
compared with their normal counterparts. Elevated HRH1 expression
levels were identified as an independent predictor of shortened
overall survival among patients in TCGA-PAAD cohort. HRH1,
initially recognized as a therapeutic target for managing allergic
inflammatory responses, has more recently been associated with the
advancement of multiple cancer types. HRH1 is highly expressed in
oral squamous cell carcinoma and is markedly associated with lymph
node metastasis and poor prognosis (74). HRH1 promotes the progression of oral
squamous cell carcinoma by triggering the epithelial-mesenchymal
transition process through activation of ADAM9-mediated TGF-β
signaling and upregulation of Snail family transcription factors
(74). Activation of HRH1 signaling
enhances development of intestinal tumors in vivo and
stimulated the proliferation of intestinal epithelial cells derived
from colorectal cancer (75). The
radiosensitizing effect mediated by HRH1 inhibition with loratadine
was corroborated in multiple cancer cell models, including colon
cancer, glioblastoma and prostate cancer (76). Hrh1 was predominantly the only
histamine receptor subtype expressed among the other three Hrhs
(Hrh2, Hrh3 and Hrh4) in Kras-LSLG12D/+;
Trp53fl/fl; Ptf1a-Cre+/− PDAC cell lines
(77). PANC-1 cells utilize
autocrine and paracrine histamine signaling through HRH1 to promote
proliferation via nerve growth factor upregulation, an effect
reversible by the HRH1 antagonist pyrilamine. Consistent with prior
observations, the CCK-8 assay results of the present study revealed
that knockdown of HRH1 markedly suppressed the proliferation of
PDAC cells (77). MR analysis
reinforced a potential causal relationship between HRH1 inhibition
and reduced PDAC risk. Similarly, in patients with breast cancer
and melanoma, the use of antihistamine drugs such as desloratadine
and loratadine was associated with prolonged overall survival
(78,79). Therefore, HRH1 has emerged as a
potential therapeutic target in multiple cancer types due to its
role in promoting tumor cell proliferation and metastasis.
HRH1 primarily couples to Gαq/11 proteins, which
activate phospholipase C (80). The
activation of this pathway initiates the generation of second
messengers, inositol trisphosphate and diacylglycerol, leading to a
rapid increase in intracellular Ca2+ levels. This
Ca2+ surge promotes the activation of protein kinase C,
which in turn stimulates the Rho/ROCK pathway and induces F-actin
polymerization. The resulting cytoskeletal remodeling suppresses
LATS1/2 kinase activity, thereby modulating multiple
pro-tumorigenic signaling cascades (6). In parallel, Ca2+ binds to
calmodulin (CaM), forming a Ca2+/CaM complex. This
complex enhances the inhibitory phosphorylation of YAP by LATS1,
thereby activating the Hippo pathway and ultimately restraining
YAP-driven transcriptional activity (81). Importantly, as a GPCR, HRH1 is
positioned to transduce extracellular histamine signals into
intracellular responses that directly impinge on the Hippo/YAP1
pathway. The present study reveals that HRH1 operates as a key
upstream regulator of YAP1, forming a positive feedback loop that
amplifies oncogenic signaling. The downstream mechanisms mediated
by HRH1 in PDAC remain poorly understood. While data of the present
study demonstrate that HRH1 inhibition reduces YAP1 protein levels
without altering its transcript abundance, the precise
post-translational mechanism remains to be fully elucidated. Based
on established GPCR-Hippo crosstalk, we hypothesize that HRH1
signaling, potentially through Gαq-mediated activation of
Rho/ROCK/F-actin, suppresses LATS1/2 kinase activity. This
suppression may reduce YAP1 phosphorylation at Ser127, a
modification that is essential for recognition by the β-TrCP E3
ubiquitin ligase complex and subsequent β-TrCP-mediated
ubiquitination and degradation (61,82).
Future investigations should prioritize protein stability assays
using cycloheximide and MG132 treatments, subcellular fractionation
studies and phospho-specific immunoblotting of YAP1 to validate the
proposed mechanism.
Conversely, YAP1 could enhance HRH1 transcription by
binding to its promoter, as evidenced by ChIP-seq peaks, active
histone marks (H3K4me3 and H3K27ac) and open chromatin (ATAC-seq)
at the HRH1 locus. In addition, knockdown of HRH1 in human
endothelial cells downregulated YAP1 target genes, such as CCN1 and
CCN2, while silencing of YAP1 reduced HRH1 expression across
multiple cancer cell lines. The present findings indicate that
HRH1-YAP1 signaling is consistently observed across multiple human
cancer cell types and is not restricted to pancreatic cancer cells.
This feedback loop provides a molecular explanation for the strong
association between HRH1 expression and YAP1 target genes (CYR61,
CTGF and ANKRD1) in PDAC patient data. A similar regulatory
mechanism has been observed in other malignancies. For instance,
CXCR7 activates YAP through Gαq/11 and Rho GTPase signaling, while
YAP transcriptionally upregulates CXCR7 expression, establishing a
positive feedback loop that promotes gastric cancer progression
(83). Therefore, to the best of
our knowledge, the present study demonstrates for the first time
that HRH1 and YAP1 form a positive regulatory loop that
cooperatively drives the progression of pancreatic cancer.
KRAS mutations represent the most prevalent genetic
alterations in PDAC. The predominant mutated variants included G12D
(36.2%), G12V (26.2%), G12R (14.3%) and Q61 (5.3%), while the
remaining 15.5% were identified as KRAS wild-type (84). Mutant Kras constitutively activates
multiple downstream effector pathways, leading to pancreatic cancer
initiation, progression, chemotherapy resistance and immune
suppression, including the RAF-MEK-ERK (MAPK) cascade and the
PI3K-AKT-mTOR axis (84,85). The approval of the first G12C
inhibitor, sotorasib, in 2021 represented a major therapeutic
advance (86). In parallel, the
ongoing clinical investigation of G12D inhibitors and pan-RAS
inhibitors heralds the advent of a new era in precision medicine
for PDAC (86). The Hippo-YAP1
pathway has emerged as a central mediator of PDAC progression,
enabling tumors to bypass oncogenic KRAS dependency and resist
KRAS-targeted therapies (13,87).
Moreover, prior evidence indicates that YAP1 confers resistance to
gemcitabine-based chemotherapy regimens (88). Although KRAS does not directly
interact with core Hippo components or YAP1, their functional
crosstalk is mediated by specific scaffold proteins that establish
precise molecular linkages (89–91).
For instance, RASSF5 directly binds GTP-bound KRAS via its RA
domain and simultaneously recruits MST1 through its SARAH motif.
This ternary complex promotes cytoplasmic retention of YAP1,
thereby inhibiting its nuclear translocation and transcriptional
activity, providing a defined mechanism by which activated KRAS
engages the Hippo pathway (89). In
parallel, KSR1 serves as a dual-function scaffold that dynamically
coordinates both pathways: Under basal conditions, it
constitutively associates with MST1, LATS1 and YAP1 to enhance
YAP1-driven transcription; upon EGF stimulation or KRAS activation,
KSR1 disengages from Hippo components and instead nucleates
Raf-MEK-ERK complexes to potentiate MAPK signaling (90). In the present study, the high-risk
subgroup exhibiting elevated YAP1 expression demonstrated a
significantly higher frequency of KRAS mutations. Chemoresistance
analysis further revealed that high HRH1 expression is associated
with resistance to gemcitabine, agents within the FOLFIRINOX
regimen and multiple other cytotoxic compounds. Disruption of the
HRH1-YAP1 regulatory axis may therefore address a key therapeutic
challenge by mitigating the functional redundancy between KRAS and
YAP1, which currently limits the efficacy of both targeted
therapies and conventional chemotherapy. Repurposing fexofenadine,
an antihistamine drug characterized by a favorable safety profile,
may circumvent the protracted development timelines associated with
novel therapeutic agents, thereby providing a viable and
expeditious route for clinical translation.
Beyond identifying a novel signaling axis, the
present study translated these findings into a clinically
actionable tool: A prognostic model based on HRH1, YAP1 and
downstream targets (ECT2, ITGB5, SHCBP1, MAML2, YWHAZ and ITGA2).
To improve risk stratification for high-risk patients, the present
study developed a model by systematically assessing 113 algorithms
in TCGA cohort, with external validation in ICGC and GEO datasets.
This model provides a robust tool for clinical risk stratification,
demonstrating superior prognostic accuracy over conventional TNM
staging. Notably, high-risk scores were correlated with resistance
to both chemotherapy and immunotherapy, a finding consistent with
the established oncogenic role of YAP1 (88,92).
Elevated TMB (10 muts/Mb) typically correlates with enhanced
efficacy of immunotherapeutic interventions, owing to the increased
production of immunogenic neoantigens that facilitate improved
immune system recognition and elimination (54–56).
PDAC is generally characterized by a low TMB (typically ranging
from 1 to 4 mutations/megabase), which contributes to the limited
efficacy of immunotherapy in this malignancy (93). Although the high-risk subgroup
demonstrates relatively elevated TMB and may exhibit increased
sensitivity to ICIs against PD-1 and PD-L1, the therapeutic outcome
is also critically influenced by the cellular composition of the
TME. Studies have demonstrated that YAP1 acts as a transcriptional
driver of multiple cytokines, which subsequently promote the
differentiation and accumulation of MDSCs, CAFs and Tregs (94–97).
This contributes to the establishment of a robust immune-cold TME
in PDAC. In the present study, high-risk patients exhibited
elevated YAP1 expression, and analysis of the TME revealed that the
risk score was significantly positively associated with the
abundance of CAFs, MDSCs, Th2 cells and Tregs. Moreover, activation
of HRH1 drives macrophage polarization toward an M2-like phenotype,
leading to impaired T cell function (98). By contrast, blocking HRH1 elevates
MHC-I levels in PDAC via the cholesterol biosynthesis pathway
(62). Dual inhibition of HRH1 and
PD-1 improved CD8+ T cell infiltration and cytotoxicity,
effectively countering resistance to ICI therapy. These findings
suggest that pharmacological antagonism of HRH1 may enhance
antitumor immunity and potentiate the efficacy of
immunotherapy.
While the present study provides a foundation for
targeting HRH1 in PDAC, several limitations warrant consideration.
First, while the prognostic model exhibited strong predictive
accuracy across both the training cohort and two independent
validation sets, its clinical utility requires further validation
in prospective studies. Second, although the MR analysis indicates
a potential causal link, it depends on SNPs as proxies for
fexofenadine exposure. Therefore, prospective clinical studies are
necessary to conclusively confirm its effectiveness. Third, the
present study only demonstrates that HRH1 promotes YAP1 protein
stabilization, without further elucidating the specific regulatory
pathways involved. Future studies should delineate the mechanisms
by which HRH1 regulates YAP1 stability and determine whether
HRH1-mediated YAP1 activation depends on KRAS mutation status.
Fourth, while integrative analysis of public ChIP-seq and ATAC-seq
datasets strongly supports YAP1 occupancy at the HRH1 promoter,
direct experimental validation in PDAC cells has not been performed
and remains a limitation of the present study. Luciferase reporter
assays and ChIP-qPCR experiments are currently planned as part of
the future work. Fifth, the present analysis of HRH1 expression is
based on transcriptomic data from multiple public databases and
patient cohorts. HRH1 protein expression was not validated across
different pancreatic cancer cell lines or in clinical tumor
samples. However, a recent study reported elevated HRH1 protein
levels in pancreatic cancer tissues compared to adjacent non-tumor
tissues (62). Future studies
should prioritize experimental validation of HRH1 at the protein
level and further investigate its functional role in modulating the
crosstalk between KRAS and the Hippo/YAP1 signaling pathway, which
may reveal novel therapeutic vulnerabilities in PDAC. Additionally,
the present study did not consider the contribution of exogenous
histamine from immune cells (such as mast cells) in the TME. This
gap warrants further investigation, given that stromal-derived
histamine may serve as an endogenous HRH1 agonist and amplify the
HRH1-YAP1 feedback loop.
In summary, the present study identified HRH1 as a
key driver of PDAC progression, functioning via a positive feedback
loop with YAP1 to amplify oncogenic signaling, promote
chemoresistance and potentiate immunosuppression. The HRH1/YAP1
prognostic model offers a powerful tool for patient stratification.
Collectively, these findings provide a novel therapeutic strategy
for PDAC by leveraging the druggability of HRH1 to disrupt a key
oncogenic signaling axis.
Supplementary Material
Supporting Data
Supporting Data
Acknowledgements
Not applicable.
Funding
This work was supported by the Scientific Research Startup Fund
of Chengdu Third People's Hospital (Grant no.
CSY-YN-04-2024-008).
Availability of data and materials
The data generated in the present study may be
requested from the corresponding author.
Authors' contributions
JC and JW conceived and designed the study and
co-wrote the original draft of the manuscript. JC performed
bioinformatic analyses, data curation and in vitro
experiments (including CCK-8 assay, western blotting, RT-qPCR and
ChIP-qPCR). JW was responsible for statistical analysis. Both JC
and JW confirm the authenticity of all the raw data. Both authors
read and approved the final version of the manuscript.
Ethics approval and consent to
participate
Not applicable.
Patient consent for publication
Not applicable.
Competing interests
The authors declare that they have no competing
interests.
Use of artificial intelligence tools
During the preparation of this work, artificial
intelligence tools were used to improve the readability and
language of the manuscript, and subsequently, the authors revised
and edited the content produced by the artificial intelligence
tools as necessary, taking full responsibility for the ultimate
content of the present manuscript.
References
|
1
|
Mackay TM, Latenstein AEJ, Augustinus S,
van der Geest LG, Bogte A, Bonsing BA, Cirkel GA, Hol L, Busch OR,
den Dulk M, et al: Implementation of best practices in pancreatic
cancer care in the netherlands: A Stepped-wedge randomized clinical
trial. JAMA Surg. 159:429–437. 2024. View Article : Google Scholar : PubMed/NCBI
|
|
2
|
Siegel RL, Kratzer TB, Giaquinto AN, Sung
H and Jemal A: Cancer statistics, 2025. CA Cancer J Clin. 75:10–45.
2025.PubMed/NCBI
|
|
3
|
Rahib L, Smith BD, Aizenberg R, Rosenzweig
AB, Fleshman JM and Matrisian LM: Projecting cancer incidence and
deaths to 2030: The unexpected burden of thyroid, liver, and
pancreas cancers in the United States. Cancer Res. 74:2913–2921.
2014. View Article : Google Scholar : PubMed/NCBI
|
|
4
|
Zhu Y, Fang S, Fan B, Xu K, Xu L, Wang L,
Zhu L, Chen C, Wu R, Ni J and Wang J: Cancer-associated fibroblasts
reprogram cysteine metabolism to increase tumor resistance to
ferroptosis in pancreatic cancer. Theranostics. 14:1683–1700. 2024.
View Article : Google Scholar : PubMed/NCBI
|
|
5
|
Stoop TF, Javed AA, Oba A, Koerkamp BG,
Seufferlein T, Wilmink JW and Besselink MG: Pancreatic cancer.
Lancet. 405:1182–1202. 2025. View Article : Google Scholar : PubMed/NCBI
|
|
6
|
Ahn S and Kaipparettu BA: G-protein
coupled receptors in metabolic reprogramming and cancer. Pharmacol
Ther. 270:1088492025. View Article : Google Scholar : PubMed/NCBI
|
|
7
|
Krumm BE and Roth BL: Intracellular GPCR
modulators enable precision pharmacology. NPJ Drug Discov. 2:82025.
View Article : Google Scholar : PubMed/NCBI
|
|
8
|
Arang N and Gutkind JS: G Protein-Coupled
receptors and heterotrimeric G proteins as cancer drivers. FEBS
Lett. 594:4201–4232. 2020. View Article : Google Scholar : PubMed/NCBI
|
|
9
|
Kim E, Riehl BD, Bouzid T, Yang R, Duan B,
Donahue HJ and Lim JY: YAP mechanotransduction under cyclic
mechanical stretch loading for mesenchymal stem cell osteogenesis
is regulated by ROCK. Front Bioeng Biotechnol. 11:13060022024.
View Article : Google Scholar : PubMed/NCBI
|
|
10
|
Zhou T, Li X, Liu J and Hao J: The
Hippo/YAP signaling pathway: The driver of cancer metastasis.
Cancer Biol Med. 20:483–489. 2023.PubMed/NCBI
|
|
11
|
Yan H, Yu CC, Fine SA, Youssof AL, Yang
YR, Yan J, Karg DC, Cheung EC, Friedman RA, Ying H, et al: Loss of
the Wild-type KRAS allele promotes pancreatic cancer progression
through functional activation of YAP1. Oncogene. 40:6759–6771.
2021. View Article : Google Scholar : PubMed/NCBI
|
|
12
|
Kapoor A, Yao W, Ying H, Hua S, Liewen A,
Wang Q, Zhong Y, Wu CJ, Sadanandam A, Hu B, et al: Yap1 activation
enables bypass of oncogenic Kras addiction in pancreatic cancer.
Cell. 158:185–197. 2014. View Article : Google Scholar : PubMed/NCBI
|
|
13
|
Gurreri E, Genovese G, Perelli L, Agostini
A, Piro G, Carbone C and Tortora G: KRAS-dependency in pancreatic
ductal adenocarcinoma: Mechanisms of escaping in resistance to KRAS
inhibitors and perspectives of therapy. Int J Mol Sci. 24:93132023.
View Article : Google Scholar : PubMed/NCBI
|
|
14
|
Yang S, Tang W, Azizian A, Gaedcke J,
Ströbel P, Wang L, Cawley H, Ohara Y, Valenzuela P, Zhang L, et al:
Dysregulation of HNF1B/Clusterin axis enhances disease progression
in a highly aggressive subset of pancreatic cancer patients.
Carcinogenesis. 43:1198–1210. 2022. View Article : Google Scholar : PubMed/NCBI
|
|
15
|
Zhang G, Schetter A, He P, Funamizu N,
Gaedcke J, Ghadimi BM, Ried T, Hassan R, Yfantis HG, Lee DH, et al:
DPEP1 inhibits tumor cell invasiveness, enhances chemosensitivity
and predicts clinical outcome in pancreatic ductal adenocarcinoma.
PLoS One. 7:e315072012. View Article : Google Scholar : PubMed/NCBI
|
|
16
|
Lim SB: A microarray meta-dataset of
pancreatic cancer. Version 1. ArrayExpress [dataset].
2019.Available from:. https://www.ebi.ac.uk/biostudies/studies/E-MTAB-6690
|
|
17
|
Iwatate Y, Yokota H, Hoshino I, Ishige F,
Kuwayama N, Itami M, Mori Y, Chiba S, Arimitsu H, Yanagibashi H, et
al: Machine learning with imaging features to predict the
expression of ITGAV, which is a poor prognostic factor derived from
transcriptome analysis in pancreatic cancer. Int J Oncol.
60:602022. View Article : Google Scholar : PubMed/NCBI
|
|
18
|
Pei H, Li L, Fridley BL, Jenkins GD,
Kalari KR, Lingle W, Petersen G, Lou Z and Wang L: FKBP51 affects
cancer cell response to chemotherapy by negatively regulating akt.
Cancer Cell. 16:259–266. 2009. View Article : Google Scholar : PubMed/NCBI
|
|
19
|
Klett H, Fuellgraf H, Levit-Zerdoun E,
Hussung S, Kowar S, Küsters S, Bronsert P, Werner M, Wittel U,
Fritsch R, et al: Identification and validation of a diagnostic and
prognostic Multi-Gene biomarker panel for pancreatic ductal
adenocarcinoma. Front Genet. 9:1082018. View Article : Google Scholar : PubMed/NCBI
|
|
20
|
Idichi T, Seki N, Kurahara H, Yonemori K,
Osako Y, Arai T, Okato A, Kita Y, Arigami T, Mataki Y, et al:
Regulation of actin-binding protein ANLN by antitumor miR-217
inhibits cancer cell aggressiveness in pancreatic ductal
adenocarcinoma. Oncotarget. 8:53180–53193. 2017. View Article : Google Scholar : PubMed/NCBI
|
|
21
|
Yang S, He P, Wang J, Schetter A, Tang W,
Funamizu N, Yanaga K, Uwagawa T, Satoskar AR, Gaedcke J, et al: A
novel MIF signaling pathway drives the malignant character of
pancreatic cancer by targeting NR3C2. Cancer Res. 76:3838–3850.
2016. View Article : Google Scholar : PubMed/NCBI
|
|
22
|
Coggins GE, Farrel A, Rathi KS, Hayes CM,
Scolaro L, Rokita JL and Maris JM: YAP1 mediates resistance to
MEK1/2 inhibition in neuroblastomas with hyperactivated RAS
signaling. Cancer Res. 79:6204–6214. 2019. View Article : Google Scholar : PubMed/NCBI
|
|
23
|
Enzo E, Santinon G, Pocaterra A, Aragona
M, Bresolin S, Forcato M, Grifoni D, Perssion A, Zanconato F, Guzzo
G, et al: Aerobic glycolysis tunes YAP/TAZ transcriptional
activity. EMBO J. 34:1349–1370. 2015. View Article : Google Scholar : PubMed/NCBI
|
|
24
|
Weiler SME, Lutz T, Bissinger M, Sticht C,
Knaub M, Gretz N, Schirmacher P and Breuhahn K: TAZ target gene
ITGAV regulates invasion and feeds back positively on YAP and TAZ
in liver cancer cells. Cancer Lett. 473:164–175. 2020. View Article : Google Scholar : PubMed/NCBI
|
|
25
|
Yang WH, Lin CC, Wu J, Chao PY, Chen K,
Chen PH and Chi JT: The Hippo pathway effector YAP promotes
ferroptosis via the E3 ligase SKP2. Mol Cancer Res. 19:1005–1014.
2021. View Article : Google Scholar : PubMed/NCBI
|
|
26
|
Chen J, Liu Z, Wu Z, Li W and Tan X:
Identification of a chemoresistance-related prognostic gene
signature by comprehensive analysis and experimental validation in
pancreatic cancer. Front Oncol. 13:11324242023. View Article : Google Scholar : PubMed/NCBI
|
|
27
|
Zhang Z, Wu HX, Lin WH, Wang ZX, Yang LP,
Zeng ZL and Luo HY: EPHA7 mutation as a predictive biomarker for
immune checkpoint inhibitors in multiple cancers. BMC Med.
19:262021. View Article : Google Scholar : PubMed/NCBI
|
|
28
|
Chalmers ZR, Connelly CF, Fabrizio D, Gay
L, Ali SM, Ennis R, Schrock A, Campbell B, Shlien A, Chmielecki J,
et al: Analysis of 100,000 human cancer genomes reveals the
landscape of tumor mutational burden. Genome Med. 9:342017.
View Article : Google Scholar : PubMed/NCBI
|
|
29
|
Dupain C, Gutman T, Girard E, Kamoun C,
Marret G, Castel-Ajgal Z, Sablin MP, Neuzillet C, Borcoman E,
Hescot S, et al: Tumor mutational burden assessment and
standardized bioinformatics approach using custom NGS panels in
clinical routine. BMC Biol. 22:432024. View Article : Google Scholar : PubMed/NCBI
|
|
30
|
Qu S, Liu Z, Wang B, Li X, Li Z, Gai Y,
Sun Y, Zhang Q, Sun Y, Pan W, et al: OTUD4 regulates pancreatic
cancer progression via Hippo/YAP axis. Neoplasia. 73:1012852026.
View Article : Google Scholar : PubMed/NCBI
|
|
31
|
Cherubini A, Rusconi F, Piras R,
Wächtershäuser KN, Dossena M, Barilani M, Mei C, Hof L, Sordi V,
Pampaloni F, et al: Exploring human pancreatic organoid modelling
through single-cell RNA sequencing analysis. Commun Biol.
7:15272024. View Article : Google Scholar : PubMed/NCBI
|
|
32
|
Ewers KM, Patil S, Kopp W, Thomale J,
Quilitz T, Magerhans A, Wang X, Hessmann E and Dobbelstein M: HSP90
inhibition synergizes with cisplatin to eliminate Basal-like
pancreatic ductal adenocarcinoma cells. Cancers (Basel).
13:61632021. View Article : Google Scholar : PubMed/NCBI
|
|
33
|
Lau AN, Li Z, Danai LV, Westermark AM,
Darnell AM, Ferreira R, Gocheva V, Sivanand S, Lien EC, Sapp KM, et
al: Dissecting cell-type-specific metabolism in pancreatic ductal
adenocarcinoma. Elife. 9:e567822020. View Article : Google Scholar : PubMed/NCBI
|
|
34
|
Figueroa AL, Figueiredo H, Rebuffat SA,
Vieira E and Gomis R: Taurine treatment modulates circadian rhythms
in mice fed A high fat diet. Sci Rep. 6:368012016. View Article : Google Scholar : PubMed/NCBI
|
|
35
|
Pozza ED, Dando I, Biondani G, Brandi J,
Costanzo C, Zoratti E, Fassan M, Boschi F, Melisi D, Cecconi D, et
al: Pancreatic ductal adenocarcinoma cell lines display a plastic
ability to bi-directionally convert into cancer stem cells. Int J
Oncol. 46:1099–1108. 2014. View Article : Google Scholar : PubMed/NCBI
|
|
36
|
Chaqour B: Molecular control of vascular
development by the matricellular proteins CCN1 (Cyr61) and CCN2
(CTGF). Trends Dev Biol. 7:59–72. 2013.PubMed/NCBI
|
|
37
|
Livak KJ and Schmittgen TD: Analysis of
relative gene expression data using real-time quantitative PCR and
the 2(−Delta Delta C(T)) method. Methods. 25:402–408. 2001.
View Article : Google Scholar : PubMed/NCBI
|
|
38
|
Zu F, Chen H, Liu Q, Zang H, Li Z and Tan
X: Syntenin regulated by miR-216b promotes cancer progression in
pancreatic cancer. Front Oncol. 12:7907882022. View Article : Google Scholar : PubMed/NCBI
|
|
39
|
Gao D, Vela I, Sboner A, Iaquinta PJ,
Karthaus WR, Gopalan A, Dowling C, Wanjala JN, Undvall EA, Arora
VK, et al: Organoid cultures derived from patients with advanced
prostate cancer. Cell. 159:176–187. 2014. View Article : Google Scholar : PubMed/NCBI
|
|
40
|
Mao N, Zhang Z, Lee YS, Choi D, Rivera AA,
Li D, Lee C, Haywood S, Chen X, Chang Q, et al: Defining the
therapeutic selective dependencies for distinct subtypes of PI3K
pathway-altered prostate cancers. Nat Commun. 12:50532021.
View Article : Google Scholar : PubMed/NCBI
|
|
41
|
Wu T, Hu E, Xu S, Chen M, Guo P, Dai Z,
Feng T, Zhou L, Tang W, Zhan L, et al: clusterProfiler 4.0: A
universal enrichment tool for interpreting omics data. Innovation
(Camb). 2:1001412021.PubMed/NCBI
|
|
42
|
Maeser D, Gruener RF and Huang RS:
oncoPredict: An R package for predicting in vivo or cancer
patient drug response and biomarkers from cell line screening data.
Brief Bioinform. 22:bbab2602021. View Article : Google Scholar : PubMed/NCBI
|
|
43
|
Zeng D, Fang Y, Qiu W, Luo P, Wang S, Shen
R, Gu W, Huang X, Mao Q, Wang G, et al: Enhancing immuno-oncology
investigations through multidimensional decoding of tumor
microenvironment with IOBR 2.0. Cell Rep Methods. 4:1009102024.
View Article : Google Scholar : PubMed/NCBI
|
|
44
|
Racle J, de Jonge K, Baumgaertner P,
Speiser DE and Gfeller D: Simultaneous enumeration of cancer and
immune cell types from bulk tumor gene expression data. Elife.
6:e264762017. View Article : Google Scholar : PubMed/NCBI
|
|
45
|
Aran D, Hu Z and Butte AJ: xCell:
Digitally portraying the tissue cellular heterogeneity landscape.
Genome Biol. 18:2202017. View Article : Google Scholar : PubMed/NCBI
|
|
46
|
Becht E, Giraldo NA, Lacroix L, Buttard B,
Elarouci N, Petitprez F, Selves J, Laurent-Puig P, Sautès-Fridman
C, Fridman WH and de Reyniès A: Estimating the population abundance
of tissue-infiltrating immune and stromal cell populations using
gene expression. Genome Biol. 17:2182016. View Article : Google Scholar : PubMed/NCBI
|
|
47
|
Finotello F, Mayer C, Plattner C,
Laschober G, Rieder D, Hackl H, Krogsdam A, Loncova Z, Posch W,
Wilflingseder D, et al: Molecular and pharmacological modulators of
the tumor immune contexture revealed by deconvolution of RNA-seq
data. Genome Med. 11:342019. View Article : Google Scholar : PubMed/NCBI
|
|
48
|
Newman AM, Liu CL, Green MR, Gentles AJ,
Feng W, Xu Y, Hoang CD, Diehn M and Alizadeh AA: Robust enumeration
of cell subsets from tissue expression profiles. Nat Methods.
12:453–457. 2015. View Article : Google Scholar : PubMed/NCBI
|
|
49
|
Li T, Fu J, Zeng Z, Cohen D, Li J, Chen Q,
Li B and Liu XS: TIMER2.0 for analysis of tumor-infiltrating immune
cells. Nucleic Acids Res. 48:W509–W514. 2020. View Article : Google Scholar : PubMed/NCBI
|
|
50
|
Jin Y, Wang Z, He D, Zhu Y, Chen X and Cao
K: Identification of novel subtypes based on ssGSEA in
immune-related prognostic signature for tongue squamous cell
carcinoma. Cancer Med. 10:8693–8707. 2021. View Article : Google Scholar : PubMed/NCBI
|
|
51
|
Rooney MS, Shukla SA, Wu CJ, Getz G and
Hacohen N: Molecular and genetic properties of tumors associated
with local immune cytolytic activity. Cell. 160:48–61. 2015.
View Article : Google Scholar : PubMed/NCBI
|
|
52
|
Charoentong P, Finotello F, Angelova M,
Mayer C, Efremova M, Rieder D, Hackl H and Trajanoski Z: Pan-cancer
immunogenomic analyses reveal Genotype-Immunophenotype
relationships and predictors of response to checkpoint blockade.
Cell Rep. 18:248–262. 2017. View Article : Google Scholar : PubMed/NCBI
|
|
53
|
Bindea G, Mlecnik B, Tosolini M,
Kirilovsky A, Waldner M, Obenauf AC, Angell H, Fredriksen T,
Lafontaine L, Berger A, et al: Spatiotemporal dynamics of
intratumoral immune cells reveal the immune landscape in human
cancer. Immunity. 39:782–795. 2013. View Article : Google Scholar : PubMed/NCBI
|
|
54
|
Danaher P, Warren S, Dennis L, D'Amico L,
White A, Disis ML, Geller MA, Odunsi K, Beechem J and Fling SP:
Gene expression markers of tumor infiltrating leukocytes. J
Immunother Cancer. 5:182017. View Article : Google Scholar : PubMed/NCBI
|
|
55
|
Jiang P, Gu S, Pan D, Fu J, Sahu A, Hu X,
Li Z, Traugh N, Bu X, Li B, et al: Signatures of T cell dysfunction
and exclusion predict cancer immunotherapy response. Nat Med.
24:1550–1558. 2018. View Article : Google Scholar : PubMed/NCBI
|
|
56
|
Shao G, Ma Y, Qu C, Gao R, Zhu C, Qu L,
Liu K, Li N, Sun P and Cao J: Machine learning model based on the
Neutrophil-to-Eosinophil ratio predicts the recurrence of
hepatocellular carcinoma after surgery. J Hepatocell Carcinoma.
11:679–691. 2024. View Article : Google Scholar : PubMed/NCBI
|
|
57
|
Kordulewska N, Cieślińska A, Fiedorowicz
E, Jarmołowska B and Kostyra E: Effect of the Fexofenadine on the
expression of HRH-1 and HRH-4 receptor in peripheral blood
mononuclear cell isolated from children with diagnosed allergy-in
vitro study Short communication. J Pharm Pharm Sci. 22:93–97. 2019.
View Article : Google Scholar : PubMed/NCBI
|
|
58
|
Zhou W, Lim A, Edderkaoui M, Osipov A, Wu
H, Wang Q and Pandol S: Role of YAP signaling in regulation of
programmed cell death and drug resistance in cancer. Int J Biol
Sci. 20:15–28. 2024. View Article : Google Scholar : PubMed/NCBI
|
|
59
|
Creyghton MP, Cheng AW, Welstead GG,
Kooistra T, Carey BW, Steine EJ, Hanna J, Lodato MA, Frampton GM,
Sharp PA, et al: Histone H3K27ac separates active from poised
enhancers and predicts developmental state. Proc Natl Acad Sci USA.
107:21931–21936. 2010. View Article : Google Scholar : PubMed/NCBI
|
|
60
|
Wang Z, Zang C, Rosenfeld JA, Schones DE,
Barski A, Cuddapah S, Cui K, Roh TY, Peng W, Zhang MQ and Zhao K:
Combinatorial patterns of histone acetylations and methylations in
the human genome. Nat Genet. 40:897–903. 2008. View Article : Google Scholar : PubMed/NCBI
|
|
61
|
Babaahmadi-Rezaei H, Rezaei M,
Ghaderi-Zefrehi H, Azizi M, Beheshti-Nasab H and Mehta JL: Reducing
proteoglycan synthesis and NOX activity by ROCK inhibitors:
Therapeutic targets in atherosclerosis. Endocr Metab Immune Disord
Drug Targets. 22:1191–1200. 2022. View Article : Google Scholar : PubMed/NCBI
|
|
62
|
Zhong P, Nakata K, Oyama K, Higashijima N,
Sagara A, Date S, Luo H, Hayashi M, Kubo A, Wu C, et al: Blockade
of histamine receptor H1 augments immune checkpoint therapy by
enhancing MHC-I expression in pancreatic cancer cells. J Exp Clin
Cancer Res. 43:1382024. View Article : Google Scholar : PubMed/NCBI
|
|
63
|
Saito Y, Xiao Y, Yao J, Li Y, Liu W,
Yuzhalin AE, Shyu YM, Li H, Yuan X, Li P, et al: Targeting a
chemo-induced adaptive signaling circuit confers therapeutic
vulnerabilities in pancreatic cancer. Cell Discov. 10:1092024.
View Article : Google Scholar : PubMed/NCBI
|
|
64
|
Buscail L, Bournet B and Cordelier P: Role
of oncogenic KRAS in the diagnosis, prognosis and treatment of
pancreatic cancer. Nat Rev Gastro Hepat. 17:153–168. 2020.
View Article : Google Scholar : PubMed/NCBI
|
|
65
|
Vega DM, Yee LM, McShane LM, Williams PM,
Chen L, Vilimas T, Fabrizio D, Funari V, Newberg J, Bruce LK, et
al: Aligning tumor mutational burden (TMB) quantification across
diagnostic platforms: Phase II of the friends of cancer research
TMB harmonization project. Ann Oncol. 32:1626–1636. 2021.
View Article : Google Scholar : PubMed/NCBI
|
|
66
|
Krieger T, Pearson I, Bell J, Doherty J
and Robbins P: Targeted literature review on use of tumor
mutational burden status and programmed cell death ligand 1
expression to predict outcomes of checkpoint inhibitor treatment.
Diagn Pathol. 15:62020. View Article : Google Scholar : PubMed/NCBI
|
|
67
|
Meléndez B, Van Campenhout C, Rorive S,
Remmelink M, Salmon I and D'Haene N: Methods of measurement for
tumor mutational burden in tumor tissue. Transl Lung Cancer Res.
7:661–667. 2018. View Article : Google Scholar : PubMed/NCBI
|
|
68
|
Chung V, Mizrahi JD and Pant S: Novel
therapies for pancreatic cancer. JCO Oncol Pract. 21:613–619. 2025.
View Article : Google Scholar : PubMed/NCBI
|
|
69
|
Slominski RM, Raman C, Chen JY and
Slominski AT: How cancer hijacks the body's homeostasis through the
neuroendocrine system. Trends Neurosci. 46:263–275. 2023.
View Article : Google Scholar : PubMed/NCBI
|
|
70
|
Balakrishna P, George S, Hatoum H and
Mukherjee S: Serotonin pathway in cancer. Int J Mol Sci.
22:12682021. View Article : Google Scholar : PubMed/NCBI
|
|
71
|
Chen YY, Liu LP, Zhou H, Zheng YW and Li
YM: Recognition of melanocytes in Immuno-Neuroendocrinology and
circadian rhythms: Beyond the conventional melanin synthesis.
Cells. 11:20822022. View Article : Google Scholar : PubMed/NCBI
|
|
72
|
Ulisse S, Baldini E, Pironi D, Gagliardi
F, Tripodi D, Lauro A, Carbotta S, Tarroni D, D'Armiento M, Morrone
A, et al: Is melanoma progression affected by thyroid diseases? Int
J Mol Sci. 23:100362022. View Article : Google Scholar : PubMed/NCBI
|
|
73
|
Luo J and Yu FX: GPCR-Hippo signaling in
cancer. Cells. 8:4262019. View Article : Google Scholar : PubMed/NCBI
|
|
74
|
Ding YF, Ho KH, Lee WJ, Chen LH, Hsieh FK,
Tung MC, Lin SH, Hsiao M, Yang SF, Yang YC and Chien MH: Cyclic
increase in the histamine receptor H1-ADAM9-Snail/Slug axis as a
potential therapeutic target for EMT-mediated progression of oral
squamous cell carcinoma. Cell Death Dis. 16:1912025. View Article : Google Scholar : PubMed/NCBI
|
|
75
|
Shi Z, Fultz RS, Engevik MA, Gao C, Hall
A, Major A, Mori-Akiyama Y and Versalovic J: Distinct roles of
histamine H1- and H2-receptor signaling pathways in
inflammation-associated colonic tumorigenesis. Am J Physiol
Gastrointest Liver Physiol. 316:G205–G216. 2019. View Article : Google Scholar : PubMed/NCBI
|
|
76
|
Soule BP, Simone NL, DeGraff WG, Choudhuri
R, Cook JA and Mitchell JB: Loratadine dysregulates cell cycle
progression and enhances the effect of radiation in human tumor
cell lines. Radiat Oncol. 5:82010. View Article : Google Scholar : PubMed/NCBI
|
|
77
|
Salmerón C, Tomás Bort E, Sriram K,
Javadi-Paydar M, Smitham JE, Pham K, Grose RP, McCormick PJ,
DiNardo A, Weitz J, et al: Histamine H1 Receptor: A potential
therapeutic target for pancreatic ductal adenocarcinoma. J
Pharmacol Exp Ther. 392:1035732025. View Article : Google Scholar : PubMed/NCBI
|
|
78
|
Fritz I, Wagner P, Bottai M, Eriksson H,
Ingvar C, Krakowski I, Nielsen K and Olsson H: Desloratadine and
loratadine use associated with improved melanoma survival. Allergy.
75:2096–2099. 2020. View Article : Google Scholar : PubMed/NCBI
|
|
79
|
Fritz I, Wagner P, Broberg P, Einefors R
and Olsson H: Desloratadine and loratadine stand out among common
H1-antihistamines for association with improved breast
cancer survival. Acta Oncol. 59:1103–1109. 2020. View Article : Google Scholar : PubMed/NCBI
|
|
80
|
Francis T, Graf A, Hodges K, Kennedy L,
Hargrove L, Price M and Francis H: Histamine regulation of
pancreatitis and pancreatic cancer: A review of recent findings.
Hepatobil Surg Nutr. 2:216–226. 2013.PubMed/NCBI
|
|
81
|
Thines L, Gorisse L, Li Z, Sayedyahossein
S and Sacks DB: Calmodulin activates the Hippo signaling pathway by
promoting LATS1 kinase-mediated inhibitory phosphorylation of the
transcriptional coactivator YAP. J Biol Chem. 298:1018392022.
View Article : Google Scholar : PubMed/NCBI
|
|
82
|
Vania V, Wang L, Tjakra M, Zhang T, Qiu J,
Tan Y and Wang G: The interplay of signaling pathway in endothelial
cells-matrix stiffness dependency with targeted-therapeutic drugs.
Biochim Biophys Acta Mol Basis Dis. 1866:1656452020. View Article : Google Scholar : PubMed/NCBI
|
|
83
|
Wang T, Wang D, Sun Y, Zhuang T, Li X,
Yang H, Zang Y, Liu Z, Yang P, Zhang C, et al: Regulation of the
Hippo/YAP axis by CXCR7 in the tumorigenesis of gastric cancer. J
Exp Clin Canc Res. 42:2972023. View Article : Google Scholar : PubMed/NCBI
|
|
84
|
Ebia MI, Blais EM, Cui Y, Petricoin EF
III, Pishvaian M, Gaddam S, Gong J, Osipov A and Hendifar AE:
Evaluating the effect of KRAS variants on survival outcomes and
therapy response in pancreatic cancer. JCO Precis Oncol.
9:e24006842025. View Article : Google Scholar : PubMed/NCBI
|
|
85
|
Mahadevan KK, McAndrews KM, LeBleu VS,
Yang S, Lyu H, Li B, Sockwell AM, Kirtley ML, Morse SJ, Moreno Diaz
BA, et al: KRASG12D inhibition reprograms the microenvironment of
early and advanced pancreatic cancer to promote FAS-mediated
killing by CD8+ T cells. Cancer Cell. 41:1606–1620.e8. 2023.
View Article : Google Scholar : PubMed/NCBI
|
|
86
|
Bannoura SF, Uddin MdH, Nagasaka M, Fazili
F, Al-Hallak MN, Philip PA, El-Rayes B and Azmi AS: Targeting KRAS
in pancreatic cancer: New drugs on the horizon. Cancer Metast Rev.
40:819–835. 2021. View Article : Google Scholar
|
|
87
|
Yang W, Zhang M, Zhang TX, Liu JH, Hao MW,
Yan X, Gao H, Lei QY, Cui J and Zhou X: YAP/TAZ mediates resistance
to KRAS inhibitors through inhibiting proapoptosis and activating
the SLC7A5/mTOR axis. JCI Insight. 9:e1785352024. View Article : Google Scholar : PubMed/NCBI
|
|
88
|
Zhou T, Xie Y, Hou X, Bai W, Li X, Liu Z,
Man Q, Sun J, Fu D, Yan J, et al: Irbesartan overcomes gemcitabine
resistance in pancreatic cancer by suppressing stemness and iron
metabolism via inhibition of the Hippo/YAP1/c-Jun axis. J Exp Clin
Cancer Res. 42:1112023. View Article : Google Scholar : PubMed/NCBI
|
|
89
|
Dhanaraman T, Singh S, Killoran RC, Singh
A, Xu X, Shifman JM and Smith MJ: RASSF effectors couple diverse
RAS subfamily GTPases to the Hippo pathway. Sci Signal.
13:eabb47782020. View Article : Google Scholar : PubMed/NCBI
|
|
90
|
Sayedyahossein S, Babu Sait MR, Li Z,
Banerjee R, Tran A, Thines L, Karimi M, Bahmani M, Mishan N, Borzou
P, et al: KSR1 is a scaffold for the Hippo signaling pathway.
Commun Biol. 8:17252025. View Article : Google Scholar : PubMed/NCBI
|
|
91
|
Wang Y and Yu FX: Angiomotin family
proteins in the Hippo signaling pathway. Bioessays.
46:e24000762024. View Article : Google Scholar : PubMed/NCBI
|
|
92
|
Gao Y, Peng Q, Li S, Zheng K, Gong Y, Xue
Y, Liu Y, Lu J, Zhang Y and Shi X: YAP1 suppression inhibits
autophagy and improves the efficacy of anti-PD-1 immunotherapy in
hepatocellular carcinoma. Exp Cell Res. 424:1134862023. View Article : Google Scholar : PubMed/NCBI
|
|
93
|
Di Federico A, Mosca M, Pagani R, Carloni
R, Frega G, De Giglio A, Rizzo A, Ricci D, Tavolari S, Di Marco M,
et al: Immunotherapy in pancreatic cancer: Why do we keep failing?
A focus on tumor immune microenvironment, predictive biomarkers and
treatment outcomes. Cancers (Basel). 14:24292022. View Article : Google Scholar : PubMed/NCBI
|
|
94
|
Peng Q, Li S, Shi X, Guo Y, Hao L, Zhang
Z, Ji J, Zhao Y, Li C, Xue Y and Liu Y: Dihydroartemisinin broke
immune evasion through YAP1/JAK1/STAT1, 3 pathways to enhance
anti-PD-1 therapy in hepatocellular carcinoma. bioRxiv. Nov
30–2021.doi: 10.1101/2021.11.30.470572.
|
|
95
|
Shen T, Li Y, Zhu S, Yu J, Zhang B, Chen
X, Zhang Z, Ma Y, Niu Y and Shang Z: YAP1 plays a key role of the
conversion of normal fibroblasts into cancer-associated fibroblasts
that contribute to prostate cancer progression. J Exp Clin Canc
Res. 39:362020. View Article : Google Scholar
|
|
96
|
Fan Y, Gao Y, Rao J, Wang K, Zhang F and
Zhang C: YAP-1 promotes tregs differentiation in hepatocellular
carcinoma by enhancing TGFBR2 transcription. Cell Physiol Biochem.
41:1189–1198. 2017. View Article : Google Scholar : PubMed/NCBI
|
|
97
|
Murakami S, Shahbazian D, Surana R, Zhang
W, Chen H, Graham GT, White SM, Weiner LM and Yi C: Yes-associated
protein mediates immune reprogramming in pancreatic ductal
adenocarcinoma. Oncogene. 36:1232–1244. 2016. View Article : Google Scholar : PubMed/NCBI
|
|
98
|
Li H, Xiao Y, Li Q, Yao J, Yuan X, Zhang
Y, Yin X, Saito Y, Fan H, Li P, et al: The allergy mediator
histamine confers resistance to immunotherapy in cancer patients
via activation of the macrophage histamine receptor H1. Cancer
Cell. 40:36–52.e9. 2022. View Article : Google Scholar : PubMed/NCBI
|