Introduction
Cervical cancer (CC) remains one of the most
prevalent malignancies among women worldwide, with particularly
high incidence and mortality in low- and middle-income countries.
Although the implementation of human papillomavirus (HPV)
vaccination and screening programs has led to declining or
stabilized incidence and mortality in numerous developed regions,
CC continues to impose a significant global health burden, with
~660,000 new cases and 350,000 deaths annually (1–3).
Identifying patient populations that can benefit from chemotherapy,
targeted therapy, or immunotherapy is therefore critical for
improving survival outcomes.
Precision medicine guided by molecular subtyping has
become a cornerstone of oncology. For instance, patients with
advanced triple-negative breast cancer have been stratified into
molecular subgroups, with subtype-guided therapy resulting in
improved clinical outcomes (4).
Recent advances in multi-omics technologies have enabled
comprehensive molecular characterization of CC. Integrated
multi-omics and single-cell analyses have revealed that productive
HPV integration correlates with elevated E6/E7 protein expression,
enhanced tumor aggressiveness, immune evasion, and increased
disease progression from carcinoma in situ to advanced
stages (5). Nevertheless, despite
these technological advances, effective molecular biomarkers and
subtyping strategies specifically for CC remain limited,
particularly those based on kinesin family genes. Kinesin family
members (KIFs) are microtubule-associated motor proteins essential
for intracellular transport, mitosis, and cellular signaling
(6). In cancer, dysregulation of
KIFs frequently promotes cell proliferation, chromosomal
instability, invasion, metastasis, and therapy resistance. For
example, overexpression of KIF2C drives tumor progression and is
associated with poor prognosis across multiple cancers, including
CC (7–9). Although individual KIFs have been
investigated in CC, a comprehensive and systematic analysis of the
entire KIF family in this context remains lacking.
Given their critical roles in cell division,
intracellular transport and signaling pathways, it was hypothesized
that the expression patterns of KIFs may reflect underlying tumor
heterogeneity and serve as a basis for molecular classification
with prognostic and therapeutic relevance in CC. To test this
hypothesis, KIF expression profiles in CC were systematically
analyzed using multi-omics data from The Cancer Genome Atlas
(TCGA). The objectives of the present study were to identify
KIF-based molecular subtypes, characterize their multi-omics
phenotypes, tumor microenvironment (TME) features and therapeutic
responses, and validate these findings in independent cohorts. The
present study provides a novel perspective on CC heterogeneity and
offers potential biomarkers to guide personalized therapeutic
strategies.
Materials and methods
Patient cohorts and multi-omics data
acquisition
The study population consisted of three primary
cohorts. TCGA Cohort: Clinical information, follow-up data,
RNA-seq, DNA copy number, and somatic mutation data for patients
with CC were obtained from the Genomic Data Commons http://portal.gdc.cancer.gov/). RNA-seq data were
normalized using the Fragments Per Kilobase of Exon Model (FPKM)
method. FPKM values were used exclusively for survival analyses and
non-negative matrix factorization (NMF) subtyping. Prior to
subtyping, FPKM values were transformed using
log2(x+1) to approximate a normal
distribution. Subsequently, expression values of each KIF gene were
centered and scaled using the preProcess function from the caret
package with the option method=c(‘center’, ‘scale’). South Korea
and Mexico Cohorts: Gene expression and clinical follow-up data
were retrieved from the Gene Expression Omnibus (GEO, http://www.ncbi.nlm.nih.gov/geo/) under accession
numbers GSE44001 (10) and GSE52903
(11), respectively. These cohorts
included information such as age, Federation of Gynecology and
Obstetrics (FIGO) stage, and survival outcomes, disease-free
survival (DFS) for the South Korea cohort and overall survival (OS)
for the Mexico cohort. Gene expression profiles were normalized
according to the original methods reported for each dataset.
Immunotherapy datasets comprised three cohorts. The
GIDE cohort included 41 patients with melanoma treated with
anti-PD-1 monotherapy and 32 patients receiving combined ipilimumab
and anti-PD-1 therapy, with RNA sequencing performed on tissue
samples before or during early treatment (12). The Van cohort consisted of 39
patients with melanoma treated with ipilimumab, with RNA sequencing
conducted prior to therapy (13).
The IMvigor cohort included 298 patients with metastatic urothelial
carcinoma treated with intravenous atezolizumab, with RNA
sequencing of tumor samples performed before treatment as part of
the phase II IMvigor210 clinical trial (14). Due to the limited availability of
publicly accessible immunotherapy-treated CC cohorts with
transcriptomic data, these well-characterized pan-cancer
immunotherapy cohorts were used as surrogates to evaluate the
predictive performance of the KIF subtype-based immunotherapy
response models.
Non-negative matrix factorization
NMF decomposes a large non-negative matrix into two
smaller non-negative matrices (15). In the present study, NMF was
employed to reduce the dimensionality of high-dimensional KIF gene
expression data. Prior to NMF, the input matrix was preprocessed as
follows: (i) genes expressed in fewer than 50% of samples were
excluded; (ii) genes not significantly associated with OS in
patients with CC (P>0.05) were removed; and (iii)
log2(expression+1) transformation was
applied, followed by centering and scaling using the preProcess
function from the caret package. This standardization reduces
technical variability and improves comparability across samples.
The selected KIF genes were then subjected to NMF using the nmf
package in R, employing the Brunet method (16) with 30 iterations. The rank range was
set from 2 to 7, and the optimal rank was determined based on the
Brunet criterion, which considers the maximum change in cophenetic
correlation, consensus matrix clustering performance, and the
sample sizes within each category. KIF genes were pre-selected
based on their association with OS to focus clustering on
clinically relevant genes, thereby enhancing the biological
interpretability of the resulting subtypes. To avoid potential
circularity, using survival information for both gene selection and
outcome evaluation, the prognostic value of the identified subtypes
was subsequently validated in two independent external cohorts
(GSE44001 and GSE52903), which were not used during gene selection
or model development. The consistent survival differences observed
in these external datasets support the robustness and
generalizability of the KIF-based subtyping approach.
Survival analysis, concordance index
and decision curve analysis
Survival analyses were performed using the
Kaplan-Meier (KM) method and the Cox proportional hazards
regression model. Differences between KM curves were evaluated
using the log-rank test. Variables with P<0.10 in univariate Cox
regression analysis, including age, FIGO stage, body mass index
(BMI), and smoking history, were included in the multivariable Cox
proportional hazards model. Stepwise selection was applied to
determine the final model. Optimal cut-off values were identified
using maximally selected rank statistics from the R package
survminer (https://CRAN.R-project.org/package=survminer). Hazard
ratios (HRs) and 95% confidence intervals (95% CIs) were
calculated. The clinical utility of KIF subtypes was assessed by
comparing the concordance index (C-index) and decision curves, with
95% CIs for C-index values estimated via bootstrap resampling using
the R package CsChange (https://CRAN.R-project.org/package=CsChange).
Neural network model based on RNA
expression of KIFs (KRNNM)
The TCGA cohort was randomly split into a training
set (70%, n=213) and a validation set (30%, n=91). Expression
values were log-transformed and normalized prior to analysis. KRNNM
was constructed using the resilient backpropagation (RPROP)
algorithm. The input layer contained neurons corresponding to the
number of KIFs, while the output layer contained neurons
corresponding to the number of KIF subtypes. Predicted KIF subtypes
were compared with those obtained from NMF. Model performance was
evaluated using metrics including accuracy, precision, sensitivity,
specificity, and F1 score, derived from the confusion matrix. The
area under the receiver operating characteristic curve (AUROC) was
calculated using the R package pROC (https://CRAN.R-project.org/package=pROC).
Gene enrichment analysis and
proteomics data analysis
Differential expression analysis between KIF
subtypes was performed using DESeq2 on count matrices. P-values
were adjusted using the Benjamini-Hochberg (BH) method to control
the false discovery rate (FDR). Genes with FDR <0.05 and
|log2(fold change)| >1 were considered significantly
differentially expressed. Functional enrichment analysis was
conducted using the clusterProfiler package in R (https://www.bioconductor.org/packages/clusterProfiler),
focusing on Gene Ontology (GO) terms and Kyoto Encyclopedia of
Genes and Genomes (KEGG) pathways. Pathways with FDR <0.05 were
considered significantly enriched. Level 4 proteomics data for the
TCGA CC cohort were obtained from The Cancer Proteome Atlas (TCPA,
http://www.tcpaportal.org/) and analyzed
using reverse phase protein array technology, covering 218
proteins.
TME components and immune
characteristics analysis
The xCell algorithm (17) was used to estimate the cellular
composition of CC samples. Cell types with scores of zero in more
than 50% of samples or with a standard deviation <0.1 were
excluded, resulting in 48 retained cell types. Immune and stromal
scores were calculated using the ESTIMATE algorithm. Immune
characteristics included: (i) Expression of 84 immune-related
genes, categorized into 12 types; and (ii) five immune feature
scores, wound healing, IFN-γ response, overall lymphocyte
infiltration, TGF-β response and monocyte/macrophage regulation,
derived from Thorsson et al (18).
Somatic mutation and DNA copy number
variation analysis
Somatic mutation data for patients with CC were
obtained from the TCGA database. The R package maftools (https://www.bioconductor.org/packages/maftools) was
used to construct a binary mutation matrix. Only non-synonymous
mutations were considered, while synonymous mutations were treated
as wild type. Fisher's exact test was applied to identify
differentially mutated genes among KIF subtypes. Tumor mutation
burden (TMB) was calculated based on all non-synonymous mutations.
Oncogenic pathways analyzed included TP53, Wnt, RTK-RAS, PI3K,
NOTCH, Cell Cycle, Hippo, MYC, NRF2 and TGF-β. DNA copy number
variation (CNV) data, excluding germline mutations, were also
retrieved from the TCGA database. GISTIC 2.0 analysis was employed
to identify significant amplification and deletion sites in
autosomes, using hg38 as the reference genome and a q-value
threshold of <0.05. Visualizations were generated using the
maftools package.
Prediction of antitumor treatment
efficacy
Chemotherapy drug sensitivity was evaluated using
the oncoPredict algorithm (https://CRAN.R-project.org/package=oncoPredict). Drug
response data from the Genomics of Drug Sensitivity in Cancer
(GDSC, http://www.cancerrxgene.org/)
database, together with transcriptomic profiles of CC cell lines,
including HeLa, SISO, ME-180, MS751, SiHa, Ca-Ski, C-33-A,
dot2-4510, CAL-39, SKG-IIIa, HT-3, SW756 and C-4-I, were used to
train a regression model. This model predicted the sensitivity of
different KIF subtypes in patients with CC to chemotherapy agents.
The potential response of patients with CC to immunotherapy was
inferred using six computational methods: MHC-I association
immunoscore (MIAS) (19),
Immuno-predictive score (IMPRES) (20), T cell-inflamed gene expression
profile (GEP) score (21), Tumor
immune dysfunction and exclusion (TIDE) score (22), Immunophenoscore (IPS) (23) and subclass mapping (submap)
(24). Predictions from these six
algorithms were integrated into a composite scoring system. For
each algorithm, subtypes with higher immune scores (indicating
improved predicted response) received 1 point, and subtypes with
lower scores received 0 points. A total score >3 (at least four
out of six algorithms predicting response) was used as an empirical
threshold to define a high probability of benefit. This threshold
is exploratory and has not been optimized on training data, and its
predictive performance was evaluated in three independent
immunotherapy cohorts. The prediction model was subsequently
applied to immunotherapy datasets to assign KIF subtypes and
compare objective response rates (ORR). Treatment efficacy was
assessed using RECIST 1.1 criteria (http://www.recist.com/), with complete response or
partial response defined as an objective response, and progressive
disease or stable disease classified as non-objective response. It
should be noted that chemotherapy sensitivity predictions were
derived from cell line models (GDSC database) and may not fully
recapitulate in vivo drug responses in patients with CC due
to differences in TME, pharmacokinetics, and inter-patient
heterogeneity. Therefore, these predictions are exploratory and
require further validation in preclinical models and clinical
cohorts.
Immunohistochemistry
To independently validate the protein expression of
the identified marker KIFs (KIF1A and KIF4A) in an external cohort,
commercially available tissue microarrays (TMAs) containing tumor
tissues and paired adjacent non-tumor tissues from 80 Chinese
patients with CC were obtained (cat. no. CXC1601; Shanghai Zhuohao
Pharmaceutical Company). Written informed consent had been obtained
from all patients, and ethical approval for the collection and use
of these samples was granted by the company's institutional review
board. Immunohistochemistry (IHC) staining for KIF1A and KIF4A was
performed in our laboratory on these TMAs. After staining, slides
were evaluated as follows: five fields of view were randomly
selected per slide under a microscope (magnification, ×200).
Staining intensity was scored as 0 (very weak), 1 (weak), 2
(moderate), or 3 (strong), and the proportion of protein-positive
cells was scored as 1 (0–25%), 2 (25–50%), 3 (50–75%), or 4
(>75%). The staining score for each field was calculated by
multiplying the intensity score by the proportion score, and the
mean of these scores was used as the final staining score for the
slide. Cases were classified into high- and low-expression groups
based on the optimal cutoff value. The resulting IHC scoring data
were then used to develop and validate the KKIHC classification
system as an independent confirmation of the bioinformatics-derived
KIF subtypes.
Statistical analysis
Subtype-specific differentially expressed genes were
identified as those consistently upregulated or downregulated in
one subtype compared with the other two, with no significant
expression differences observed between the other two subtypes, as
determined by the Wilcoxon test. Multinomial logistic regression
analysis was subsequently performed on the selected KIFs, and genes
with P<0.001 were designated as marker KIFs. Missing data were
present in several clinical variables: Serum CA125 levels (12%
missing), serum SCC levels (15% missing), BMI (8% missing), and
tumor grade (5% missing). Variables with less than 20% missingness
were imputed using the Monte Carlo method with multiple imputation
by chained equations (5 imputations, 10 iterations). The imputation
model included all variables used in subsequent analyses to
preserve multivariate relationships. Sensitivity analyses comparing
results with and without imputation yielded similar conclusions,
indicating that the imputation did not introduce substantial bias.
Group differences in categorical variables were assessed using the
Chi-square test or Fisher's exact test. For continuous variables,
two-group comparisons were conducted using the Wilcoxon test, and
comparisons among three or more groups were performed using the
Kruskal-Wallis test. Correlation analyses were conducted using
Spearman's rank correlation. Unless otherwise specified, all
statistical tests were two-sided, and a P<0.05 was considered to
indicate a statistically significant difference. All statistical
analyses were performed using R software (version 4.2.2; R
Foundation for Statistical Computing).
Results
Expression patterns and prognostic
values of KIFs
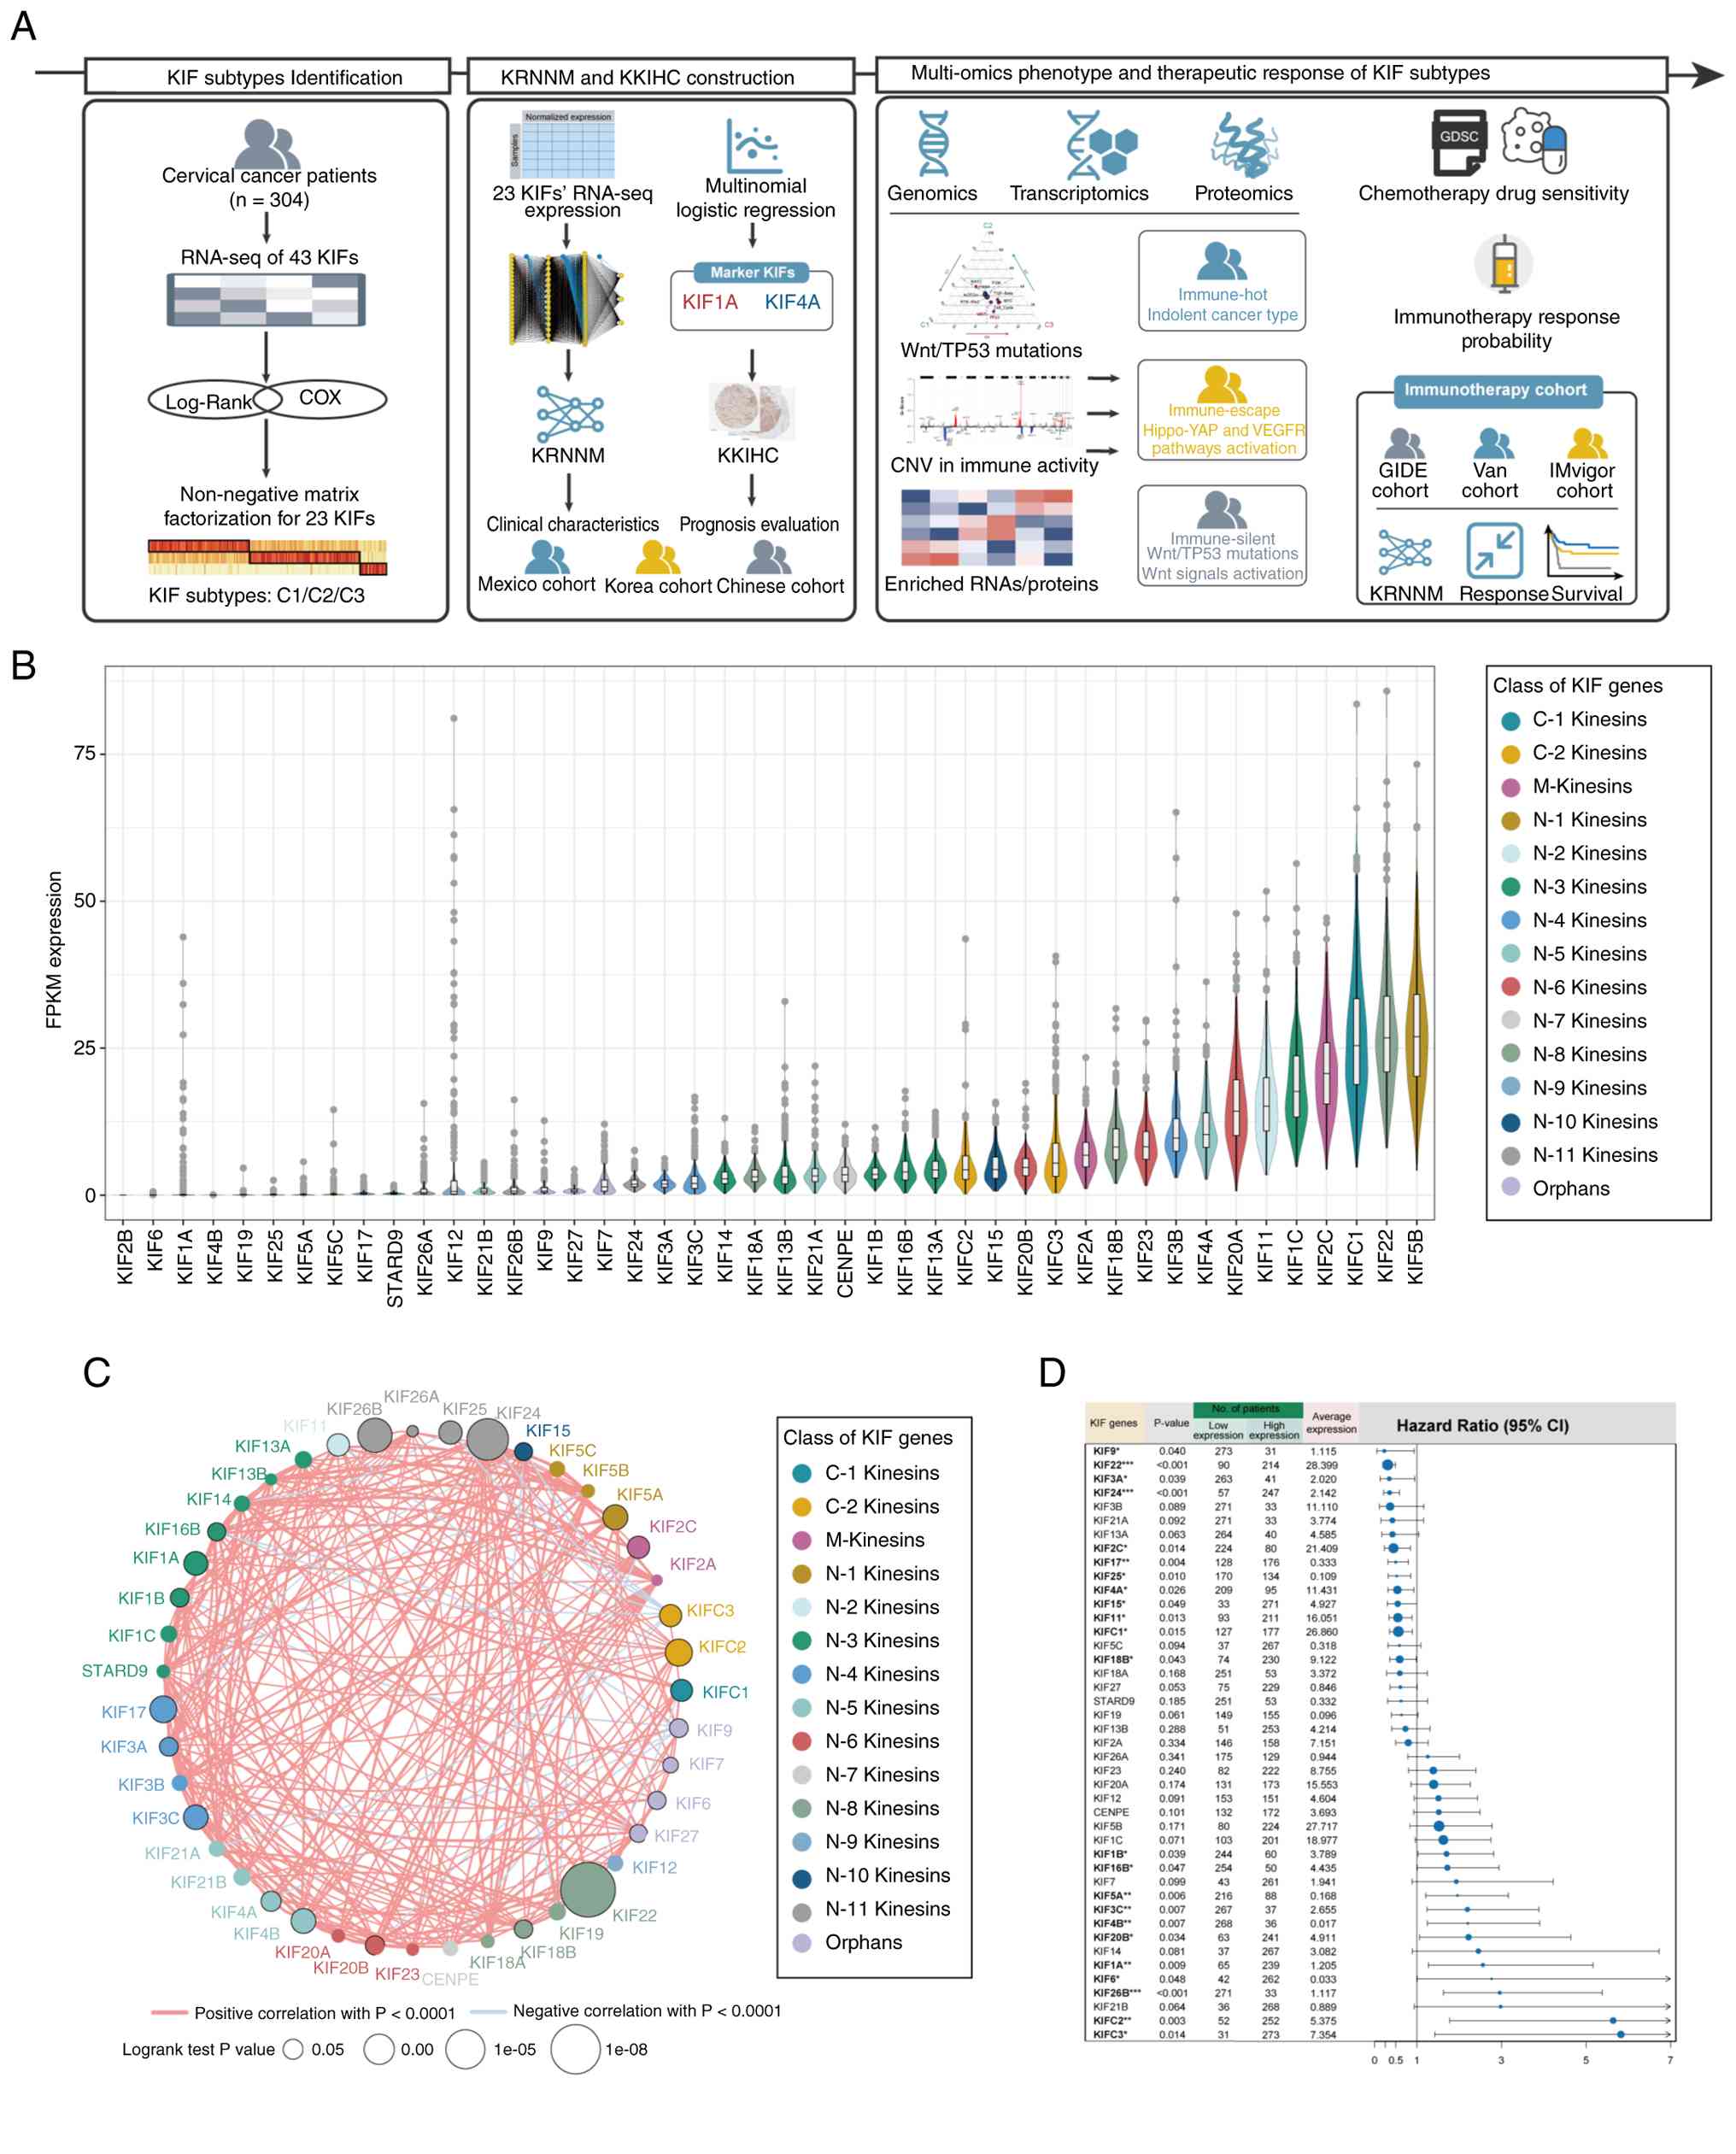
The overall study design is illustrated in Fig. 1A. Expression levels varied
substantially across KIFs, with certain members (for example,
KIF1A) exhibiting pronounced inter-patient heterogeneity (Fig. 1B). The expression of most KIFs was
positively correlated, although a few (for example, KIFC3 and KIF9)
demonstrated negative correlations with other KIFs (Fig. 1C). A total of 23 KIFs were
significantly associated with OS in patients with CC (Fig. 1D).
Clinical characteristics and
prognostic differences among KIF subtypes
A total of 304 patients with CC from the TCGA cohort
were analyzed, with additional validation cohorts from South Korea
(n=300) and Mexico (n=55) (Tables
SI and SII). NMF clustering of
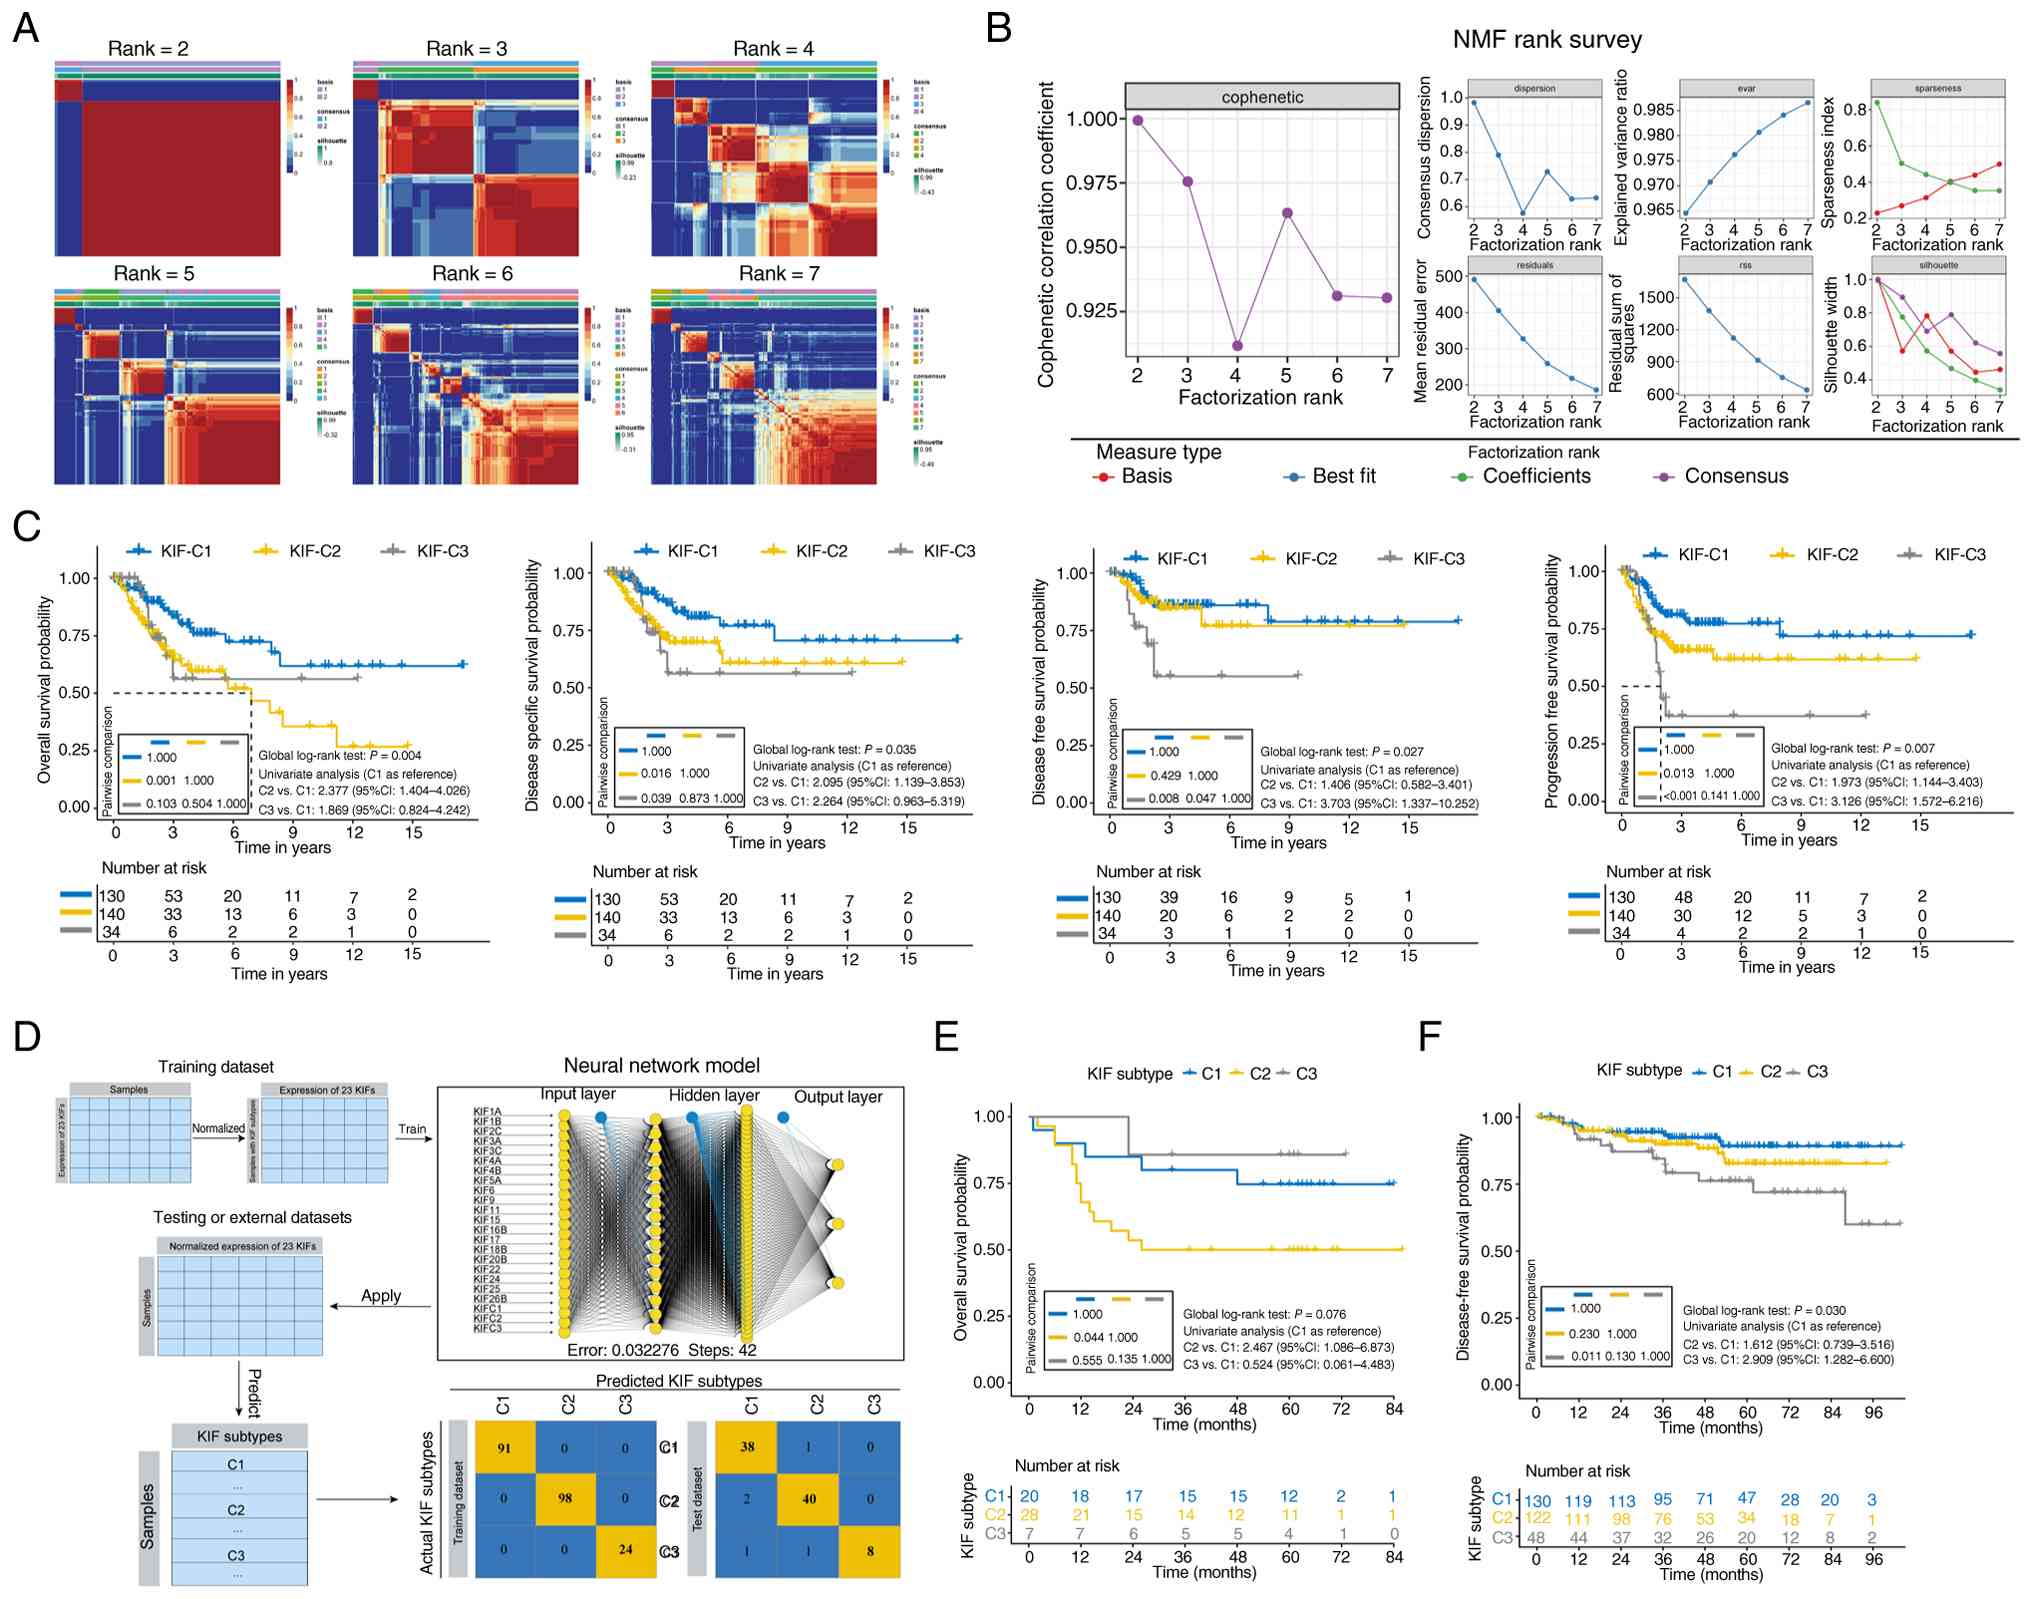
the 23 prognostically significant KIFs identified three subtypes:
C1 (n=130), C2 (n=140) and C3 (n=34) (Fig. 2A and B). Based on univariate
analysis, variables with P<0.10, including age, FIGO stage, BMI
and smoking history, were entered into the multivariable Cox
proportional hazards model (Table
SIII).
C2 patients exhibited worse OS compared with C1
patients (log-rank test P=0.001), with multivariate analysis
showing an increased risk of poor OS (HR=1.887, 95% CI:
1.052–3.384, P=0.033, Table I). C2
patients also had poorer disease-specific survival relative to C1
(log-rank test P=0.016; HR=1.903, 95% CI: 1.018–3.556, P=0.044,
Table I).
 | Table I.Multivariate Cox model analysis of
the prognostic value of KIF subtypes. |
Table I.
Multivariate Cox model analysis of
the prognostic value of KIF subtypes.
| Model | HR | 95LL | 95UL | P-value |
|---|
| Multivariable
analysis model 1a
(overall survival) |
|
|
|
|
| C1 | Ref. |
|
|
|
| C2 | 1.887 | 1.052 | 3.384 | 0.033 |
| C3 | 1.757 | 0.764 | 4.041 | 0.185 |
| Multivariable
analysis model 2a
(disease-specific survival) |
|
|
|
|
| C1 | Ref. |
|
|
|
| C2 | 1.903 | 1.018 | 3.556 | 0.044 |
| C3 | 2.078 | 0.875 | 4.934 | 0.097 |
| Multivariable
analysis model 3a
(disease-free survival) |
|
|
|
|
| C1 | Ref. |
|
|
|
| C2 | 1.318 | 0.523 | 3.318 | 0.558 |
| C3 | 3.859 | 1.390 | 10.717 | 0.010 |
| Multivariable
analysis model 4a
(progression-free survival) |
|
|
|
|
| C1 | Ref. |
|
|
|
| C2 | 1.514 | 0.842 | 2.723 | 0.166 |
| C3 | 2.892 | 1.447 | 5.777 | 0.003 |
Compared with C1, C3 patients had shorter DFS
(log-rank P=0.008) and progression-free survival (PFS, log-rank
P<0.001) (Fig. 2C). Multivariate
analysis indicated that the C3 subtype was associated with shorter
DFS (HR=3.859, 95% CI: 1.390–10.717, P=0.010) and shorter PFS
(HR=2.892, 95% CI: 1.447–5.777, P=0.003, Table I).
Significant differences in BMI (P=0.025) and tumor
grade (P=0.033) were observed among the three subtypes, with C3
patients exhibiting higher tumor grade, a feature generally
associated with more aggressive tumor behavior (Table SIV).
Development and initial validation of
KRNNM
A neural network prediction model (KRNNM) was
constructed based on the expression of the 23 KIFs (Fig. 2D). The model achieved near-perfect
performance on the training set (AUROC = 0.972, accuracy = 97.7%)
and high accuracy on the validation set (AUROC = 0.930, accuracy =
89.0%) (Table SV). This model was
applied to two independent CC cohorts. In the Mexico cohort, C2
patients exhibited significantly worse OS than C1 patients
(HR=2.47, 95% CI: 1.09–6.87, P=0.044, Fig. 2E). In the South Korea cohort, C3
patients had significantly worse DFS than C1 patients (HR=2.91, 95%
CI: 1.28–6.60, P=0.011, Fig.
2F).
The prognostic value of KIF subtypes was further
assessed using C-index and decision curve analysis (DCA). In the
TCGA cohort, the C-index for OS improved from 0.616 (95% CI:
0.536–0.696) with FIGO staging alone to 0.700 (95% CI: 0.631–0.769)
when combined with KIF subtypes (P=0.001). In the Mexico cohort,
the C-index increased from 0.518 (95% CI: 0.401–0.633) to 0.642
(95% CI: 0.539–0.747) (P=0.040). DCA indicated that incorporation
of KIF subtypes increased the net clinical benefit for patients
(Fig. S1A-F).
Genomic alterations in the C3 subtype
are enriched in Wnt and TP53 pathways
The most frequently mutated genes across all KIF
subtypes were TTN and PIK3CA (Fig.
S2). TP53 and FSIP2 exhibited higher mutation rates in C3
patients, while PIK3R4 mutations were almost exclusively observed
in C3 (P<0.05, Fig. 3A).
Significantly higher mutation frequencies were observed in the Wnt
and TP53 signaling pathways in C3 patients compared with other
subtypes (P<0.05, Fig. 3B). No
significant differences in TMB were detected among the three
subtypes (Fig. 3C).
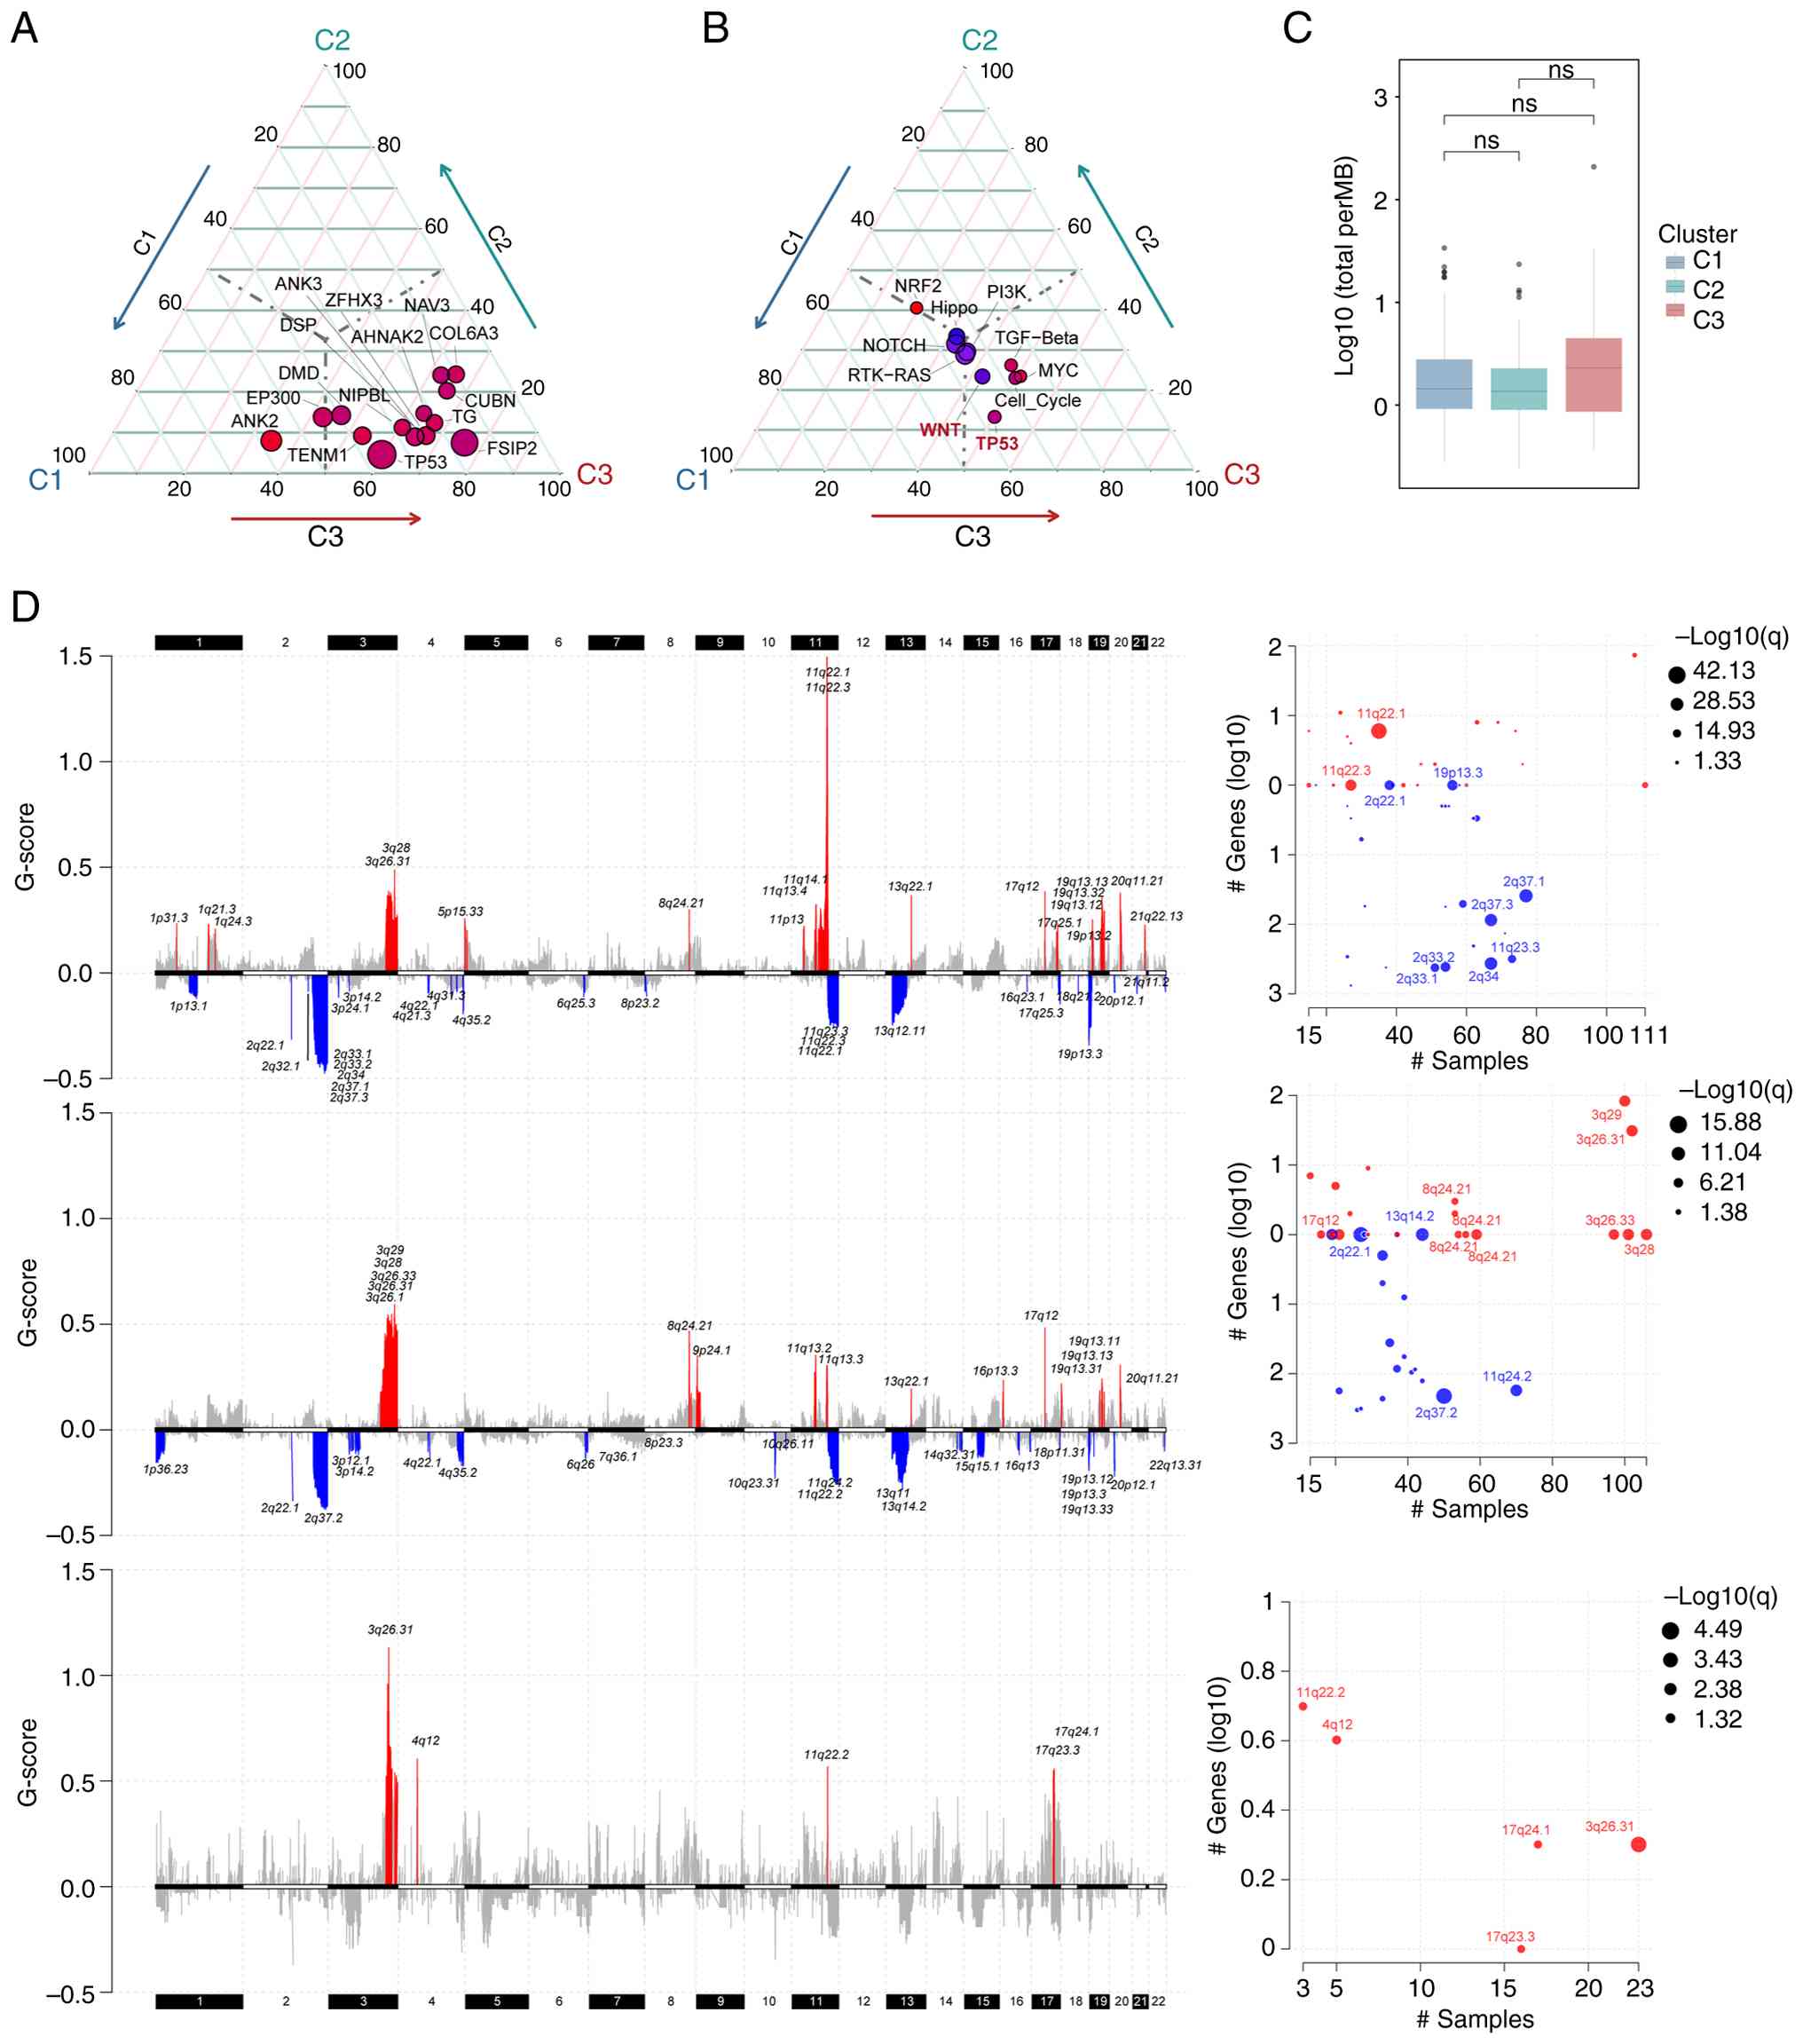 | Figure 3.Somatic mutation profiles and DNA
copy number variation of patients with cervical cancer across
different KIF subtypes. (A) Genes with differential mutation
frequencies among C1, C2 and C3 groups, showing only genes with an
overall mutation rate >10%. (B) Mutation status of common
oncogenic pathway gene sets across C1, C2, and C3 groups. (C) Tumor
mutation burden across C1, C2, and C3 groups (ns, not significant).
(D) From top to bottom: C1, C2 and C3 subtypes. The left panel
displays the distribution of GISTIC scores across chromosomal loci,
with red indicating significantly amplified regions and blue
indicating significantly deleted regions. The right panel presents
a bubble chart depicting sample alteration frequency and the number
of genes involved in the ten chromosomal loci with the lowest false
discovery rate values. ns, not significant. |
Analysis of CNV revealed that C1 and C2 patients
exhibited relatively high-level CNVs, whereas C3 patients displayed
fewer significantly amplified or deleted loci (Fig. 3D). FNDC3B was the only gene commonly
amplified across all three subtypes (Fig. S3A and B). Enrichment analysis of
subtype-specific CNV genes indicated that C1-specific amplified
genes were enriched in B-cell differentiation and TNF receptor
binding, whereas C2-specific amplified genes were enriched in
T-cell proliferation pathways (Fig.
S3C).
Transcriptomics and proteomics
analyses
Transcriptome analysis showed that YAP1 was
upregulated in C2, while KIF1A was upregulated and IL1A
downregulated in C3 (Fig. 4A).
Functional enrichment analysis revealed that immune-related
pathways, such as leukocyte chemotaxis, were upregulated in C2 but
downregulated in C3. Hippo-YAP and VEGFR signaling pathways were
enriched in C2, whereas Wnt signaling was enriched in C3 (Fig. 4B). Proteomics analysis revealed
consistent alterations: in C2 patients, YAP and YAP_pS127, as well
as VEGFR2, were upregulated, whereas LCK protein was downregulated
in C3 patients (Fig. 4C).
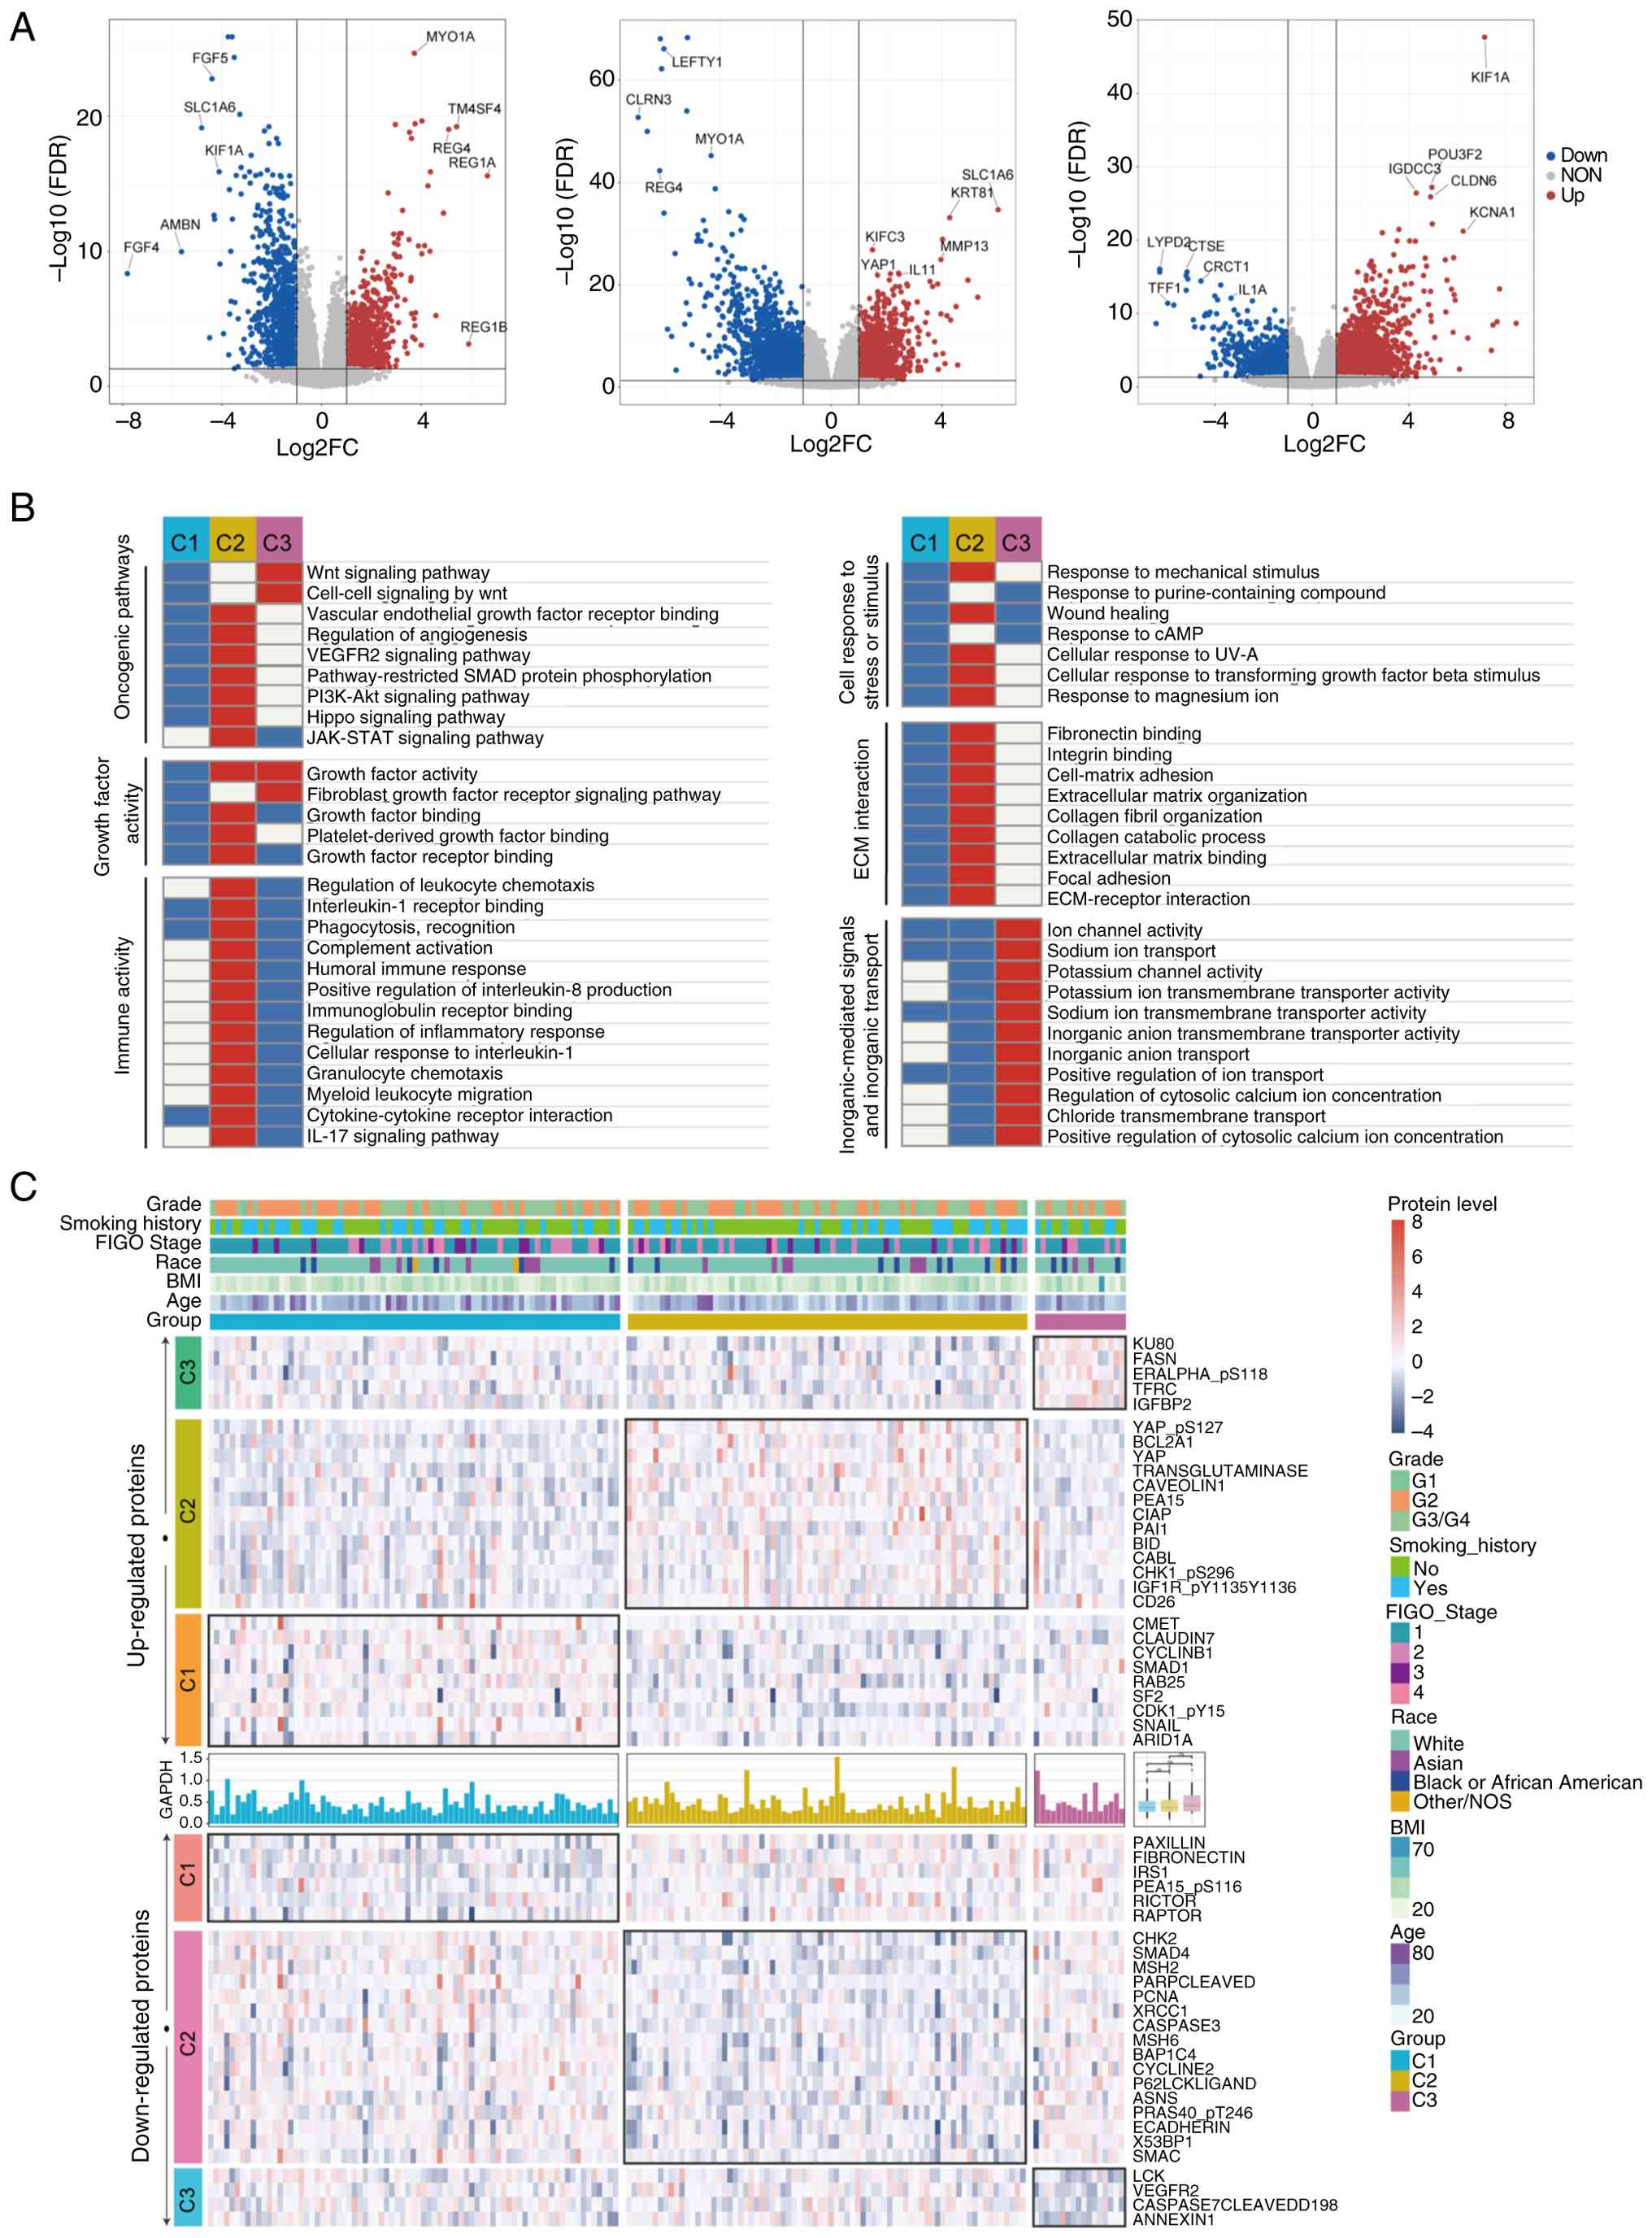 | Figure 4.Transcriptome and proteomics
analyses. (A) Volcano plots illustrating differential gene
expression across the transcriptome for patients classified as C1,
C2 and C3 subtypes. Significantly upregulated genes are shown in
red, significantly downregulated genes in blue, and non-significant
genes in gray. The x-axis represents log2 FC in gene
expression between groups, and the y-axis depicts -log10
FDR. Genes with the highest log2FC and FDR values are
labeled to highlight prominent differential expression. (B)
Enrichment analysis of differentially expressed genes across the
transcriptome for C1, C2 and C3 patients. Pathways and biological
processes are grouped into categories including oncogenic pathways,
growth factor activity, cellular response to stress or stimuli, ECM
interaction, immune activity, and inorganic ion transport. The
heatmap illustrates relative enrichment within each subtype, with
red indicating upregulation and blue indicating downregulation. (C)
Proteomics results for patients with cervical cancer. The heatmap
displays proteins specifically upregulated or downregulated in each
subtype. Clinical variables, including grade, smoking history, FIGO
stage, race, body mass index and age, are annotated at the top. The
upper panel shows upregulated proteins, and the lower panel shows
downregulated proteins. FC, fold-change; FDR, false discovery rate;
ECM, extracellular matrix. |
TME and immune characteristics
Within the TME, C1 patients exhibited higher
infiltration of lymphoid cells, including CD8+ T cells,
B cells and Th1 cells, whereas C2 patients displayed increased
mesenchymal and endothelial cell populations. C3 patients
demonstrated reduced lymphoid and myeloid cell infiltration (for
example, CD4+ Tem cells, dendritic cells) and increased
fibroblast content (Fig. S4).
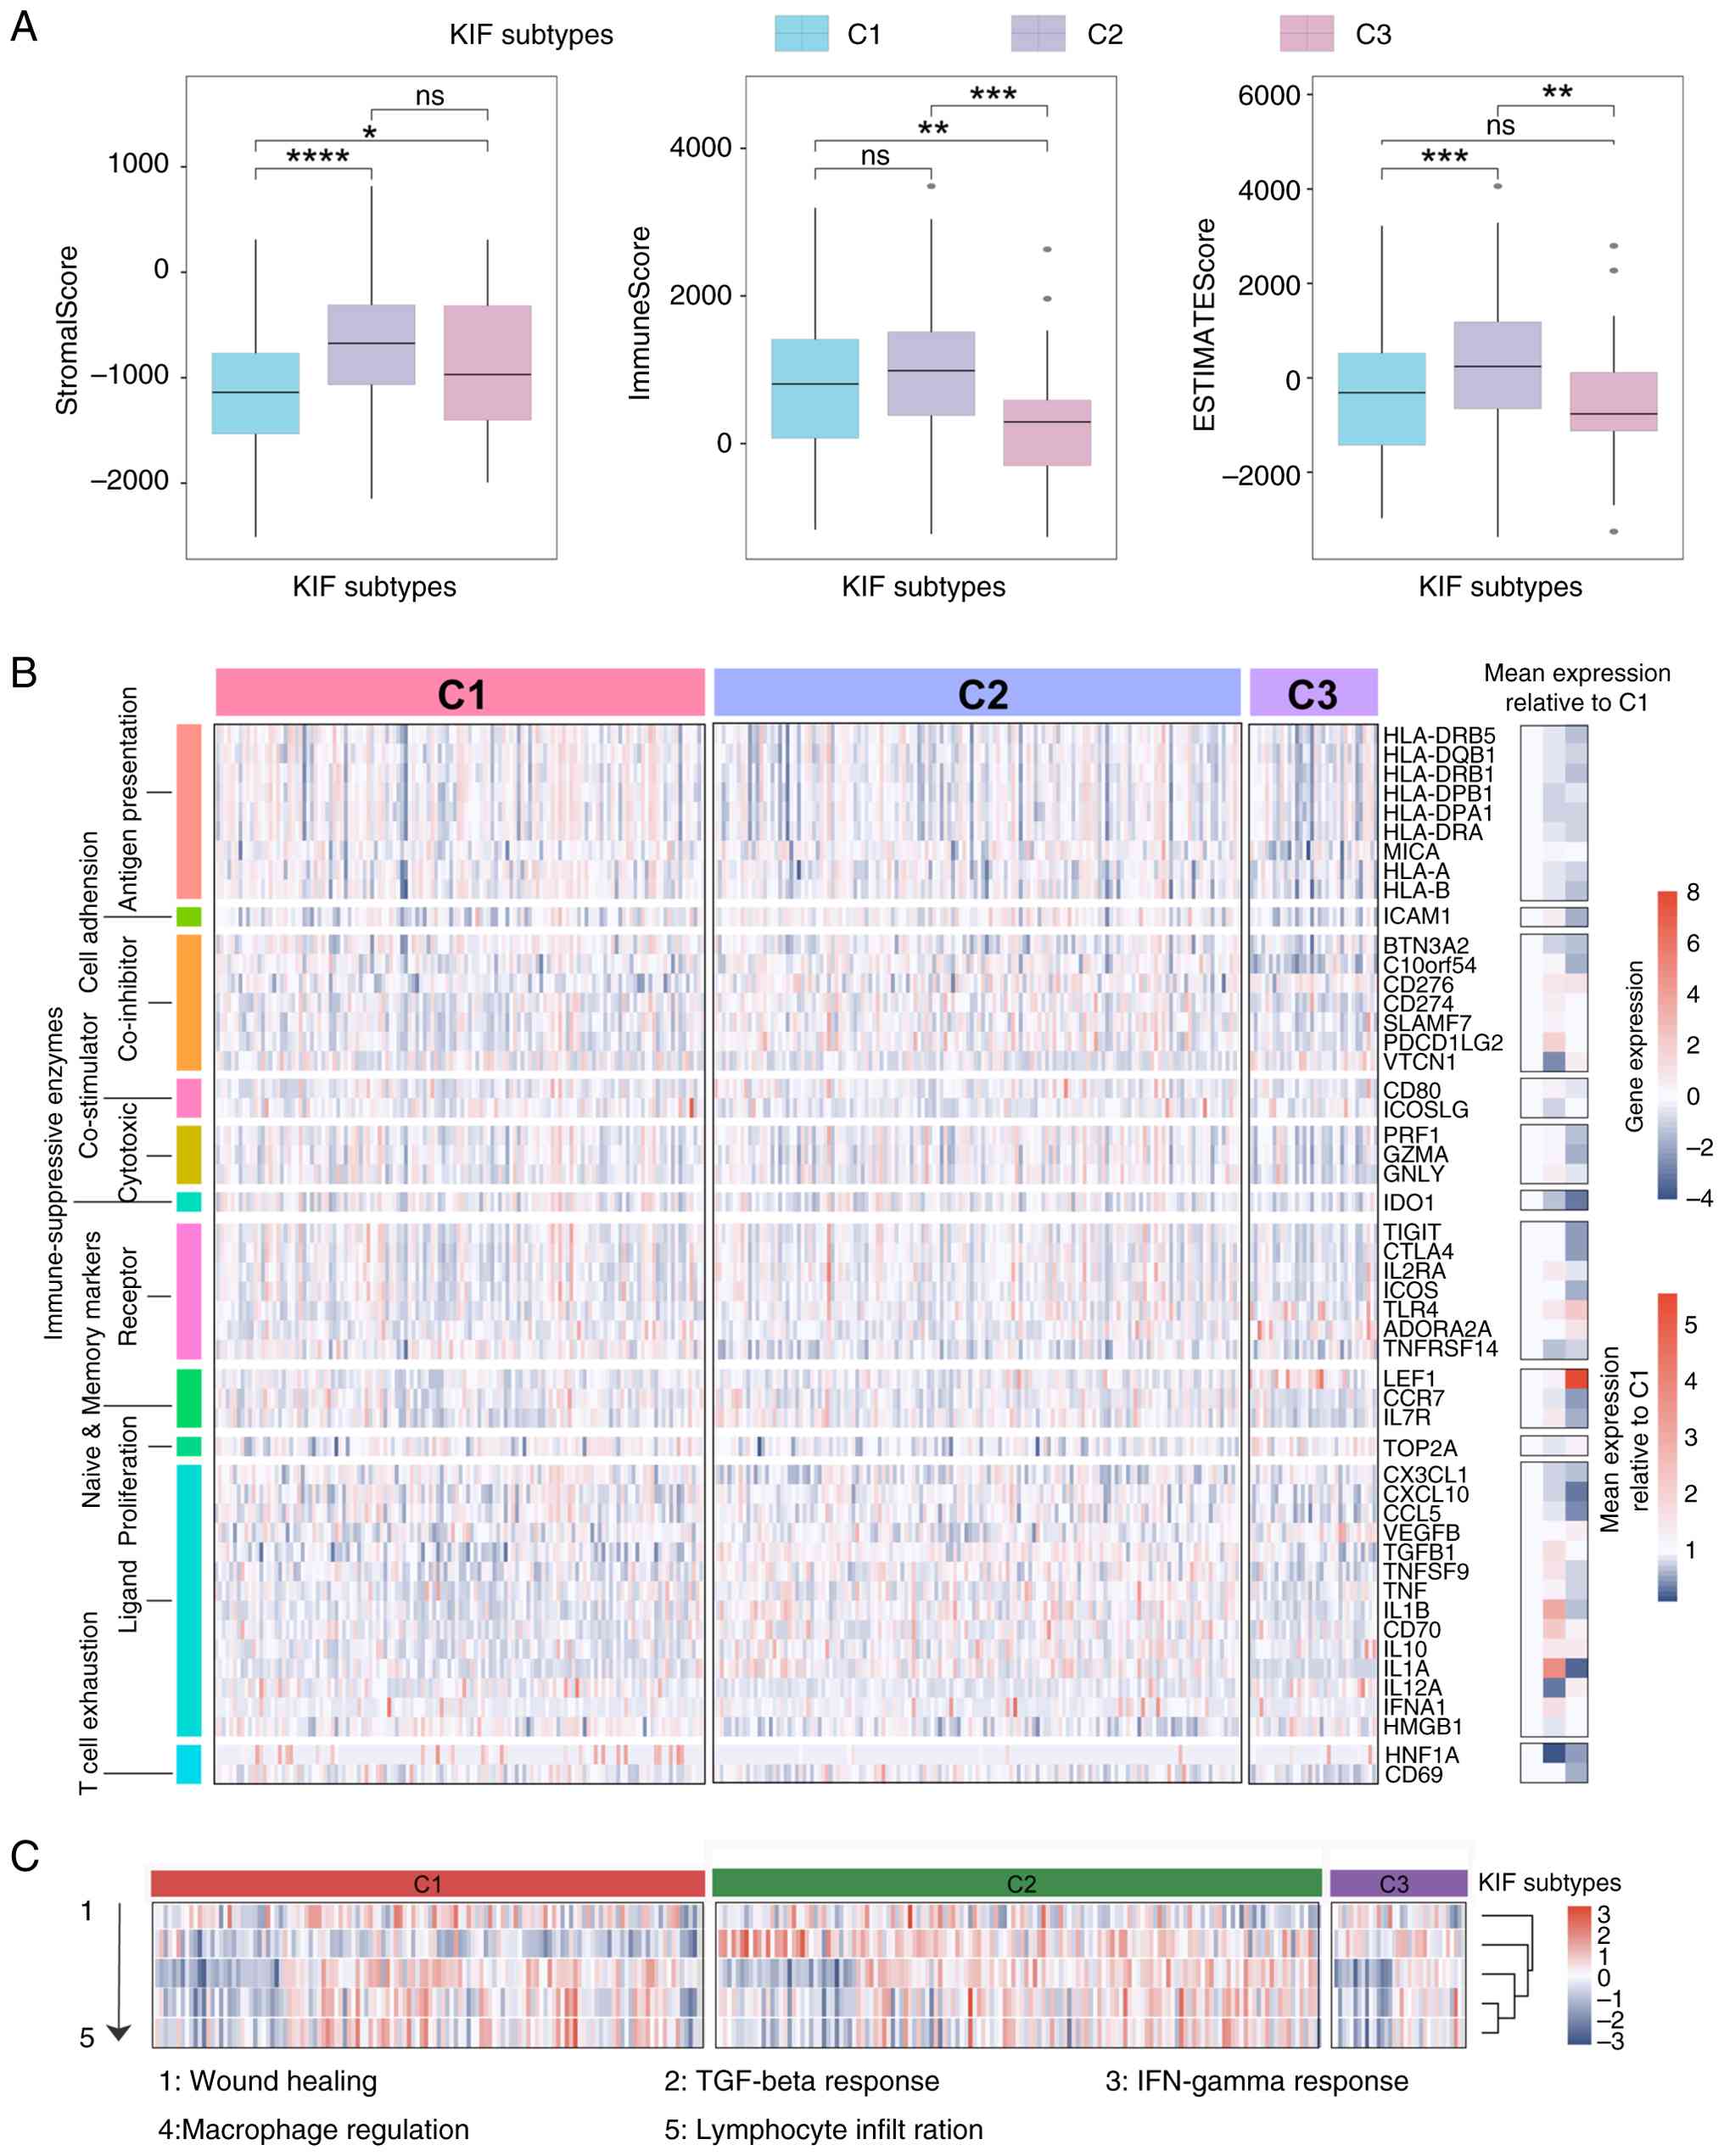
C1 patients had lower stromal scores, whereas C3
exhibited lower immune scores; overall microenvironment scores were
highest in C2 (Fig. 5A). HLA
molecule expression was reduced in C3 compared with C1 patients
(Fig. 5B). Cytotoxic genes,
including PRF1, GZMA and GNLY, showed similar expression levels in
C1 and C2, whereas inflammation-related genes, such as IL1A and
TGFB1, were highly expressed in C2. TCF1 (HNF1A) expression was
lower in C2 patients (Fig. 5B), and
TGF-β response scores were elevated in both C2 and C3 patients
(Fig. 5C).
Predicted therapeutic responsiveness
difference among KIF subtypes
Predicted sensitivity to nine chemotherapy agents
was assessed across KIF subtypes. C2 patients exhibited
significantly lower predicted IC50 values for bleomycin,
cetuximab and mitomycin C, whereas they were less sensitive to
cisplatin and gemcitabine. C1 patients were less sensitive to
5-fluorouracil and docetaxel but more sensitive to cisplatin and
gemcitabine, while C3 patients were less sensitive to cetuximab and
mitomycin C but more sensitive to gemcitabine (Fig. S5).
Predicted immunotherapy responses differed among
subtypes. C1 and C2 patients had significantly higher predicted
MIAS and GEP scores than C3, and C1 patients exhibited lower
predicted TIDE scores (Fig. 6A).
For IMPRES and IPS scores, C1 and C2 included significantly more
high-scoring patients than C3 (P<0.05, Fig. 6B). Submap analysis predicted C1
patients as likely responders to immunotherapy (Fig. 6C). Overall, C1 patients displayed
the highest predicted probability of benefiting from immunotherapy,
followed by C2, with C3 patients showing the lowest predicted
response (Fig. 6D).
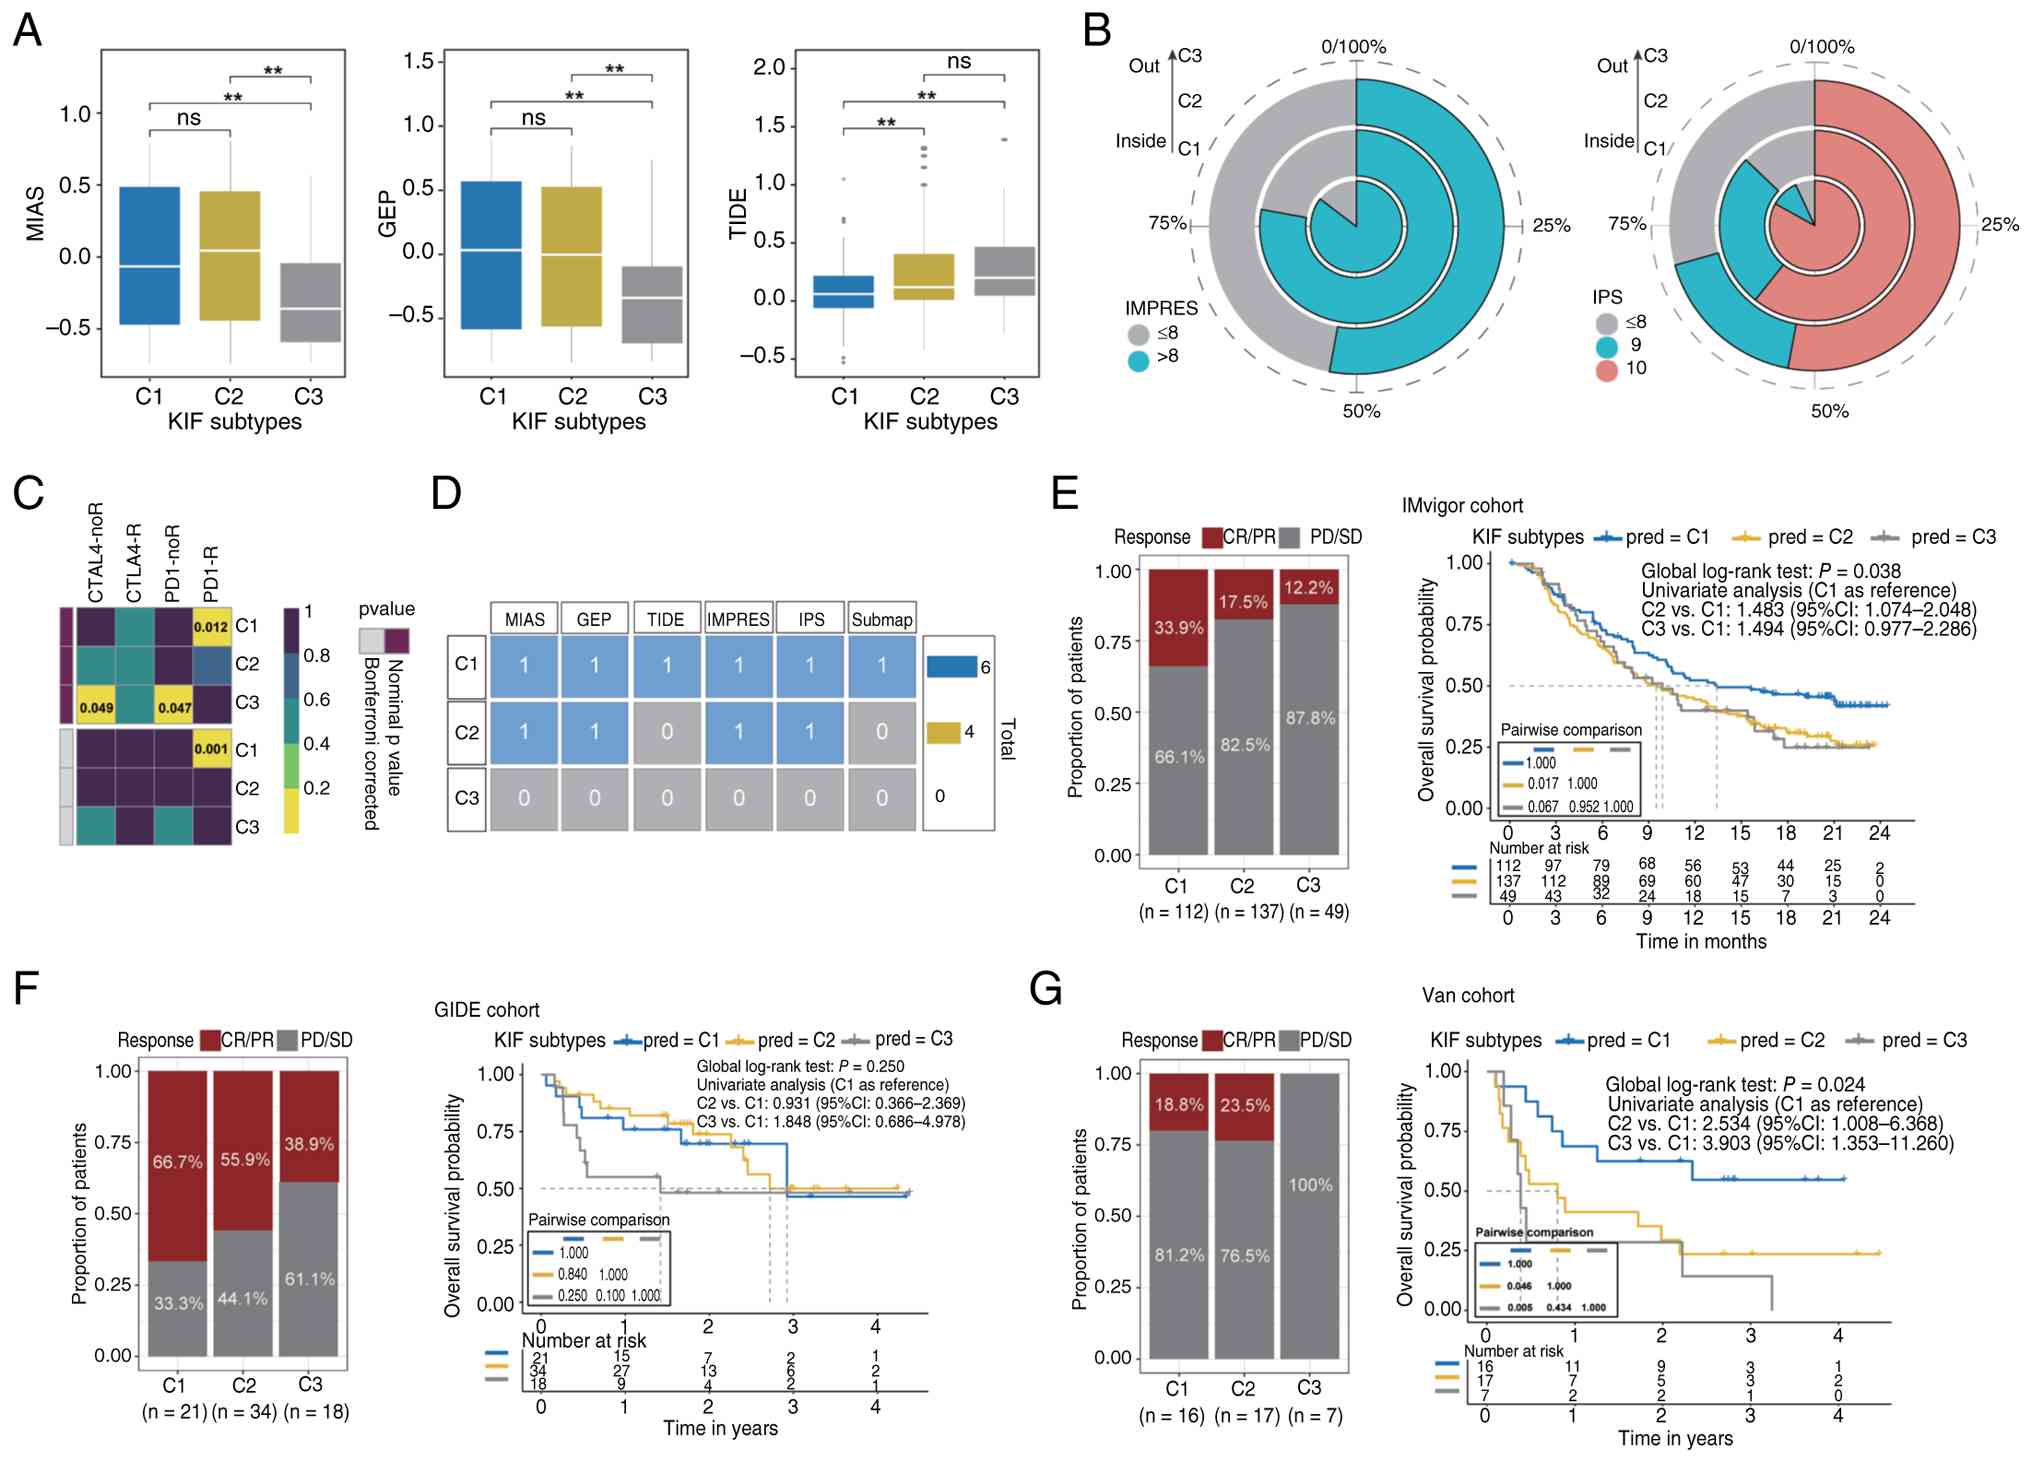 | Figure 6.Immunotherapy sensitivity scores and
predicted objective response rates. (A) MIAS, GEP and TIDE scores
for different KIF subtypes, with statistical significance
annotated. **P<0.01. ns, not significant. (B) Distribution of
high-scoring patients according to IMPRES and IPS assessments. (C)
Assessment of potential immunotherapy responsiveness using the
Submap algorithm. (D) Summary of overall immune benefit scores for
each subtype across all six prediction methods. (E-G) Comparison of
objective response rates (CR/PR) and overall survival probabilities
among KIF subtypes in three independent immunotherapy cohorts
(IMvigor, GIDE and Van). Left panels display the proportion of
patients achieving CR/PR vs. PD/SD, and right panels present
Kaplan-Meier survival curves with pairwise comparisons of overall
survival among subtypes. KIF, kinesin family genes; CR, complete
response; PR, partial response; PD, progressive disease; SD, stable
disease; CI, confidence interval. |
Using the KRNNM model, KIF subtypes were predicted
in three independent immunotherapy cohorts (IMvigor, GIDE, Van),
and ORR were calculated as exploratory endpoints. In the IMvigor
cohort (metastatic urothelial carcinoma), ORR was 33.9% for C1,
17.5% for C2, and 12.2% for C3, with significant differences among
subtypes (P<0.05). C2 patients had worse OS than C1 (HR=1.483,
95% CI: 1.074–2.048, Fig. 6E). In
the GIDE cohort (melanoma), ORR was 66.7% for C1, 55.9% for C2, and
38.9% for C3 (Fig. 6F). In the Van
cohort (melanoma), ORR was 18.8% for C1, 23.5% for C2, and 0% for
C3; C2 and C3 patients exhibited worse OS than C1 (HR=2.534 and
3.903, respectively, Fig. 6G).
These results indicate that C1 patients had the highest predicted
probability of immunotherapy response, followed by C2, with C3
patients predicted to have the lowest probability.
Association of KIF subtypes with
clinical characteristics and prognosis in Chinese patients with
CC
KIF4A was identified as a marker of C2 (OR for C1
and C3 vs. C2: 3.274 and 2.923, respectively, Table II), and KIF1A was a marker of C3
(OR for C1 and C2 vs. C3: 0.009 and 0.003, respectively, Table III). KIF1A exhibited specific high
expression in C3, whereas KIF4A expression was significantly lower
in C2 (Fig. 7A).
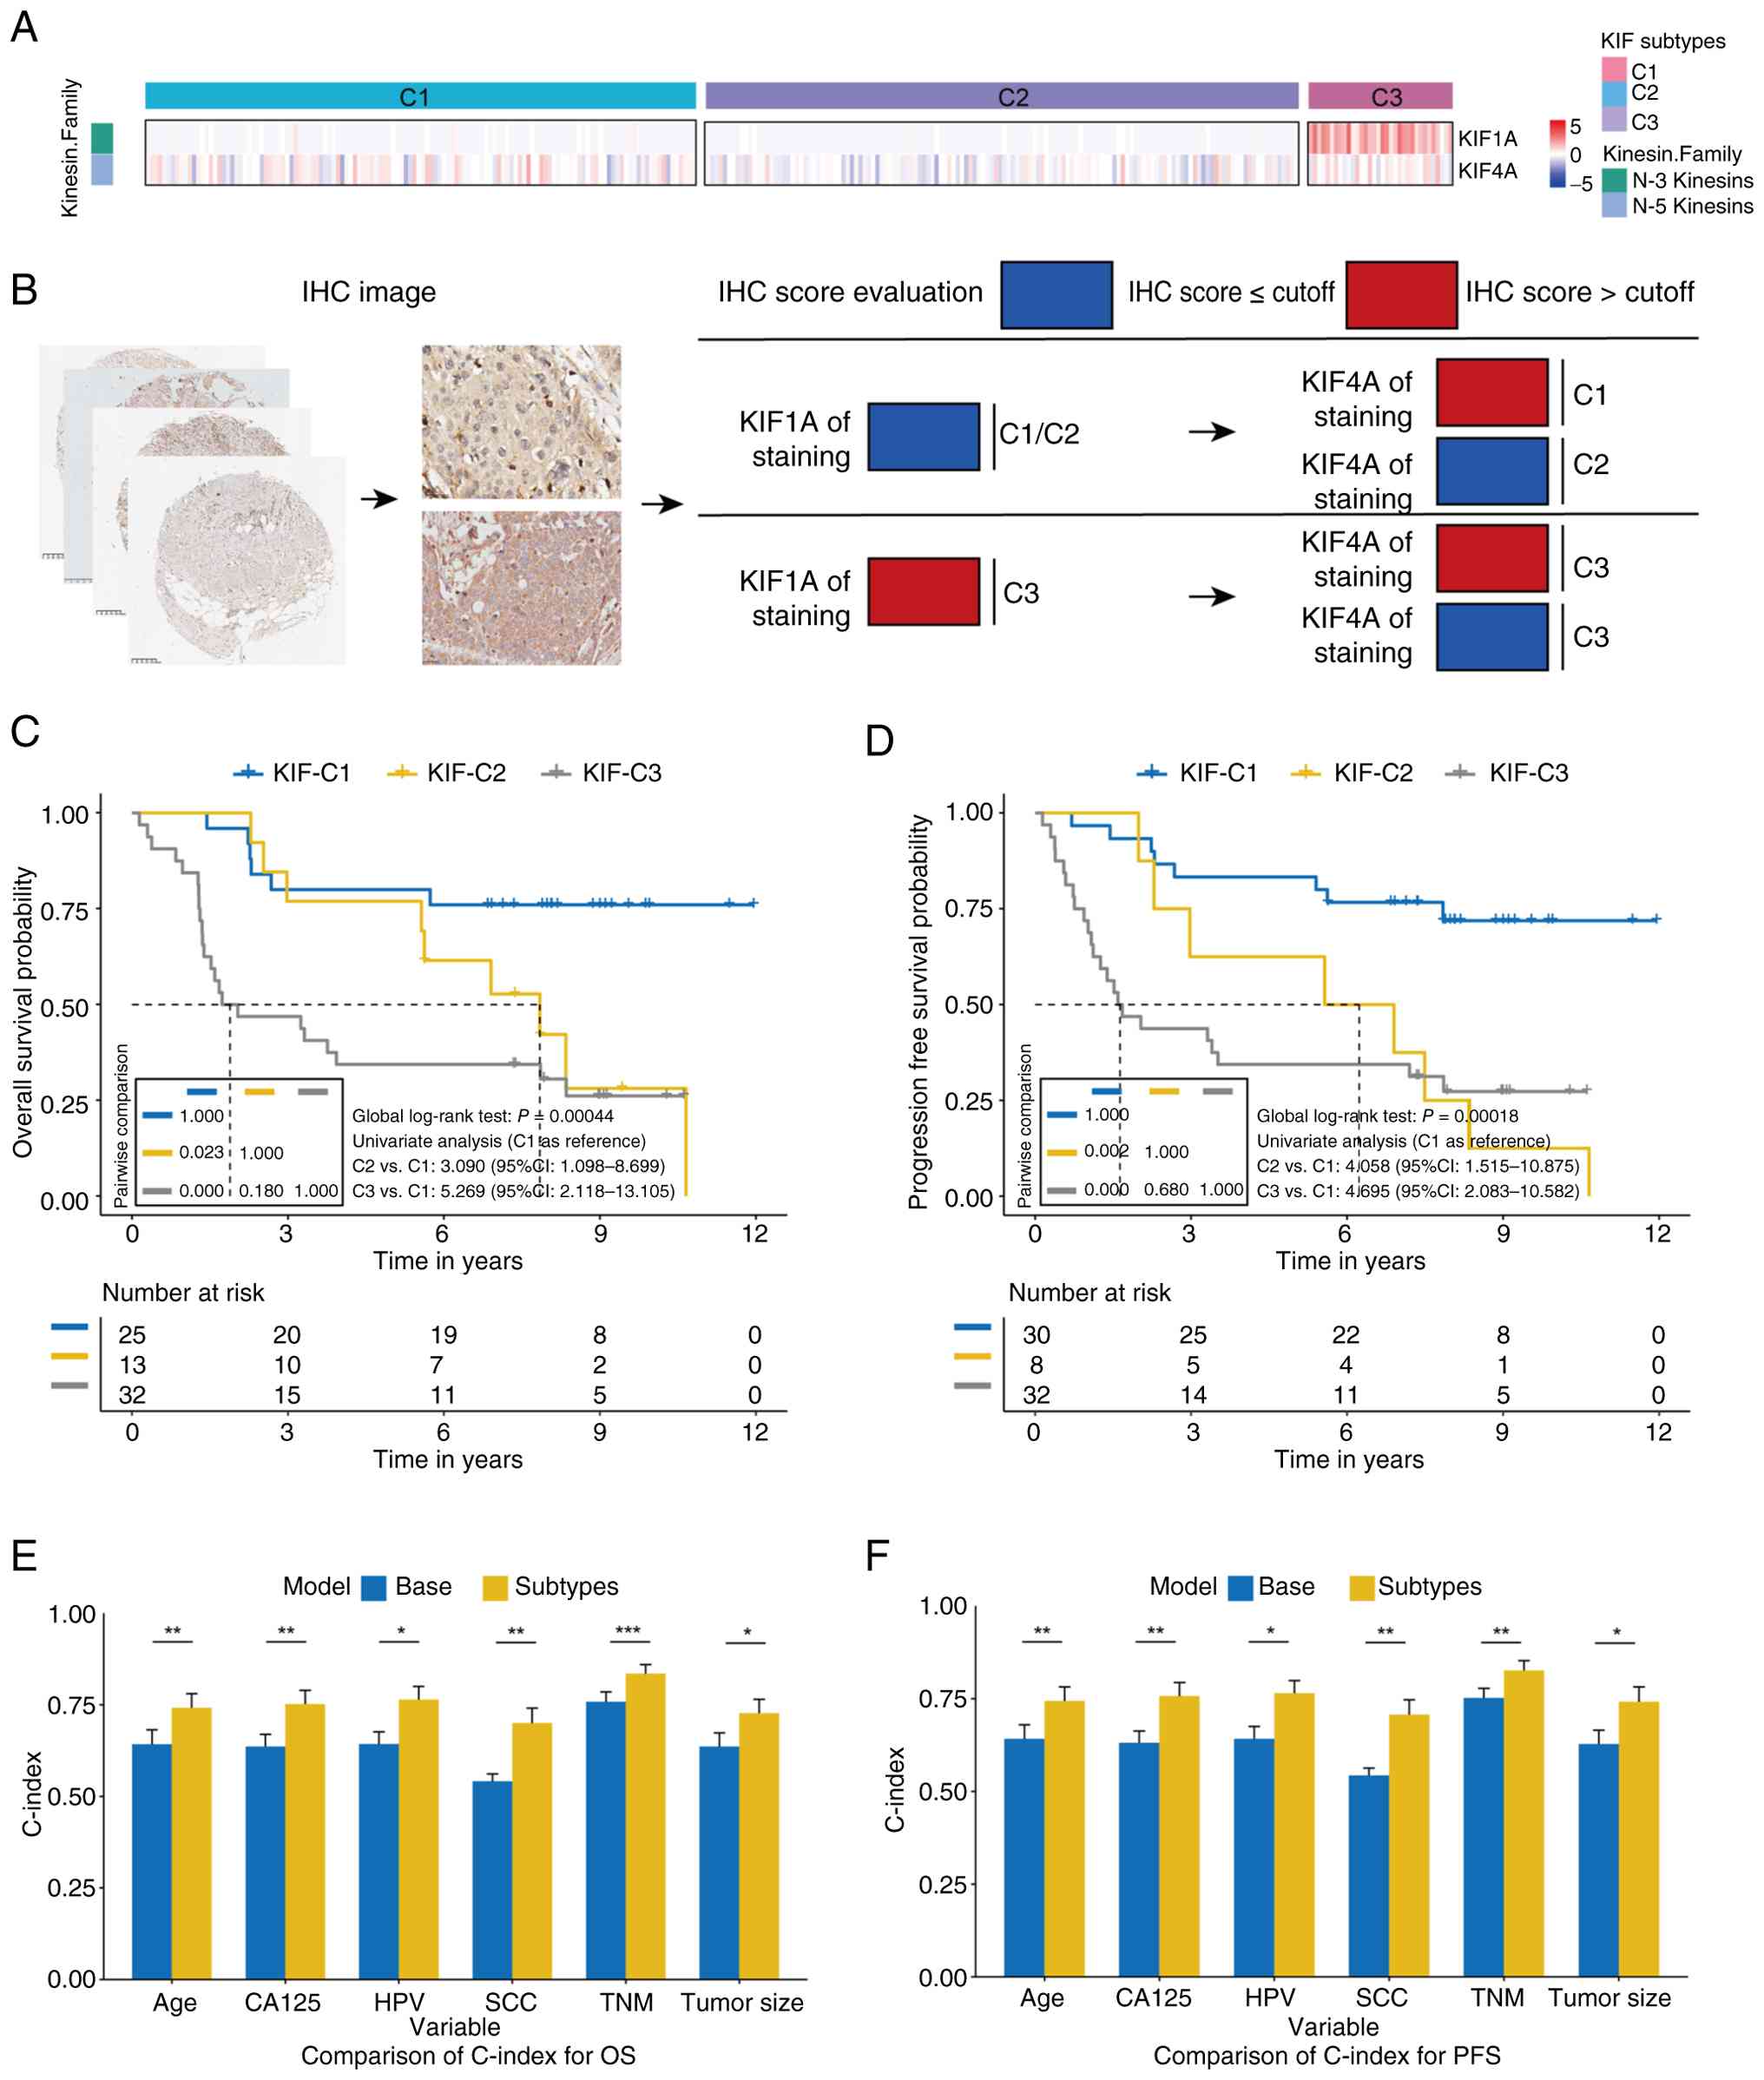 | Figure 7.KIF subtypes in Chinese patients with
CC. (A) Expression differences of KIF1A and KIF4A among different
subtypes. (B) IHC scoring workflow for KIF1A and KIF4A on tissue
microarrays. Samples were first classified by KIF1A expression,
with high KIF1A indicating the C3 subtype. For samples with low
KIF1A, classification was further refined by KIF4A expression: low
KIF4A indicated C2, and high KIF4A indicated C1. Optimal cutoff
values were applied to distinguish high vs. low expression. In the
OS dataset, cutoff values were 10 for KIF1A and 9.6 for KIF4A. In
the PFS dataset, cutoff values were 10 for KIF1A and 8.4 for KIF4A.
(C) Kaplan-Meier curves for OS of KIF subtypes in the Chinese CC
cohort. (D) Kaplan-Meier curves for PFS of KIF subtypes in the
Chinese CC cohort. (E and F) Comparison of C-index between basic
Cox models and Cox models incorporating KIF subtypes. The C-index
with 95% CI is displayed for each model across various clinical
variables. Statistical significance between models is indicated by
asterisks. *P<0.05, **P<0.01 and ***P<0.001. Blue
represents the base model, and yellow represents the
subtype-extended model. Error bars indicate variability of the
C-index, emphasizing comparative predictive accuracy. KIF, kinesin
family genes; CC, cervical cancer; OS, overall survival; PFS,
progression-free survival; IHC, immunohistochemical; ns, not
significant. |
| Table II.Screening of KIF characteristic genes
in C2 patients. |
Table II.
Screening of KIF characteristic genes
in C2 patients.
|
| C1 | C3 |
|---|
|
|
|
|
|---|
| Variables | β | Sth. error | OR | β | Sth. error | OR |
|---|
| KIF4A | 5.317 | 0.223 | 3.274
(2.114–5.069)a | 4.186 | 0.256 | 2.923
(1.769–4.831)a |
| KIF9 | 2.498 | 0.032 | 1.078
(1.011–1.148)b | 0.043 | 0.172 | 1.113
(1.023–1.211)b |
| KIF22 | 3.923 | 0.016 | 1.064
(1.031–1.097)a | 1.575 | 0.022 | 1.035
(0.992–1.079) |
| Table III.Screening of KIF characteristic genes
in C3 patients. |
Table III.
Screening of KIF characteristic genes
in C3 patients.
|
| C1 | C3 |
|---|
|
|
|
|
|---|
| Variables | β | Sth. error | OR | β | Sth. error | OR |
|---|
| KIF1A | −4.007 | 1.180 | 0.009
(0.001–0.089)a | −4.347 | 1.337 | 0.003 (0.000-
0.041)a |
IHC staining of KIF1A and KIF4A was performed on 80
tissue samples, and the KKIHC classification system was developed:
patients were first stratified by KIF1A expression (high → C3);
among those with low KIF1A, high KIF4A indicated C1, and low KIF4A
indicated C2 (Fig. 7B). Among the
three subtypes, only serum SCC levels differed significantly
(P=0.030, Table SVI).
Survival analysis demonstrated that C2 and C3
patients had poorer OS compared with C1 (log-rank P<0.05).
Univariate Cox regression yielded HRs of 3.090 for C2 vs. C1 and
5.269 for C3 vs. C1 (Fig. 7C).
Multivariate analysis confirmed that C2 and C3 subtypes were
independently associated with poorer OS (HR=2.136 and 5.284,
respectively, Table IV).
Similarly, C2 and C3 patients had shorter PFS than C1 (log-rank
P<0.05), with univariate HRs of 4.058 and 4.695, and
multivariate HRs of 4.146 and 6.125, respectively (Fig. 7D, Table
IV).
| Table IV.Multivariate Cox model analysis of
the prognostic value of KIF subtypes. |
Table IV.
Multivariate Cox model analysis of
the prognostic value of KIF subtypes.
| Model | HR | 95L | 95H | P-value |
|---|
| Multivariable
analysis model 1a
(overall survival) |
|
|
|
|
| C1 | Ref. |
|
|
|
| C2 | 3.371 | 1.043 | 10.895 | 0.186 |
| C3 | 6.669 | 2.331 | 19.076 | 0.001 |
| Multivariable
analysis model 2a
(progression-free survival) |
|
|
|
|
| C1 | Ref. |
|
|
|
| C2 | 3.612 | 1.306 | 9.992 | 0.008 |
| C3 | 3.764 | 1.606 | 8.822 | 0.000 |
Integration of KIF subtypes into Cox models
substantially improved the C-index for both OS and PFS. For
example, the C-index for TNM stage increased from 0.758 to 0.835
for OS (P<0.001) and from 0.752 to 0.826 for PFS (P=0.005).
Similar improvements were observed for models including age, tumor
size, CA125, SCC and HPV status (Fig.
7E and F).
Discussion
In the present study, three distinct molecular
subtypes of CC (C1, C2 and C3) were identified based on the
expression profiles of 23 kinesin family genes. These subtypes
exhibited marked differences in prognosis: C1 patients demonstrated
the most favorable survival outcomes, C2 patients showed
intermediate prognosis characterized by active but partially
therapy-resistant immune features, and C3 patients had the poorest
prognosis, with Wnt pathway activation and an immune-silent
phenotype. Multi-omics analyses further revealed subtype-specific
molecular alterations, including enrichment of Hippo-YAP and VEGFR
signaling in C2 and frequent Wnt and TP53 mutations in C3, as well
as predicted differential responses to chemotherapy and
immunotherapy. These findings establish a framework for patient
stratification and suggest potential therapeutic targets, thereby
supporting the development of personalized treatment strategies for
CC.
The biological and immunological distinctions among
KIF subtypes help explain variations in prognosis and predicted
immunotherapy efficacy, while also suggesting potential
intervention points. C1 was characterized by downregulated
expression of several KIFs, including KIF1A, and relatively low
activity of oncogenic pathways. In C1 patients, genes located at
significantly amplified CNV loci were enriched in pathways
associated with negative regulation of immune cell apoptosis and
differentiation of immature B cells. Functional enrichment analysis
further indicated that most oncogenic pathways, including Wnt,
VEGFR and PI3K-Akt, were comparatively downregulated, consistent
with lower proliferative activity. Additionally, the TME in C1
patients was enriched with infiltrating immune cells, including
CD8+ T cells and helper T cells, which may enhance tumor
recognition and elimination, thereby strengthening antitumor immune
responses (25,26). Most immune-related genes were
significantly upregulated, suggesting active immune function. The
combination of high lymphocyte infiltration and absence of
prominent immunosuppressive signals indicates that C1 patients
possess a relatively immune-active TME (27,28).
These features likely contribute to the superior clinical outcomes
and predicted immunotherapy efficacy observed in C1 patients
(29,30). However, direct experimental evidence
in CC cohorts remains limited, and the precise mechanisms
underlying this favorable prognosis warrant further
investigation.
Compared with C1, C2 exhibited distinct KIF
expression patterns, including downregulation of KIF4A and
upregulation of specific mitotic KIFs, such as KIFC2, which may
contribute to aberrant activation of downstream signaling pathways.
The Hippo pathway, for example, was highly enriched in C2 patients,
accompanied by increased YAP activity and elevated YAP_pS127
protein levels. Excessive YAP activation is known to promote tumor
cell proliferation in other cancers (31–33),
suggesting a potential oncogenic role for YAP in C2 progression,
although functional validation in CC models is required.
Additionally, VEGFR signaling was enriched in C2, indicating
potential suitability for anti-angiogenic therapy (34,35).
Upregulation of VEGFR2 in C2 patients suggests activation of VEGF
signaling, which may contribute to the aggressive phenotype
observed in this subtype. Despite both C1 and C2 patients being
predicted as high-probability responders to immunotherapy, C2
patients may derive comparatively less benefit. Mild increases in
PD-L1 expression and immune cell infiltration were observed in C2,
which could partially account for their response to immunotherapy
(36–39); however, direct evidence in CC is
lacking. The proportion of stromal cells, including fibroblasts,
was higher in C2 patients. Cancer-associated fibroblasts (CAFs),
potentially induced by pro-tumor signals such as IL-1, may
contribute to immunotherapy resistance in C2, as suggested by
previous studies (40–43). Immune-active pathway enrichment and
elevated TGF-β response were also prominent in C2 patients. High
levels of TGF-β, possibly secreted by CAFs, could suppress effector
T-cell function while promoting regulatory T-cell activity, thereby
attenuating antitumor immunity (44–48).
Furthermore, reduced HLA gene expression in both C2 and C3 patients
may further compromise immunotherapy efficacy (49–52).
These complex molecular and microenvironmental alterations help
explain why, despite exhibiting high immune activity, C2 patients
display partial resistance to immunotherapy and have poorer
clinical outcomes compared with C1 patients. Lower TCF1 expression
in C2 suggests a shift of T cells toward an exhausted phenotype,
which could account for diminished immunotherapy responsiveness
despite the presence of cytotoxic effectors. Moreover, the
combination of elevated TGF-β signaling and increased mesenchymal
cell content is associated with transcriptomic enrichment of TGF-β
pathways, potentially contributing to the observed partial
immunotherapy resistance in C2.
Patients with the C3 subtype exhibited the poorest
clinical prognosis, characterized by pronounced immunosuppression
and highly aggressive tumor behavior. This subtype was defined by
marked upregulation of KIF1A, which may act as a driver of
downstream effects, including excessive activation of the Wnt
signaling pathway. In C3, Wnt signaling was hyperactivated,
potentially reflecting the higher mutation rate observed in this
subtype, although this hypothesis requires experimental validation.
Aberrant Wnt signaling is known to promote tumor growth, metastasis
and maintenance of stemness in multiple cancers (53–56)
and may similarly contribute to the aggressive phenotype of C3.
Furthermore, Wnt activation can impair immune cell function and
facilitate immune evasion (57,58).
In the C3 subtype, protein levels of KU80, FASN and IGFBP2 were
significantly upregulated. KU80 regulates FOXF2-mediated
Wnt/β-catenin signaling and promotes colorectal cancer progression
(59), FASN facilitates
epithelial-mesenchymal transition (EMT) through the
PRRX1/Wnt/β-catenin axis in salivary adenoid cystic carcinoma
(60), and IGFBP2 activates Wnt
signaling to promote EMT in solid tumors (61). Consistent with these molecular
alterations, C3 patients exhibited lower predicted immunotherapy
benefit, lower microenvironment scores, and reduced enrichment of
immune-related pathways, reflecting an immune-silent phenotype.
Downregulation of LCK protein in C3 further supports the lack of
immune cell infiltration, while decreased HLA expression suggests
impaired antigen presentation, potentially facilitating immune
evasion. Additionally, C3 patients showed increased fibroblast
infiltration, which can differentiate into CAFs under stimulation
from TGF-β, IL-1, and Wnt signaling (40). Collectively, the extremely poor
prognosis of C3 patients is likely associated with the combined
effects of Wnt pathway activation, reduced lymphoid and myeloid
cell populations, increased fibroblast content, and elevated TGF-β
response. The immune-cold phenotype of C3, characterized by low
lymphoid/myeloid infiltration and diminished HLA expression, is
consistent with LCK downregulation and the enrichment of Wnt
pathway mutations observed in genomic and proteomic analyses.
Elevated TGF-β response scores in both C2 and C3 patients further
indicate an immunosuppressive microenvironment, concordant with
increased fibroblast infiltration in these subtypes.
The strength of the present study lies in the
integration of multi-omics data, which allowed the linkage of
genomic alterations (for example, Wnt and TP53 mutations in C3) to
transcriptomic and proteomic changes (for example, KIF1A
upregulation, LCK downregulation) and features of the tumor immune
microenvironment. Importantly, KIF family genes themselves emerged
as central hubs that may orchestrate these multi-layer alterations,
rather than merely serving as downstream markers of tumor
heterogeneity. While the current integration is primarily
descriptive, the concordance across data layers supports the
biological validity of the KIF subtypes and generates testable
hypotheses for future mechanistic studies.
These findings indicate that KIF expression
heterogeneity contributes directly to the distinct molecular and
clinical characteristics of each subtype, supporting the use of KIF
genes as both subtyping biomarkers and potential therapeutic
targets. The present study provides a foundation for
hypothesis-generating strategies in personalized treatment,
although prospective validation is required before clinical
application. If validated in future studies, KIF subtypes could
inform clinical decision-making. For instance, patients with the C1
subtype, who demonstrate favorable prognoses and predicted benefit
from immunotherapy, might be considered for immune-based therapies
in prospective trials. Patients with the C2 subtype may require
additional interventions targeting Hippo-YAP and VEGFR signaling,
although this remains speculative and warrants preclinical and
functional validation. Furthermore, the lower predicted
IC50 values for certain chemotherapeutic agents in C2
patients suggest potential sensitivity to alternative regimens,
such as bleomycin or cetuximab. C3 patients, characterized by
aggressive Wnt-driven tumors and an immune-silent phenotype, may
benefit from combination strategies aimed at inhibiting Wnt
signaling and restoring immune function; however, these hypotheses
await empirical testing. No direct clinical recommendations can be
drawn from the present retrospective analysis. The use of KIF1A and
KIF4A as biomarkers for prognosis and predicted therapeutic
response is particularly promising, pending validation in
CC-specific immunotherapy cohorts. High KIF1A expression,
associated with the C3 subtype, and low KIF4A expression,
characteristic of the C2 subtype, provide actionable insights for
patient stratification, enabling the optimization of treatment
plans according to individual molecular profiles. This approach not
only enhances prognostic accuracy but also facilitates the
development of targeted therapies, ultimately promoting more
personalized and effective clinical management of CC. Two KIF-based
subtyping strategies were developed in the present study: KRNNM and
KKIHC. KRNNM, based on RNA-seq data, may be applied in research
contexts, whereas KKIHC classifies patients using IHC-determined
KIF1A and KIF4A expression. Both approaches remain exploratory and
require prospective validation in independent clinical cohorts
before clinical implementation. Their potential to improve
prognostic precision or guide therapeutic decisions remains to be
established.
Several limitations of the present study should be
acknowledged. First, the KRNNM neural network model showed
near-perfect performance on the training set, which may indicate a
risk of overfitting given the limited sample size (n=304). Although
the model architecture was simplified, regularization was
introduced, and consistent prognostic separation was observed in
two independent external cohorts, the model's performance metrics
should be interpreted with caution, and prospective validation is
needed. Second, the 23 KIF genes were pre-selected based on their
association with OS before performing NMF clustering, which could
introduce a risk of circular analysis. To mitigate this concern,
the prognostic value of the identified subtypes in two external
cohorts (GSE44001 and GSE52903) that were not involved in any step
of gene selection or model development. The consistent survival
differences observed in these independent datasets support the
robustness and generalizability of the KIF-based subtyping
approach. Third, due to the scarcity of publicly available CC
cohorts treated with immune checkpoint inhibitors, melanoma and
urothelial carcinoma cohorts were used as surrogates to infer
immunotherapy response. These tumor types have distinct immune
microenvironments and mutation burdens, which may limit the direct
generalizability of the authors' predictions. Fourth, chemotherapy
sensitivity predictions were based on cell line-derived models
(GDSC database) and may not fully reflect in vivo drug
responses due to differences in TME, pharmacokinetics, and
inter-patient heterogeneity. These predictions should be
interpreted as hypothesis-generating and require experimental
validation. Fifth, the IHC validation cohort was relatively small
(n=80), and the optimal cut-off values for KIF1A and KIF4A staining
require prospective validation in larger independent cohorts.
Sixth, all analyses are retrospective, and the proposed clinical
utility of KIF subtyping remains hypothesis-generating. Future
studies with larger, independent, prospective cohorts are urgently
needed to validate the subtypes, the prediction models, and the
therapeutic implications.
In conclusion, the present study highlights the
critical role of three KIF-defined molecular subtypes in
determining prognosis and treatment response among patients with
CC. C1-C3 subtypes displayed distinct prognostic profiles: C2
patients exhibited a similarly immune-active state as C1 patients,
whereas C3 patients demonstrated an immunosuppressive phenotype,
suggesting potential resistance to immunotherapy, although this
requires confirmation in CC-specific cohorts. C2 was characterized
by activation of Hippo-YAP and VEGFR signaling, representing
potential therapeutic targets. In C3, Wnt pathway-related genes,
TP53 mutations, and KIF1A overexpression may serve as actionable
targets. If validated in future prospective studies, integration of
KIF subtypes into clinical practice could enhance personalized
treatment strategies, offering new avenues to improve outcomes for
patients with CC. However, the current findings are preliminary and
require further validation. Notably, predicted immunotherapy
responses derived from non-CC cohorts necessitate confirmation in
dedicated CC immunotherapy trials before any clinical application
can be considered.
Supplementary Material
Supporting Data
Supporting Data
Acknowledgements
Not applicable.
Funding
The present study was supported by the National Natural Science
Foundation of China (grant nos. 82403850 and 82203502), the
Cross-Innovation Talent Project of Renmin Hospital of Wuhan
University (grant no. JCRCGW-2022-002), the Wu Jieping Medical
Foundation (grant no. 320.6750.2023–05-90) and the Beijing Bethune
Charitable Foundation (grant nos. ZLZX027 and
2024-YJ-226-J-021).
Availability of data and materials
The data generated in the present study may be
requested from the corresponding author.
Authors' contributions
XZ summarized the findings and drafted the
manuscript. XZ and JW analyzed and interpreted the data. JW and LL
provided critical revisions and feedback to enhance the manuscript.
JW, LL and XZ designed the study. HZha and JL analyzed and
interpreted the data. HZho and YD collected the data. HC, BX and QS
conceived and designed the study.. XZ and JW confirm the
authenticity of all the raw data. All authors read and approved the
final version of the manuscript.
Ethics approval and consent to
participate
TMA samples for the CC cohort were purchased from
Guilin Fanpu Biotech, and the ethical approval for use of these
samples was obtained through the Guilin Fanpu Biotech Ethics
Committee [approval no. Fanpu-2018 (23)]. All research involving human data
was conducted in accordance with the Declaration of Helsinki.
Patient consent for publication
Not applicable.
Competing interests
The authors declare that they have no competing
interests.
References
|
1
|
Zheng RS, Chen R, Han BF, Wang SM, Li L,
Sun KX, Zeng HM, Wei WW and He J: Cancer incidence and mortality in
China, 2022. Zhonghua Zhong Liu Za Zhi. 46:221–231. 2024.PubMed/NCBI
|
|
2
|
Qiu H, Cao S and Xu R: Cancer incidence,
mortality, and burden in China: A time-trend analysis and
comparison with the United States and United Kingdom based on the
global epidemiological data released in 2020. Cancer Commun (Lond).
41:1037–1048. 2021. View Article : Google Scholar : PubMed/NCBI
|
|
3
|
Bray F, Laversanne M, Sung H, Ferlay J,
Siegel RL, Soerjomataram I and Jemal A: Global cancer statistics
2022: GLOBOCAN estimates of incidence and mortality worldwide for
36 cancers in 185 countries. CA Cancer J Clin. 74:229–263.
2024.PubMed/NCBI
|
|
4
|
Fan L, Wang ZH, Ma LX, Wu SY, Wu J, Yu KD,
Sui XY, Xu Y, Liu XY, Chen L, et al: Optimising first-line
subtyping-based therapy in triple-negative breast cancer
(FUTURE-SUPER): A multi-cohort, randomised, phase 2 trial. Lancet
Oncol. 25:184–197. 2024. View Article : Google Scholar : PubMed/NCBI
|
|
5
|
Fan J, Fu Y, Peng W, Li X, Shen Y, Guo E,
Lu F, Zhou S, Liu S, Yang B, et al: Multi-omics characterization of
silent and productive HPV integration in cervical cancer. Cell
Genom. 3:1002112023. View Article : Google Scholar : PubMed/NCBI
|
|
6
|
Nasimi Shad A, Fanoodi A, Maharati A,
Akhlaghipour I, Bina AR, Saburi E, Forouzanfar F and Moghbeli M:
Role of microRNAs in tumor progression by regulation of kinesin
motor proteins. Int J Biol Macromol. 270:1323472024. View Article : Google Scholar : PubMed/NCBI
|
|
7
|
Chen S, Zhao L, Liu J, Han P, Jiang W, Liu
Y, Hou J, Wang F and Li J: Inhibition of KIF20A enhances the
immunotherapeutic effect of hepatocellular carcinoma by enhancing
c-Myc ubiquitination. Cancer Lett. 598:2171052024. View Article : Google Scholar : PubMed/NCBI
|
|
8
|
Gliech CR, Yeow ZY, Tapias-Gomez D, Yang
Y, Huang Z, Tijhuis AE, Spierings DC, Foijer F, Chung G, Tamayo N,
et al: Weakened APC/C activity at mitotic exit drives cancer
vulnerability to KIF18A inhibition. EMBO J. 43:666–694. 2024.
View Article : Google Scholar : PubMed/NCBI
|
|
9
|
Payton M, Belmontes B, Hanestad K,
Moriguchi J, Chen K, McCarter JD, Chung G, Ninniri MS, Sun J,
Manoukkian R, et al: Small-molecule inhibition of kinesin KIF18A
reveals a mitotic vulnerability enriched in chromosomally unstable
cancers. Nat Cancer. 5:66–84. 2024. View Article : Google Scholar : PubMed/NCBI
|
|
10
|
Lee YY, Kim TJ, Kim JY, Choi CH, Do IG,
Song SY, Sohn I, Jung SH, Bae DS, Lee JW and Kim BG: Genetic
profiling to predict recurrence of early cervical cancer. Gynecol
Oncol. 131:650–654. 2013. View Article : Google Scholar : PubMed/NCBI
|
|
11
|
Medina-Martinez I, Barrón V,
Roman-Bassaure E, Juárez-Torres E, Guardado-Estrada M, Espinosa AM,
Bermudez M, Fernández F, Venegas-Vega C, Orozco L, et al: Impact of
gene dosage on gene expression, biological processes and survival
in cervical cancer: A genome-wide follow-up study. PLoS One.
9:e978422014. View Article : Google Scholar : PubMed/NCBI
|
|
12
|
Gide TN, Quek C, Menzies AM, Tasker AT,
Shang P, Holst J, Madore J, Lim SY, Velickovic R, Wongchenko M, et
al: Distinct immune cell populations define response to anti-PD-1
monotherapy and anti-PD-1/anti-CTLA-4 combined therapy. Cancer
Cell. 35:238–255.e236. 2019. View Article : Google Scholar : PubMed/NCBI
|
|
13
|
Van Allen EM, Miao D, Schilling B, Shukla
SA, Blank C, Zimmer L, Sucker A, Hillen U, Foppen MHG, Goldinger
SM, et al: Genomic correlates of response to CTLA-4 blockade in
metastatic melanoma. Science. 350:207–211. 2015. View Article : Google Scholar : PubMed/NCBI
|
|
14
|
Mariathasan S, Turley SJ, Nickles D,
Castiglioni A, Yuen K, Wang Y, Kadel EE III, Koeppen H, Astarita
JL, Cubas R, et al: TGFβ attenuates tumour response to PD-L1
blockade by contributing to exclusion of T cells. Nature.
554:544–548. 2018. View Article : Google Scholar : PubMed/NCBI
|
|
15
|
Lee DD and Seung HS: Learning the parts of
objects by non-negative matrix factorization. Nature. 401:788–791.
1999. View Article : Google Scholar : PubMed/NCBI
|
|
16
|
Brunet JP, Tamayo P, Golub TR and Mesirov
JP: Metagenes and molecular pattern discovery using matrix
factorization. Proc Natl Acad Sci USA. 101:4164–4169. 2004.
View Article : Google Scholar : PubMed/NCBI
|
|
17
|
Aran D, Hu Z and Butte AJ: xCell:
Digitally portraying the tissue cellular heterogeneity landscape.
Genome Biol. 18:2202017. View Article : Google Scholar : PubMed/NCBI
|
|
18
|
Thorsson V, Gibbs DL, Brown SD, Wolf D,
Bortone DS, Ou Yang TH, Porta-Pardo E, Gao GF, Plaisier CL, Eddy
JA, et al: The immune landscape of cancer. Immunity. 48:812–830.
2018. View Article : Google Scholar : PubMed/NCBI
|
|
19
|
Wu CC, Wang YA, Livingston JA, Zhang J and
Futreal PA: Prediction of biomarkers and therapeutic combinations
for anti-PD-1 immunotherapy using the global gene network
association. Nat Commun. 13:422022. View Article : Google Scholar : PubMed/NCBI
|
|
20
|
Auslander N, Zhang G, Lee JS, Frederick
DT, Miao B, Moll T, Tian T, Wei Z, Madan S, Sullivan RJ, et al:
Robust prediction of response to immune checkpoint blockade therapy
in metastatic melanoma. Nat Med. 24:1545–1549. 2018. View Article : Google Scholar : PubMed/NCBI
|
|
21
|
Cristescu R, Mogg R, Ayers M, Albright A,
Murphy E, Yearley J, Sher X, Liu XQ, Lu H, Nebozhyn M, et al:
Pan-tumor genomic biomarkers for PD-1 checkpoint blockade-based
immunotherapy. Science. 362:eaar35932018. View Article : Google Scholar : PubMed/NCBI
|
|
22
|
Jiang P, Gu S, Pan D, Fu J, Sahu A, Hu X,
Li Z, Traugh N, Bu X, Li B, et al: Signatures of T cell dysfunction
and exclusion predict cancer immunotherapy response. Nature
Medicine. 24:1550–1558. 2018. View Article : Google Scholar : PubMed/NCBI
|
|
23
|
Charoentong P, Finotello F, Angelova M,
Mayer C, Efremova M, Rieder D, Hackl H and Trajanoski Z: Pan-cancer
immunogenomic analyses reveal genotype-immunophenotype
relationships and predictors of response to checkpoint blockade.
Cell Reports. 18:248–262. 2017. View Article : Google Scholar : PubMed/NCBI
|
|
24
|
Hofmann O, Hoshida Y, Brunet J-P, Tamayo
P, Golub TR and Mesirov JP: Subclass mapping: Identifying common
subtypes in independent disease data sets. PLoS One. 2:e11952007.
View Article : Google Scholar
|
|
25
|
Giles JR, Globig AM, Kaech SM and Wherry
EJ: CD8(+) T cells in the cancer-immunity cycle. Immunity.
56:2231–2253. 2023. View Article : Google Scholar : PubMed/NCBI
|
|
26
|
Gutiérrez-Melo N and Baumjohann D: T
follicular helper cells in cancer. Trends Cancer. 9:309–325. 2023.
View Article : Google Scholar : PubMed/NCBI
|
|
27
|
Zheng L, Qin S, Si W, Wang A, Xing B, Gao
R, Ren X, Wang L, Wu X, Zhang J, et al: Pan-cancer single-cell
landscape of tumor-infiltrating T cells. Science. 374:abe64742021.
View Article : Google Scholar : PubMed/NCBI
|
|
28
|
Laumont CM and Nelson BH: B cells in the
tumor microenvironment: Multi-faceted organizers, regulators, and
effectors of anti-tumor immunity. Cancer Cell. 41:466–489. 2023.
View Article : Google Scholar : PubMed/NCBI
|
|
29
|
Chu Y, Dai E, Li Y, Han G, Pei G, Ingram
DR, Thakkar K, Qin JJ, Dang M, Le X, et al: Pan-cancer T cell atlas
links a cellular stress response state to immunotherapy resistance.
Nat Med. 29:1550–1562. 2023. View Article : Google Scholar : PubMed/NCBI
|
|
30
|
Oliveira G and Wu CJ: Dynamics and
specificities of T cells in cancer immunotherapy. Nat Rev Cancer.
23:295–316. 2023. View Article : Google Scholar : PubMed/NCBI
|
|
31
|
Dey A, Varelas X and Guan KL: Targeting
the Hippo pathway in cancer, fibrosis, wound healing and
regenerative medicine. Nat Rev Drug Discov. 19:480–494. 2020.
View Article : Google Scholar : PubMed/NCBI
|
|
32
|
Fu M, Hu Y, Lan T, Guan KL, Luo T and Luo
M: The Hippo signalling pathway and its implications in human
health and diseases. Signal Transduct Target Ther. 7:3762022.
View Article : Google Scholar : PubMed/NCBI
|
|
33
|
Franklin JM, Wu Z and Guan KL: Insights
into recent findings and clinical application of YAP and TAZ in
cancer. Nat Rev Cancer. 23:512–525. 2023. View Article : Google Scholar : PubMed/NCBI
|
|
34
|
Perez-Gutierrez L and Ferrara N: Biology
and therapeutic targeting of vascular endothelial growth factor A.
Nat Rev Mol Cell Biol. 24:816–834. 2023. View Article : Google Scholar : PubMed/NCBI
|
|
35
|
Patel SA, Nilsson MB, Le X, Cascone T,
Jain RK and Heymach JV: Molecular mechanisms and future
implications of VEGF/VEGFR in cancer therapy. Clin Cancer Res.
29:30–39. 2023. View Article : Google Scholar : PubMed/NCBI
|
|
36
|
Topalian SL, Taube JM and Pardoll DM:
Neoadjuvant checkpoint blockade for cancer immunotherapy. Science.
367:eaax01822020. View Article : Google Scholar : PubMed/NCBI
|
|
37
|
Wu M, Huang Q, Xie Y, Wu X, Ma H, Zhang Y
and Xia Y: Improvement of the anticancer efficacy of PD-1/PD-L1
blockade via combination therapy and PD-L1 regulation. J Hematol
Oncol. 15:242022. View Article : Google Scholar : PubMed/NCBI
|
|
38
|
Xiong W, Gao Y, Wei W and Zhang J:
Extracellular and nuclear PD-L1 in modulating cancer immunotherapy.
Trends Cancer. 7:837–846. 2021. View Article : Google Scholar : PubMed/NCBI
|
|
39
|
Pang K, Shi ZD, Wei LY, Dong Y, Ma YY,
Wang W, Wang GY, Cao MY, Dong JJ, Chen YA, et al: Research progress
of therapeutic effects and drug resistance of immunotherapy based
on PD-1/PD-L1 blockade. Drug Resist Updat. 66:1009072023.
View Article : Google Scholar : PubMed/NCBI
|
|
40
|
Mao X, Xu J, Wang W, Liang C, Hua J, Liu
J, Zhang B, Meng Q, Yu X and Shi S: Crosstalk between
cancer-associated fibroblasts and immune cells in the tumor
microenvironment: New findings and future perspectives. Mol Cancer.
20:1312021. View Article : Google Scholar : PubMed/NCBI
|
|
41
|
Desbois M and Wang Y: Cancer-associated
fibroblasts: Key players in shaping the tumor immune
microenvironment. Immunol Rev. 302:241–258. 2021. View Article : Google Scholar : PubMed/NCBI
|
|
42
|
Zhang H, Yue X, Chen Z, Liu C, Wu W, Zhang
N, Liu Z, Yang L, Jiang Q, Cheng Q, et al: Define cancer-associated
fibroblasts (CAFs) in the tumor microenvironment: new opportunities
in cancer immunotherapy and advances in clinical trials. Mol
Cancer. 22:1592023. View Article : Google Scholar : PubMed/NCBI
|
|
43
|
Pei L, Liu Y, Liu L, Gao S, Gao X, Feng Y,
Sun Z, Zhang Y and Wang C: Roles of cancer-associated fibroblasts
(CAFs) in anti- PD-1/PD-L1 immunotherapy for solid cancers. Mol
Cancer. 22:292023. View Article : Google Scholar : PubMed/NCBI
|
|
44
|
Derynck R, Turley SJ and Akhurst RJ:
TGFbeta biology in cancer progression and immunotherapy. Nat Rev
Clin Oncol. 18:9–34. 2021. View Article : Google Scholar : PubMed/NCBI
|
|
45
|
Tauriello DVF, Sancho E and Batlle E:
Overcoming TGFbeta-mediated immune evasion in cancer. Nat Rev
Cancer. 22:25–44. 2022. View Article : Google Scholar : PubMed/NCBI
|
|
46
|
Wu F, Yang J, Liu J, Wang Y, Mu J, Zeng Q,
Deng S and Zhou H: Signaling pathways in cancer-associated
fibroblasts and targeted therapy for cancer. Signal Transduct
Target Ther. 6:2182021. View Article : Google Scholar : PubMed/NCBI
|
|
47
|
Huang H, Wang Z, Zhang Y, Pradhan RN,
Ganguly D, Chandra R, Murimwa G, Wright S, Gu X, Maddipati R, et
al: Mesothelial cell-derived antigen-presenting cancer-associated
fibroblasts induce expansion of regulatory T cells in pancreatic
cancer. Cancer Cell. 40:656–673. e6572022. View Article : Google Scholar : PubMed/NCBI
|
|
48
|
Fang Z, Meng Q, Xu J, Wang W, Zhang B, Liu
J, Liang C, Hua J, Zhao Y, Yu X and Shi S: Signaling pathways in
cancer-associated fibroblasts: Recent advances and future
perspectives. Cancer Commun (Lond). 43:3–41. 2023. View Article : Google Scholar : PubMed/NCBI
|
|
49
|
Chowell D, Morris LGT, Grigg CM, Weber JK,
Samstein RM, Makarov V, Kuo F, Kendall SM, Requena D, Riaz N, et
al: Patient HLA class I genotype influences cancer response to
checkpoint blockade immunotherapy. Science. 359:582–587. 2018.
View Article : Google Scholar : PubMed/NCBI
|
|
50
|
Maggs L, Sadagopan A, Moghaddam AS and
Ferrone S: HLA class I antigen processing machinery defects in
antitumor immunity and immunotherapy. Trends Cancer. 7:1089–1101.
2021. View Article : Google Scholar : PubMed/NCBI
|
|
51
|
Hazini A, Fisher K and Seymour L:
Deregulation of HLA-I in cancer and its central importance for
immunotherapy. J Immunother Cancer. 9:e0028992021. View Article : Google Scholar : PubMed/NCBI
|
|
52
|
Aptsiauri N and Garrido F: The challenges
of HLA class I loss in cancer immunotherapy: Facts and hopes. Clin
Cancer Res. 28:5021–5029. 2022. View Article : Google Scholar : PubMed/NCBI
|
|
53
|
Liu J, Xiao Q, Xiao J, Niu C, Li Y, Zhang
X, Zhou Z, Shu G and Yin G: Wnt/beta-catenin signalling: Function,
biological mechanisms, and therapeutic opportunities. Signal
Transduct Target Ther. 7:32022. View Article : Google Scholar : PubMed/NCBI
|
|
54
|
Song P, Gao Z, Bao Y, Chen L, Huang Y, Liu
Y, Dong Q and Wei X: Wnt/beta-catenin signaling pathway in
carcinogenesis and cancer therapy. J Hematol Oncol. 17:462024.
View Article : Google Scholar : PubMed/NCBI
|
|
55
|
Zhang Y and Wang X: Targeting the
Wnt/beta-catenin signaling pathway in cancer. J Hematol Oncol.
13:1652020. View Article : Google Scholar : PubMed/NCBI
|
|
56
|
Xu X, Zhang M, Xu F and Jiang S: Wnt
signaling in breast cancer: Biological mechanisms, challenges and
opportunities. Mol Cancer. 19:1652020. View Article : Google Scholar : PubMed/NCBI
|
|
57
|
Takeuchi Y, Tanegashima T, Sato E, Irie T,
Sai A, Itahashi K, Kumagai S, Tada Y, Togashi Y, Koyama S, et al:
Highly immunogenic cancer cells require activation of the WNT
pathway for immunological escape. Sci Immunol. 6:eabc64242021.
View Article : Google Scholar : PubMed/NCBI
|
|
58
|
Wang Z, Li Z and Ji H: Direct targeting of
beta-catenin in the Wnt signaling pathway: Current progress and
perspectives. Med Res Rev. 41:2109–2129. 2021. View Article : Google Scholar : PubMed/NCBI
|
|
59
|
Liu Z, Xiao J, Wang N and Ding J: LSD1
regulates the FOXF2-mediated Wnt/β-catenin signaling pathway by
interacting with Ku80 to promote colon cancer progression. Am J
Cancer Res. 12:3693–3712. 2022.PubMed/NCBI
|
|
60
|
Zhang WL, Wang SS, Jiang YP, Liu Y, Yu XH,
Wu JB, Wang K, Pang X, Liao P, Liang XH and Tang YL: Fatty acid
synthase contributes to epithelial-mesenchymal transition and
invasion of salivary adenoid cystic carcinoma through
PRRX1/Wnt/beta-catenin pathway. J Cell Mol Med. 24:11465–11476.
2020. View Article : Google Scholar : PubMed/NCBI
|
|
61
|
Li T, Forbes ME, Fuller GN, Li J, Yang X
and Zhang W: IGFBP2: Integrative hub of developmental and oncogenic
signaling network. Oncogene. 39:2243–2257. 2020. View Article : Google Scholar : PubMed/NCBI
|