Introduction
Renal cell carcinoma (RCC) is the most common
malignant tumor in the urinary system, with an increasing incidence
year by year (1,2). In the United States, 76,080 new cases
of RCC were diagnosed in 2021, and there were 13,780 related
mortalities (3). RCC may have an
etiological association with factors such as smoking, chemical
exposure, unhealthy diet, obesity, chronic diseases and heredity.
The disease denotes cancer originated from the renal tubular
epithelial cells and includes three major subtypes: Clear cell RCC
(ccRCC), papillary RCC (pRCC) and chromophobe RCC (chRCC), of which
ccRCC is the most common (4,5).
Currently, mainstream cancer treatment modalities mainly include
radiotherapy, chemotherapy, surgical treatment, traditional Chinese
medicine therapy and immunotherapy (6,7). The
treatment methods for RCC are primarily surgery, immunotherapy and
targeted therapy; however, metastatic RCC is associated with high
recurrence rates and poor prognosis.
Ki-67 is a nuclear antigen that reflects the status
of cell proliferation and is associated with tumor proliferation
and invasion. Numerous studies have indicated that Ki-67 is a
useful prognostic marker in RCC, with high expression levels
associated with poor prognosis and advanced clinical and
pathological features (8–11). Although blood tests can be useful in
certain circumstances, they may not provide the same level of
precision and detailed information as direct measurement of Ki-67
from tumor tissue. Using CT images in conjunction with deep
learning (DL) algorithms to predict Ki-67 levels can serve as a
complementary approach to help doctors better understand and treat
cancer. Recent years have witnessed unprecedented advancements in
artificial intelligence (AI) technology, and its application in the
healthcare field is promising. AI, including machine learning, DL
and neural networks, facilitates the analysis of complex data and
improves diagnostic accuracy and work efficiency (12). Machine learning and DL-based models
can learn the embedded patterns in the electrocardiogram to
estimate complex metrics such as age and sex that depend on
multiple aspects of human physiology (13). DL can be applied to differentiate
between benign and malignant renal tumors, grade the pathology of
renal cancer, predict the status of genetic mutations, and other
aspects such as tumor immunotherapy and therapeutic efficacy of
tumors. Numerous studies have demonstrated the promising
application of DL in medical image analysis. Ansari et al
(14) proposed a novel neural
network (Res-PAC-UNet) that employed a fixed-width residual UNet
backbone and Pyramid Atrous Convolutions, providing a low disk
utilization method for precise liver CT segmentation. Yang et
al (15) used an automatic
analysis framework based on multi-scale features of 3D-CT, which
has notable potential for predicting Ki-67 expression in RCC,
providing reliable support for clinical applications.
To the best of our knowledge, there is currently no
literature available that reports on the predictive value of
DL-based CT features for Ki-67 expression in RCC. Existing studies
on Ki-67 prediction using AI have primarily focused on other tumor
types or have employed traditional radiomics approaches rather than
DL networks. Furthermore, the specific application of the
Mobilenetv3-large model to multi-phase CT images (plain, arterial,
venous and excretory phases) for predicting Ki-67 in RCC has not
been previously investigated. Therefore, the novelty of the present
study lies in: i) Developing a DL-based model specifically for
preoperative prediction of Ki-67 expression in patients with RCC;
ii) systematically comparing model performance across four
individual CT phases and their combination; and iii) validating the
clinical utility of the optimal venous-phase model with moderate
consistency (κ=0.57). The present study discusses the epidemiology
of RCC, pathological types, treatment methods and the importance of
Ki-67 as a prognostic marker, emphasizing the promising application
prospects of AI technology in the medical field, especially in the
treatment of RCC.
Materials and methods
Study population
The present study included a retrospective cohort of
patients who underwent surgery for RCC between January 2019 and
February 2022, and a prospective cohort of patients enrolled
between March 2022 and November 2023. All patients were treated at
the Affiliated Hospital of Hebei University (Baoding, China).
Eventually, 137 patients were enrolled after strict screening with
inclusion and exclusion criteria, including 124 cases of ccRCC, 7
cases of chRCC, 4 cases of pRCC, 1 case of collecting duct RCC and
1 case of sarcomatoid RCC.
Inclusion criteria
The following inclusion criteria were applied: i)
Having complete clinical data; ii) having preoperative four-phase
CT scan images (including plain scan phase, arterial phase, venous
phase and excretion phase) from the Affiliated Hospital of Hebei
University with high image quality and no artifacts; iii) being
diagnosed for the first time and not having undergone any form of
treatment such as radiotherapy, chemotherapy, immunotherapy and
surgical treatment prior to the CT scan; and iv) being scanned by
the same CT scanning equipment with the same scanning
parameters.
Exclusion criteria
The following exclusion criteria were applied: i)
Not having CT plain scan + enhancement scans in the Affiliated
Hospital of Hebei University before surgery or not having
pathologic examination results; ii) having unclear CT scan images
and poorly displayed lesions; iii) have a tumor that has developed
metastases; and iv) have missing or incomplete clinical data.
Images preparation and
segmentation
The initially screened CT images were manually
outlined for the region of interest (ROI) of the tumor by two
experienced urologists using the labelme tool (version 4.5.6;
github.com/wkentaro/labelme) to form the volume of interest of the
whole tumor. The outline was based on the maximum diameter of the
tumor and extended outward by 1–2 mm. To ensure annotation
consistency and minimize inter-observer variability, both
urologists independently annotated 50 randomly selected CT images
(25 from high-grade and 25 from low-grade patients). The intraclass
correlation coefficient (ICC) was calculated to assess
inter-observer agreement for the annotated ROI volumes. An ICC
value >0.75 indicated good agreement, and any discrepancies were
resolved by consensus discussion with a third senior radiologist.
After outlining, the images were saved as a json file, on which the
tumor region was cropped according to the annotations in the file,
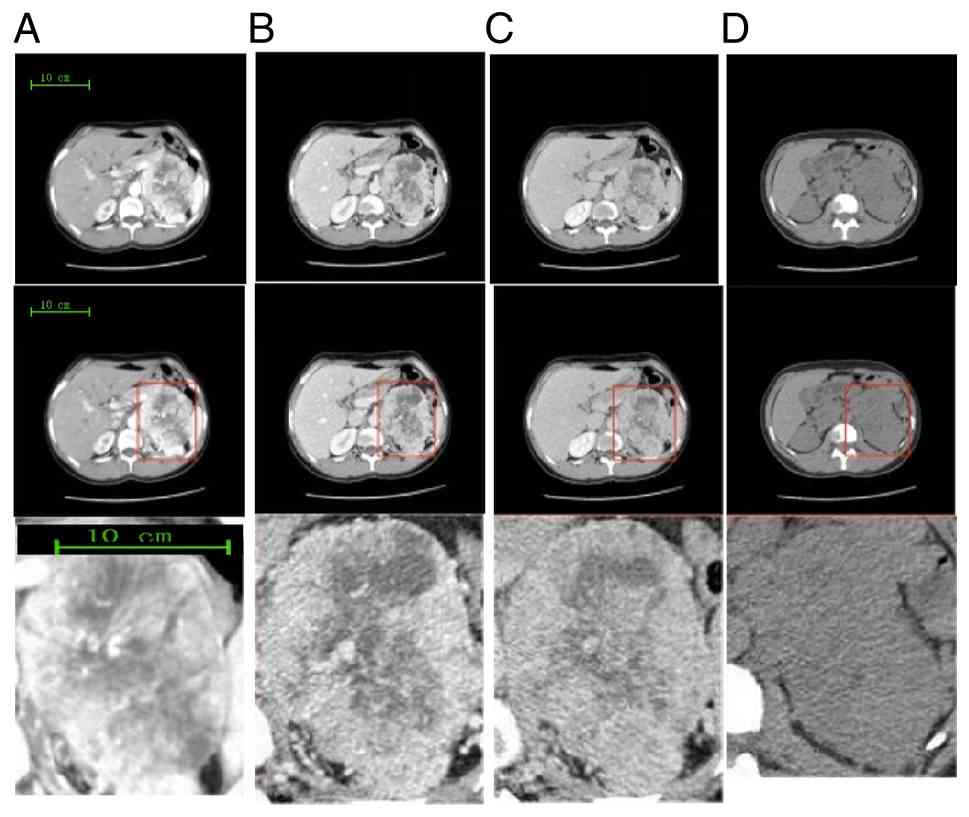
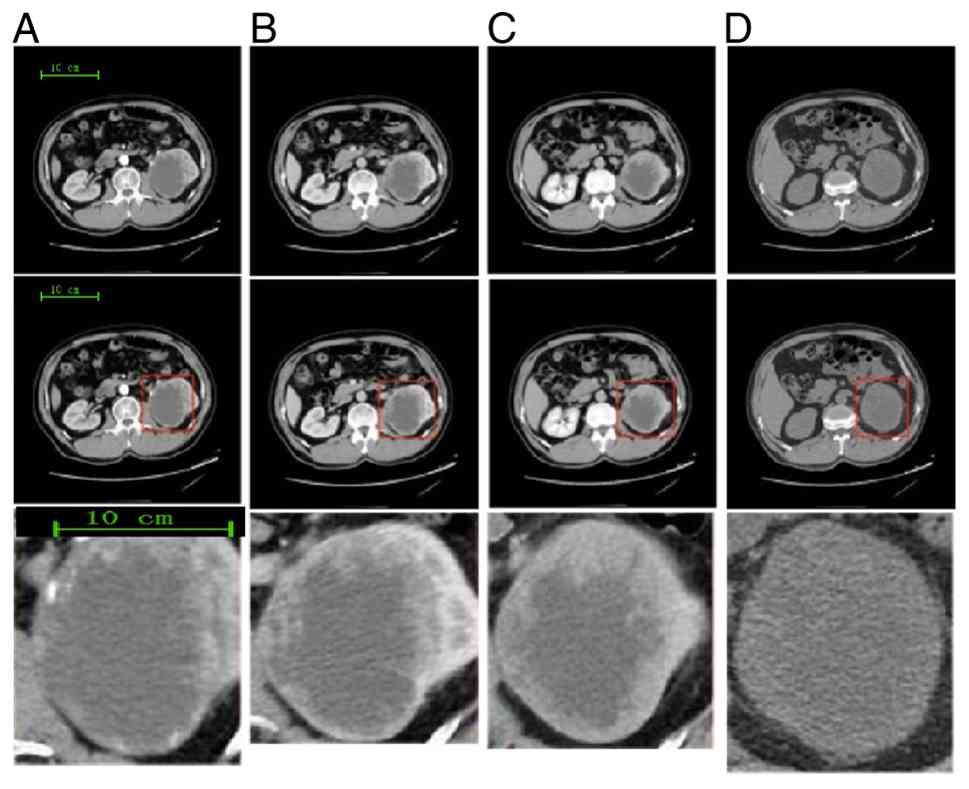
and they were uniformly resized to 224×224 pixels (Figs. 1 and 2).
Model construction and data
augmentation
The enrolled 137 patients were divided into a model
construction group of 110 cases (26 cases of high grade and 84
cases of low grade) and a clinical validation group of 27 cases (9
cases of high grade and 18 cases of low grade). Patients in the
model construction group underwent model construction, training and
optimization, while those in the clinical validation group
underwent clinical validation of model efficacy. The model
construction group was further subdivided into the training group
of 87 cases (20 cases of high grade and 67 cases of low grade) and
the test group of 23 cases (6 cases of high grade and 17 cases of
low grade). CT images were categorized and stored by phase and
grade, with 3,533 images in the arterial phase, 3,656 images in the
venous phase, 3,278 images in the excretion phase, 2,619 images in
the planar phase and 13,086 images in the combined four phases in
the training group, whereas there were 944 images in the arterial
phase, 975 images in the venous phase, 931 images in the excretion
phase, 793 images in the planar phase and 3,643 images in the
combined four phases in the test group. In response to the small
number of high-grade patients, high-grade CT images in the training
group were augmented by brightness enhancement, random flip and 20°
random rotation, and the test group was augmented by brightness
enhancement. After augmentation, the training group had 5,372
images in the arterial phase, 5,558 images in the venous phase,
5,090 images in the excretion phase, 3,999 images in the plain scan
phase and 20,019 images in the combined four phases; the test group
had 1,187 images in the arterial phase, 1,234 images in the venous
phase, 1,167 images in the excretory phase, 1,005 images in the
plain phase and 4,593 images in the combined four phases. The
specific augmentation methods (brightness enhancement, random flip
and 20° random rotation) were chosen to simulate real-world image
variations while preserving pathological integrity, thereby
improving model generalizability without introducing unrealistic
artifacts (16).
DL model selection and training
The CT data of each phase of the training group were
input into the Mobilenetv3-large network(PyTorch 1.10,
github.com/tensorflow/models/tree/master/research/slim/nets/mobilenet;)
for network training, and the plain scan phase model, arterial
phase model, venous phase model, excretion phase model and combined
four-phase model were constructed. Adaptive moment estimation
(Adam) and cross-entropy loss function were used for all network
training. The final hyperparameters of the trained models in the
present study were learning rate=0.0001, batch size=16 and number
of optimizations=100. To determine these hyperparameters, a
sensitivity analysis was performed using the training set with
5-fold cross-validation. Specifically, learning rates of {0.1,
0.01, 0.001, 0.0001, 0.00001}, batch sizes of {8, 16, 32, 64} and
epochs of {50, 100, 150, 200} were evaluated. A learning rate of
0.0001 provided the most stable convergence without oscillation,
while higher rates (≥0.001) led to loss divergence. Batch size 16
achieved the best balance between gradient stability and
generalization, as smaller batches (8) caused noisy gradients and overfitting
(training accuracy >0.95 but validation accuracy <0.72), and
larger batches (32, 64) resulted in poor convergence. Regarding
epoch count, validation performance plateaued after ~80 epochs, and
early stopping at 100 epochs prevented overfitting while preserving
optimal weights. These hyperparameter choices were particularly
critical due to the relatively small sample size, especially for
the high-grade group.
All models were created using the Python 3.7
(python.org/downloads/release/python-370/)programming language and
subsequently compiled and trained using Pytorch 1.10
(pytorch.org/get-started/previous-versions/) and Cuda
11.2(developer.nvidia.com/cuda-11-2-0-download-archive). Desktop
workstations with RTX 3060 GPUs were used for these models and
Jupyter software (version 6.4.5, jupyter.org) was used for the
integrated development environment (IDE) tool. Mobilenetv3-large
was selected as the primary model due to its proven efficiency in
medical image analysis, balancing high accuracy with low
computational cost compared with heavier architectures such as
ResNet (pytorch.org/vision/stable/models/resnet.html) and VGG
(pytorch.org/vision/stable/models/vgg.html).
Comparative analysis with alternative
architectures
To justify the selection of MobileNetV3-Large as the
primary model, the present study trained and tested two widely used
deep learning architectures, ResNet50 (available at http://pytorch.org/vision/stable/models/resnet.html)
and VGG16 (available at http://pytorch.org/vision/stable/models/vgg.html), on
the same venous-phase CT dataset. Both models were trained under
identical conditions to ensure fair comparison: learning
rate=0.0001, batch size=16, and number of epochs=100, using the
same adaptive moment estimation (Adam) optimizer and cross-entropy
loss function as used for the MobileNetV3-Large model. The same
training, test, and validation set splits were applied. The
performance of ResNet50 and VGG16 was evaluated using the same
metrics (accuracy, AUC, precision, sensitivity, specificity, and
F1-score). Computational efficiency was compared based on the
number of trainable parameters and inference time per image
(averaged over the test set using an RTX 3060 GPU).
DL model testing and optimal model
screening
Following the initial construction and training of
the models for each phase, their performance was tested using data
from the test group. The CT data of each phase of the test group
were input into the constructed models of each phase, thus
outputting their respective accuracy, precision, sensitivity,
specificity, F1-score and area under the curve (AUC) value in terms
of prediction. The optimal model was selected based on the
evaluation output. Eventually, the optimal model was screened based
on the evaluation output.
Prediction accuracy is the ratio of correctly
predicted observations to the total observations. It measures the
overall correctness of a model and is calculated as the sum of true
positives (TP) and true negatives (TN) divided by the total number
of observations. Precision, also known as the positive predictive
value, is the ratio of true positives to the total number of
predicted positives (TP + FP). It indicates the proportion of
positive identifications that were actually correct. Sensitivity,
also known as the true positive rate, is the ratio of true
positives to the possible positives (TP + FN). It measures how well
a model identifies actual positive instances. Specificity, also
known as the true negative rate, is the ratio of true negatives to
the possible negatives (TN + FP). It measures how well a model
avoids false positives. The F1-Score is the harmonic mean of
precision and recall (sensitivity). It is a single metric that
balances both false positives and false negatives. It is
particularly useful when the class distribution is imbalanced. AUC,
specifically referring to the area under the receiver operating
characteristic (ROC) curve, measures the ability of a classifier to
distinguish between classes. AUC is the probability that a
classifier will rank a random positive instance higher than a
random negative instance. An AUC of 1 indicates perfect
classification, while an AUC of 0.5 suggests no discriminative
ability. Each of these metrics provides a different perspective on
the performance of a classification model, and they are often used
in conjunction to provide a comprehensive assessment.
Clinical validation of the optimal
model
To validate the clinical application and predictive
performance of the optimal model, the corresponding CT data of 27
patients in the validation group were input into the optimal model
and the diagnostic results of their Ki-67 high and low grades were
the output. To begin with, three corresponding CT images of
patients in the verification group were randomly selected, which
were subsequently pre-processed by labeling and cropping and
imported into the optimal model, and finally their outputs were
compared with their actual postoperative pathology results.
Consistent results indicate a correct diagnosis, otherwise an
incorrect diagnosis was assigned. If each patient had ≥2 correctly
diagnosed CT images, its Ki-67 expression was considered to be
correctly predicted, in which case the accuracy of prediction and
other corresponding results was calculated.
Statistical analysis
All data were statistically analyzed using the SPSS
26.0 software (IBM Corp.). Measurement data are expressed as mean ±
standard deviation, and the high-grade and low-grade groups were
compared using an independent two-sample Student's t-test after
normality verification using a Shapiro-Wilk test. Categorical
variables (sex, tumor size, AJCC stage, hypertension, diabetes
mellitus and pathological type) are presented as frequences and
percentages and group differences were assessed using a Pearson's
χ2 test. For 2×2 contingency tables where any expected
cell count was <5, a Fisher's exact test was applied instead.
The confusion matrix plots and ROC curves of the optimal model were
constructed using Python 3.7. In the process of clinical
verification, the accuracy, sensitivity and specificity of the
optimal model to predict the verification group were calculated,
and the consistency between the prediction results of the model and
the actual pathological results was evaluated using the k-value. A
k-value ≤0.2 indicates weak consistency, a value between 0.21–0.40
indicates weak consistency, a value between 0.41–0.60 indicates
moderate consistency, a value between 0.61–0.80 indicates notable
consistency and a value between 0.81–0.99 indicates optimal
consistency. The 95% confidence intervals were then calculated, and
the efficacy of the optimal model for clinical application was
assessed combined with all the results obtained.
Results
Clinical baseline data
Existing studies (17–19)
defined Ki-67 ≥10% as high grade and Ki-67 <10% as low grade.
There were 35 cases in the high-grade group, including 28 male and
7 women, aged 28–75 years old, with a mean age of 58.00±8.94 years;
14 cases were on the left side and 21 cases were on the right side,
and the maximum diameter of the tumors ranged from 1.8–13.0 cm,
with a mean maximum diameter of 5.11±2.57 cm; ii) there were 102
cases in the low-grade group, including 57 men and 45 women, aged
30–76 years old, with a mean age of 57.46±10.84 years; 46 cases
were on the left side and 56 cases were on the right side, and the
maximum diameter of the tumors ranged from 1.0–12.5 cm, with a mean
maximum diameter of 4.35±2.39 cm. Regarding tumor stage based on
the AJCC 8th edition (20), in the
high-grade group, 11 cases were stage I, 9 were stage II, 10 were
stage III and 5 were stage IV; in the low-grade group, 58 cases
were stage I, 22 were stage II, 15 were stage III and 7 were stage
IV. Common comorbidities included hypertension (31 cases in high-
vs. 58 in low-grade) and diabetes mellitus (12 cases in high-grade
vs. 33 in low-grade). Sex distribution differed significantly
(P=0.011), with a higher proportion of males in the high-(28/35,
80.0%) compared with the low-grade group (57/102, 55.9%). Tumor
stage also showed a significant difference (P=0.018), as the
high-grade group had a greater proportion of advanced-stage disease
(stage III/IV: 15/35, 42.9%) relative to the low-grade group
(22/102, 21.6%). In addition, the prevalence of hypertension was
significantly higher in the high-grade group (31/35, 88.6%) than in
the low-grade group (58/102, 56.9%) (P=0.001). The details of the
clinical data are shown in Table
I.
 | Table I.Clinical characteristics of 137
patients with RCC. |
Table I.
Clinical characteristics of 137
patients with RCC.
|
Characteristics | Low-grade, Ki-67
<10% (n=102) | High-grade, Ki-67
≥10% (n=35) | P-value |
|---|
| Sex |
|
| 0.011 |
|
Male | 57 | 28 |
|
|
Female | 45 | 7 |
|
| Age, years | 57.46±10.84 | 58.00±8.94 | 0.792 |
| Tumor side |
|
| 0.601 |
|
Left | 46 | 14 |
|
|
Right | 56 | 21 |
|
| Maximum diameter of
tumor, cm | 4.35±2.39 | 5.11±2.57 | 0.109 |
| Tumor stage (AJCC
8th) |
|
| 0.018 |
| Stage
I | 58 | 11 |
|
| Stage
II | 22 | 19 |
|
| Stage
III | 15 | 10 |
|
| Stage
IV | 7 | 5 |
|
| Comorbidities |
|
|
|
|
Hypertension | 58 | 31 | 0.001 |
|
Diabetes mellitus | 33 | 12 | 0.833 |
| Pathological
type |
|
| 0.215 |
| Clear
cell RCC | 92 | 32 |
|
|
Chromophobe RCC | 6 | 1 |
|
|
Papillary RCC | 3 | 1 |
|
| Other
types | 1 | 1 |
|
Predictive model performance
Following the establishment and training of the
predictive models for each of the four phases and the combined
four-phase, the CT images of the relevant test groups were used to
test the prediction performance of each model. The prediction
performance of each model in the prediction of both low- and
high-grade groups was tested separately, which was mainly evaluated
by the indexes of prediction accuracy, precision, sensitivity,
specificity, F1-score and AUC value. The results are shown in
Table II. To quantitatively
evaluate the impact of data augmentation, the venous phase
Mobilenetv3-large model was additionally trained and tested without
augmentation using the same training and test sets. Before
augmentation, the model achieved an average accuracy of 0.742,
sensitivity of 0.708 and F1-score of 0.721 for the high-grade
group. After augmentation (brightness enhancement, random flip and
20° random rotation), these metrics improved to 0.784, 0.764 and
0.770, respectively, with the most notable improvement observed in
sensitivity for the high-grade group (from 0.683 to 0.744). This
indicates that augmentation effectively alleviated the data
imbalance issue and enhanced model robustness. To exclude the
influencing factors of high-grade and low-grade and thus improve
evaluation of the prediction performance among models, the
prediction accuracy, precision, sensitivity, F1-score and AUC value
of both low- and high-grade groups were compared in each model by
summing them up and taking the arithmetic mean. The results are
shown in Table III.
| Table II.Predictive performance of models
constructed from images in each phase. |
Table II.
Predictive performance of models
constructed from images in each phase.
| Model | Grade | Accuracy | AUC value | Precision | Sensitivity | Specificity | F1-score |
|---|
| Plain scan phase
model | Low | 0.701 | 0.752 | 0.786 | 0.698 | 0.706 | 0.739 |
|
| High |
| 0.759 | 0.602 | 0.706 | 0.698 | 0.650 |
| Arterial phase
model | Low | 0.767 | 0.889 | 0.695 | 0.976 | 0.547 | 0.812 |
|
| High |
| 0.899 | 0.955 | 0.547 | 0.976 | 0.696 |
| Venous phase
model | Low | 0.784 | 0.824 | 0.773 | 0.888 | 0.640 | 0.827 |
|
| High |
| 0.822 | 0.805 | 0.640 | 0.888 | 0.714 |
| Excretion phase
model | Low | 0.730 | 0.767 | 0.720 | 0.788 | 0.665 | 0.701 |
|
| High |
| 0.783 | 0.741 | 0.665 | 0.788 | 0.739 |
| Combined four-phase
model | Low | 0.774 | 0.871 | 0.723 | 0.929 | 0.598 | 0.813 |
|
| High |
| 0.882 | 0.882 | 0.598 | 0.929 | 0.713 |
| Table III.Average performance of models
constructed from images in each phase. |
Table III.
Average performance of models
constructed from images in each phase.
| Model | Accuracy | Average AUC | Average
precision | Average
sensitivity | Average
F1-score |
|---|
| Plain scan phase
model | 0.701 | 0.755 | 0.694 | 0.702 | 0.694 |
| Arterial phase
model | 0.767 | 0.894 | 0.825 | 0.761 | 0.754 |
| Venous phase
model | 0.784 | 0.823 | 0.789 | 0.764 | 0.770 |
| Excretion phase
model | 0.730 | 0.775 | 0.730 | 0.726 | 0.726 |
| Combined four-phase
model | 0.774 | 0.877 | 0.802 | 0.764 | 0.763 |
Predictive model performance
analysis
The prediction performance of the models was
compared in terms of average prediction performance, as shown in
Table III. The average prediction
accuracy, sensitivity, precision, F1-score and AUC value for the
plain scan phase model of Mobilenetv3-large were 0.701, 0.702,
0.694, 0.694 and 0.755, respectively; the aforementioned metrics
for the arterial phase model of Mobilenetv3-large were 0.767,
0.761, 0.825, 0.754 and 0.894, respectively. For the venous phase
model of Mobilenetv3-large, the average prediction accuracy,
sensitivity, precision, F1-score and AUC value metrics were 0.784,
0.764, 0.789, 0.770 and 0.823, respectively; and for the excretion
phase model of Mobilenetv3-large, these metrics were 0.730, 0.726,
0.730, 0.726 and 0.775, respectively. The aforementioned indicators
for the combined four-phase model of Mobilenetv3-large were 0.774,
0.764, 0.802, 0.763 and 0.877, respectively.
To systematically select the optimal model, the
following predefined criteria were established based on the
clinical context of class imbalance (high-grade:low-grade ≈1:3): i)
Primary priority was given to average accuracy, sensitivity for
high-grade and F1-score, as these metrics directly reflect the
model's ability to correctly identify the minority high-grade
class; and ii) secondary priority was given to AUC and precision,
which assess overall discriminative ability and positive predictive
value, respectively. Performance differences between models were
evaluated by directly comparing these metrics, with a difference of
≥0.02 considered practically significant based on the scale of the
validation cohort. As shown in Table
III, the venous phase model achieved the highest average
accuracy (0.784), highest average sensitivity (0.764) and highest
average F1-score (0.770) among all five models. Additionally, its
average precision (0.789) and AUC (0.823) were ranked second and
third, respectively, but remained within 0.02 of the top-performing
models (arterial phase, precision 0.825; AUC 0.894). Given that
sensitivity for the high-grade group is clinically paramount for
avoiding missed aggressive tumors, and considering its superior
robustness across multiple metrics, the venous phase model was
selected as the optimal model for subsequent clinical validation.
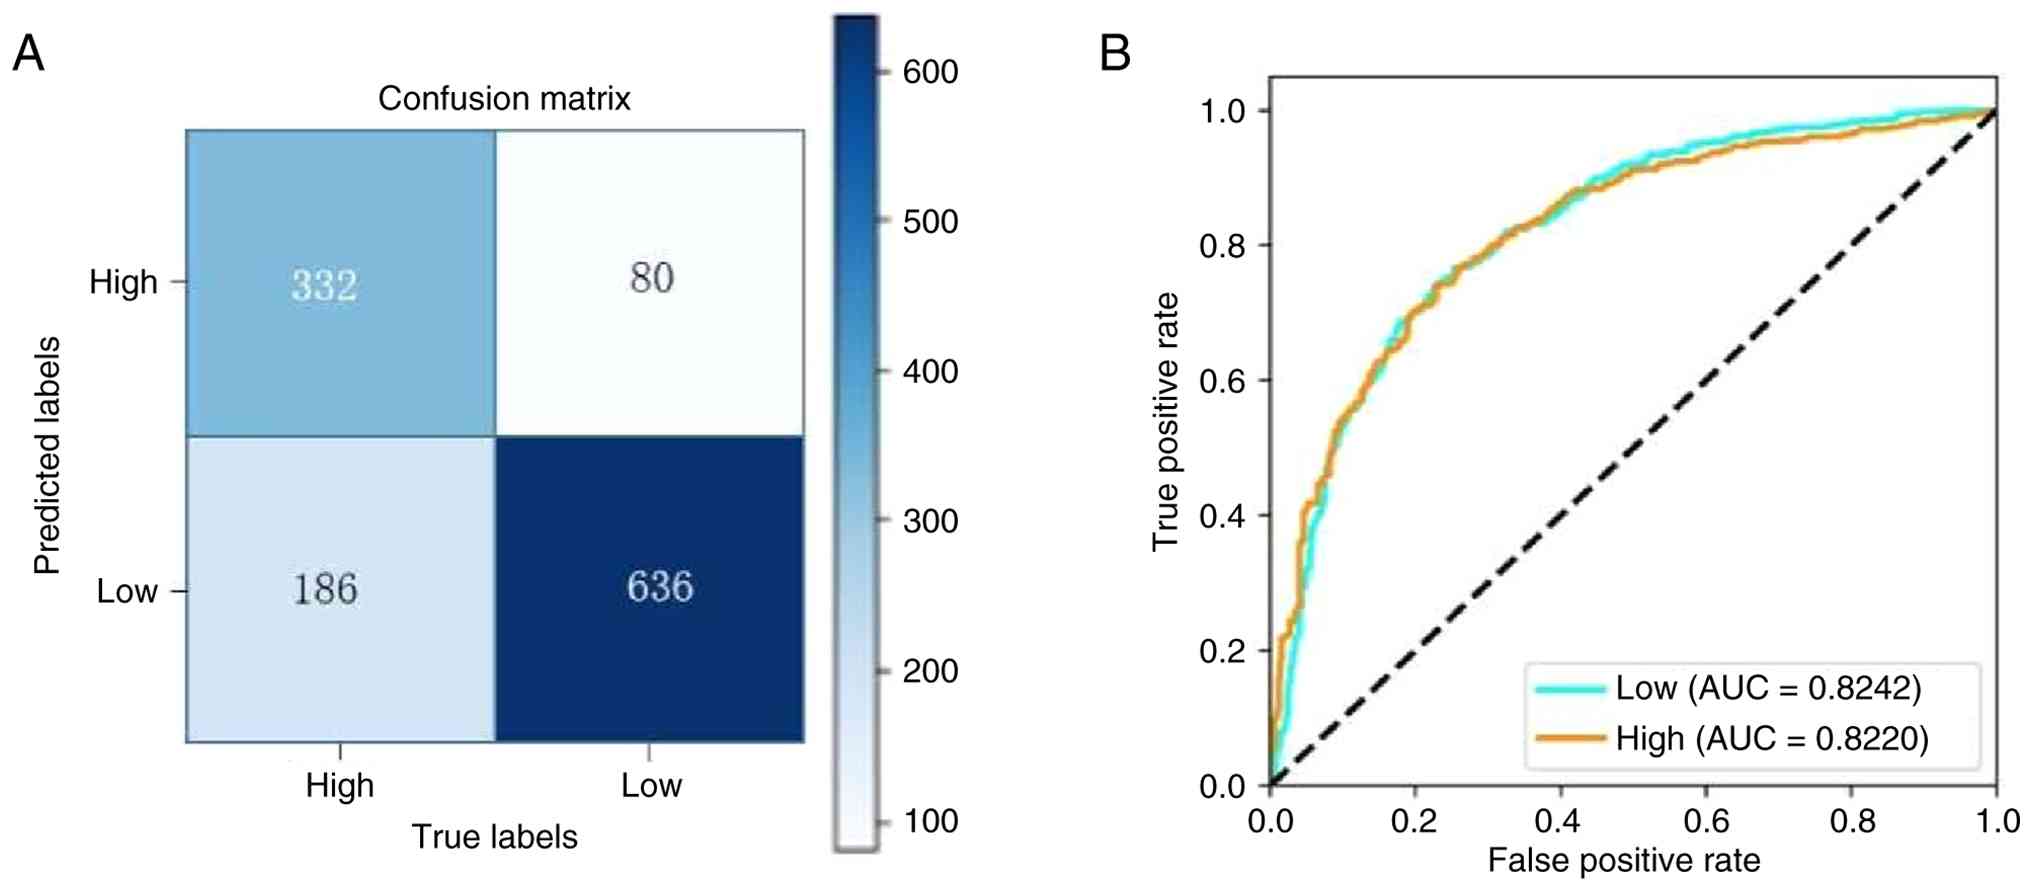
The confusion matrix (Fig. 3A)
showed that the model correctly classified 15/17 low- and 4/6
high-grade patients, yielding a sensitivity of 0.667 and a
specificity of 0.882 for the high-grade group. The ROC curve
(Fig. 3B) demonstrated an AUC of
0.823 (95% CI: 0.751–0.895), indicating good predictive
performance.
Clinical validation and analysis of
the optimal model
The optimal model, the venous phase model of
Mobilenetv3-large, was used for the prediction of Ki-67 expression
in the validation group of 27 patients (18 low- and 9 high-grade).
Three CT images of each patient in the venous phase were randomly
selected and input into the venous phase model, and two or more
correctly predicted CT images were determined to be correctly
predicted. The results show that the model predicted in the
validation group with an accuracy of 0.814, a sensitivity of 0.889
and a specificity of 0.667 for predicting the low-grade, and a
sensitivity of 0.667 and a specificity of 0.889 for predicting the
high-grade. The prediction results are shown in detail in Table IV. The k-value of the consistency
test between the predicted and actual pathologic diagnosis of Ki-67
expression of the venous phase model of Mobilenetv3-large was 0.57
(P=0.003), indicating a moderate consistency between the prediction
results of the optimal model and the actual pathological diagnosis
of the patient, with 95% confidence intervals of 0.24 and 0.90.
| Table IV.Results of clinical validation of the
venous phase model of Mobilenetv3-large. |
Table IV.
Results of clinical validation of the
venous phase model of Mobilenetv3-large.
|
| Postoperative
pathological Ki-67 expression results |
|
|---|
|
|
|
|
|---|
| Optimal model
prediction results | Low-grade | High-grade | Total |
|---|
| Low-grade | 16 | 3 | 19 |
| High-grade | 2 | 6 | 8 |
| Total | 18 | 9 | 27 |
To justify the selection of Mobilenetv3-large, two
other widely used DL architectures, ResNet50 and VGG16, were
additionally trained and tested on the same venous-phase CT dataset
under identical training conditions. As shown in Table V, Mobilenetv3-large achieved
superior performance with an average accuracy of 0.784 and AUC of
0.823, compared with ResNet50 (accuracy, 0.761; AUC, 0.805) and
VGG16 (accuracy, 0.743; AUC, 0.791). Furthermore, Mobilenetv3-large
had ~4.0 million parameters, markedly fewer than ResNet50 (25.6
million) and VGG16 (138 million), resulting in faster inference
time (12 vs. 28 vs. 45 msec/image). These results demonstrate that
Mobilenetv3-large offers an optimal trade-off between predictive
performance and computational efficiency for this task.
| Table V.Comparison of different deep learning
models on the venous-phase CT dataset. |
Table V.
Comparison of different deep learning
models on the venous-phase CT dataset.
| Model | Parameters, M | Inference time,
ms/image | Accuracy | AUC |
|---|
|
Mobilenetv3-large | 4.0 | 12 | 0.784 | 0.823 |
| ResNet50 | 25.6 | 28 | 0.761 | 0.805 |
| VGG16 | 138.0 | 45 | 0.743 | 0.791 |
Discussion
A growing number of early-stage RCCs are being
diagnosed with advances in imaging technology (21). Despite the increase in early
intervention treatments, RCC-specific mortality has not notably
improved (22). This has resulted
in the need of a more effective approach to improve patient
survival. AI has been increasingly used in the medical field in
recent years. It is in its early stages of application in the field
of RCC, but its successful application in other medical fields
demonstrates notable potential in the field of RCC. In the present
study, a model for preoperative prediction of Ki-67 expression in
patients with RCC was created and validated using DL technology
based on combined four-phase CT images of patients with RCC. Thanks
to the advantages of non-invasiveness, reduction of complications
and ease of acceptance, the model assists primary-level hospitals
(community hospitals and regional medical centers without
specialized urological pathology services) in understanding the
Ki-67 expression of patients with RCC. It is expected to be applied
to clinical practice in the future to facilitate the development of
individualized treatment plans. Unlike prior studies that focused
on Ki-67 prediction in other cancers or used traditional radiomics,
the present work specifically targets RCC and leverages a
lightweight yet efficient DL architecture (Mobilenetv3-large)
directly on original CT images without manual feature extraction,
thereby offering a more automated and potentially generalizable
solution.
Ki-67 is a broadly recognized marker for tumor
prognosis (23–25). In theory, histopathological changes
are well characterized by imaging techniques. Radiomic features can
quantify the image pixel and gray scale distribution to mirror
molecular pathological changes. In this sense, Ki-67 expression
prediction based on CT images is feasible (26). Studies have been conducted to
predict Ki-67 expression using AI technology, primarily centered on
other tumors, including glioma (27) and breast cancer (28), however, the present study shows the
promise of AI technology in the field of RCC (29–31).
In the present study, Ki-67 expression was predicted using DL
technology based on combined four-phase CT images of patients with
RCC. The results yielded a prediction accuracy of >70% for all
five models, and the optimal model, the venous phase model of
Mobilenetv3-large, showed good prediction efficacy with average
accuracy, sensitivity, precision, F1-score and AUC value of 0.784,
0.764, 0.789, 0.770 and 0.823, respectively. No additional studies
were found to similarly utilize AI technology to predict Ki-67
expression in RCC, highlighting a key innovative point of the
present study.
Beyond reporting model performance metrics, it is
important to interpret their clinical relevance, particularly for
low-grade (Ki-67 <10%) patients. In the clinical validation
cohort, the optimal venous-phase model achieved a specificity of
0.889 for predicting low-grade Ki-67 expression, meaning that 88.9%
of patients with truly low Ki-67 levels were correctly identified.
From a clinical perspective, high specificity for low-grade
prediction is particularly valuable because it reduces false
positives, cases incorrectly classified as high-grade.
False-positive predictions might lead to unnecessary anxiety, more
aggressive surgical planning or intensified postoperative
surveillance for patients who actually have indolent disease.
Conversely, the sensitivity for low-grade prediction (0.667)
indicates that one-third of low-grade patients were misclassified
as high-grade, which represents a limitation. These patients might
receive overly aggressive treatment. For high-grade prediction, the
model showed a sensitivity of 0.889 and specificity of 0.667,
meaning it is effective at identifying aggressive tumors but at the
cost of over-treatment in some low-grade cases. In clinical
practice, the acceptable trade-off between sensitivity and
specificity depends on the intended use: If the goal is to rule out
high-grade disease before conservative management (such as active
surveillance or partial nephrectomy), high specificity for
low-grade is desirable. If the goal is to avoid missing aggressive
tumors that require radical treatment, high sensitivity for
high-grade becomes more important. The present model offers both
strengths and limitations in this regard, and clinicians should
interpret its predictions in conjunction with other clinical
factors such as tumor size, stage and patient comorbidities. Future
work should focus on improving sensitivity for low-grade prediction
to reduce unnecessary aggressive interventions.
Mobilenetv3 is a type of DL convolutional neural
network that has achieved satisfactory achievements in the medical
field. For example, Huang et al (32) constructed a recognition model for
digitized pathology slide images of breast cancer by using
Mobilenetv3 network combined with bilinear structure, with a
classification accuracy up to 0.88. Mobilenetv3-large, as a branch
of the Mobilenetv3 network, prioritizes improving prediction
accuracy. An initial attempt to model Ki-67 expression prediction
in patients with RCC was made using the Mobilenetv3-large network,
yielding prediction accuracies >70% in all cases and up to 78.4%
in the venous phase. The comparative analysis further confirmed
that Mobilenetv3-large outperformed ResNet50 and VGG16 in both
predictive performance and computational efficiency on this task.
The lightweight architecture of Mobilenetv3-large, featuring neural
architecture search and squeeze-and-excitation modules, enables
effective feature extraction from CT images while avoiding
overfitting due to the relatively modest dataset size. This makes
it particularly suitable for medical imaging applications where
computational resources and annotated data may be limited.
There is a wealth of relevant research on AI in the
field of RCC, such as the differentiation of benign and malignant
renal masses. Baghdadi et al (33) collected CT images of 212 patients
with pathologically diagnosed renal oncocytoma and chRCC and
developed a model to discriminate benign renal oncocytoma from
chRCC using convolutional neural network with 95% accuracy, 100%
sensitivity and 89% specificity. In addition, AI also functions in
the prediction of pathologic grading of RCC. Xu et al
(12) developed a Fuhrman grading
prediction model for ccRCC using a DL algorithm. The authors
collected CT images of 706 patients with ccRCC, with 592 patients
as the training group and 114 patients as the validation group, and
defined patients with grade I and II as the low-grade group and
patients with grade III and IV as the high-grade group. The results
yielded an accuracy of 82% for the model with an AUC of 0.882. AI
has also been applied in the identification of pathologic types of
RCC. Han et al (31)
undertook the first study of classifying RCC subtypes based on a DL
algorithm, where triphasic CT images of 169 patients with RCC were
collected and used to train the established DL model. The results
yielded an accuracy of 85.4% for the training set and 81.0% for the
test set, with an AUC of 0.9. There are also applications of AI in
the prediction of pathological staging, gene mutation and prognosis
of RCC (34–36). The majority of studies, however,
maintain a focus on the prediction of ccRCC, given the limited
number of AI studies targeting immunohistochemical markers and the
predominance of ccRCC as the primary pathological subtype of RCC
(37–40). Although most patients enrolled in
the present study had ccRCC (124/137, 90.5%), a limited number of
pRCC (n=4) and chRCC (n=7) cases were included. However, due to the
small sample size of non-ccRCC subtypes (n=12), the model's
generalizability to these subtypes remains unproven, and future
studies with larger non-ccRCC cohorts are needed for
validation.
Data volume is influential on the performance of DL
technology applied to image analysis, as an increase in data volume
improves the model prediction performance. Data augmentation
techniques increase image heterogeneity without altering class
labels. however, careful parameter selection is required to avoid
introducing bias. In this study, augmentation parameters were kept
within clinically reasonable ranges, and augmentation was applied
only to the training set to preserve the validity of performance
evaluation on unaugmented test and validation sets. In the present
study, the prediction performance was improved by the data
augmentation technique because of a lower data volume in the
high-grade group. Specifically, augmentation improved the venous
phase model's average accuracy from 0.742 to 0.784 and high-grade
sensitivity from 0.683 to 0.744, demonstrating that brightness
enhancement, random flip and random rotation effectively increased
image heterogeneity and reduced overfitting. However, the
high-grade group was still lower than the low-grade group in terms
of F1-score and sensitivity after data augmentation. This suggests
that while data augmentation techniques may compensate for data
deficiencies, there is still a need to collect more high-grade
patient data to make the data volume more balanced and further
improve predictive performance.
There are still certain limitations to the present
study, including potential selection bias due to its retrospective
single-center design and the exclusion of patients with metastatic
disease, which may limit generalizability to advanced RCC. The
predominance of ccRCC (124/137, 90.5%) may also introduce subtype
bias, as the findings may not fully apply to non-ccRCC types.
Additionally, the Ki-67 threshold of 10%, while commonly used in
prior literature, lacks universal standardization. To address these
limitations, future multi-center prospective studies with
consecutive patient enrollment across different RCC subtypes and
disease stages are needed to validate and improve model
generalizability.
It is also worth noting that hyperparameter
selection is particularly consequential in small-sample DL studies.
The sensitivity analysis revealed that the model's performance was
notably sensitive to learning rate and batch size, with
inappropriate choices exacerbating overfitting. The relatively
modest dataset size, especially for the high-grade group (n=35),
necessitated conservative hyperparameter choices (such as lower
learning rate, moderate batch size and early stopping). Future
studies with larger multicenter cohorts may benefit from more
extensive hyperparameter tuning strategies, such as Bayesian
optimization.
Regarding clinical implementation, the model could
be integrated into existing picture archiving and communication
systems as a preoperative decision-support tool to assist risk
stratification. Key challenges including multi-scanner
generalizability, automation of tumor ROI cropping and regulatory
approval, must be addressed through prospective multi-center
validation and development of an automated segmentation module
before widespread adoption.
In conclusion, the Mobilenetv3-large model, when
applied to venous-phase CT images, demonstrates notable clinical
utility. It can proficiently forecast Ki-67 expression levels,
thereby offering a precise, expedient and non-invasive aid in the
formulation of tailored therapeutic strategies.
Acknowledgements
Not applicable.
Funding
The present study was supported by Medical Science Foundation of
Hebei University (grant no. 2021X07), Hebei Provincial Medical
Science Research Project (grant no. 20231493), Baoding Science and
Technology Planning Project (grant no. 2241ZF334) and Hebei
Provincial Government-Funded Project for Cultivating Excellent
Medical Talents (grant no. ZF2023233).
Availability of data and materials
The data generated in the present study may be
requested from the corresponding author.
Authors' contributions
DS performed the experiments and analyzed data. ZC
designed the study and interpreted data. DS and ZC confirm the
authenticity of all the raw data. YL conceived the study and
revised the manuscript. BS and TM contributed to the study concept
and design. HL, BZ and CG contributed to the acquisition of data,
analysis and interpretation of data. All authors read and approved
the final version of the manuscript.
Ethics approval and consent to
participate
Ethical approval for the present study was obtained
from the Ethics Committee of The Affiliated Hospital of Hebei
University (approval no. HDFY-LL-2022-087; February 28, 2022). The
present study was conducted under the Declaration of Helsinki. For
prospectively enrolled patients (March 2022-November 2023), written
informed consent was obtained from all participants prior to
surgery, following full disclosure of the study purpose, data usage
and privacy protection measures. For retrospective cases (January
2019-February 2022), the ethics committee approved a combined
approach: i) Attempted re-consent via telephone or outpatient
clinic to obtain verbal informed consent, documented in medical
records; ii) for patients who could not be reached after at least
three attempts, a waiver of informed consent was granted by the
ethics committee, provided that all data were de-identified prior
to analysis (removal of names, hospital IDs and other direct
identifiers). The waiver was approved because the research involved
no more than minimal risk to subjects, and the retrospective data
collection could not be practicably conducted without such a
waiver.
Patient consent for publication
Not applicable.
Competing interests
The authors declare that they have no competing
interests.
References
|
1
|
Sung H, Ferlay J, Siegel RL, Laversanne M,
Soerjomataram I, Jemal A and Bray F: Global Cancer Statistics 2020:
GLOBOCAN estimates of incidence and mortality worldwide for 36
cancers in 185 countries. CA Cancer J Clin. 71:209–249.
2021.PubMed/NCBI
|
|
2
|
Siegel RL, Miller KD, Fuchs HE and Jemal
A: Cancer statistics, 2021. CA Cancer J Clin. 71:7–33.
2021.PubMed/NCBI
|
|
3
|
Pullen RL Jr: Renal cell carcinoma, part
1. Nursing. 51:34–40. 2021. View Article : Google Scholar : PubMed/NCBI
|
|
4
|
Miller DD and Brown EW: Artificial
intelligence in medical practice: The question to the answer? Am J
Med. 131:129–133. 2018. View Article : Google Scholar : PubMed/NCBI
|
|
5
|
Cui S, Tseng HH, Pakela J, Ten Haken RK
and El Naqa I: Introduction to machine and deep learning for
medical physicists. Med Phys. 47:e127–e147. 2020. View Article : Google Scholar : PubMed/NCBI
|
|
6
|
Zhao T and Dhillon SK: CD8+ T-cell
signatures as prognostic and immunotherapy response predictors in
non-small cell lung cancer. Folia Biol (Praha). 70:196–208. 2024.
View Article : Google Scholar : PubMed/NCBI
|
|
7
|
Xu L, Hua F, Li C and Xu T: Application
and evaluation of minimally invasive surgical treatment options for
early endometrial cancer. Technol Health Care. 32:4403–4415. 2024.
View Article : Google Scholar : PubMed/NCBI
|
|
8
|
Chrabańska M, Rynkiewicz M, Kiczmer P and
Drozdzowska B: Immunohistochemical expression of CD44, MMP-2,
MMP-9, and Ki-67 as the prognostic markers in non-clear cell renal
cell carcinomas-a prospective cohort study. J Clin Med.
11:51962022. View Article : Google Scholar : PubMed/NCBI
|
|
9
|
Krabbe LM, Bagrodia A, Haddad AQ, Kapur P,
Khalil D, Hynan LS, Wood CG, Karam JA, Weizer AZ, Raman JD, et al:
Multi-institutional validation of the predictive value of Ki-67 in
patients with high grade urothelial carcinoma of the upper urinary
tract. J Urol. 193:1486–1493. 2015. View Article : Google Scholar : PubMed/NCBI
|
|
10
|
Xie Y, Chen L, Ma X, Li H, Gu L, Gao Y,
Fan Y, Zhang Y and Zhang X: Prognostic and clinicopathological role
of high Ki-67 expression in patients with renal cell carcinoma: A
systematic review and meta-analysis. Sci Rep. 7:442812017.
View Article : Google Scholar : PubMed/NCBI
|
|
11
|
Virman JP, Bono P, Luukkaala TH, Sunela
KL, Kujala PM and Kellokumpu-Lehtinen PL: Combined angiogenesis and
proliferation markers' expressions as long-term prognostic factors
in renal cell cancer. Clin Genitourin Cancer. 14:e283–e289. 2016.
View Article : Google Scholar : PubMed/NCBI
|
|
12
|
Xu L, Yang C, Zhang F, Cheng X, Wei Y, Fan
S, Liu M, He X, Deng J, Xie T, et al: Deep learning using CT images
to grade clear cell renal cell carcinoma: Development and
validation of a prediction model. Cancers (Basel). 14:25742022.
View Article : Google Scholar : PubMed/NCBI
|
|
13
|
Ansari MY, Qaraqe M, Charafeddine F,
Serpedin E, Righetti R and Qaraqe K: Estimating age and gender from
electrocardiogram signals: A comprehensive review of the past
decade. Artif Intell Med. 146:1026902023. View Article : Google Scholar : PubMed/NCBI
|
|
14
|
Ansari MY, Yang Y, Balakrishnan S,
Abinahed J, Al-Ansari A, Warfa M, Almokdad O, Barah A, Omer A,
Singh AV, et al: A lightweight neural network with multiscale
feature enhancement for liver CT segmentation. Sci Rep.
12:141532022. View Article : Google Scholar : PubMed/NCBI
|
|
15
|
Yang H, Lin J, Liu H, Yao J, Lin Q, Wang
J, Jiang F, Wei L, Lin C, Wu K and Wu S: Automatic analysis
framework based on 3D-CT multi-scale features for accurate
prediction of Ki67 expression levels in substantial renal cell
carcinoma. Insights Imaging. 14:1302023. View Article : Google Scholar : PubMed/NCBI
|
|
16
|
Chlap P, Min H, Vandenberg N, Dowling J,
Holloway L and Haworth A: A review of medical image data
augmentation techniques for deep learning applications. J Med
Imaging Radiat Oncol. 65:545–563. 2021. View Article : Google Scholar : PubMed/NCBI
|
|
17
|
Lin F, Cui EM, Lei Y and Luo LP: CT-based
machine learning model to predict the Fuhrman nuclear grade of
clear cell renal cell carcinoma. Abdom Radiol (NY). 44:2528–2534.
2019. View Article : Google Scholar : PubMed/NCBI
|
|
18
|
Ding J, Xing Z, Jiang Z, Chen J, Pan L,
Qiu J and Xing W: CT-based radiomic model predicts high grade of
clear cell renal cell carcinoma. Eur J Radiol. 103:51–56. 2018.
View Article : Google Scholar : PubMed/NCBI
|
|
19
|
Lin F, Ma C, Xu J, Lei Y, Li Q, Lan Y, Sun
M, Long W and Cui E: A CT-based deep learning model for predicting
the nuclear grade of clear cell renal cell carcinoma. Eur J Radiol.
129:1090792020. View Article : Google Scholar : PubMed/NCBI
|
|
20
|
Amin MB, Edge SB, Greene FL, Byrd DR,
Brookland RK, Kay Washington M, Gershenwald JK, Compton CC, Hess
KR, Sullivan DC, et al: AJCC Cancer Staging Manual. 8th edition.
Springer; New York, NY: 2017
|
|
21
|
Capitanio U, Bensalah K, Bex A, Boorjian
SA, Bray F, Coleman J, Gore JL, Sun M, Wood C and Russo P:
Epidemiology of renal cell carcinoma. Eur Urol. 75:74–84. 2019.
View Article : Google Scholar : PubMed/NCBI
|
|
22
|
Padala SA and Barsouk A, Thandra KC,
Saginala K, Mohammed A, Vakiti A, Rawla P and Barsouk A:
Epidemiology of renal cell carcinoma. World J Oncol. 11:79–87.
2020. View Article : Google Scholar : PubMed/NCBI
|
|
23
|
Zheng Z, Chen Z, Xie Y, Zhong Q and Xie W:
Development and validation of a CT-based nomogram for preoperative
prediction of clear cell renal cell carcinoma grades. Eur Radiol.
31:6078–6086. 2021. View Article : Google Scholar : PubMed/NCBI
|
|
24
|
Sasaguri K and Takahashi N: CT and MR
imaging for solid renal mass characterization. Eur J Radiol.
99:40–54. 2018. View Article : Google Scholar : PubMed/NCBI
|
|
25
|
Cheville JC, Lohse CM, Zincke H, Weaver AL
and Blute ML: Comparisons of outcome and prognostic features among
histologic subtypes of renal cell carcinoma. Am J Surg Pathol.
27:612–624. 2003. View Article : Google Scholar : PubMed/NCBI
|
|
26
|
Shinagare AB, Krajewski KM,
Braschi-Amirfarzan M and Ramaiya NH: Advanced renal cell carcinoma:
Role of the radiologist in the era of precision medicine.
Radiology. 284:333–351. 2017. View Article : Google Scholar : PubMed/NCBI
|
|
27
|
Ni J, Zhang H, Yang Q, Fan X, Xu J, Sun J,
Zhang J, Hu Y, Xiao Z, Zhao Y, et al: Machine-learning and
radiomics-based preoperative prediction of Ki-67 expression in
glioma using MRI data. Acad Radiol. 31:3397–3405. 2024. View Article : Google Scholar : PubMed/NCBI
|
|
28
|
Cen Q, Wang M, Zhou S, Yang H and Wang Y:
Multi-center study: Ultrasound-based deep learning features for
predicting Ki-67 expression in breast cancer. Sci Rep.
15:102792025. View Article : Google Scholar : PubMed/NCBI
|
|
29
|
Zhang GM, Shi B, Xue HD, Ganeshan B, Sun H
and Jin ZY: Can quantitative CT texture analysis be used to
differentiate subtypes of renal cell carcinoma? Clin Radiol.
74:287–294. 2019. View Article : Google Scholar : PubMed/NCBI
|
|
30
|
Kocak B, Yardimci AH, Bektas CT,
Turkcanoglu MH, Erdim C, Yucetas U, Koca SB and Kilickesmez O:
Textural differences between renal cell carcinoma subtypes: Machine
learning-based quantitative computed tomography texture analysis
with independent external validation. Eur J Radiol. 107:149–157.
2018. View Article : Google Scholar : PubMed/NCBI
|
|
31
|
Han S, Hwang SI and Lee HJ: The
classification of renal cancer in 3-phase CT images using a deep
learning method. J Digit Imaging. 32:638–643. 2019. View Article : Google Scholar : PubMed/NCBI
|
|
32
|
Huang J, Mei L, Long M, Liu Y, Sun W, Li
X, Shen H, Zhou F, Ruan X, Wang D, et al: BM-net: CNN-based
MobileNet-V3 and bilinear structure for breast cancer detection in
whole slide images. Bioengineering (Basel). 9:2612022. View Article : Google Scholar : PubMed/NCBI
|
|
33
|
Baghdadi A, Aldhaam NA, Elsayed AS,
Hussein AA, Cavuoto LA, Kauffman E and Guru KA: Automated
differentiation of benign renal oncocytoma and chromophobe renal
cell carcinoma on computed tomography using deep learning. BJU Int.
125:553–560. 2020. View Article : Google Scholar : PubMed/NCBI
|
|
34
|
Lee S, Jung J, Park I, Park K and Kim DS:
A deep learning and similarity-based hierarchical clustering
approach for pathological stage prediction of papillary renal cell
carcinoma. Comput Struct Biotechnol J. 18:2639–2646. 2020.
View Article : Google Scholar : PubMed/NCBI
|
|
35
|
Kocak B, Durmaz ES, Ates E and Ulusan MB:
Radiogenomics in clear cell renal cell carcinoma: Machine
learning-based high-dimensional quantitative CT texture analysis in
predicting PBRM1 mutation status. AJR Am J Roentgenol. 212:W55–W63.
2019. View Article : Google Scholar : PubMed/NCBI
|
|
36
|
Schulz S, Woerl AC, Jungmann F, Glasner C,
Stenzel P, Strobl S, Fernandez A, Wagner DC, Haferkamp A,
Mildenberger P, et al: Multimodal deep learning for prognosis
prediction in renal cancer. Front Oncol. 11:7887402021. View Article : Google Scholar : PubMed/NCBI
|
|
37
|
Han JH, Kim BW, Kim TM, Ko JY, Choi SJ,
Kang M, Kim SY, Cho JY, Ku JH, Kwak C, et al: Fully automated
segmentation and classification of renal tumors on CT scans via
machine learning. BMC Cancer. 25:1732025. View Article : Google Scholar : PubMed/NCBI
|
|
38
|
Gupta A, Dhanakshirur RR, Jain K, Garg S,
Yadav N, Seth A and Das CJ: Deep learning for detecting and
subtyping renal cell carcinoma on contrast-enhanced CT scans using
2D neural network with feature consistency techniques. Indian J
Radiol Imaging. 35:395–401. 2025. View Article : Google Scholar : PubMed/NCBI
|
|
39
|
Kilicarslan G, Cetintas D, Tuncer T and
Yildirim M: Fusion-based deep learning approach for renal cell
carcinoma subtype detection using multi-phasic MRI data.
Diagnostics. 15:16362025. View Article : Google Scholar : PubMed/NCBI
|
|
40
|
Bolocan VO, Secareanu M, Sava E, Medar C,
Manolescu LSC, Cătălin Rașcu AȘ, Costache MG, Radavoi GD, Dobran RA
and Jinga V: Convolutional neural network model for segmentation
and classification of clear cell renal cell carcinoma based on
multiphase CT images. J Imaging. 9:2802023. View Article : Google Scholar : PubMed/NCBI
|