Introduction
Thyroid cancer is the most common endocrine
malignancy worldwide, while papillary thyroid carcinoma (PTC)
accounts for ~80% of all cases (1,2).
Although PTC generally carries a favorable prognosis, its global
incidence has increased steadily in recent decades. This trend
underscores the need to improve our understanding of the molecular
mechanisms underlying PTC pathogenesis to optimize diagnostic
approaches, refine risk stratification and guide therapeutic
strategies (3).
Several genetic alterations have been well described
in PTC, including the BRAFV600E mutation and mutations in
the RAS family genes (NRAS, KRAS and HRAS) (4). However, these alterations alone cannot
fully explain the heterogeneous clinical behavior observed in
patients with this disease. The 2025 American Thyroid Association
Management Guidelines for Adult Patients with Differentiated
Thyroid Cancer emphasize the importance of expanding the molecular
framework of thyroid carcinogenesis, including the integration of
transcriptomic approaches capable of capturing broader patterns of
gene dysregulation (5).
Transcriptomic analysis can enable the simultaneous
evaluation of thousands of genes, thus facilitating the
identification of differentially expressed genes (DEGs) with
potential diagnostic, prognostic and therapeutic potential.
RNA-sequencing (RNA-seq) has become the standard technology for
gene expression profiling, as it offers greater sensitivity, a
wider dynamic range and the ability to detect novel transcripts
compared with microarray-based approaches (6). Despite these advantages, several PTC
transcriptomic studies have relied on microarray data or
single-cohort analyses, commonly restricted to The Cancer Genome
Atlas (TCGA) (7–18). Consequently, comprehensive analyses
integrating multiple independent RNA-seq datasets that are
validated in external cohorts remain limited. Furthermore, despite
the increasing number of PTC transcriptomic studies, considerable
variability has been reported across datasets in the genes
identified as differentially expressed (7–9). This
heterogeneity can hamper the establishment of a consistent
molecular framework that can be reliably translated into clinical
practice. Identifying genes that are consistently dysregulated
across independent cohorts is therefore essential for defining
robust molecular characteristics of PTC beyond dataset-specific
findings.
Although our previous study identified KRT19
and CLDN1 as dysregulated genes in thyroid cancer, the
reproducibility of these findings across independent transcriptomic
datasets and different populations, as well as the identification
of additional robust candidate biomarkers, remained to be
established. Therefore, the present study aimed to identify genes
consistently dysregulated in PTC across independent transcriptomic
datasets and to evaluate their expression in clinically relevant
thyroid nodule samples, thus strengthening the biological
significance and potential diagnostic relevance of a reproducible
molecular signature of PTC.
Materials and methods
RNA-seq data acquisition
RNA-seq datasets were retrieved from the NCBI Gene
Expression Omnibus (GEO) repository (https://www.ncbi.nlm.nih.gov/geo/) (19) to identify dysregulated genes in PTC
through differential expression analysis. The database search was
performed using the key word ‘papillary thyroid carcinoma’ with the
following filters applied: Organism (Homo sapiens), study
type (expression profiling by high-throughput sequencing) and entry
type (datasets). Studies were eligible if they contained RNA-seq
data derived from thyroid tissue samples obtained from patients
with histologically confirmed PTC, along with either adjacent
non-tumoral thyroid tissues or benign thyroid nodules (BTNs) from
independent patients without cancer, which served as controls. Only
datasets providing accessible raw read count matrices were
included. Datasets based on microarray platforms, non-human samples
or cell lines were excluded. A total of six datasets, namely
GSE87410, GSE153659, GSE171011, GSE197443, GSE165724 and GSE201365
(20–24), met the predefined inclusion criteria
and were included in the downstream analyses. A detailed summary of
the included GEO datasets, including sample size, control type,
year of publication and sequencing platform information, is
provided in Table SI.
Data preprocessing
To reduce potential bias from low-count genes
associated with low sequencing depth, filtering was performed prior
to differential expression analysis. Specifically, genes with a
total read count of <10 across all samples within each dataset
were removed. No additional per-sample minimum count threshold was
applied. All preprocessing steps were performed using the dplyr
package (version 1.1.4; http://dplyr.tidyverse.org/) in R statistical software
(version 4.4.1; http://www.r-project.org/).
Identification of DEGs
Differential expression analysis was performed using
the DESeq2 package (version 1.34.1) (25). Genes with an adjusted P<0.05 were
considered significantly differentially expressed. In addition, to
identify genes with biologically meaningful expression differences,
an additional threshold of absolute log2 fold change
(|log2FC|>2) was applied.
Functional enrichment and Kyoto
Encyclopedia of Genes and Genomes (KEGG) pathway analysis
Functional enrichment analyses were performed to
evaluate the biological significance of the identified DEGs. An
adjusted P-value of <0.05 was considered significantly enriched
and top 10 enriched terms were selected for each category. Gene
Ontology (GO) enrichment and KEGG pathway analyses of the candidate
DEGs were conducted using the R package, clusterProfiler (version
4.6.2) (26–28).
Construction of the protein-protein
interaction (PPI) network and identification of hub genes
The PPI network of the identified DEGs was
constructed using Search Tool for the Retrieval of Interacting
Genes/Proteins (STRING; version 12.0), with an interaction score
cut-off of >0.4 (29). The
resulting network was imported into Cytoscape (version 3.10.2)
(30) for visualization and further
analysis. Hub genes were identified using the CytoHubba plugin by
applying multiple centrality algorithms, including Maximum
Neighborhood Component, degree, closeness, radiality, Maximal
Clique Centrality and Edge Percolated Component, to rank genes with
the highest connectivity and potential biological relevance in PTC
(31).
Experimental validation of hub genes
by reverse transcription-quantitative PCR (RT-qPCR)
To validate hub gene expression, a cross-sectional
analytical study was conducted, which included 86 samples obtained
from patients attending the diagnostic radiology center, Alvarez
& Arrazola Radiologists (Mazatlán, México) between February
2022 and August 2024. Patients with suspicious findings on thyroid
ultrasound were consecutively recruited and subsequently underwent
ultrasound-guided fine needle aspiration (FNA) biopsy for
cytological assessment. To minimize interobserver variability, all
cytological evaluations were performed by a single experienced
pathologist. Cytological classification was performed according to
the 2017 Bethesda System for Reporting Thyroid Cytopathology
(32). For the present study, only
patients ≥18 years of age with definitive cytological
classification were included in the analysis. Specifically, cases
categorized as Bethesda II were assigned to the BTN group, while
cases classified as Bethesda V and VI comprised the PTC group.
These categories were selected due to their higher level of
diagnostic certainty in distinguishing benign from malignant
lesions. Cases with non-diagnostic samples (Bethesda I),
indeterminate cytology (Bethesda III or IV) or incomplete clinical
data were excluded to reduce the risk of misclassification bias.
Samples with insufficient quality or integrity, as well as cases in
which patients voluntarily withdrew, were also excluded.
Histopathological confirmation following surgical resection was not
available and is acknowledged as a limitation of the present study.
The study protocol was approved by the Ethics and Research
Committee of the Polytechnic University of Sinaloa (Mazatlán,
México; approval no. 001-2022-CEI), and all participants provided
written informed consent forms prior to sample collection. The
cohort included in the present study was independent from
previously published cohorts. Samples were preserved in RNA Protect
Cell Reagent solution (Qiagen GmbH) and subsequently processed and
analyzed at the Laboratory of Biomedicine and Molecular Biology at
the Polytechnic University of Sinaloa.
RT-qPCR analysis
Total RNA was extracted using the RNeasy Plus Micro
Kit (Qiagen GmbH) according to the manufacturer's instructions.
cDNA was synthesized using the GoTaq 2-step RT-qPCR system Probe
kit (Promega Corporation) according to the manufacturer's
instructions. Reverse transcription was carried out under the
following thermal conditions: 5 min at 25°C, 45 min at 42°C and 15
min at 70°C. qPCR was performed using PrimeTime™ qPCR Probes
[claudin 1 (CLDN1), Hs.PT.58.15247281; keratin 19
(KRT19), Hs.PT.58.4188708; fibronectin 1 (FN1),
Hs.PT.58.40005963; and MET proto-oncogene, receptor tyrosine kinase
(MET), Hs.PT.58.339430] and PrimeTime™ Gene Expression
Master Mix (Integrated DNA Technologies, Inc.) on a StepOnePlus
real-time thermocycler (Applied Biosystems; Thermo Fisher
Scientific, Inc.). The amplification conditions consisted of an
initial denaturation at 95°C for 10 min, followed by 40 cycles of
denaturation at 95°C for 10 sec and annealing/extension at 60°C for
20 sec. β-actin (Hs.PT.39a.22214847) served as the endogenous
control. Relative gene expression levels were calculated using the
previously described 2−ΔΔCq method (33). Statistical analyses were carried out
to evaluate significant differences in gene expression between the
PTC and BTN groups.
In silico validation of hub gene
expression at the protein level
To further assess whether mRNA expression patterns
were consistent with protein abundance, hub gene expression was
evaluated in silico using immunohistochemistry (IHC) data
available from the Human Protein Atlas (https://www.proteinatlas.org/) (34). Representative IHC images of normal
thyroid tissue and PTC samples were retrieved and qualitatively
compared.
Statistical analysis
All experiments were performed in duplicate.
Descriptive statistics were applied to qualitative variables, which
are presented as frequencies and percentages, and to quantitative
variables, which are expressed as mean ± SD. Associations between
qualitative variables were assessed using the χ2 or
Fisher's exact test, as appropriate. Differences between two groups
were analyzed using unpaired Student's t-test or the Mann-Whitney U
test according to the results of the Shapiro-Wilk normality test.
P<0.05 was considered to indicate a statistically significant
difference. Statistical analyses were performed using SPSS (version
25.0; IBM Corp.).
Results
Identified DEGs
Differential expression analysis was performed
independently for each of the six datasets (Fig. 1). Across all datasets, a total of
131 genes were consistently dysregulated, including 128 upregulated
and 3 downregulated genes (Fig. 2).
These genes were included in subsequent functional enrichment and
PPI network analyses.
![Volcano plots of differential gene
expression analyses from six independent PTC datasets. Each panel
represents one dataset comparing PTC samples with benign or normal
thyroid tissue: (A) GSE153659, (B) GSE165724, (C) GSE171011, (D)
GSE197443, (E) GSE201365 and (F) GSE87410. The x-axis shows the
log2FC, while the y-axis represents statistical significance
[-log10(padj)]. Significantly upregulated genes (log2FC >2,
P<0.05) are shown as black squares, downregulated genes (log2FC
<-2, P<0.05) as black triangles and non-significant genes as
grey circles. FC, fold change; PTC, papillary thyroid
carcinoma.](/article_images/ol/32/5/ol-32-05-15854-g00.jpg) | Figure 1.Volcano plots of differential gene
expression analyses from six independent PTC datasets. Each panel
represents one dataset comparing PTC samples with benign or normal
thyroid tissue: (A) GSE153659, (B) GSE165724, (C) GSE171011, (D)
GSE197443, (E) GSE201365 and (F) GSE87410. The x-axis shows the
log2FC, while the y-axis represents statistical significance
[-log10(padj)]. Significantly upregulated genes (log2FC >2,
P<0.05) are shown as black squares, downregulated genes (log2FC
<-2, P<0.05) as black triangles and non-significant genes as
grey circles. FC, fold change; PTC, papillary thyroid
carcinoma. |
Functional enrichment and KEGG pathway
analysis
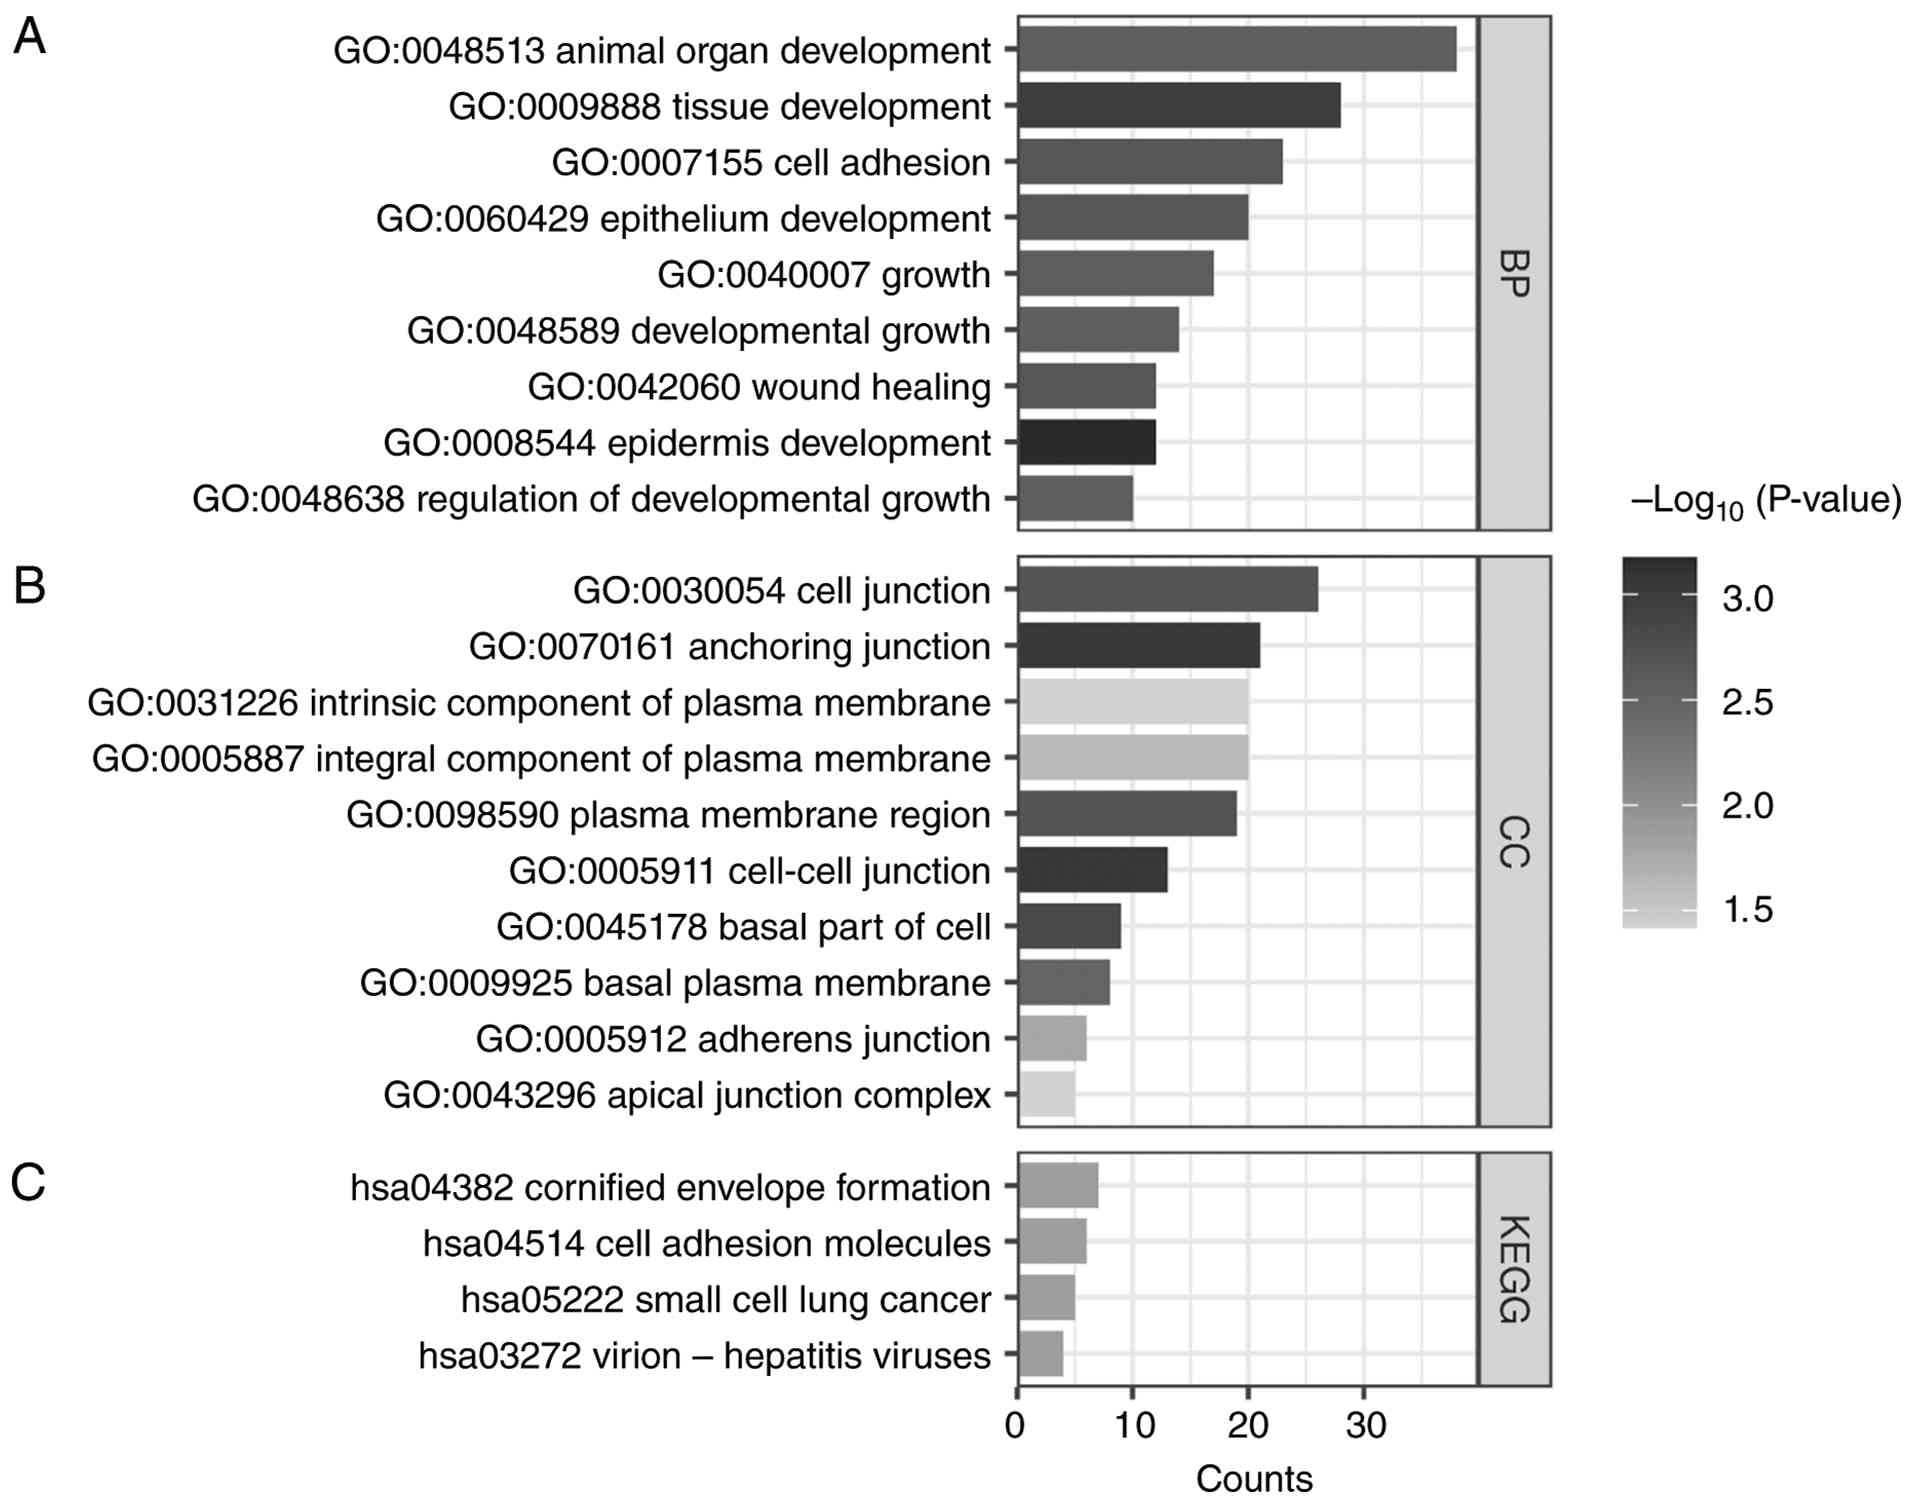
Functional enrichment analysis of the common DEGs
revealed significant overrepresentation of GO terms related to
biological processes (BP) and cellular components (CC), whereas no
significant enrichment was observed for molecular function
(Fig. 3A and B). Within the BP
category, the most significantly enriched GO terms included ‘animal
organ development’ (GO:0048513), ‘tissue development’ (GO:0009888)
and ‘cell adhesion’ (GO:0007155), which encompassed the largest
number of DEGs. In the CC category, enriched terms were primarily
associated with plasma membrane organization and intercellular
junction structures, including ‘cell junction’ (GO:0030054),
‘integral component of plasma membrane’ (GO:0005887), ‘anchoring
junction’ (GO:0070161) and ‘intrinsic component of plasma membrane’
(GO:0031226). The GO enrichment results, including BP and CC
categories, are listed in Tables
SII and SIII. The
aforementioned findings suggest that the dysregulated genes in PTC
were primarily involved in pathways governing cell adhesion and
tissue integrity, indicating potential alterations in intercellular
communication and plasma membrane organization in tumor cells. KEGG
pathway analysis further supported these observations, highlighting
enrichment in cancer-related and cell adhesion pathways, including
‘small cell lung cancer’ (hsa05222), ‘cell adhesion molecules’
(hsa04514), ‘cornified envelope formation’ (hsa04382) and
‘virion-hepatitis viruses’ (hsa03272) (Fig. 3C). The complete KEGG enrichment
results are provided in Table
SIV.
Identification of hub genes
The PPI network constructed from the 131 common DEGs
is presented in Fig. 4. Hub genes
were identified using the CytoHubba plugin in Cytoscape (version
3.10.2), applying six centrality algorithms. Only genes
consistently ranked among the top candidates across all six methods
were selected as hub genes (Table
I). This integrative network-based approach enabled the
identification of nodes with high topological centrality,
reflecting strong connectivity and potential biological influence
within the interaction network. A total of 4 genes, namely FN1,
MET, KRT19 and CLDN1, were selected through an
intersection-based strategy, in which only genes shared among the
top-ranked candidates identified by all six centrality metrics were
retained, supporting their relevance within the PPI network and
their potential involvement in key biological processes associated
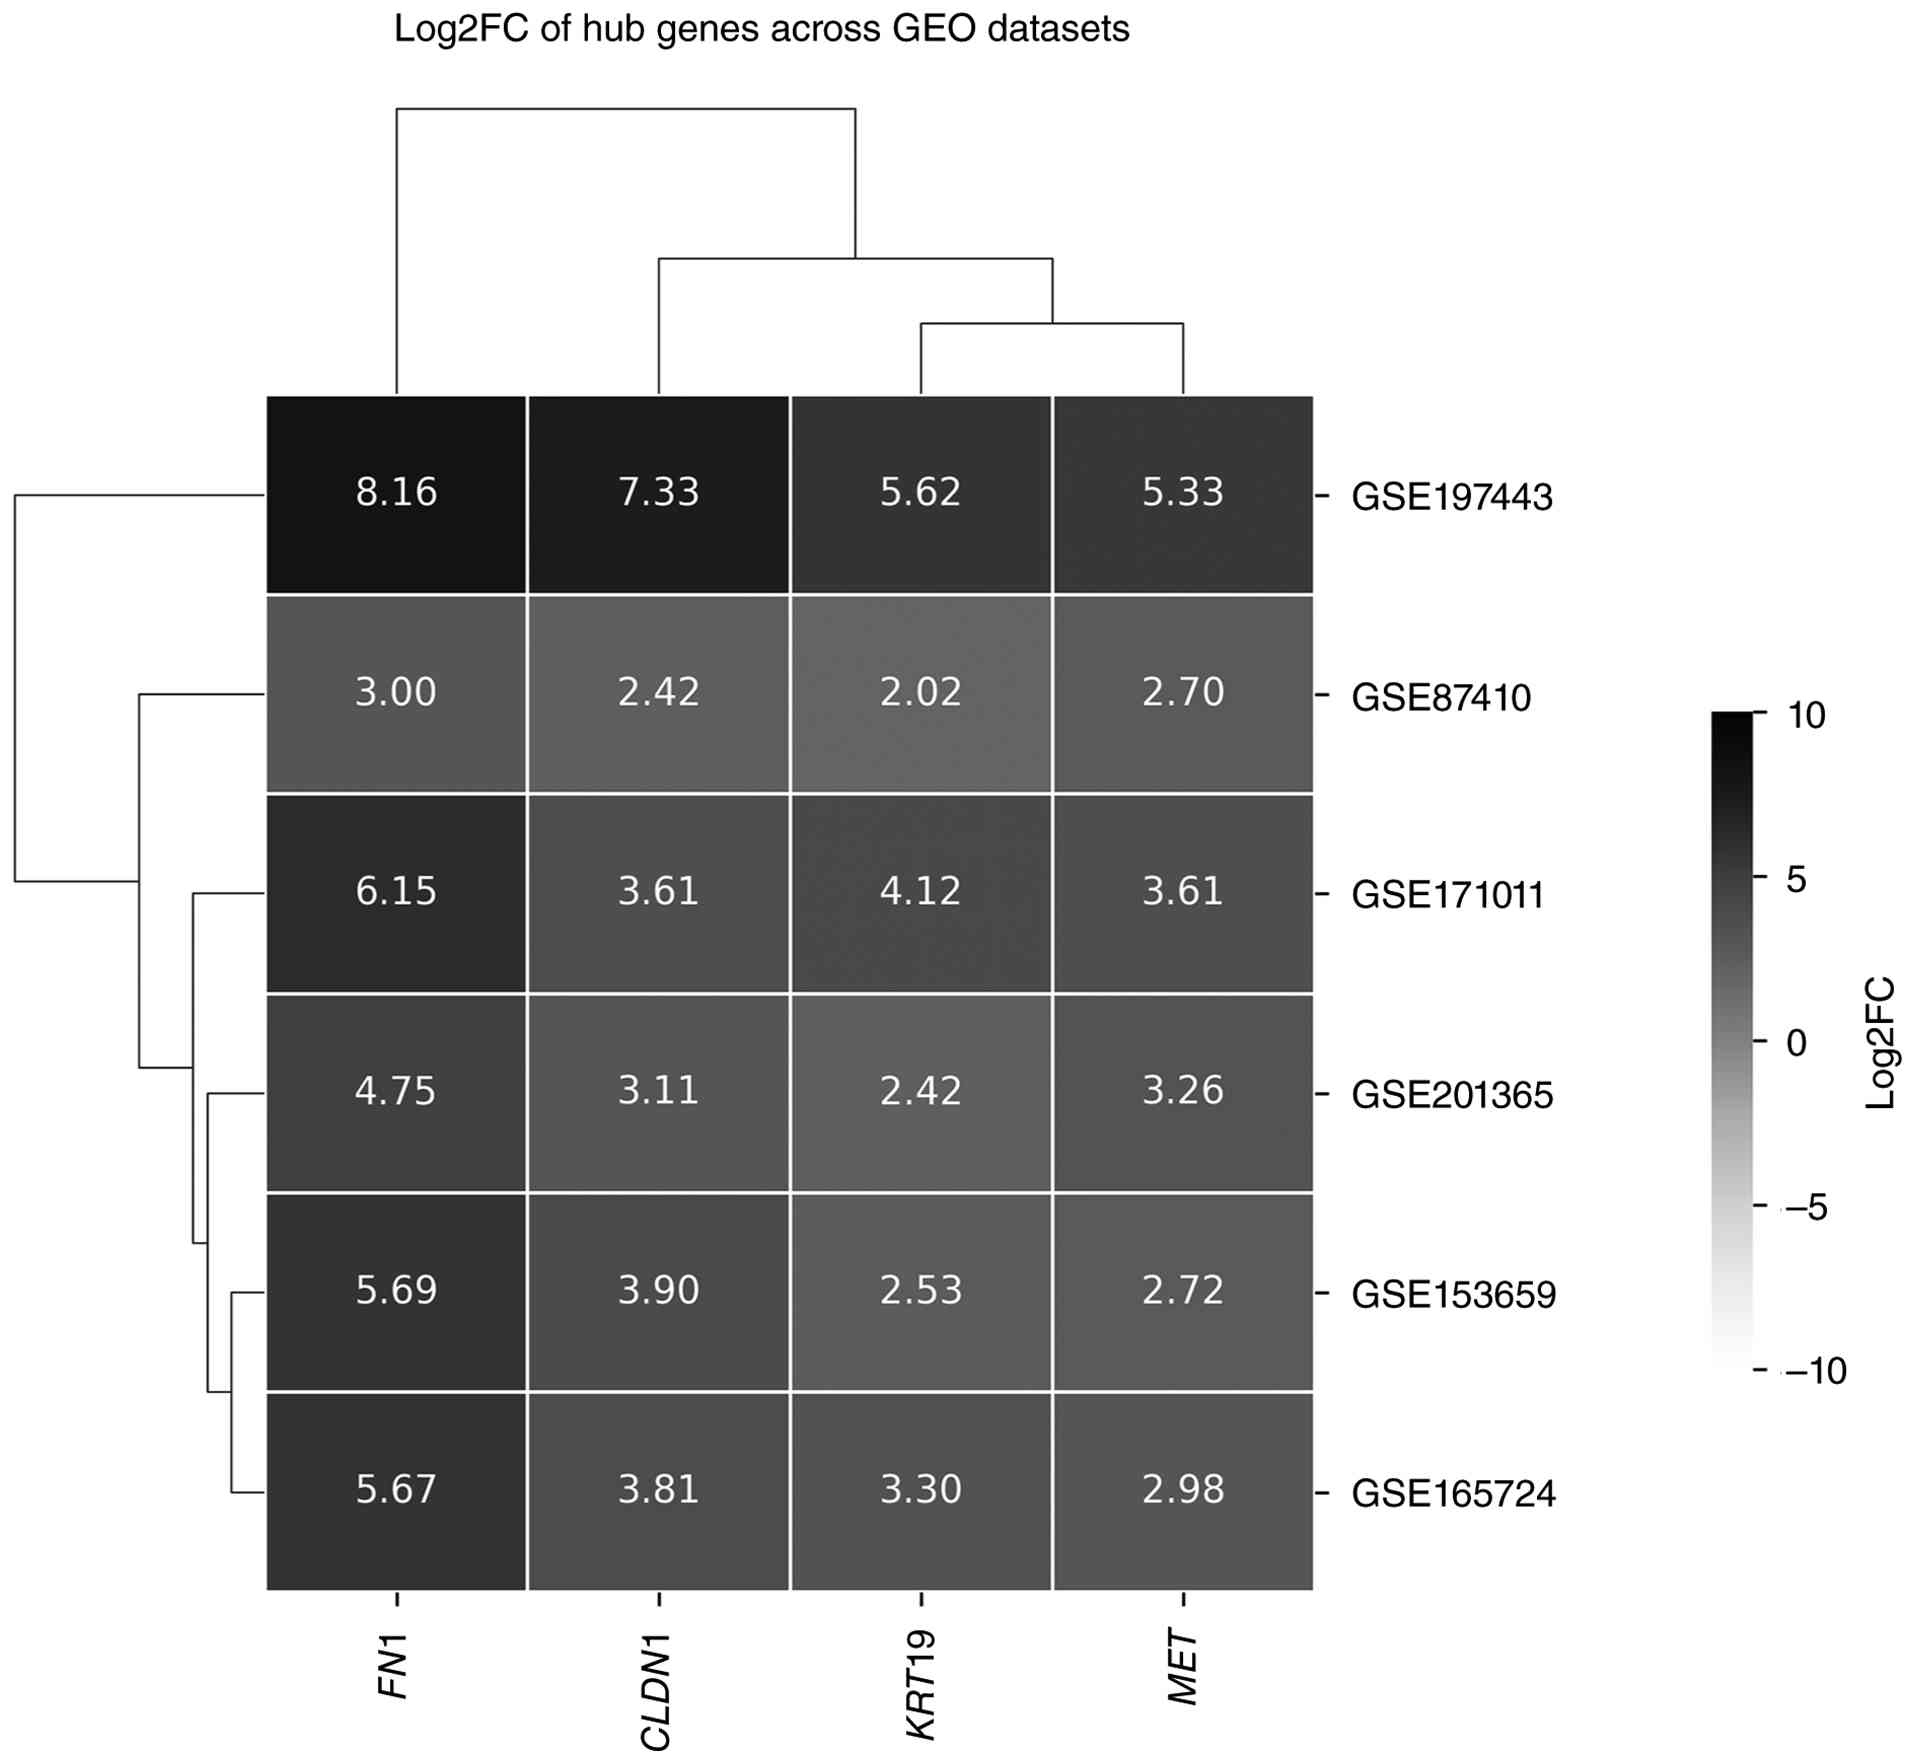
with PTC. The expression profile of these 4 genes across the six
independent datasets analyzed is illustrated in Fig. 5 as log2FC values, highlighting their
consistent dysregulation in PTC. The downregulated genes IQ motif
containing GTPase activating protein 3 (IQGAP3),
mitogen-activated protein kinase 1 (MAPK1) and
thrombospondin 1 (THBS1) were not identified as hub genes
based on network centrality and were therefore not selected for
RT-qPCR validation.
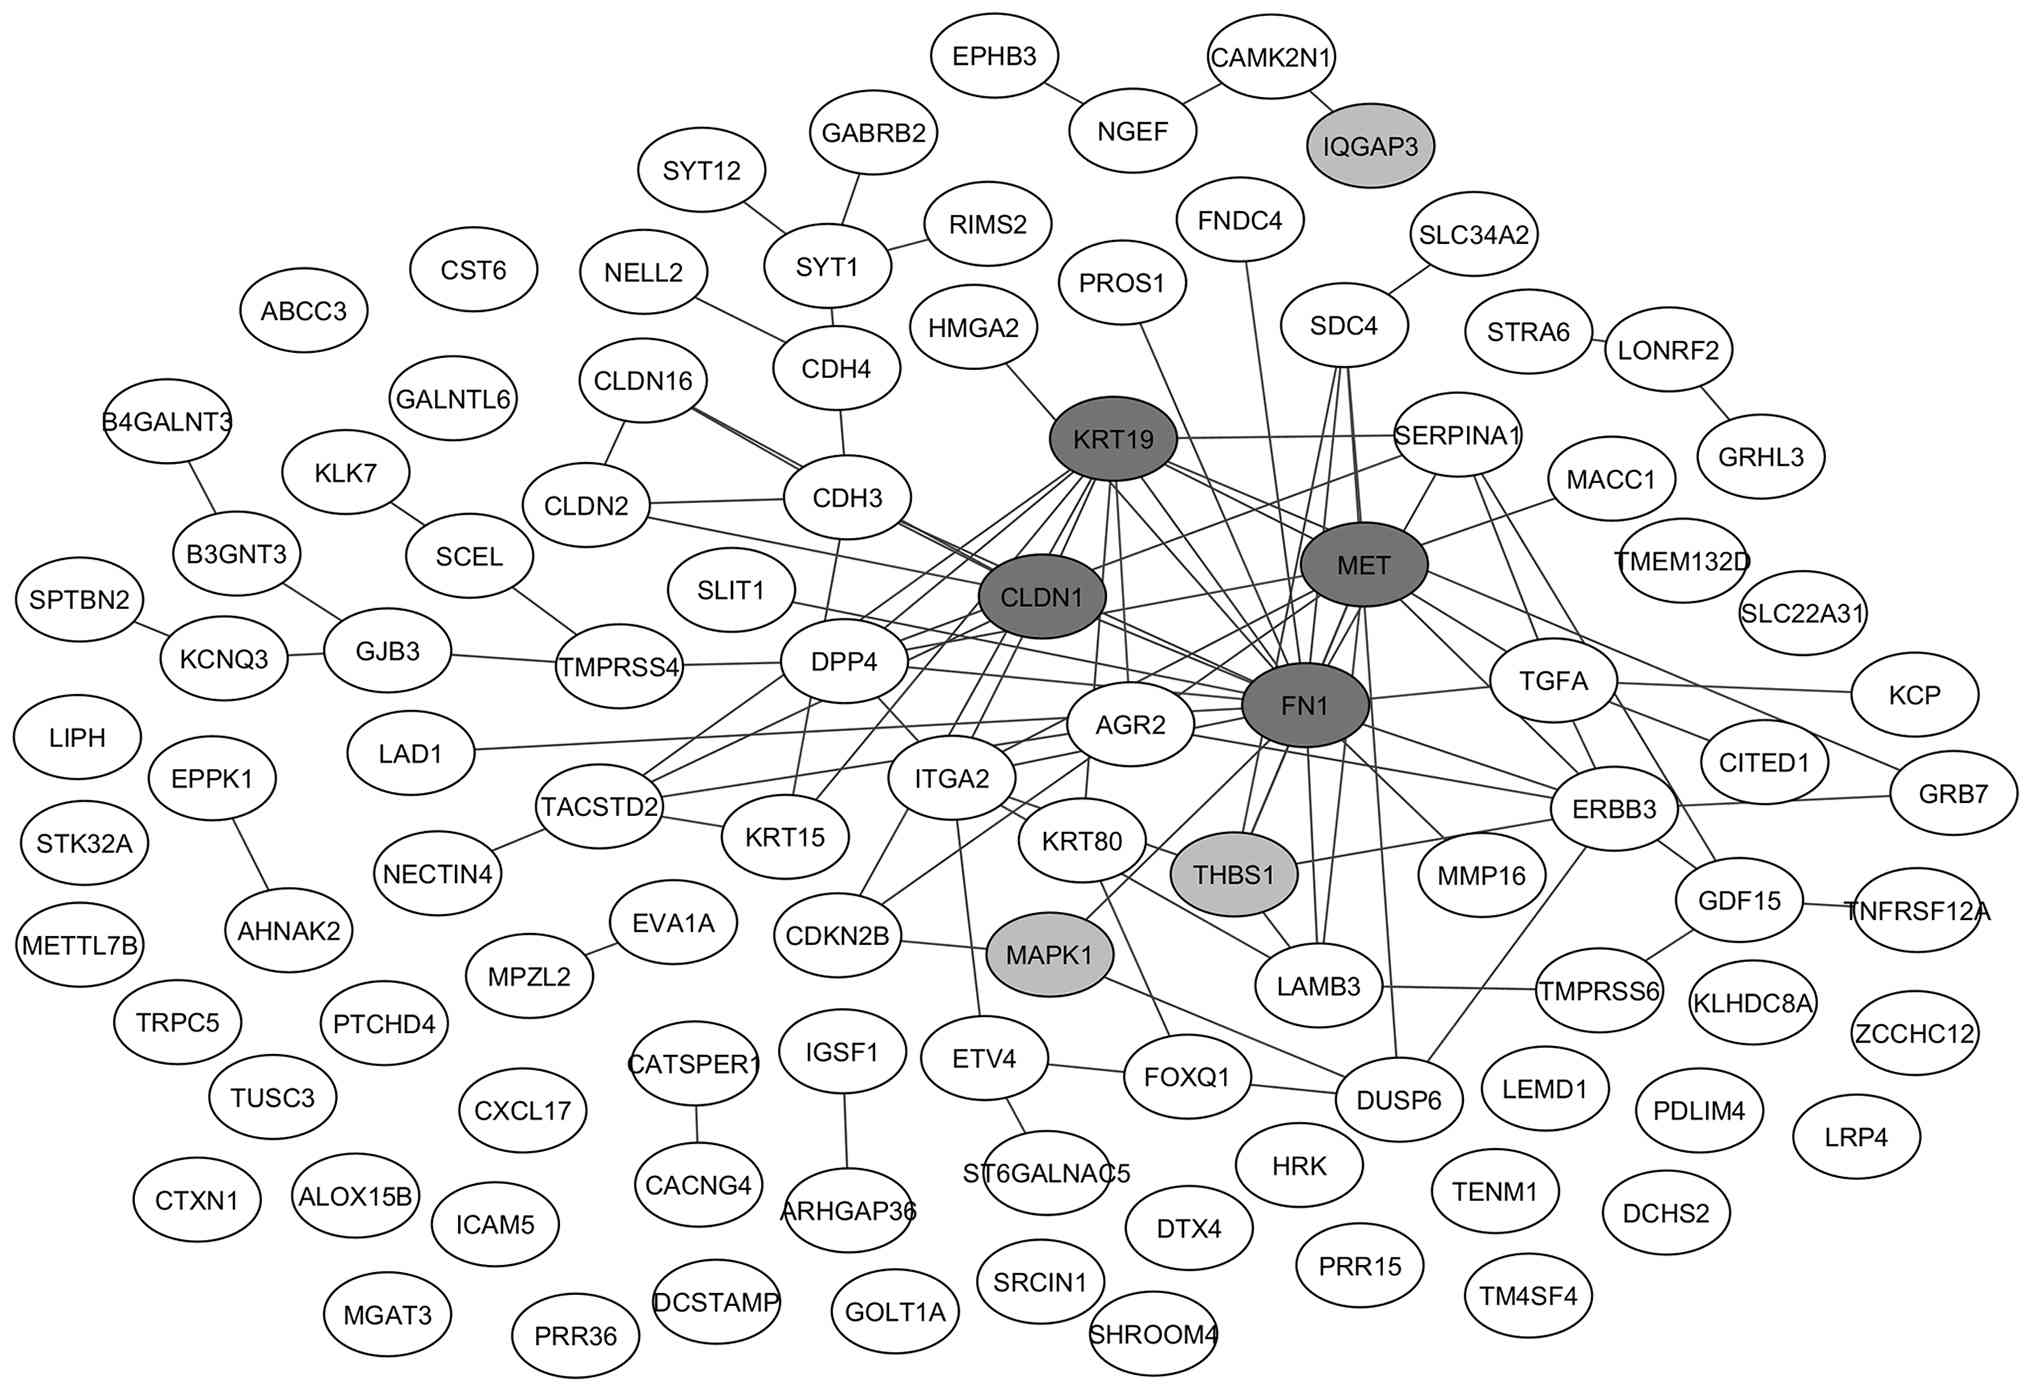 | Figure 4.PPI network of dysregulated genes.
The PPI network was constructed using the consensus list of 131
DEGs identified across all six datasets. The network was generated
using the STRING database (version 12.0) and visualized in
Cytoscape (version 3.10.2). Nodes represent proteins encoded by
DEGs and edges indicate predicted functional associations. All DEGs
were included in the network prior to the application of
centrality-based methods for hub gene identification. Downregulated
genes (IQGAP3, MAPK1 and THBS1) are shown in light
gray, while the 4 hub genes identified after centrality analysis
(FN1, MET, KRT19 and CLDN1) are shown in dark gray.
PPI, protein-protein interaction; DEGs, differentially expressed
genes; IQGAP3, IQ motif containing GTPase activating protein
3; MAPK1, mitogen-activated protein kinase 1; THBS1,
thrombospondin 1; FN1, fibronectin 1; MET, MET
proto-oncogene receptor tyrosine kinase; KRT19, keratin 19;
CLDN1, claudin 1. |
 | Table I.Top 10 hub genes ranked by six
different centrality algorithms calculated with the Cytohubba
plugin. |
Table I.
Top 10 hub genes ranked by six
different centrality algorithms calculated with the Cytohubba
plugin.
| Rank | MNC | Degree | Closeness | Radiality | MCC | EPC |
|---|
| 1 |
FN1a |
FN1a |
FN1a |
FN1a |
FN1a |
FN1a |
| 2 |
METa |
KRT19a |
KRT19a |
METa |
METa |
METa |
| 3 |
KRT19a |
METa |
METa |
KRT19a |
KRT19a |
KRT19a |
| 4 |
CLDN1a |
CLDN1a | ERBB3 | DPP4 | DPP4 | DPP4 |
| 5 | ITGA2 | ERBB3 |
CLDN1a |
CLDN1a | ITGA2 | ITGA2 |
| 6 | DPP4 | TGFA | DPP4 | SERPIN1 |
CLDN1a | ERBB3 |
| 7 | TGFA | ITGA2 | ITGA2 | ITGA2 | ERBB3 |
CLDN1a |
| 8 | TACSTD2 | DPP4 | SERPIN1 | ERBB3 | TGFA | SERPIN1 |
| 9 | SERPIN1 | CDH3 | CDH3 | CDH3 | CDH3 | TGFA |
| 10 | CDH3 | SERPIN1 | TGFA | TGFA | SERPIN1 | CDH3 |
Verification of hub gene expression by
RT-qPCR
To experimentally validate the computational
findings, an independent cohort of 86 patients was analyzed. Based
on cytological diagnosis according to the Bethesda system, 45 cases
were classified as BTN (Bethesda II) and 41 as PTC (Bethesda V–VI).
The clinicopathological characteristics of the study cohort are
summarized in Table II. No
significant differences were observed between the BTN and PTC
groups regarding comorbidities, including hypothyroidism,
hyperthyroidism, hypertension and diabetes mellitus (all
P>0.05).
| Table II.Clinicopathological characteristics
of the study cohort. |
Table II.
Clinicopathological characteristics
of the study cohort.
| Variable | BTN (n=45) | PTC (n=41) | Total (n=86) | P-value |
|---|
| Bethesda category,
n (%) |
|
|
| <0.001 |
| II | 45 (100.0) | 0 (0.0) | 45 (52.3) |
|
| V | 0 (0.0) | 6 (14.6) | 6 (7.0) |
|
| VI | 0 (0.0) | 35 (85.4) | 35 (40.7) |
|
| Sex, n (%) |
|
|
| 0.918 |
|
Women | 37 (82.2) | 35 (85.4) | 72 (83.7) |
|
|
Men | 8 (17.8) | 6 (14.6) | 14 (16.3) |
|
| Mean age ± SD
(range), years | 52.6±16.3
(26–83) | 45.6±18.5
(14–80) | 49.40±17.6 | 0.071 |
| Hypothyroidism, n
(%) |
|
|
| 0.174 |
|
Yes | 6 (13.3) | 11 (26.8) | 17 (19.8) |
|
| No | 39 (86.7) | 30 (73.2) | 69 (80.2) |
|
| Hyperthyroidism, n
(%) |
|
|
| 1.000 |
|
Yes | 0 (0.0) | 0 (0.0) | 0 (0.0) |
|
| No | 45 (100.0) | 45 (100.0) | 86 (100.0) |
|
| Hypertension, n
(%) |
|
|
| 0.264 |
|
Yes | 10 (22.2) | 5 (12.2) | 15 (17.4) |
|
| No | 35 (77.8) | 36 (87.8) | 71 (82.6) |
|
| Diabetes mellitus,
n (%) |
|
|
| 0.187 |
|
Yes | 1 (2.2) | 4 (9.8) | 5 (5.8) |
|
| No | 44 (97.8) | 37 (90.2) | 81 (94.2) |
|
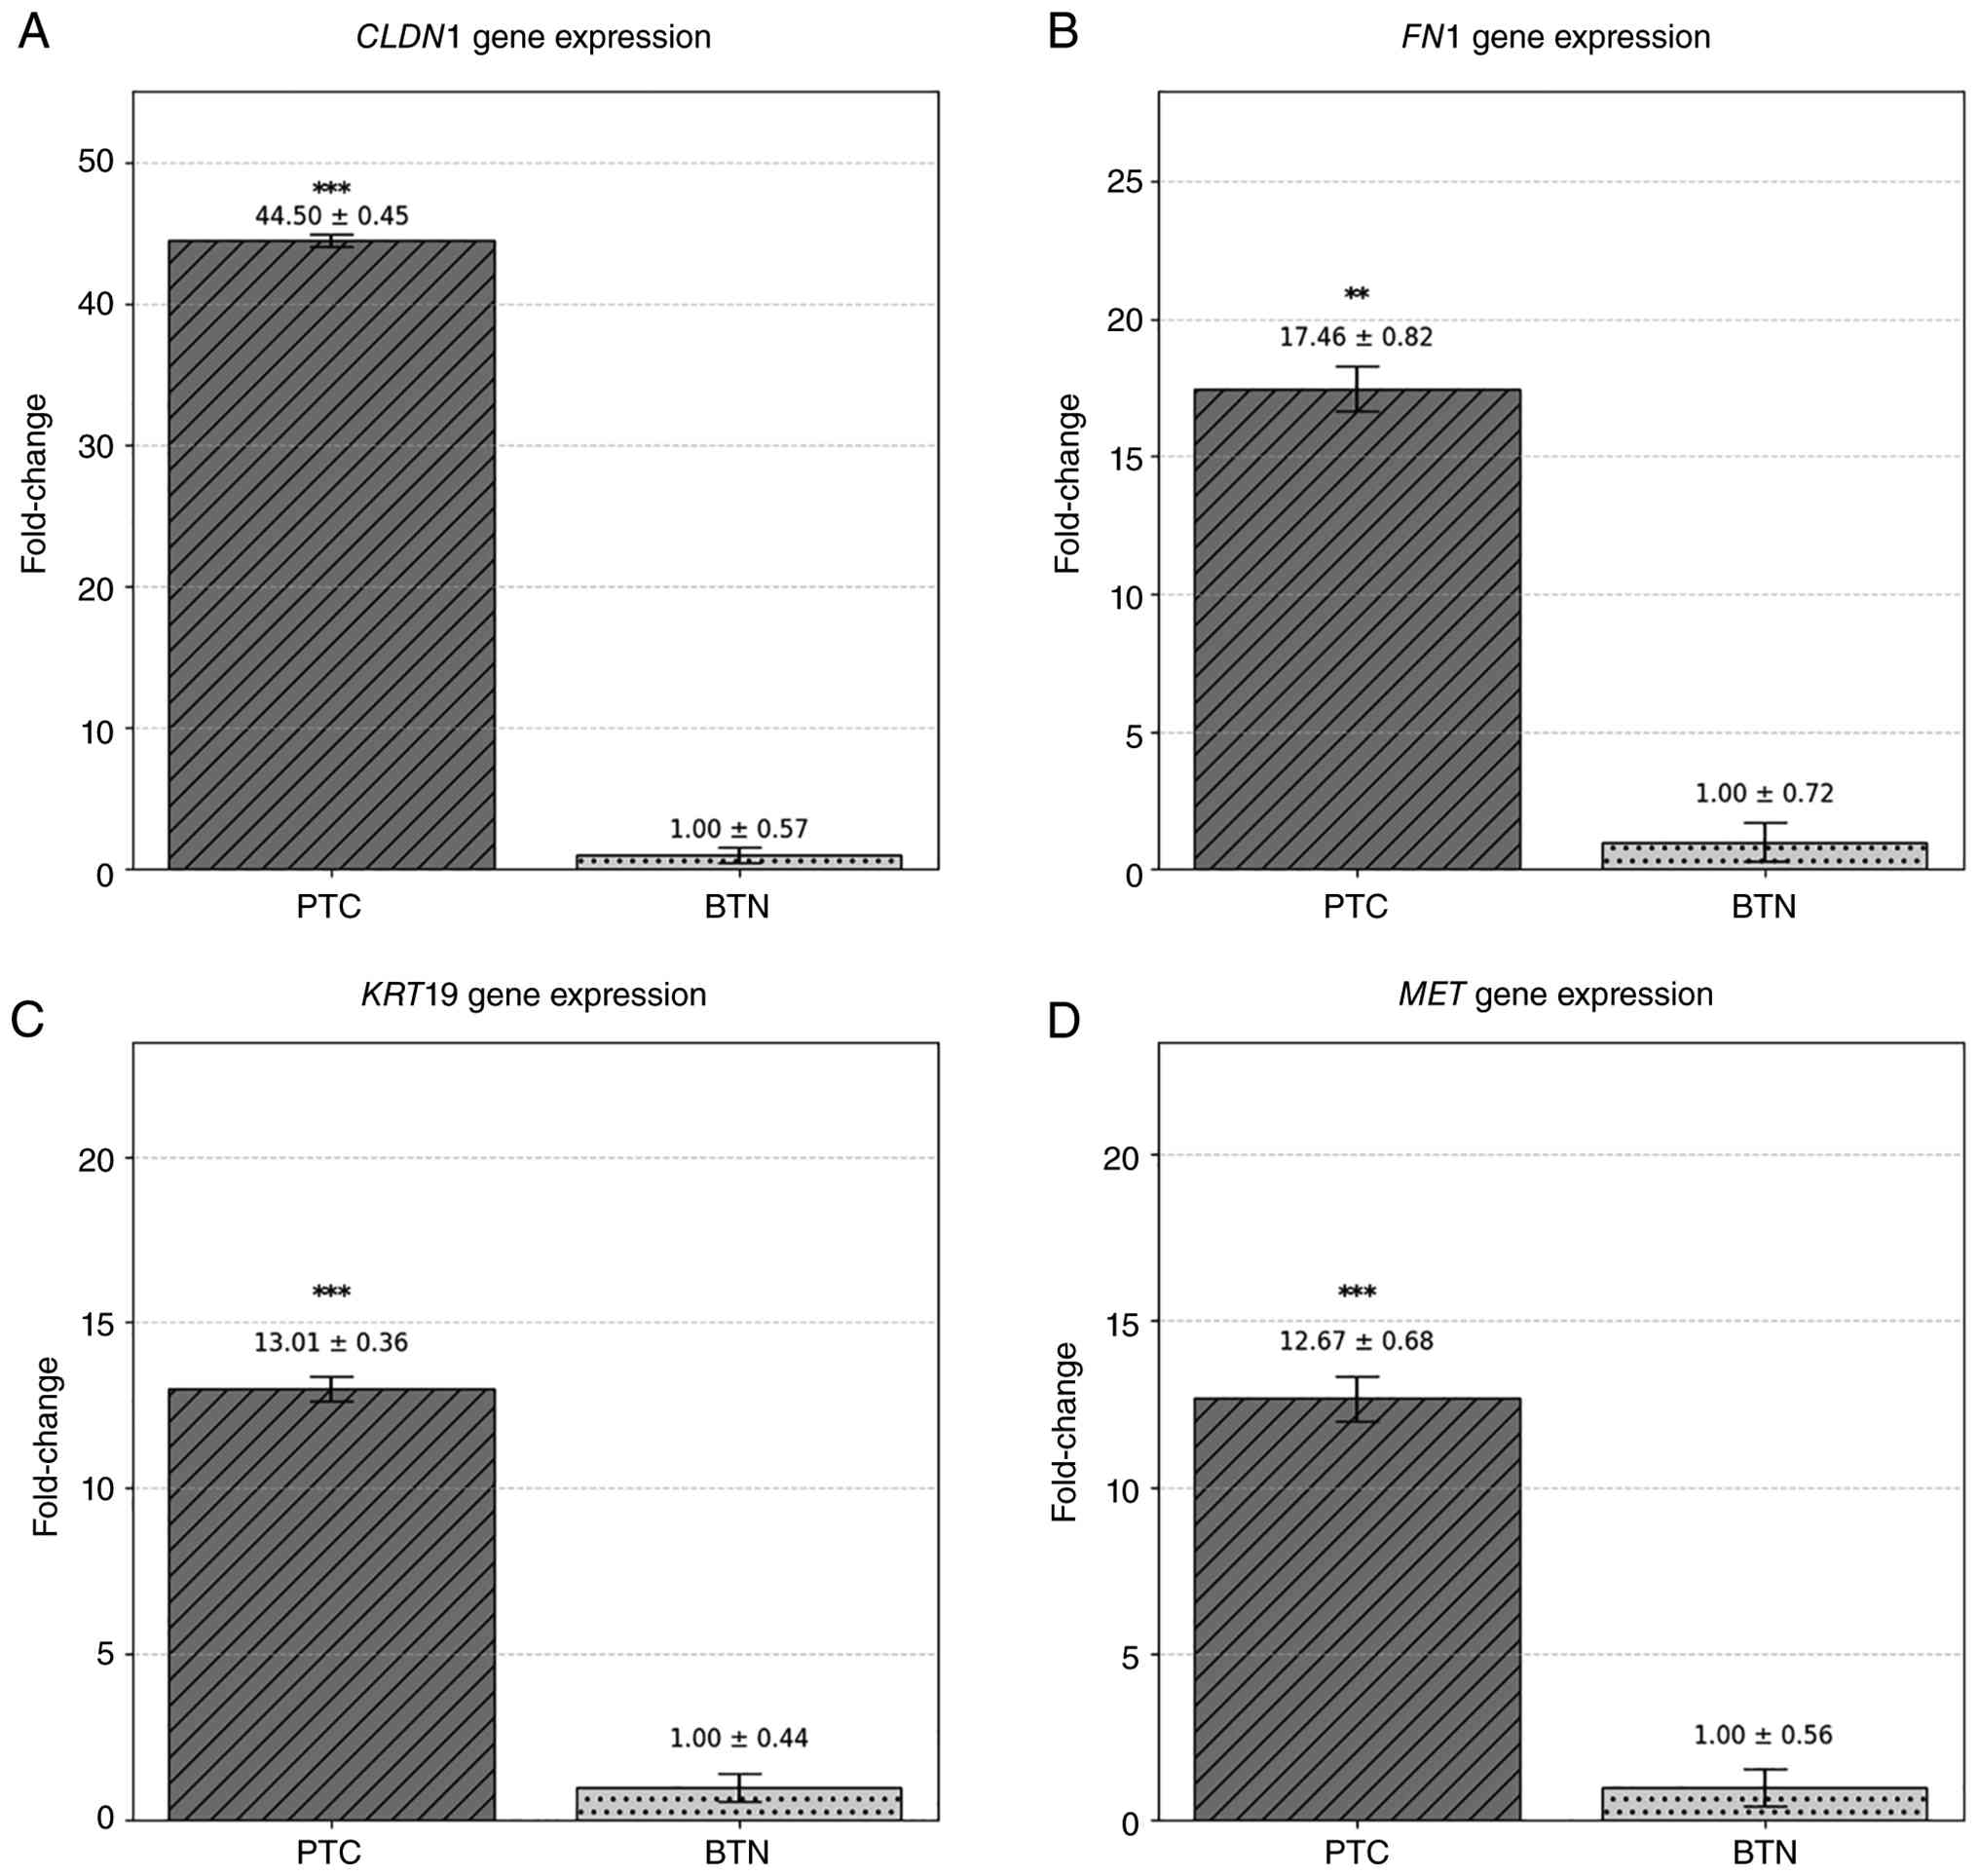
The mRNA expression levels of the 4 hub genes were
quantified by RT-qPCR in all samples. As shown in Fig. 6, all 4 genes displayed significant
upregulation in PTC compared with BTN samples (P<0.001).
Specifically, the average fold change was 44.50±0.45 for
CLDN1, 17.46±0.82 for FN1, 13.01±0.36 for
KRT19 and 12.67±0.67 for MET. These findings from the
current independent patient cohort were consistent with the in
silico results, supporting the consistent upregulation of
CLDN1, FN1, KRT19 and MET as a characteristic
molecular signature of PTC.
In silico validation of hub gene
expression at the protein level
To further evaluate whether the transcriptomic
alterations were reflected at the protein level, representative IHC
images were retrieved from the Human Protein Atlas. CLDN1, FN1,
KRT19 and MET exhibited stronger immunoreactivity in PTC
tissues than in normal thyroid tissue. Normal thyroid samples
showed low or basal staining, whereas tumor tissues displayed
increased protein expression (Fig.
7). These observations were consistent with the transcriptomic
expression patterns identified in the present study.
Discussion
The present study identified a reproducible set of
genes consistently dysregulated in PTC across multiple independent
transcriptomic datasets and verified their upregulation in
clinically derived thyroid nodule samples. Although alterations in
FN1, MET, KRT19 and CLDN1 have been previously
reported (8,18,35),
variability across independent cohorts has limited the
establishment of a stable molecular framework, highlighting the
need for cross-dataset validation to distinguish consistently
dysregulated genes from dataset-specific findings. In this context,
the novelty of the present study lies in the integrative analytical
approach, combining multi-dataset RNA-seq analysis with PPI
network-based prioritization and experimental validation in an
independent cohort of FNA samples. In contrast to previous studies,
which are often based on single datasets or limited microarray
platforms, the present study focused on genes consistently
dysregulated across independent cohorts. Earlier studies relying on
individual GEO datasets or small sample sizes (7,9,10) may
introduce cohort-specific variability and have reported
considerable differences in the number and identity of DEGs. In
addition, candidate genes are frequently selected based solely on
differential expression, without evaluating reproducibility across
datasets or incorporating robust network-level prioritization.
Although some studies include PPI analyses, these are often limited
to basic network construction without applying multiple centrality
measures (16,17). By integrating six independent
RNA-seq cohorts, the present study enhanced the robustness and
reproducibility of gene identification. The inclusion of
network-based prioritization using multiple centrality algorithms,
together with validation in an independent FNA cohort, provided a
more robust and translational framework, identifying genes that are
not only consistently dysregulated but also biologically and
clinically relevant in PTC.
Notably, in the present study, the validation of
FN1, MET, KRT19 and CLDN1 in a Mexican Mestizo
population, in comparison with datasets derived from different
populations, supports their cross-population consistency and
suggests that the alterations in the expression of these genes are
not population-specific. This aspect strengthens their potential
applicability in diverse clinical settings and reinforces their
relevance as stable molecular features of PTC. Collectively, these
findings support the presence of a consistent transcriptomic
pattern in PTC.
The intersection-based strategy, combined with the
stringent |log2FC|>2 threshold, likely resulted in a
conservative gene set, particularly refining the number of commonly
dysregulated genes identified. However, this approach was
intentionally adopted to prioritize robustness and cross-dataset
reproducibility, ensuring that the identified genes represent
consistent transcriptional alterations rather than dataset-specific
effects.
In the present study, 3 genes (IQGAP3, MAPK1
and THBS1) were consistently identified as being
downregulated; however, they were not prioritized for further
analysis due to their lower centrality within the PPI network.
Functionally, IQGAP3 is involved in cytoskeletal organization and
cell proliferation (36), MAPK1
participates in MAPK/extracellular signal-regulated kinase (ERK)
signaling pathways that regulate cell growth and differentiation
(37) and THBS1 is associated with
extracellular matrix interactions, angiogenesis and the regulation
of cell proliferation and apoptosis (38), suggesting a more peripheral role
within the interaction network identified in the present study.
Among the consistently upregulated genes identified,
FN1 emerged as a central component of the interaction
network. FN1 encodes fibronectin, an extracellular matrix
glycoprotein that mediates cell-matrix adhesion and contributes to
tissue stiffness (35,39). In PTC, its upregulation activates
signaling pathways that promote cell migration and invasion and has
been associated with activation of vascular endothelial growth
factor-related signaling, thereby increasing the risk of lymph node
metastasis (40). FN1 contributes
to extracellular matrix remodeling and cell-matrix adhesion and
interacts with integrin receptors, activating downstream signaling
pathways such as focal adhesion kinase, phosphatidylinositol
3-kinase/protein kinase B (PI3K/AKT) and MAPK/ERK, which are
associated with proliferation, survival and migration (41). In addition, FN1 expression
has been reported to be regulated by pathways such as TGF-β
signaling, linking extracellular matrix remodeling with epithelial
plasticity in thyroid cancer (42).
FN1 upregulation has been associated with aggressive
clinicopathological features, including lymph node metastasis and
extrathyroidal extension. Mechanistically, FN1-integrin
interactions, particularly involving αv-containing integrins, have
been shown to promote tumor cell proliferation and migration,
supporting a functional role for FN1 in PTC progression (43).
MET encodes the hepatocyte growth factor
receptor c-Met, a receptor tyrosine kinase activated by hepatocyte
growth factor that transduces proliferative, migratory and
angiogenic signals (44,45) triggering signaling cascades,
including PI3K/AKT and MAPK/ERK, that promote proliferation,
survival and invasive behavior (46). MET activation has been shown
to enhance tumor cell proliferation and migration through ERK and
PI3K/AKT signaling pathways, and to cooperate with
integrin-mediated mechanisms, further supporting its role in PTC
progression (47).
Previous studies have shown that MET
upregulation in PTC may be associated with the BRAFV600E
mutation and a more aggressive phenotype, thus facilitating local
invasion and lymphatic spread (45,48).
KRT19 encodes a 40-kDa type I acidic keratin
protein, an intermediate filament protein that forms part of the
cytoskeletal scaffolding within epithelial cells, and thus is
involved in maintaining epithelial cell architecture and mechanical
stability and contributes to the structural integrity and
organization of epithelial cells (49). KRT19 upregulation has been
consistently reported in PTC and is associated with lymph node
metastasis and advanced tumor stage. Mechanistically, KRT19 has
been shown to promote tumor cell proliferation and migration
through epithelial-mesenchymal transition-related processes,
supporting its role in PTC progression (50).
These epithelial-mesenchymal transition-related
processes are functionally interconnected through extracellular
matrix-receptor interactions, junctional dynamics and growth factor
signaling pathways, which collectively regulate tumor cell
proliferation, invasion and epithelial plasticity in PTC. The
coordinated dysregulation of these extracellular, junctional,
cytoskeletal and signaling components suggests remodeling of
epithelial architecture characterized by altered adhesion dynamics,
structural reorganization and enhanced migratory capacity,
consistent with mechanisms underlying PTC progression.
CLDN1 encodes claudin-1, a tight junction
protein that plays a key role in maintaining intercellular adhesion
and regulates epithelial barrier integrity and polarity (51). Dysregulation of claudins can
compromise epithelial barrier integrity and promote tumor invasion
(52). A previous study
demonstrated that CLDN1 overexpression in thyroid cells can
enhance cellular migration and invasiveness (52). CLDN1 upregulation has been
reported and is associated with aggressive clinicopathological
features, including lymph node metastasis and invasive behavior in
PTC (53,54). Mechanistically, CLDN1 has been
linked to epithelial-mesenchymal transition-related processes and
activation of pathways such as TGF-β signaling, promoting tumor
cell proliferation, migration and invasion. In addition,
CLDN1 dysregulation has been associated with modulation of
the tumor immune microenvironment, including reduced
CD8+ T cell infiltration, further supporting its role in
PTC progression (54).
Several of the aforementioned hub genes have been
previously reported in other studies on PTC. A study that aimed to
elucidate the molecular mechanisms underlying PTC and to identify
potential biomarkers and therapeutic targets using microarray data,
identified 8 genes, including KRT19, FN1 and MET
(8). Another investigation
conducted in 2018 analyzed both public databases and institutional
samples to identify key genes and microRNAs (miRNAs/miRs)
associated with PTC progression, tumor stage and prognosis
(18). In that study, miR-204-5p
was identified as an important regulatory miRNA that could
negatively regulate target genes such as FN1 and
CLDN1, which were associated with tumor stage and prognosis,
respectively. Notably, gene expression validation was performed in
PTC samples and matched normal peritumoral tissues using RT-qPCR,
verifying the upregulation of these genes.
Particularly, FN1 has been consistently
reported to exhibit increased expression in PTC, consistent with
the results of the present study. However, those investigations
were limited to in silico validation based on publicly
available datasets such as TCGA and GEPIA (11,12,17).
Similarly, another study identified KRT19 and FN1 as
highly connected genes, with further analysis focusing on
FN1 due to its highest centrality value (35). In addition, IHC data from the Human
Protein Atlas analyzed in that study also confirmed significantly
elevated protein expression levels of FN1 and KRT19 in PTC tissues.
Furthermore, increased FN1 expression was strongly
associated with advanced pathological stage, higher tumor grade and
enhanced immune cell infiltration. In the present study, FN1
expression displayed a 17-fold increase in PTC compared with BTN.
Previous studies have similarly reported marked FN1
overexpression in PTC, although the magnitude of the reported fold
change varies across studies. For example, a study reported a
120-fold increase in FN1 expression in nine PTC samples and
paired peritumoral normal thyroid tissues using GAPDH as the
reference gene (18). The higher
fold change observed in that study may reflect differences in the
comparison group (adjacent normal thyroid tissue vs. BTN), sample
size and normalization strategy. Consistently, a TCGA analysis
revealed ~5,000 FN1 transcripts per million (TPM) in
classical PTC samples (n=358), compared with a markedly lower
FN1 expression level of ~0 TPM in normal thyroid tissue
(n=59) (11). Another TCGA-based
study reported a 12-fold increase in FN1 expression in PTC
compared with that in normal thyroid tissue (12). In another investigation analyzing
103 paired PTC tissue samples, a 4-fold increase in FN1 in
PTC compared with normal thyroid tissues was observed (35).
Regarding MET, the results of the present
study demonstrated a 12-fold increase in expression in PTC samples
relative to that in BTN samples. A previous study examining the
role of miR-3666 in the pathogenesis of PTC revealed an inverse
association between miR-3666 and MET expression in tumor
samples from 25 patients, analyzed by RT-qPCR, where downregulation
of miR-3666 coincided with MET upregulation (44). Further experiments using cell
culture models showed that enhanced miR-3666 expression inhibited
cell growth and proliferation. Furthermore, bioinformatics analysis
indicated that the 3′-untranslated region of MET mRNA was a
target of miR-3666, thus suggesting that this miRNA could suppress
MET expression by inhibiting its translation. Another study
analyzing PTC tissues from 93 patients, alongside
histopathologically confirmed normal thyroid tissues from 9
patients, also reported significantly elevated MET
expression in PTC, which was associated with an invasive phenotype
and lymphatic metastasis (45).
The upregulation of KRT19 and CLDN1
has also been previously reported in a cohort of 97 FNA samples
(55). The study described fold
changes comparable to those observed in the present study.
Specifically, KRT19 expression was found to be 11-fold
higher and CLDN1 41-fold higher in PTC, while in the present
study, KRT19 expression increased by ~13-fold and
CLDN1 by 44-fold compared with that in BTN. In another study
analyzing 5 paired PTC tissue samples, CLDN1 relative
expression was likewise elevated and associated with patient
prognosis (18).
A number of limitations should be considered when
interpreting the findings of the present study. The classification
of thyroid nodules was based on ultrasound-guided FNA cytology
according to the Bethesda System, without histopathological
confirmation. Although Bethesda categories II, V and VI are widely
used in clinical practice and are associated with low and high
risks of malignancy, respectively, cytological evaluation does not
provide the same level of diagnostic certainty as surgical
histopathology. This approach reflects real-world clinical
practice, where cytological classification is routinely used to
guide management decisions. Therefore, a residual risk of
misclassification, including potential false-positive or
false-negative cases, cannot be completely excluded. However, to
reduce this limitation, only cases with clearly defined cytological
categories were included, and all evaluations were performed by a
single experienced pathologist. Furthermore, the present study
focused on the identification and experimental validation of
reproducible hub genes rather than on the development of integrated
diagnostic signatures. While combinatorial gene expression models
may enhance diagnostic performance in clinical settings, this
represents a limitation of the present study, as such approaches
were not evaluated. Therefore, the findings reported within the
present study provide a foundation for future studies aimed at
assessing these strategies in larger and independently validated
cohorts. Further studies, including well-characterized cohorts with
histopathological confirmation and comprehensive clinical data are
required to validate these findings and to further explore their
potential clinical applicability.
Collectively, the findings of the present study
support the consistent dysregulation of FN1, MET, KRT19 and
CLDN1 in PTC across independent datasets and in clinically
derived samples. Rather than establishing causative roles, the
results of the present study identified these genes as robust
candidate markers associated with epithelial remodeling and
adhesion-related processes in PTC. Overall, the present integrative
transcriptomic expands the current understanding of molecular
alterations in PTC for future functional and prospective clinical
studies aimed at evaluating their diagnostic and biological
significance.
Supplementary Material
Supporting Data
Acknowledgements
Not applicable.
Funding
This study was supported by Sociedad Mexicana de Nutrición y
Endocrinología and Universidad Politécnica de Sinaloa.
Availability of data and materials
The data generated in the present study may be
requested from the corresponding author.
Authors' contributions
ARGQ and NGM conceived and designed the present
study, analyzed data and edited the manuscript, and performed
experiments, statistical analysis and original draft preparation.
ARO performed experiments and manuscript review and editing. KLMH
performed experiments. MAA, DCP, VGF and FLO contributed to the
methodology, validation of the analytical framework and
interpretation of the data. NGM, MAA and EAM contributed to study
conception and overall supervision, secured funding support, and
critically revised the manuscript. ARGQ, NGM, ARO, MAA, FLO, KLHM,
DCP, VGF and EAM confirm the authenticity of all the raw data. All
authors have read and approved the final manuscript.
Ethics approval and consent to
participate
All patients signed informed consent forms prior to
sample collection. Participants consented to the collection and use
of their clinical information and FNA biopsy specimens for research
purposes. The informed consent forms and study protocol were
reviewed and approved by the Polytechnic University of Sinaloa
Ethics and Research Committee (Mazatlán, México; approval no.
001-2022-CEI).
Patient consent for publication
Not applicable.
Competing interests
The authors declare that they have no competing
interests.
References
|
1
|
Forma A, Kłodnicka K, Pająk W, Flieger J,
Teresińska B, Januszewski J and Baj J: Thyroid cancer:
Epidemiology, classification, risk factors, diagnostic and
prognostic markers, and current treatment strategies. Int J Mol
Sci. 26:51732025. View Article : Google Scholar : PubMed/NCBI
|
|
2
|
Pusztaszeri MP, Auger M, Stelow EB, Yang
GCH, Sanchez MA and LiVolsi VA: Papillary Thyroid Carcinoma,
Variants, and Related Tumors. The Bethesda System for Reporting
Thyroid Cytopathology. Ali SZ and Cibas ES: Springer International
Publishing; Cham: pp. 119–156. 2018, View Article : Google Scholar
|
|
3
|
Abdullah MI, Junit SM, Ng KL, Jayapalan
JJ, Karikalan B and Hashim OH: Papillary thyroid cancer: Genetic
alterations and molecular biomarker investigations. Int J Med Sci.
16:450–460. 2019. View Article : Google Scholar : PubMed/NCBI
|
|
4
|
Metovic J, Cabutti F, Osella-Abate S,
Orlando G, Tampieri C, Napoli F, Maletta F, Daniele L, Volante M
and Papotti M: Clinical and pathological features and gene
expression profiles of clinically aggressive papillary thyroid
carcinomas. Endocr Pathol. 34:298–310. 2023. View Article : Google Scholar : PubMed/NCBI
|
|
5
|
Ringel MD, Sosa JA, Baloch Z, Bischoff L,
Bloom G, Brent GA, Brock PL, Chou R, Flavell RR, Goldner W, et al:
2025 American thyroid association management guidelines for adult
patients with differentiated thyroid cancer. Thyroid. 35:841–985.
2025. View Article : Google Scholar : PubMed/NCBI
|
|
6
|
Tsakiroglou M, Evans A and Pirmohamed M:
Leveraging transcriptomics for precision diagnosis: Lessons learned
from cancer and sepsis. Front Genet. 14:11003522023. View Article : Google Scholar : PubMed/NCBI
|
|
7
|
Zhu W, Li C and Ai Z: Candidate agents for
papillary thyroid cancer identified by gene expression analysis.
Pathol Oncol Res. 19:597–604. 2013. View Article : Google Scholar : PubMed/NCBI
|
|
8
|
Qu T, Li YP, Li XH and Chen Y:
Identification of potential biomarkers and drugs for papillary
thyroid cancer based on gene expression profile analysis. Mol Med
Rep. 14:5041–5048. 2016. View Article : Google Scholar : PubMed/NCBI
|
|
9
|
Yu J, Mai W, Cui Y and Kong L: Key genes
and pathways predicted in papillary thyroid carcinoma based on
bioinformatics analysis. J Endocrinol Invest. 39:1285–1293. 2016.
View Article : Google Scholar : PubMed/NCBI
|
|
10
|
Ao Z, Chen Y, Lu JM, Shen J, Peng LP, Lin
X, Peng C, Zeng CP, Wang XF, Zhou R, et al: Identification of
potential functional genes in papillary thyroid cancer by
co-expression network analysis. Oncol Lett. 16:4871–4878.
2018.PubMed/NCBI
|
|
11
|
Zhang S, Wang Q, Han Q, Han H and Lu P:
Identification and analysis of genes associated with papillary
thyroid carcinoma by bioinformatics methods. Biosci Rep.
39:BSR201900832019. View Article : Google Scholar : PubMed/NCBI
|
|
12
|
Shen Y, Dong S, Liu J, Zhang L, Zhang J,
Zhou H and Dong W: Identification of potential biomarkers for
thyroid cancer using bioinformatics strategy: A study based on GEO
datasets. BioMed Res Int. 2020:97104212020. View Article : Google Scholar : PubMed/NCBI
|
|
13
|
Liu Y, Gao S, Jin Y, Yang Y, Tai J, Wang
S, Yang H, Chu P, Han S, Lu J, et al: Bioinformatics analysis to
screen key genes in papillary thyroid carcinoma. Oncol Lett.
19:195–204. 2019.PubMed/NCBI
|
|
14
|
Fan R, Dong L, Li P, Wang X and Chen X:
Integrated bioinformatics analysis and screening of hub genes in
papillary thyroid carcinoma. PLoS One. 16:e02519622021. View Article : Google Scholar : PubMed/NCBI
|
|
15
|
Liao M, Wang Z, Yao J, Xing H, Hao Y and
Qiu B: Identification of potential biomarkers for papillary thyroid
carcinoma by comprehensive bioinformatics analysis. Mol Cell
Biochem. 478:2111–2123. 2023. View Article : Google Scholar : PubMed/NCBI
|
|
16
|
Han J, Chen M, Wang Y, Gong B, Zhuang T,
Liang L and Qiao H: Identification of biomarkers based on
differentially expressed genes in papillary thyroid carcinoma. Sci
Rep. 8:99122018. View Article : Google Scholar : PubMed/NCBI
|
|
17
|
Xue G, Lin X, Wu JF, Pei D, Wang DM, Zhang
J and Zhang WJ: Identification of key genes of papillary thyroid
carcinoma by integrated bioinformatics analysis. Biosci Rep.
40:BSR202015552020. View Article : Google Scholar : PubMed/NCBI
|
|
18
|
Qiu J, Zhang W, Zang C, Liu X, Liu F, Ge
R, Sun Y and Xia Q: Identification of key genes and miRNAs markers
of papillary thyroid cancer. Biol Res. 51:452018. View Article : Google Scholar : PubMed/NCBI
|
|
19
|
Barrett T, Wilhite SE, Ledoux P,
Evangelista C, Kim IF, Tomashevsky M, Marshall KA, Phillippy KH,
Sherman PM, Holko M, et al: NCBI GEO: Archive for functional
genomics data sets-update. Nucleic Acids Res. 41:D991–D995. 2012.
View Article : Google Scholar : PubMed/NCBI
|
|
20
|
Liu L, Zhao Q, Cheng C, Yi J, Sun H, Wang
Q, Quan W, Xue Y, Sun L, Cong X and Zhang Y: Analysis of bulk RNA
sequencing data reveals novel transcription factors associated with
immune infiltration among multiple cancers. Front Immunol.
12:6443502021. View Article : Google Scholar : PubMed/NCBI
|
|
21
|
Yang F, Lian M, Ma H, Feng L, Shen X, Chen
J and Fang J: Identification of key genes associated with papillary
thyroid microcarcinoma characteristics by integrating transcriptome
sequencing and weighted gene co-expression network analysis. Gene.
811:1460862022. View Article : Google Scholar : PubMed/NCBI
|
|
22
|
Lv C, Sun W, Huang J, Qin Y, Ji X and
Zhang H: Expression profiles of circular RNAs in human papillary
thyroid carcinoma based on RNA deep sequencing. Onco Targets Ther.
14:3821–3832. 2021. View Article : Google Scholar : PubMed/NCBI
|
|
23
|
Hu H, Chen Q, Zheng S, Du S, Ding S and
Lun Y: Transcriptome analysis revealed potential Neuro-Immune
interaction in papillary thyroid carcinoma tissues. Diseases.
11:92023. View Article : Google Scholar : PubMed/NCBI
|
|
24
|
He H, Liyanarachchi S, Li W, Comiskey DF
Jr, Yan P, Bundschuh R, Turkoglu AM, Brock P, Ringel MD and de la
Chapelle A: Transcriptome analysis discloses dysregulated genes in
normal appearing tumor-adjacent thyroid tissues from patients with
papillary thyroid carcinoma. Sci Rep. 11:141262021. View Article : Google Scholar : PubMed/NCBI
|
|
25
|
Love MI, Huber W and Anders S: Moderated
estimation of fold change and dispersion for RNA-seq data with
DESeq2. Genome Biol. 15:5502014. View Article : Google Scholar : PubMed/NCBI
|
|
26
|
Kanehisa M: KEGG: Kyoto encyclopedia of
genes and genomes. Nucleic Acids Res. 28:27–30. 2000. View Article : Google Scholar : PubMed/NCBI
|
|
27
|
Ashburner M, Ball CA, Blake JA, Botstein
D, Butler H, Cherry JM, Davis AP, Dolinski K, Dwight SS, Eppig JT,
et al: Gene ontology: Tool for the unification of biology. Nat
Genet. 25:25–29. 2000. View
Article : Google Scholar : PubMed/NCBI
|
|
28
|
Yu G, Wang LG, Han Y and He QY:
clusterProfiler: An R package for comparing biological themes among
gene clusters. OMICS. 16:284–287. 2012. View Article : Google Scholar : PubMed/NCBI
|
|
29
|
Szklarczyk D, Nastou K, Koutrouli M,
Kirsch R, Mehryary F, Hachilif R, Hu D, Peluso ME, Huang Q, Fang T,
et al: The STRING database in 2025: Protein networks with
directionality of regulation. Nucleic Acids Res. 53:D730–D737.
2025. View Article : Google Scholar : PubMed/NCBI
|
|
30
|
Shannon P, Markiel A, Ozier O, Baliga NS,
Wang JT, Ramage D, Amin N, Schwikowski B and Ideker T: Cytoscape: A
software environment for integrated models of biomolecular
interaction networks. Genome Res. 13:2498–2504. 2003. View Article : Google Scholar : PubMed/NCBI
|
|
31
|
Chin CH, Chen SH, Wu HH, Ho CW, Ko MT and
Lin CY: cytoHubba: Identifying hub objects and sub-networks from
complex interactome. BMC Syst Biol. 8 (Suppl 4):S112014. View Article : Google Scholar : PubMed/NCBI
|
|
32
|
Cibas ES and Ali SZ: The 2017 Bethesda
system for reporting thyroid cytopathology. Thyroid. 27:1341–1346.
2017. View Article : Google Scholar : PubMed/NCBI
|
|
33
|
Livak KJ and Schmittgen TD: Analysis of
relative gene expression data using real-time quantitative PCR and
the 2(−Delta Delta C(T)) method. Methods. 25:402–408. 2001.
View Article : Google Scholar : PubMed/NCBI
|
|
34
|
Thul PJ and Lindskog C: The human protein
atlas: A spatial map of the human proteome. Protein Sci.
27:233–244. 2018. View Article : Google Scholar : PubMed/NCBI
|
|
35
|
Pan H, Luo Z, Lin F, Zhang J, Xiong T,
Hong Y, Sun B and Yang Y: FN1, a reliable prognostic biomarker for
thyroid cancer, is associated with tumor immunity and an
unfavorable prognosis. Oncol Lett. 28:5102024. View Article : Google Scholar : PubMed/NCBI
|
|
36
|
Wei T and Lambert PF: Role of IQGAP1 in
carcinogenesis. Cancers (Basel). 13:39402021. View Article : Google Scholar : PubMed/NCBI
|
|
37
|
Wang J, Yang H, Si Y, Hu D, Yu Y, Zhang Y,
Gao M and Zhang H: Iodine promotes tumorigenesis of thyroid cancer
by suppressing Mir-422a and Up-Regulating MAPK1. Cell Physiol
Biochem. 43:1325–1336. 2017. View Article : Google Scholar : PubMed/NCBI
|
|
38
|
Li Z, He T, Xing Z, Zhu J, Wu W and Su A:
Inhibition of THBS1 axis contributes to the antitumor effect of
PA-MSHA in anaplastic thyroid cancer. Exp Cell Res. 444:1143732025.
View Article : Google Scholar : PubMed/NCBI
|
|
39
|
Zhang M and Zhang B: Extracellular matrix
stiffness: Mechanisms in tumor progression and therapeutic
potential in cancer. Exp Hematol Oncol. 14:542025. View Article : Google Scholar : PubMed/NCBI
|
|
40
|
Liu M, Chen P, Wei B, Tan HL, Zhao YX, Ai
L, Li N, Jiang YK, Lin J, Li SJ and Chang S: FN1 shapes the
behavior of papillary thyroid carcinoma through alternative
splicing of EDB region. Sci Rep. 15:3272025. View Article : Google Scholar : PubMed/NCBI
|
|
41
|
Ashok G, Miryala SK, Saju MT, Anbarasu A
and Ramaiah S: FN1 encoding fibronectin as a pivotal signaling gene
for therapeutic intervention against pancreatic cancer. Mol Genet
Genomics. 297:1565–1580. 2022. View Article : Google Scholar : PubMed/NCBI
|
|
42
|
Udinotti M, Siebolts U, Bauer M, Vaxevanis
C, Asiminas A, Lorenz K, Dierks C, Wickenhauser C and Seliger B:
Fibroblast activation protein (FAP)-mediated promotion of
metastasis via the FN1-TGFβ axis and immune suppression in
aggressive thyroid cancer. J Transl Med. 23:12842025. View Article : Google Scholar : PubMed/NCBI
|
|
43
|
Rocco D, Tortora A, Marotta V, Machado AM,
Selistre-de-Araújo HS and Vitale M: Integrin-fibronectin
interaction is a pivotal biological and clinical determinant in
papillary thyroid carcinoma. Endocr Relat Cancer. 32:e2501012025.
View Article : Google Scholar : PubMed/NCBI
|
|
44
|
Bu R, Uddin S, Ahmed M, Hussain AR,
Alsobhi S, Amin T, Al-Nuaim A, Al-Dayel F, Abubaker J, Bavi P and
Al-Kuraya KS: c-Met inhibitor synergizes with tumor necrosis
Factor-Related Apoptosis-induced ligand to induce papillary thyroid
carcinoma cell death. Mol Med. 18:167–177. 2012. View Article : Google Scholar : PubMed/NCBI
|
|
45
|
Johansson K, Stenman A, Paulsson JO, Wang
N, Ihre-Lundgren C, Zedenius J and Juhlin CC: Development of
metastatic poorly differentiated thyroid cancer from a
sub-centimeter papillary thyroid carcinoma in a young patient with
a germline MET mutation-association or random chance? Thyroid Res.
14:192021. View Article : Google Scholar : PubMed/NCBI
|
|
46
|
Pothula SP, Xu Z, Goldstein D, Pirola RC,
Wilson JS and Apte MV: Targeting HGF/c-MET Axis in Pancreatic
Cancer. Int J Mol Sci. 21:91702020. View Article : Google Scholar : PubMed/NCBI
|
|
47
|
Lan Y, Liu D, Liang B, Song X, Xie L, Peng
H, Guo H, Hong C, Weng X, Wei X, et al: ITGA3-MET interaction
promotes papillary thyroid cancer progression via ERK and PI3K/AKT
pathways. Ann Med. 57:24833792025. View Article : Google Scholar : PubMed/NCBI
|
|
48
|
Chen BK, Ohtsuki Y, Furihata M, Takeuchi
T, Iwata J, Liang SB and Sonobe H: Overexpression of c-Met protein
in human thyroid tumors correlated with lymph node metastasis and
clinicopathologic stage. Pathol Res Pract. 195:427–433. 1999.
View Article : Google Scholar : PubMed/NCBI
|
|
49
|
Menz A, Bauer R, Kluth M, Marie von Bargen
C, Gorbokon N, Viehweger F, Lennartz M, Völkl C, Fraune C, Uhlig R,
et al: Diagnostic and prognostic impact of cytokeratin 19
expression analysis in human tumors: A tissue microarray study of
13,172 tumors. Hum Pathol. 115:19–36. 2021. View Article : Google Scholar : PubMed/NCBI
|
|
50
|
Wang X, Xu X, Peng C, Qin Y, Gao T, Jing J
and Zhao H: BRAFV600E-induced KRT19 expression in thyroid cancer
promotes lymph node metastasis via EMT. Oncol Lett. 18:927–935.
2019.PubMed/NCBI
|
|
51
|
Bhat AA, Syed N, Therachiyil L, Nisar S,
Hashem S, Macha MA, Yadav SK, Krishnankutty R, Muralitharan S,
Al-Naemi H, et al: Claudin-1, A double-edged sword in cancer. Int J
Mol Sci. 21:5692020. View Article : Google Scholar : PubMed/NCBI
|
|
52
|
Borowczak J, Łaszczych D, Olejnik K,
Michalski J, Gutowska A, Kula M, Bator A, Sekielska-Domanowska M,
Makarewicz R, Marszałek A, et al: Tight junctions and cancer:
Targeting Claudin-1 and Claudin-4 in thyroid pathologies.
Pharmaceuticals. 17:13042024. View Article : Google Scholar : PubMed/NCBI
|
|
53
|
Ross-Orozco A, Gastelum-Quiroz AR,
Alvarez-Arrazola M, Luque-Ortega F, Martínez-Camberos A,
Morales-Hernandez K, Lopez-Herrera Y, Cairo F and García-Magallanes
N: Association between BRAFV600E mutation and gene expression of
CLDN1, TIMP1, and KRT19 in papillary thyroid cancer. Mol Cell
Endocrinol. 607:1126142025. View Article : Google Scholar : PubMed/NCBI
|
|
54
|
Wu J, Wang Y, Yan L and Dong Y: Expression
of CLDN1 and EGFR in PTC. Discov Oncol. 15:5622024. View Article : Google Scholar : PubMed/NCBI
|
|
55
|
Martínez-Camberos A, Alvarez-Arrazola M,
Arámbula-Meraz E, Romero-Quintana J, Luque-Ortega F, Romo-Martinez
E, Sánchez-Urbina R, Cedano-Prieto D, González-Castillo A and
García-Magallanes N: Dysregulation of KRT19, TIMP1, and CLDN1 gene
expression is associated with thyroid cancer. Biochem Biophys Res
Commun. 617:55–59. 2022. View Article : Google Scholar : PubMed/NCBI
|