Introduction
Globally, hepatocellular carcinoma (HCC) represents
the sixth most common type of cancer and the third leading cause of
cancer-related deaths (1). As the
primary histological subtype, HCC accounts for 85–90% of all liver
malignancies (2,3). Current standard therapeutic
interventions for HCC include surgical resection, liver
transplantation, radiofrequency ablation, transarterial
chemoembolization, hepatic arterial infusion chemotherapy and
targeted molecular therapies (such as sorafenib, lenvatinib,
regorafenib, and ramucirumab) (4).
However, as most patients are diagnosed at intermediate to advanced
stages, surgical options become impractical (5). Therefore, identification of biomarkers
for early diagnosis and therapeutic targets remains urgently
required.
Ferroptosis, first identified by Dixon in 2012
(6), is an emerging form of
programmed cell death distinct from apoptosis, necrosis and
autophagy. Ferroptosis is characterized by the iron-dependent
accumulation of reactive oxygen species (ROS) and lipid peroxides,
disrupting cellular redox homeostasis, and resulting in membrane
condensation and eventual rupture (7). This cell death pathway is induced by
metabolic intermediates and is strictly regulated by antioxidant
mechanisms such as glutathione (GSH) peroxidase 4 (GPX4) and
cystine/glutamate antiporter (8,9).
Previous evidence has indicated that ferroptosis participates in
numerous pathological processes, including cancer progression and
ischemia-reperfusion injury (8,10).
Moreover, it has been reported that ferroptosis inducers, alone or
combined with conventional anticancer therapies, can effectively
kill cancer cells (11–13), highlighting ferroptosis as a
potential therapeutic target.
Intratumoral heterogeneity and cellular diversity
within the tumor microenvironment (TME) currently present notable
obstacles to early cancer diagnosis and precision medicine
(14). This heterogeneity arises
from variations in genetic makeup, pathology, differentiation and
mutation profiles, reflecting tumor complexity and diversity
throughout disease progression (15). Advancements in single-cell
transcriptomics have provided deeper insights into tumor
development, enabling precise identification of tumor subtypes and
analysis of the TME (16,17). This approach helps elucidate
intratumoral heterogeneity, cellular interactions within the
microenvironment, predicts drug resistance, improves diagnostic
accuracy and informs personalized treatments (18).
Peroxiredoxin 1 (PRDX1), a notable member of the
PRDX family, functions as an antioxidant by eliminating
intracellular ROS, protecting cells from oxidative damage.
Moreover, PRDX1 and GPX4 maintain a close regulatory interaction in
cancer, serving as crucial antioxidant proteins to inhibit
ferroptosis and facilitate tumor development. For example,
knockdown of PRDX1 in colorectal cancer cells leads to decreased
GPX4 expression, elevated ROS accumulation and enhanced lipid
peroxidation, thus triggering ferroptotic cell death (19). In breast cancer, inducing PRDX1
liquid-liquid phase separation reduces its peroxidase activity,
disrupts ROS homeostasis, and promotes ferroptosis via lipid
peroxide accumulation mediated by the SLC7A11-GPX4 pathway
(20). These observations imply
that targeting PRDX1 alongside GPX4 inhibition could represent a
promising anticancer strategy.
The present study aimed to utilize single-cell
transcriptomics analysis to explore the expression profiles of
PRDX1 and GPX4 in HCC, and to investigate their potential roles in
ferroptosis regulation and the TME, thus providing theoretical
support for strategies targeting ferroptosis resistance in HCC
treatment.
Materials and methods
Bioinformatics online tools
The GEPIA2 database (http://gepia2.cancer-pku.cn) was employed to assess
differential expression levels of PRDX1 and GPX4 across several
cancer types. Specifically, under the ‘Expression Analysis’
section, the ‘Expression DIY’ feature and ‘Multiple Gene
Comparison’ option were selected. Target gene names (PRDX1 or GPX4)
were entered individually, with ‘Match TCGA normal data’ checked to
include normal tissue references. A list of 23 TCGA cancer
abbreviations (including LIHC and other solid tumors) were
specified, and expression profiles were generated by clicking the
‘Plot’ button. The prognostic values of PRDX1 and GPX4 in HCC were
analyzed using the 2022 version of the UALCAN database (https://ualcan.path.uab.edu/) (21,22).
Within ‘TCGA’ section, ‘TCGA Gene’ was selected, gene names
entered, and ‘Liver hepatocellular carcinoma’ chosen from the
dataset menu. Survival analysis for PRDX1 and GPX4 in LIHC was
performed using the UALCAN database. Kaplan-Meier survival curves
were generated to evaluate the prognostic value, and the
statistical significance of the difference between groups was
determined using the Log-rank test.
Analysis of PRDX1 and GPX4 expression
from The Cancer Genome Atlas (TCGA) and Gene Expression Omnibus
(GEO) databases
Transcriptomics RNA sequencing (RNA-seq) data of
tumor and corresponding normal liver tissues from patients with HCC
were obtained from TCGA-LIHC (Liver Hepatocellular Carcinoma)
cohort (https://portal.gdc.cancer.gov/projects/TCGA-LIHC),
with 50 paired tumor-normal samples included in the differential
expression analysis. Microarray-based gene expression profiles were
obtained from the GSE14520 dataset (https://www.ncbi.nlm.nih.gov/geo/query/acc.cgi?acc=GSE14520)
(23), and 212 matched
tumor-adjacent pairs (424 samples in total) were retained after
strict quality control to exclude samples without paired
counterparts or incomplete clinical annotations. R software
(version 4.5.0; The R Foundation) was employed to filter the data.
For TCGA-LIHC cohort, all primary HCC cases with available RNA-seq
gene expression data and paired adjacent non-tumor liver tissues
were included. Samples with non-HCC histology, those lacking
expression data or those with incomplete pathological annotations
were excluded. Genes with an expression level of <1 in more than
half of the samples were filtered out. For the analysis of PRDX1
and GPX4 expression, the data from 50 matched tumor-adjacent pairs
were extracted and differential expression was assessed using a
paired Student's t-test.
For the GSE14520 dataset, all primary HCC samples
and paired adjacent non-tumor samples with complete gene expression
profiles and clinical annotations were included; samples with
missing expression values or ambiguous labeling were excluded.
Differential expression levels of PRDX1 and GPX4 between tumor and
adjacent non-tumor tissues were assessed using the Wilcoxon
signed-rank test.
In both datasets, ‘upregulation’ was defined as a
significantly higher expression in tumor samples compared with
normal samples (two-sided P<0.05). As the analysis was
restricted to two pre-specified genes, no additional log2
fold-change cutoff or correction for multiple testing was
applied.
PRDX1 and GPX4 protein expression from
the Human Protein Atlas
Protein expression levels of PRDX1 and GPX4 in HCC
tissues were evaluated using the Human Protein Atlas database
(v25.0; http://www.proteinatlas.org). The key
words ‘liver’ and ‘cancer’ were employed for data retrieval. Under
‘Tissue’ or ‘Pathology’, ‘Liver’ was selected, and the condition
‘cancer’ was specified. Immunohistochemical images and staining
intensity scores from representative samples were compared: GPX4
[GPX4_normal: Female; age, 63 years; Liver; GPX4_tumor: Female;
age, 77 years; Liver] and PRDX1 [PRDX1_normal: Female; age, 29
years; Liver; PRDX1_tumor: Female; age, 58 years; Liver].
Cell culture conditions
Normal human THLE-2 hepatocytes [American Type
Culture Collection (ATCC) cat. no. CRL-2706] and human HCC Hep3B
cells (ATCC cat. no. HB-8064) were sourced from the ATCC. Human HCC
MHCC97-H (cat. no. SCSP-5092) and Huh-7 (cat. no. SCSP-526) cells
were sourced from the National Collection of Authenticated Cell
Cultures, Chinese Academy of Sciences. THLE-2 cells were cultured
in BEGM Bullet Kit medium (cat. no. CC-3170; Lonza Group, Ltd.),
which is the specific medium officially recommended by the
manufacturer for maintaining this normal liver epithelial cell
line, supplemented with 5 ng/ml epidermal growth factor (cat. no.
CC-4175; Lonza Group, Ltd.), 70 ng/ml phosphoethanolamine (cat. no.
P0503; MilliporeSigma) and 10% FBS (cat. no. 10099141; Gibco;
Thermo Fisher Scientific, Inc.). Hep3B cells were maintained in MEM
(cat. no. 11095080; Gibco; Thermo Fisher Scientific, Inc.)
containing 10% FBS and 1% penicillin-streptomycin. MHCC97-H and
Huh-7 cells were maintained in DMEM (cat. no. 11995065; Gibco;
Thermo Fisher Scientific, Inc.) containing 10% FBS and 1%
penicillin-streptomycin. All cells were cultured at 37°C in a
humidified incubator with 5% CO2.
Cell transfection
Hep3B cells were seeded at a density of
3×10⁵ cells per well in a 6-well plate, with 2 ml
culture medium added to each well. PRDX1 knockdown and GPX4
knockdown groups were set up separately and the dual-knockdown
group was generated by co-transfection of siRNA-PRDX1-1 and
siRNA-GPX4-1. The PRDX1 knockdown group included a negative control
(NC) group [small interfering (si)RNA-NC] and three siRNA
experimental groups targeting PRDX1 (siRNA-PRDX1-1, siRNA-PRDX1-2
and siRNA-PRDX1-3). The GPX4 knockdown group also included an NC
group (siRNA-NC) and three siRNA experimental groups targeting GPX4
(siRNA-GPX4-1, siRNA-GPX4-2 and siRNA-GPX4-3). The final
concentration of target siRNAs was 30 nM for each single-gene
knockdown group, and 60 nM in total for the dual-knockdown group
(30 nM each for siRNA-PRDX1-1 and siRNA-GPX4-1). To ensure the
comparability of biological effects, for the single-gene knockdown
groups, an equivalent amount of siRNA-NC was added to reach the
same 60 nM total siRNA concentration as the dual-knockdown group.
Preliminary experiments verified that 60 nM total siRNA did not
induce significant cytotoxicity in Hep3B cells. Transfections were
performed using Lipofectamine® 3000 Transfection Reagent
(cat. no. L3000015; Invitrogen; Thermo Fisher Scientific, Inc.)
according to the manufacturer's instructions. Cells were incubated
with the transfection mixture at 37°C for 6 h, after which the
medium was replaced with fresh complete culture medium. At 24 h
post-transfection, the knockdown efficiency of PRDX1 or GPX4 was
detected separately. All siRNA sequences are shown in Table I.
 | Table I.Sequences of siRNAs targeting PRDX1
and GPX4. |
Table I.
Sequences of siRNAs targeting PRDX1
and GPX4.
| siRNA Name | Sense sequence,
5′-3′ | Antisense sequence,
5′-3′ |
|---|
| siRNA-PRDX1-1 |
GAUGAGACUUUGAGACUAGUUTT |
AACUAGUCUCAAAGUCUCAUCTT |
| siRNA-PRDX1-2 |
CCAGAUGGUCAGUUUAAAGAUTT |
AUCUUUAAACUGACCAUCUGGTT |
| siRNA-PRDX1-3 |
GCUUUCAGUGAUAGGGCAGAATT |
UUCUGCCCUAUCACUGAAAGCTT |
| siRNA-GPX4-1 |
GCACAUGGUUAACCUGGACAATT |
UUGUCCAGGUUAACCAUGUGCTT |
| siRNA-GPX4-2 |
GUGGAUGAAGAUCCAACCCAATT |
UUGGGUUGGAUCUUCAUCCACTT |
| siRNA-GPX4-3 |
GUGAGGCAAGACCGAAGUAAATT |
UUUACUUCGGUCUUGCCUCACTT |
| siRNA-NC |
UUCUCCGAACGUGUCACGUTT |
ACGUGACACGUUCGGAGAATT |
Western blotting
THLE-2, Hep3B, Huh-7 and MHCC97-H cells were
cultured until they reached ~80% confluence in a 100-mm culture
dish, rinsed with PBS and subsequently lysed in 600 µl NP-40 buffer
(50 mM Tris-HCl, pH 7.4; 150 mM NaCl; 1% NP-40). Lysates were
vortexed vigorously for 15 sec, three times at 5-min intervals on
ice, then centrifuged at 12,000 × g for 30 min at 4°C. Protein
levels were quantified using a BCA protein assay kit (cat. no.
BB-3401; BestBio; www.bestbio.com.cn). For each sample, 50 µg protein
was mixed with 5X SDS-PAGE loading buffer and denatured at 95°C for
5 min. The proteins were then separated by SDS-PAGE on 12% gels and
transferred to methanol-activated PVDF membranes. The membranes
were blocked with 5% BSA (cat. no. SW3015; Beijing Solarbio Science
& Technology Co., Ltd.) for 1 h at ambient temperature, rinsed
three times with TBS-0.1% Tween, and incubated with antibodies
against PRDX1 (1:5,000; cat. no. 15816-1-AP; Proteintech Group,
Inc.) or GPX4 (1:500; cat. no. sc-166570; Santa Cruz Biotechnology,
Inc.) separately for 3 h at room temperature. After additional
washing, the membranes were incubated with HRP-conjugated secondary
antibodies (1:5,000; cat. nos. RGAR001 or RGAM001; Proteintech
Group, Inc.) for 1 h at room temperature. Detection was performed
using BeyoECL Star reagent (cat. no. P0018AS; Beyotime
Biotechnology) on a ChemiDoc MP Imaging System (cat. no. 1708280;
Bio-Rad Laboratories, Inc.), and protein expression was
semi-quantified with ImageJ software (version 1.53; National
Institutes of Health), normalized to β-actin (1:20,000; cat. no.
66009-1-Ig; Proteintech Group, Inc.). Data are presented as the
mean ± standard deviation from three independent biological
replicates.
Cell proliferation assay
After digestion, the transfected Hep3B cells in each
group were resuspended in complete culture medium. Hep3B cells were
seeded in a 96-well plate at a concentration of 4,000 cells/well in
100 µl culture medium (n=4 wells/group). After the cells adhered to
the wells, this time point was recorded as 0 h. At 0, 24 and 48 h,
10 µl Cell Counting Kit-8 reagent (cat. no. C0037; Beyotime
Biotechnology) was added to each well of Hep3B cells and incubated
at 37°C in a 5% CO2 incubator for 1 h. Subsequently, the
absorbance value was measured at a wavelength of 450 nm using an
enzyme-linked immunosorbent assay plate reader.
Measurement of malondialdehyde
(MDA)
The transfected Hep3B cells were lysed with cell
lysis buffer (cat. no. P0013; Beyotime Biotechnology) on ice, after
which, they were centrifuged at 10,000 × g for 10 min to obtain the
supernatant and the protein concentration was determined using a
BCA protein assay kit (cat. no. BB-3401; BestBio). Subsequently,
the MDA detection working solution was prepared by diluting 7.5 ml
TBA diluent, 2.5 ml TBA storage solution and 150 µl of butylated
hydroxytoluene, an antioxidant provided in the MDA assay kit (cat.
no. S0131M; Beyotime Biotechnology), and the standard was diluted
to 1, 2, 5, 10, 20 and 50 µM with distilled water. The
corresponding blanks, standards, and samples (0.1 ml) were added
into 1.5 ml microcentrifuge tubes, and then mixed with 0.2 ml of
MDA detection working solution. Afterwards, they were heated at
100°C for 15 min, cooled to room temperature and centrifuged at
1,000 × g for 10 min at room temperature. Supernatants (200 µl)
were then collected and the absorbance was measured in a 96-well
plate at a wavelength of 532 nm using a microplate reader Finally,
the MDA concentration of the samples were calculated based on the
standard curve and were converted to MDA content/unit protein based
on protein concentration.
Diagnostic evaluation of PRDX1 and
GPX4 in HCC
Transcriptomics and clinical data from TCGA-LIHC
cohort were downloaded. Receiver operating characteristic (ROC)
curves for PRDX1 and GPX4 were generated using the pROC package
(v1.19.0.1) (24), with ‘sample
type’ (tumor, 1; normal, 0) as the state variable and gene
expression level as the test variable. A combined predictive model
(PRDX1 + GPX4) was developed using a support vector machine (SVM;
implemented via the e1071 package (v1.7–14, http://CRAN.R-project.org/package=e1071) and caret
package (v6.0–94, http://CRAN.R-project.org/package=caret) and ROC
curves were plotted using the pROC package.
Single-cell transcriptomics
analysis
Data source and quality control
The single-cell transcriptomics dataset GSE149614
(25), containing 25,479 genes from
71,915 cells across 10 primary HCC tissues, 2 portal vein tumor
thrombus tissues, 1 metastatic lymph node and 8 normal liver
samples, was obtained from the GEO database. Quality control
analysis was performed using Seurat software version 5.1.0
(https://satijalab.org/seurat/),
excluding cells with mitochondrial content of >20%, <200
genes or >8,000 genes. Normalization was achieved using the
SCTransform method implemented in the Seurat R package (v5.1.0;
http://satijalab.org/seurat/).
Dimensionality reduction, clustering
and cell annotation
Principal component analysis (PCA) was performed
using the top 2,000 highly variable genes, followed by
visualization via Uniform Manifold Approximation and Projection
(UMAP), and cell clustering were all performed using the Seurat R
package (v5.1.0). Cells were clustered based on RNA shared nearest
neighbor (RNA_snn) distance with a resolution setting of 0.6.
Cell-type annotation was performed based on the canonical cell
lineage marker genes reported in the published literature (26). The identity of each cluster was
comprehensively determined by integrating the expression
distribution of marker genes in FeaturePlot, the expression level
and proportion in DotPlot (both visualized using the Seurat
package; v5.1.0), as well as the specific expression
characteristics of representative canonical markers. Cells with
consistent expression of multiple specific signature genes were
assigned to the corresponding cell type. Identified cell
populations included malignant cells (APOA2+,
ALB+, APOA1+, AMBP+,
APOH+ and TTR+), T cells (IL7R+,
CD2+ and CD3D+), B cells (MS4A1+,
BANK1+ and CD79A+), myeloid cells
(LYZ+, AIF1+ and HLA-DRA+),
endothelial cells (SPARC+, TM4SF1+ and
INSR+), fibroblasts (COL1A2+, FAP+
and ACTA2+), plasma cells (MZB1+,
IGLL5+ and SSR4+), mast cells
(TPSAB1+, TPSB2+ and CPA3+),
natural killer (NK) cells (GZMB+, KLRD1+ and
KLRF1+), plasmacytoid dendritic cells (pDCs;
JCHAIN+, TCF4+ and TCL1A+) and
cycling cells (TOP2A+ and MKI67+).
Analysis of malignant cell
subpopulations and pseudotime trajectory
To further explore the intratumoral heterogeneity
and dynamic developmental characteristics of HCC malignant cells,
malignant cell subpopulations were separately extracted from the
integrated single-cell dataset for secondary dimensionality
reduction and reclustering analysis using the Seurat R package
(v5.1.0). Specifically, the top 2,000 highly variable genes were
selected to perform PCA, and the top 15 principal components were
adopted for subsequent UMAP dimensionality reduction. Based on the
RNA_snn algorithm, consistent and stable reclustering of malignant
cells was performed with a resolution parameter of 0.1.
Differentially expressed genes (|log2foldchange|>1; false
discovery rate, <0.05) were identified using the FindMarkers
function implemented in the Seurat R package (v5.1.0). Kyoto
Encyclopedia of Genes and Genomes (KEGG) pathway enrichment
analysis was performed using the clusterProfiler package (v4.14.6,
http://bioconductor.org/packages/clusterProfiler/). To
explore the dynamic differentiation trajectory of malignant cells,
the Monocle2 algorithm (v2.36.0, http://bioconductor.org/packages/monocle/) was applied
to reconstruct cell pseudotime developmental trajectories based on
the DDRTree dimensionality reduction algorithm. The variable genes
obtained from malignant cell reclustering were defined as ordering
genes to arrange cells in pseudo-temporal order according to their
differentiation status. To define the pseudotime origin, the root
state was set to the cell cluster exhibiting the highest expression
of hepatic progenitor markers and the lowest expression of mature
hepatocyte functional genes, thereby orienting the trajectory from
an undifferentiated to a more differentiated state. Finally, the
dynamic expression change patterns of key functional genes along
the pseudotime axis were systematically analyzed. Cell-cell
communication between PRDX1/GPX4-high expressing malignant cells
and other cell types was analyzed using the CellChat R package
(v2.2.0; http://github.com/sqjin/CellChat). Malignant cells
were stratified into high- and low-expression subgroups by median
PRDX1/GPX4 gene expression; communication probabilities were
computed, filtered with min.cell=10, and visualized via bubble
plots after merging subgroup CellChat objects.
Molecular association and concerted
effect of PRDX1/GPX4 on the ferroptosis regulatory network
A comprehensive list of ferroptosis-related genes,
including drivers (ACSL4, TP53, HMOX1, METTL3, NCOA4, ALOX15,
BECN1, TFRC and ATF3) and suppressors (NFE2L2, SLC7A11, SIRT1,
PRDX6, FTH1, FTO and DHODH) was sourced from the FerrDb database
(v2.0; http://www.zhounan.org/ferrdb/). Spearman rank
correlation analysis was performed to assess the expression
correlations between PRDX1/GPX4 and these ferroptosis-related
genes, and heatmaps depicting gene expression profiles and
correlation coefficients were generated using the pheatmap R
package (version 1.0.12; http://cran.r-project.org/package=pheatmap). Gene Set
Enrichment Analysis (GSEA) of ferroptosis, oxidative stress, lipid
peroxidation, and iron metabolism pathways was performed using gene
sets derived from the Molecular Signatures Database (MSigDB,
version 7.5.1; http://www.gsea-msigdb.org/gsea/msigdb/). Ferroptosis
suppressors scores were calculated based on suppressor gene
expression, and their associations with PRDX1/GPX4 expression
levels and overall survival (OS) were assessed. HCC patient samples
from TCGA-LIHC cohort were stratified into PRDX1-high/GPX4-high,
PRDX1-low/GPX4-low, PRDX1-high/GPX4-low and PRDX1-low/GPX4-high
groups according to median expression levels, comparing ROS, MDA,
GSH, iron scores and OS among groups. Protein-protein interaction
networks related to PRDX1/GPX4 regulation of ferroptosis were
developed using STRING (https://string-db.org/) and Cytoscape (https://cytoscape.org/).
Relationship between PRDX1/GPX4
expression and the immune microenvironment
The CIBERSORT algorithm (v1.03, http://cibersort.stanford.edu/)was used to
evaluate the abundance of immune cell infiltration in HCC samples
from TCGA-LIHC cohort. According to the median expression values of
PRDX1 and GPX4, all samples were divided into four groups based on
the median expression of PRDX1 (cut-off: 8.33) and GPX4 (cut-off:
8.81): Both_High, Both_Low, PRDX1_High_GPX4_Low and
PRDX1_Low_GPX4_High. The Kruskal-Wallis test was applied to compare
the differences in immune infiltration between different groups
(without post hoc test). Tumor microenvironment stromal and immune
scores were calculated using the ESTIMATE R package (v1.0.13;
http://bioinformatics.mdanderson.org/estimate/).
Immune score data of HCC from TCGA were downloaded from the TIMER3
website (http://timer.cistrome.org/), and
Spearman rank correlation scatter plots with PRDX1/GPX4 expression
were generated. Tumor mutation burden (TMB) and microsatellite
instability (MSI) data from TCGA-LIHC cohort were retrieved from
cBioPortal (https://www.cbioportal.org/) to evaluate associations
with PRDX1/GPX4 expression using Spearman rank correlation
analysis.
Statistical analysis
Data analysis was performed using R software
(v4.5.0) for bioinformatics cohorts and GraphPad Prism (v8.0.2;
Dotmatics) for cellular experimental statistics and visualization.
All cell-based assays were performed in three independent
biological replicates, and quantitative results are expressed as
mean ± standard deviation. The Shapiro-Wilk test was first
performed to assess the normality of all continuous variables. For
paired comparisons between tumor tissues and matched adjacent
normal tissues, the paired Student's t-test was applied for
normally distributed data (TCGA-LIHC cohort), while the Wilcoxon
signed-rank test was used for non-normally distributed data
(GSE14520 dataset). For comparisons between two independent groups,
the unpaired Student's t-test or the Wilcoxon rank-sum test was
selected according to the normality test results. Spearman's
correlation was used for correlation analysis. For comparisons
between multiple experimental groups and a single control group,
one-way analysis of variance (ANOVA) was applied followed by
Dunnett's t-test. For comparisons of grouped repeated measurement
data, two-way repeated measures ANOVA was performed, with the
Bonferroni method used for post hoc multiple comparisons. For all
other pairwise comparisons across multiple groups, one-way ANOVA
was conducted followed by Tukey's test. P<0.05 was considered to
indicate a statistically significant difference.
Results
Elevated expression of PRDX1 and GPX4
in HCC tissues and cells
Pan-cancer analysis revealed elevated expression
levels of PRDX1 and GPX4 across multiple cancer types (Fig. 1A and B). Furthermore, analysis of
TCGA cohort and GSE14520 dataset confirmed higher expression of
PRDX1 and GPX4 in HCC tissues (Fig. 1C
and D). Protein expression data from the Human Protein Atlas
also indicated that both proteins were upregulated in HCC tissues
(Fig. 1E). Western blot analysis
further confirmed increased protein expression of PRDX1 and GPX4 in
Hep3B, Huh-7 and MHCC97-H cells (Fig.
1F).
Clinical significance of PRDX1 and
GPX4 in HCC
ROC curve analyses yielded area under the curve
(AUC) values of 0.642 for PRDX1, 0.713 for GPX4, and 0.83 for the
combined PRDX1-GPX4 model in diagnosing HCC (Fig. 2A). Survival analyses demonstrated
shorter OS in patients with elevated PRDX1 or GPX4 expression
(Fig. 2B and C). Additionally, a
very weak positive correlation between PRDX1 and GPX4 expression
(ρ=0.21) was noted (Fig. 2D). PRDX1
expression showed a very weak positive association with sex
(ρ=0.23), whereas GPX4 expression was very weakly correlated with
age (ρ=0.12).
Cellular localization of PRDX1 and
GPX4 in the HCC microenvironment
A total of 11 distinct cellular subpopulations were
identified within the single-cell dataset GSE149614, comprising
malignant cells, T cells, B cells, myeloid cells, endothelial
cells, cancer-associated fibroblasts, plasma cells, mast cells, NK
cells, pDCs and cycling cells (Fig.
3A). PRDX1 and GPX4 were predominantly expressed in malignant
and myeloid cells but scarcely expressed in lymphocytes (Fig. 3B). Significant heterogeneity in
PRDX1/GPX4 expression and microenvironmental composition was
observed among patient samples (Fig.
3C).
Dynamic expression and functional
features of PRDX1 and GPX4 in malignant cell subpopulations
Through malignancy scoring and pseudotime trajectory
analysis, reclustered malignant cells were ordered along a
differentiation continuum and classified into three sequential
states (State 1-State 3). As illustrated in Fig. 4A, State 1 represented
early-differentiation stem-like cells with low malignancy, State 2
was the intermediate-differentiation transition subset, and State 3
corresponded to late-differentiation cells with high malignancy.
Dynamic expression profiles along the pseudotime axis demonstrated
that GPX4 was predominantly enriched in State 1 stem-like cells,
whereas PRDX1 was markedly upregulated in State 2
intermediate-differentiation subpopulations. KEGG pathway
enrichment showed genes upregulated in the high GPX4 expression
group were enriched in pathways related to metabolic reprogramming,
ferroptosis and viral infection, including ‘Biosynthesis of amino
acids’, ‘Ferroptosis’, ‘Glycolysis/Gluconeogenesis’ and
‘Virion-Hepatitis viruses’ (Fig.
4B). Furthermore, PRDX1-high expressing groups were enriched in
pathways associated with oxidative stress and GSH metabolism,
including ‘Glutathione metabolism’ and the ‘Pentose phosphate
pathway’ (Fig. 4B). Cell-cell
communication analyses indicated strong interactions between
PRDX1/GPX4 high-expressing malignant cells and endothelial cells, T
cells and fibroblasts via ligand-receptor pairs such as secreted
phosphoprotein 1 (SPP1) and angiopoietin-like 4 (ANGPTL4) (Fig. 4C).
Association and concerted role of
PRDX1 and GPX4 in ferroptosis regulation
Using the FerrDb database, 18 genes associated with
ferroptosis were identified (Fig.
5A). PRDX1 was positively correlated with the ferroptosis
suppressors GPX4, PRDX6, FTH1 and SLC7A11. By contrast, PRDX1 was
negatively correlated with the classical ferroptosis driver TP53,
as well as with SIRT1 (Fig. 5B),
which is generally considered to suppress ferroptosis in certain
contexts (27,28). Similarly, GPX4 was positively
correlated with suppressors PRDX1, PRDX6, FTH1 and NFE2L2, and
negatively correlated with drivers ALOX15, ACSL4 and TP53 (Fig. 5B). GSEA revealed that low GPX4
expression was enriched in iron metabolism and oxidative stress
pathways, whereas high PRDX1 expression was associated with
ferroptosis and oxidative stress pathways (Fig. 5C). The ferroptosis suppressors score
was higher in the PRDX1-high group (Fig. 5D). Combined analyses revealed higher
ROS, GSH and iron scores in the dual-high PRDX1/GPX4 group, whereas
the dual-low group displayed longer OS (Fig. 5E). Protein interaction network
analysis highlighted that PRDX1 and GPX4 suppress ferroptosis
through three central functional nodes: Glutathione Metabolism,
Lipid Peroxidation and Iron Metabolism. As shown in the topological
PPI network in Fig. 5F, PRDX1 and
GPX4 are closely associated with these three core hubs and occupy a
central position in the ferroptosis regulatory network. .
 | Figure 5.Association and concerted role of
PRDX1 and GPX4 in ferroptosis regulation. (A) Heatmap illustrating
expression of key ferroptosis-related genes based on GSE14520
dataset. The color scale represents row-scaled normalized gene
expression values (Z-score). (B) Spearman correlations between
PRDX1/GPX4 and key ferroptosis-associated genes based on GSE14520
dataset. (C) GSEA for PRDX1/GPX4 and related ferroptosis pathways
based on data from TCGA-LIHC cohort. (D) Relationship between
ferroptosis suppressor scores, PRDX1/GPX4 expression and patient
prognosis based on data from TCGA-LIHC cohort. (E) Associations
between PRDX1/GPX4 co-expression, metabolic markers and prognosis.
Boxplots (upper) show ROS, MDA, GSH and iron levels across four
PRDX1/GPX4 expression subgroups. Kaplan-Meier curves (lower) depict
overall survival differences among the four groups based on data
from TCGA-LIHC cohort (Log-rank P=0.017). (F) Integrated network
depicting the regulatory role of PRDX1/GPX4 in ferroptosis.
*P<0.05, **P<0.01, ***P<0.001, ****P<0.0001 GPX4, GSH
peroxidase 4; GSEA, Gene Set Enrichment Analysis; GSH, glutathione;
MDA, malondialdehyde; PRDX1, peroxiredoxin 1; ROS, reactive oxygen
species; TPM, transcripts per million. |
Relationship of PRDX1 and GPX4
expression with the HCC immune microenvironment
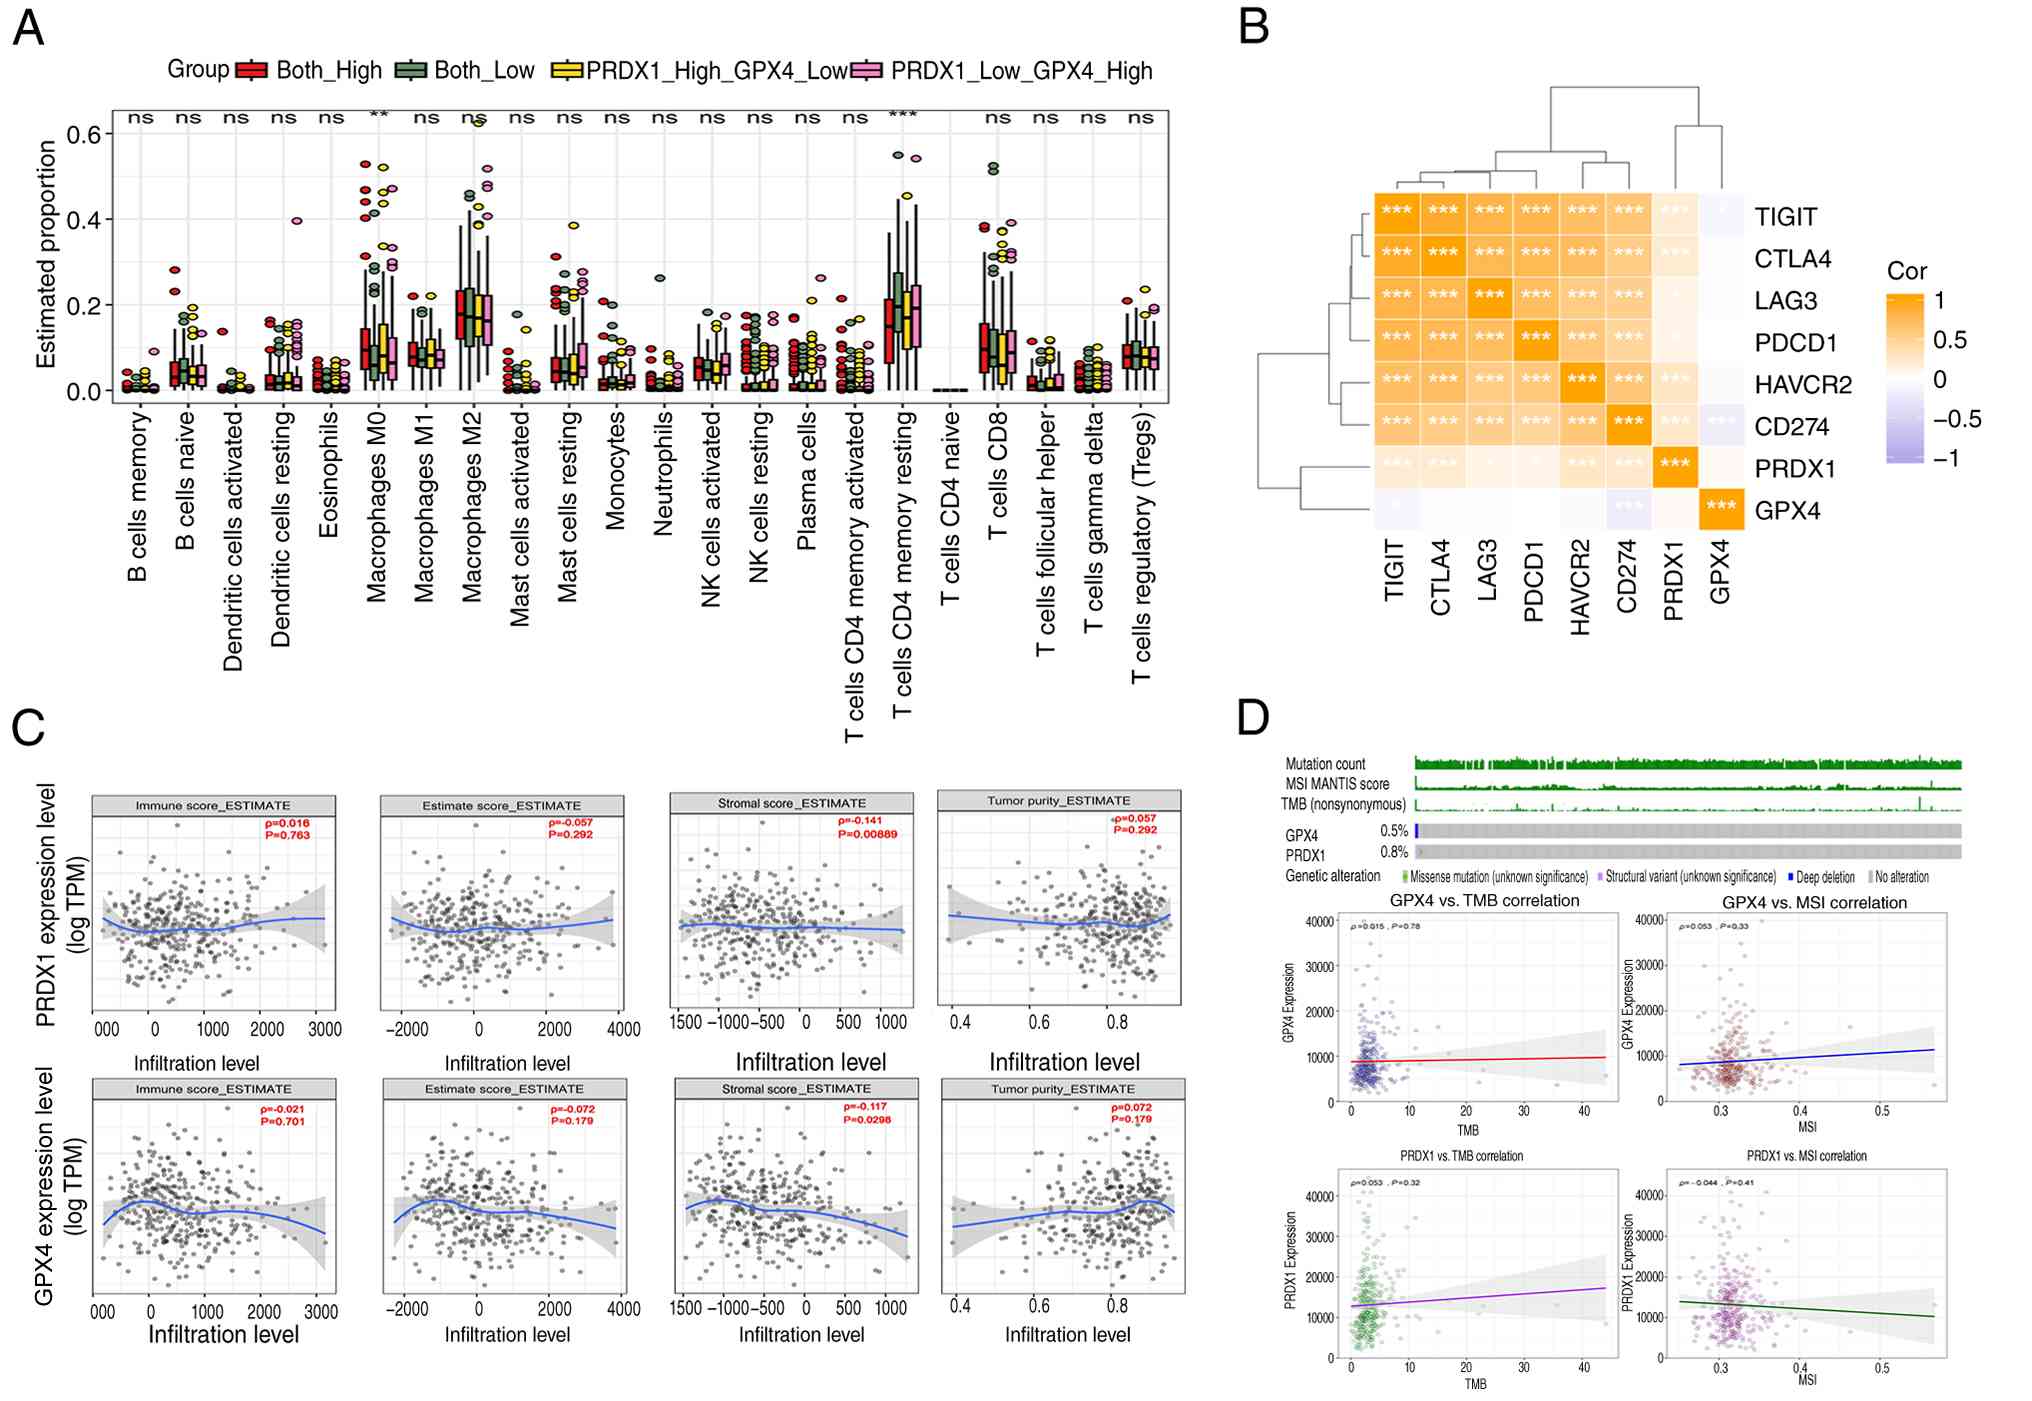
CIBERSORT analysis indicated increased M0
macrophages and reduced CD4+ T-cell infiltration in the
dual-high PRDX1/GPX4 expression group (Fig. 6A). PRDX1 expression was positively
correlated with immune checkpoints PDCD1, CD274, CTLA4, LAG3,
HAVCR2 and TIGIT, whereas GPX4 expression negatively correlated
with checkpoints CD274 and TIGIT (Fig.
6B). ESTIMATE analyses demonstrated very weak negative
correlations between PRDX1/GPX4 expression and stromal score
(Fig. 6C). Neither gene expression
was correlated with TMB or MSI (Fig.
6D).
Effect of knocking down PRDX1 and GPX4
on cell proliferation and lipid peroxidation (MDA) levels
To verify the results of bioinformatics analysis,
the current study designed and synthesized siRNAs targeting PRDX1
and GPX4. After transfection into Hep3B cells, the siRNAs with the
best knockdown efficiency (siRNA-PRDX1-1 and siRNA-GPX4-1) were
selected for subsequent experiments (Fig. 7A). HCC cell proliferation
experiments showed that the siRNA-PRDX-1, siRNA-GPX4-1 and
siRNA-PRDX-1/siRNA-GPX4-1 groups exhibited significantly inhibited
proliferation; however, the cell proliferation of the
siRNA-PRDX-1/siRNA-GPX4-1 group showed a partial increase compared
with the siRNA-PRDX-1 group (Fig.
7B). The MDA detection results showed that all three silencing
treatments significantly promoted the generation of intracellular
MDA, but the cumulative level of intracellular MDA in the
siRNA-PRDX-1/siRNA-GPX4-1 group was significantly lower than that
in the siRNA-GPX4-1 group (Fig.
7C).
Discussion
Ferroptosis has emerged as a distinct iron-dependent
programmed cell death mechanism characterized by lipid
peroxidation, which markedly impacts tumor initiation, progression
and therapeutic resistance (29–32).
The regulation of ferroptosis involves intricate mechanisms
operating at multiple cellular levels. A critical aspect of
ferroptosis is the disruption of equilibrium between the generation
and elimination of intracellular lipid ROS, leading to excessive
lipid peroxide accumulation and subsequent cell membrane rupture
(7,8). Zheng et al (33) demonstrated that donafenib in
combination with GSK-J4 synergistically elevated HMOX1 expression
and intracellular ferrous ion concentration, consequently promoting
ferroptosis in HCC cells. Another investigation reported that TRIM3
interacts directly with SLC7A11/xCT via its NHL domain,
facilitating K11-linked ubiquitination at residue K37, thus
triggering proteasomal degradation of SLC7A11; this mechanism
promotes ferroptosis and inhibits tumor growth in non-small cell
lung cancer (34). Yan et al
(35) further reported that TIPE
can suppress ferroptosis by interacting with MGST1-ALOX5, thereby
enhancing colorectal cancer cell proliferation.
The present study explored the cooperative
inhibitory roles of PRDX1 and GPX4 on ferroptosis in HCC
progression using single-cell transcriptomics analysis. Initially,
the expression levels of PRDX1 and GPX4 in HCC were confirmed
utilizing data from TCGA, GSE14520 and Human Protein Atlas
databases, and THLE-2, Hep3B, Huh-7 and MHCC97-H cell lines. The
findings indicated substantial upregulation of both PRDX1 and GPX4
in HCC, aligning with previous observations (36–38).
Subsequently, their diagnostic performance and prognostic
significance were evaluated. The AUC values of PRDX1 and GPX4 for
HCC diagnosis were 0.642 and 0.713, respectively, whereas the AUC
of the combined PRDX1-GPX4 model increased to 0.83, indicating
improved diagnostic performance. Survival analyses indicated
significantly reduced OS among patients exhibiting high expression
levels of PRDX1 or GPX4 compared with those with lower expression
levels, signifying worse prognostic outcomes. Thus, PRDX1 and GPX4
may potentially serve as valuable biomarkers for diagnosing and
predicting HCC outcomes; however, further validation through
multicenter studies is necessary. Additionally, PRDX1 showed a weak
positive association with patient sex, whereas GPX4 showed a weak
positive association with age.
Subsequently, dimensionality reduction and
clustering analyses were performed on the GSE149614 dataset, and 11
major cellular subpopulations were identified. Analysis of cellular
distribution revealed that PRDX1 and GPX4 were predominantly
expressed within malignant cells and myeloid populations, with
minimal expression observed in lymphocyte subsets such as T, NK and
B cells. Furthermore, marked variability in PRDX1/GPX4 expression
and the immune microenvironment composition was evident among
different individuals. These results imply that the
ferroptosis-inhibiting functions of PRDX1 and GPX4 primarily
operate within tumor cells rather than immune cells, aligning with
prior studies that demonstrated targeting this pathway
predominantly impacts cancer cells and modulates anti-tumor
immunity in the microenvironment (39,40).
Re-clustering of malignant cells then identified 11
distinct clusters. Combined malignancy scoring and pseudotime
analysis revealed that GPX4 was highly expressed during early
differentiation stages, indicating that highly malignant, stem-like
cells depend on GPX4 to resist ferroptosis. Conversely, PRDX1 was
prominently expressed during intermediate differentiation stages,
suggesting a protective role during metabolic transitions from
stem-cell to differentiated-cell metabolism. KEGG analysis
indicated that genes upregulated in GPX4-high expression cells were
associated with pathways associated with metabolic reprogramming,
ferroptosis and viral infection. Specifically, activation of
metabolic pathways, including glycolysis/gluconeogenesis and amino
acid biosynthesis, highlighted active metabolic processes supplying
energy and macromolecules necessary for rapid proliferation.
Additionally, enrichment of estrogen and hepatitis virus pathways
implied roles in hormonal regulation and virus-related
hepatocarcinogenesis. Genes upregulated in PRDX1-high expression
cells were primarily involved in redox balance and xenobiotic
metabolism pathways, notably ROS chemical carcinogenesis and GSH
metabolism. Additionally, enrichment analysis highlighted
activation of the pentose phosphate pathway, contributing NADPH
essential for GSH regeneration and bolstering the antioxidant
defense mechanisms (41,42) in cells exhibiting high PRDX1
expression. These results align with the protective role of PRDX1
during cellular metabolic transitions. Cell communication analysis
demonstrated robust interactions between PRDX1/GPX4-high expressing
malignant cells and endothelial cells, T cells and fibroblasts via
ligand-receptor pairs such as SPP1 and ANGPTL4.
Correlation analysis of 18 key ferroptosis-related
genes from the FerrDb database revealed PRDX1 was positively
correlated with the ferroptosis suppressors GPX4, PRDX6, FTH1 and
SLC7A11 (43–45). By contrast, PRDX1 was negatively
correlated with the classical ferroptosis driver TP53, as well as
with SIRT1, which is generally considered to suppress ferroptosis
in certain contexts (27,28). Similarly, GPX4 was positively
correlated with suppressors PRDX1, PRDX6, FTH1 and NFE2L2, and
negatively correlated with drivers ALOX15, ACSL4 and TP53 (46–48).
PRDX1-high expressing cells exhibited enrichment in ferroptosis and
oxidative stress pathways, indicating adaptive resistance under
ferroptosis pressure. Both genes jointly regulate a dynamic
ferroptosis balance within the TME. Notably, the PRDX1-high group
displayed increased ferroptosis resistance scores, suggesting PRDX1
confers ferroptosis resistance through a comprehensive defensive
network, potentially contributing to poor HCC prognosis. The
PRDX1/GPX4 dual-high expression group exhibited elevated ROS, GSH
and iron scores, whereas the dual-low expression group exhibited
prolonged OS, indicating that these genes maintain redox
homeostasis by constructing a multi-layered ferroptosis defense,
promoting HCC progression. Moreover, functional analyses suggested
that PRDX1/GPX4 primarily inhibit ferroptosis through regulating
GSH metabolism, lipid peroxidation and iron metabolism.
Collectively, these multi-layered findings suggested that PRDX1 and
GPX4 may act as critical modulators of ferroptosis resistance,
potentially facilitating HCC progression through a comprehensive
defensive network.
Subsequently, the association of PRDX1/GPX4
expression with immune microenvironment remodeling in HCC was
explored. CIBERSORT analysis indicated an increased number of M0
macrophages and decreased CD4+ T cells in the
PRDX1/GPX4-high expression group, highlighting their involvement in
immune microenvironment reshaping. Immune checkpoint analysis
illustrated distinct immune regulatory roles for PRDX1 and GPX4.
PRDX1 was positively correlated with multiple checkpoint molecules,
including PDCD1, CD274, CTLA4, LAG3, HAVCR2 and TIGIT, suggesting
involvement in immune evasion via multi-targeted T-cell exhaustion.
GPX4 was negatively correlated with CD274 and TIGIT, implying a
role in modulating checkpoint expression through oxidative
homeostasis maintenance. Both PRDX1 and GPX4 had weak negative
correlations with stromal scores and showed no relationship with
TMB or MSI, indicating their mediation of ferroptosis resistance
and immune evasion functions independently from genomic mutations
and primarily through functional mechanisms.
To validate the bioinformatics predictions,
siRNA-mediated knockdown of PRDX1 and GPX4 was employed in Hep3B
cells and subsequent functional analyses were performed. As
expected, single knockdown of either PRDX1 or GPX4 significantly
suppressed Hep3B cell proliferation and elevated intracellular MDA
levels, consistent with their established antioxidant and
tumor-promoting roles, thereby confirming the initial
bioinformatics findings. Notably, although the combined knockdown
of PRDX1 and GPX4 markedly inhibited proliferation, its activity
exhibited a partial recovery compared with the PRDX1 single
knockdown group, yet remained lower than that of the GPX4 single
knockdown group. To elucidate the underlying mechanism responsible
for this non-additive effect, intracellular MDA levels were
measured. Notably, the double knockdown group displayed
significantly lower MDA accumulation than the GPX4 single knockdown
group, indicating that PRDX1 silencing partially alleviates the
severe lipid peroxidation induced by GPX4 deficiency. Based on
these results, it may be hypothesized that under the intense lipid
peroxidation stress triggered by GPX4 loss, PRDX1 switches from its
canonical antioxidant role to a pro-oxidant mediator. This
functional shift may partially explain why the proliferative
activity of the double knockdown group was moderately restored
relative to the PRDX1 single knockdown group. Nevertheless, this
hypothesis is currently derived from phenotypic observations and
warrants further validation through dynamic oxidative stress
tracking, protein post-translational modification analyses and
targeted rescue experiments.
In conclusion, the present comprehensive
bioinformatics analysis, supported by in vitro functional
validation, revealed a previously underestimated co-expression
pattern of PRDX1 and GPX4 in malignant HCC cells, which is closely
related to ferroptosis evasion and an immunosuppressive TME.
Notably, the experimental results indicate that although GPX4
deficiency can severely induce lipid peroxidation, silencing PRDX1
at the same time can significantly alleviate this oxidative damage.
This suggests that under the stress of GPX4 deficiency, PRDX1 may
transition from its typical antioxidant role to a pro-oxidant
mediator. These findings broaden the understanding of the concerted
interaction between PRDX1 and GPX4 in reshaping the redox pattern
of HCC, and provide a theoretical basis for further exploration of
this concerted axis as a potential therapeutic breakthrough.
Acknowledgements
Not applicable.
Funding
The present study was funded by the Scientific Research Program
of Wuxi Health Commission (grant no. Q202415), the Clinical
Medicine Special Research Fund Project of Nantong University (Key
Project; grant no. 2024JZ049), the University Student Innovation
and Entrepreneurship Program (grant no. S202010439049), the Soft
Science Research Project of Wuxi Science and Technology Association
(grant no. KX-25-C309) and the Scientific Research and Development
Foundation of Kangda College of Nanjing Medical University (grant
no. KD2025KYJJ209).
Availability of data and materials
The data generated in the present study may be
requested from the corresponding author.
Authors' contributions
ZZ and RY were responsible for the conception and
design of the study. ZZ, HC, CQ, NY and ZL performed the data
analysis. ZZ, HC, CQ and RY drafted the manuscript. ZZ, HC and RY
confirm the authenticity of all the raw data. All authors read and
approved the final manuscript.
Ethics approval and consent to
participate
Not applicable.
Patient consent for publication
Not applicable.
Competing interests
The authors declare that they have no competing
interests.
References
|
1
|
Bray F, Laversanne M, Sung H, Ferlay J,
Siegel RL, Soerjomataram I and Jemal A: Global cancer statistics
2022: GLOBOCAN estimates of incidence and mortality worldwide for
36 cancers in 185 countries. CA Cancer J Clin. 74:229–263.
2024.PubMed/NCBI
|
|
2
|
Feng J, Li J, Wu L, Yu Q, Ji J, Wu J, Dai
W and Guo C: Emerging roles and the regulation of aerobic
glycolysis in hepatocellular carcinoma. J Exp Clin Cancer Res.
39:1262020. View Article : Google Scholar : PubMed/NCBI
|
|
3
|
Ringelhan M, Pfister D, O'Connor T,
Pikarsky E and Heikenwalder M: The immunology of hepatocellular
carcinoma. Nat Immunol. 19:222–232. 2018. View Article : Google Scholar : PubMed/NCBI
|
|
4
|
Singal AG, Kanwal F and Llovet JM: Global
trends in hepatocellular carcinoma epidemiology: Implications for
screening, prevention and therapy. Nat Rev Clin Oncol. 20:864–884.
2023. View Article : Google Scholar : PubMed/NCBI
|
|
5
|
Toh MR, Wong EYT, Wong SH, Ng AWT, Loo LH,
Chow PKH and Ngeow J: Global epidemiology and genetics of
hepatocellular carcinoma. Gastroenterology. 164:766–782. 2023.
View Article : Google Scholar : PubMed/NCBI
|
|
6
|
Dixon SJ, Lemberg KM, Lamprecht MR, Skouta
R, Zaitsev EM, Gleason CE, Patel DN, Bauer AJ, Cantley AM, Yang WS,
et al: Ferroptosis: An iron-dependent form of nonapoptotic cell
death. Cell. 149:1060–1072. 2012. View Article : Google Scholar : PubMed/NCBI
|
|
7
|
Dixon SJ and Olzmann JA: The cell biology
of ferroptosis. Nat Rev Mol Cell Biol. 25:424–442. 2024. View Article : Google Scholar : PubMed/NCBI
|
|
8
|
Liu J, Kang R and Tang D: Signaling
pathways and defense mechanisms of ferroptosis. FEBS J.
289:7038–7050. 2022. View Article : Google Scholar : PubMed/NCBI
|
|
9
|
Chen X, Yu C, Kang R, Kroemer G and Tang
D: Cellular degradation systems in ferroptosis. Cell Death Differ.
28:1135–1148. 2021. View Article : Google Scholar : PubMed/NCBI
|
|
10
|
Tang D, Kang R, Berghe TV, Vandenabeele P
and Kroemer G: The molecular machinery of regulated cell death.
Cell Res. 29:347–364. 2019. View Article : Google Scholar : PubMed/NCBI
|
|
11
|
Yamaguchi Y, Kasukabe T and Kumakura S:
Piperlongumine rapidly induces the death of human pancreatic cancer
cells mainly through the induction of ferroptosis. Int J Oncol.
52:1011–1022. 2018.PubMed/NCBI
|
|
12
|
Hao S, Yu J, He W, Huang Q, Zhao Y, Liang
B, Zhang S, Wen Z, Dong S, Rao J, et al: Cysteine dioxygenase 1
mediates erastin-induced ferroptosis in human gastric cancer cells.
Neoplasia. 19:1022–1032. 2017. View Article : Google Scholar : PubMed/NCBI
|
|
13
|
Alvarez SW, Sviderskiy VO, Terzi EM,
Papagiannakopoulos T, Moreira AL, Adams S, Sabatini DM, Birsoy K
and Possemato R: NFS1 undergoes positive selection in lung tumours
and protects cells from ferroptosis. Nature. 551:639–643. 2017.
View Article : Google Scholar : PubMed/NCBI
|
|
14
|
Hanahan D and Coussens LM: Accessories to
the crime: Functions of cells recruited to the tumor
microenvironment. Cancer Cell. 21:309–322. 2012. View Article : Google Scholar : PubMed/NCBI
|
|
15
|
Vitale I, Shema E, Loi S and Galluzzi L:
Intratumoral heterogeneity in cancer progression and response to
immunotherapy. Nat Med. 27:212–224. 2021. View Article : Google Scholar : PubMed/NCBI
|
|
16
|
Stuart T and Satija R: Integrative
single-cell analysis. Nat Rev Genet. 20:257–272. 2019. View Article : Google Scholar : PubMed/NCBI
|
|
17
|
Shi J, Zhang Y, Xu L and Wang F:
Single-cell transcriptomics reveals tumor microenvironment
remodeling in hepatocellular carcinoma with varying tumor subclonal
complexity. Front Genet. 15:14676822024. View Article : Google Scholar : PubMed/NCBI
|
|
18
|
Sun F, Li H, Sun D, Fu S, Gu L, Shao X,
Wang Q, Dong X, Duan B, Xing F, et al: Single-cell omics:
Experimental workflow, data analyses and applications. Sci China
Life Sci. 68:5–102. 2025. View Article : Google Scholar : PubMed/NCBI
|
|
19
|
Song Y, Wang X, Sun Y, Yu N, Tian Y, Han
J, Qu X and Yu X: PRDX1 inhibits ferroptosis by binding to Cullin-3
as a molecular chaperone in colorectal cancer. Int J Biol Sci.
20:5070–5086. 2024. View Article : Google Scholar : PubMed/NCBI
|
|
20
|
Fan X, Liu F, Wang X, Wang Y, Chen Y, Shi
C, Su X, Tan M, Yan Q, Peng J, et al: LncFASA promotes cancer
ferroptosis via modulating PRDX1 phase separation. Sci China Life
Sci. 67:488–503. 2024. View Article : Google Scholar : PubMed/NCBI
|
|
21
|
Chandrashekar DS, Karthikeyan SK, Korla
PK, Patel H, Shovon ARS, Athar M, Netto GJ, Qin ZS, Kumar S, Manne
U, et al: UALCAN: An update to the integrated cancer data analysis
platform. Neoplasia. 25:18–27. 2022. View Article : Google Scholar : PubMed/NCBI
|
|
22
|
Chandrashekar DS, Bashel B, Balasubramanya
SAH, Creighton CJ, Ponce-Rodriguez I, Chakravarthi BVSK and
Varambally S: UALCAN: A portal for facilitating tumor subgroup gene
expression and survival analyses. Neoplasia. 19:649–658. 2017.
View Article : Google Scholar : PubMed/NCBI
|
|
23
|
Roessler S, Jia HL, Budhu A, Forgues M, Ye
QH, Lee JS, Thorgeirsson SS, Sun Z, Tang ZY, Qin LX and Wang XW: A
unique metastasis gene signature enables prediction of tumor
relapse in early-stage hepatocellular carcinoma patients. Cancer
Res. 70:10202–10212. 2010. View Article : Google Scholar : PubMed/NCBI
|
|
24
|
Robin X, Turck N, Hainard A, Tiberti N,
Lisacek F, Sanchez JC and Müller M: pROC: An open-source package
for R and S+ to analyze and compare ROC curves. BMC Bioinformatics.
12:772011. View Article : Google Scholar : PubMed/NCBI
|
|
25
|
Lu Y, Yang A, Quan C, Pan Y, Zhang H, Li
Y, Gao C, Lu H, Wang X, Cao P, et al: A single-cell atlas of the
multicellular ecosystem of primary and metastatic hepatocellular
carcinoma. Nat Commun. 13:45942022. View Article : Google Scholar : PubMed/NCBI
|
|
26
|
Sun Y, Wu L, Zhong Y, Zhou K, Hou Y, Wang
Z, Zhang Z, Xie J, Wang C, Chen D, et al: Single-cell landscape of
the ecosystem in early-relapse hepatocellular carcinoma. Cell.
184:404–421.e16. 2021. View Article : Google Scholar : PubMed/NCBI
|
|
27
|
Zhang Y, Kong F, Li N, Tao L, Zhai J, Ma J
and Zhang S: Potential role of SIRT1 in cell ferroptosis. Front
Cell Dev Biol. 13:15252942025. View Article : Google Scholar : PubMed/NCBI
|
|
28
|
Zeng J, Guo J, Huang S, Cheng Y, Luo F, Xu
X, Chen R, Ma G and Wang Y: The roles of sirtuins in ferroptosis.
Front Physiol. 14:11312012023. View Article : Google Scholar : PubMed/NCBI
|
|
29
|
Li D, Zhang M, Liu J, Li Z and Ni B:
Potential therapies for HCC involving targeting the ferroptosis
pathway. Am J Cancer Res. 14:1446–1465. 2024. View Article : Google Scholar : PubMed/NCBI
|
|
30
|
Zhou Q, Meng Y, Li D, Yao L, Le J, Liu Y,
Sun Y, Zeng F, Chen X and Deng G: Ferroptosis in cancer: From
molecular mechanisms to therapeutic strategies. Signal Transduct
Target Ther. 9:552024. View Article : Google Scholar : PubMed/NCBI
|
|
31
|
Mou Y, Wang J, Wu J, He D, Zhang C, Duan C
and Li B: Ferroptosis, a new form of cell death: Opportunities and
challenges in cancer. J Hematol Oncol. 12:342019. View Article : Google Scholar : PubMed/NCBI
|
|
32
|
Zhang C, Liu X, Jin S, Chen Y and Guo R:
Ferroptosis in cancer therapy: A novel approach to reversing drug
resistance. Mol Cancer. 21:472022. View Article : Google Scholar : PubMed/NCBI
|
|
33
|
Zheng C, Zhang B, Li Y, Liu K, Wei W,
Liang S, Guo H, Ma K, Liu Y, Wang J and Liu L: Donafenib and GSK-J4
synergistically induce ferroptosis in liver cancer by upregulating
HMOX1 expression. Adv Sci (Weinh). 10:e22067982023. View Article : Google Scholar : PubMed/NCBI
|
|
34
|
Wang Z, Shen N, Wang Z, Yu L, Yang S, Wang
Y, Liu Y, Han G and Zhang Q: TRIM3 facilitates ferroptosis in
non-small cell lung cancer through promoting SLC7A11/xCT K11-linked
ubiquitination and degradation. Cell Death Differ. 31:53–64. 2024.
View Article : Google Scholar : PubMed/NCBI
|
|
35
|
Yan C, Yu S, Zhang J, Li Z, Lin Z, Zhang
S, Li H, Ye Z, Huang J, Ye Y and Zhuang G: TIPE inhibits
ferroptosis in colorectal cancer cells by regulating MGST1/ALOX5.
Mol Cancer Res. 23:143–154. 2025. View Article : Google Scholar : PubMed/NCBI
|
|
36
|
Zhang Z, Zhou P, Liu M and Pei B:
Expression and prognostic role of PRDX1 In Gastrointestinal
Cancers. J Cancer. 14:2895–2907. 2023. View Article : Google Scholar : PubMed/NCBI
|
|
37
|
Pan R, Zhao Z, Xu D, Li C and Xia Q: GPX4
transcriptionally promotes liver cancer metastasis via
GRHL3/PTEN/PI3K/AKT axis. Transl Res. 271:79–92. 2024. View Article : Google Scholar : PubMed/NCBI
|
|
38
|
Yu W, Li Y, Gao C, Li D, Chen L, Dai B,
Yang H, Han L, Deng Q and Bian X: MDH2 promotes hepatocellular
carcinoma growth through ferroptosis evasion via stabilizing GPX4.
Int J Mol Sci. 25:116042024. View Article : Google Scholar : PubMed/NCBI
|
|
39
|
Wiernicki B, Maschalidi S, Pinney J,
Adjemian S, Berghe TV, Ravichandran KS and Vandenabeele P: Cancer
cells dying from ferroptosis impede dendritic cell-mediated
anti-tumor immunity. Nat Commun. 13:36762022. View Article : Google Scholar : PubMed/NCBI
|
|
40
|
Caforio M, Iacovelli S, Locatelli F and
Folgiero V: Inducing ferroptosis to improve cancer therapy: A
promising tool for enhancing immunotherapy. J Exp Clin Cancer Res.
45:102026. View Article : Google Scholar : PubMed/NCBI
|
|
41
|
Circu ML and Aw TY: Glutathione and
modulation of cell apoptosis. Biochim Biophys Acta. 1823:1767–1777.
2012. View Article : Google Scholar : PubMed/NCBI
|
|
42
|
Stincone A, Prigione A, Cramer T, Wamelink
MMC, Campbell K, Cheung E, Olin-Sandoval V, Grüning NM, Krüger A,
Alam MT, et al: The return of metabolism: Biochemistry and
physiology of the pentose phosphate pathway. Biol Rev Camb Philos
Soc. 90:927–963. 2015. View Article : Google Scholar : PubMed/NCBI
|
|
43
|
Ito J, Nakamura T, Toyama T, Chen D,
Berndt C, Poschmann G, Mourão ASD, Doll S, Suzuki M, Zhang W, et
al: PRDX6 dictates ferroptosis sensitivity by directing cellular
selenium utilization. Mol Cell. 84:4629–4644. e92024. View Article : Google Scholar : PubMed/NCBI
|
|
44
|
Cheng X, Ge X, Zhang C, Yang X, Yu Z,
Zhang M, Cao W, Ni Q, Liu Y, He S and Yuan Y: Tryptophan suppresses
FTH1-driven ferritinophagy, a key correlate of prognosis in
hepatocellular carcinoma. Cell Prolif. 59:e700742026. View Article : Google Scholar : PubMed/NCBI
|
|
45
|
Koppula P, Zhuang L and Gan B: Cystine
transporter SLC7A11/xCT in cancer: ferroptosis, nutrient
dependency, and cancer therapy. Protein Cell. 12:599–620. 2021.
View Article : Google Scholar : PubMed/NCBI
|
|
46
|
Zhang S, Guan M, Ren T, Li N, Ding Q, Sun
D and Zhu H: Prexasertib exerts a synergistic effect on the
antitumor activity of Lenvatinib through ALOX15-mediated
ferroptosis in hepatocellular carcinoma. Int Immunopharmacol.
150:1142782025. View Article : Google Scholar : PubMed/NCBI
|
|
47
|
Jiang Y, Hui D, Pan Z, Yu Y, Liu L, Yu X,
Wu C and Sun M: Curcumin promotes ferroptosis in hepatocellular
carcinoma via upregulation of ACSL4. J Cancer Res Clin Oncol.
150:4292024. View Article : Google Scholar : PubMed/NCBI
|
|
48
|
Chen D, Chu B, Yang X, Liu Z, Jin Y, Kon
N, Rabadan R, Jiang X, Stockwell BR and Gu W: iPLA2beta-mediated
lipid detoxification controls p53-driven ferroptosis independent of
GPX4. Nat Commun. 12:36442021. View Article : Google Scholar : PubMed/NCBI
|
















![PRDX1 and GPX4 expression in HCC
tissues and cells. Expression of (A) PRDX1 and (B) GPX4 across
pan-cancer types, analyzed using GEPIA2 (based on TCGA cohort). The
color scale represents log2-transformed TPM values
[log2(TPM+1)]. PRDX1 and GPX4 expression levels in HCC
tissues from (C) TCGA cohort and (D) GSE14520 dataset. (E) Protein
expression levels of PRDX1 and GPX4 in HCC tissues in the Human
Protein Atlas database. (F) Comparison of PRDX1 and GPX4 protein
expression in THLE-2, Hep3B, Huh7 and MHCC97-H cell lines. Data are
presented as the mean ± SD from three independent biological
replicates. Scale bar, 100 µm. *P<0.05; **P<0.01;
***P<0.001; ****P<0.0001. GPX4, glutathione peroxidase 4;
HCC, hepatocellular carcinoma; PRDX1, peroxiredoxin 1; TCGA, The
Cancer Genome Atlas; TPM, transcripts per million.](/article_images/ol/32/5/ol-32-05-15886-g00.jpg)