Introduction
Lung cancer is the leading cause of cancer-related
mortality worldwide, with lung adenocarcinoma (LUAD) representing
the predominant histological subtype and accounting for ~35-40% of
all lung cancer cases (1–3). Despite advances in surgery,
chemotherapy, immunotherapy and targeted therapy, patients with
LUAD continue to have poor 5-year overall survival, particularly
those with advanced-stage disease (4). Therefore, a more comprehensive
understanding of the molecular mechanisms driving LUAD progression
is urgently needed to identify novel prognostic biomarkers and
therapeutic targets.
T lymphocytes (T cells) are central components of
adaptive immunity and play a critical role in tumour immune
surveillance. Following antigen stimulation, naïve T cells
differentiate into CD4+ helper T cells and
CD8+ cytotoxic T cells, which perform regulatory and
effector functions (5,6). However, persistent or excessive
antigen stimulation can lead to T-cell exhaustion, a state
characterized by impaired effector function and increased
expression of inhibitory immune checkpoints. T-cell exhaustion has
been associated with poor survival in patients with LUAD (7,8).
Therefore, elucidating T cell-related molecular signatures may
provide important insights into LUAD immunotherapy.
Ubiquitination is a critical post-translational
modification that regulates protein turnover, signal transduction
and regulated cell death (9,10).
Dysregulated ubiquitination contributes to LUAD tumourigenesis and
progression (11), and also
regulates key aspects of T-cell development and differentiation
(12,13). However, few studies have
simultaneously integrated T cell-related genes (TRGs) and
ubiquitination-related genes (URGs) for prognostic assessment in
LUAD.
To address this gap, TRGs and URGs obtained from
public databases were integrated in the present study and
machine-learning approaches were applied to construct a prognostic
model for LUAD. The model was externally validated in an
independent cohort and further verified by reverse
transcription-quantitative (RT-q)PCR using clinical LUAD tissue
samples. These findings provide a novel tool for risk
stratification and may offer valuable insights into personalized
treatment. The model may also assist clinicians in identifying
high-risk patients who may benefit from closer monitoring or
targeted therapeutic interventions.
Materials and methods
Data collection
Data for The Cancer Genome Atlas (TCGA)-LUAD cohort
were obtained from the University of California Santa Cruz Xena
platform (https://xenabrowser.net/datapages/) for clinical and
survival data. Raw count data were downloaded from the GDC data
portal (https://portal.gdc.cancer.gov/) using the STAR-Counts
workflow. The dataset included gene expression profiles from 515
LUAD tissue samples and 59 adjacent normal tissue samples, together
with survival, clinical and mutation data for the LUAD samples.
Tumour mutational burden (TMB) data for LUAD samples were retrieved
from TCGA database (https://tcga-data.nci.nih.gov/tcga/). In addition, the
GSE31210 dataset was downloaded from the Gene Expression Omnibus
(GEO) database (https://www.ncbi.nlm.nih.gov/geo/query/acc.cgi?acc=GSE31210),
maintained by the National Center for Biotechnology Information
(NCBI). This dataset contained gene expression profiles and
survival information for 226 LUAD tissue samples and was generated
using the GPL570 platform (Affymetrix Human Genome U133 Plus 2.0
Array). A total of 1,793 URGs were obtained from the iUUCD 2.0
database (integrated annotations for Ubiquitin and Ubiquitin-like
Conjugation Database; http://iuucd.biocuckoo.org/) (Table SI). TRGs were subsequently
identified through immune infiltration analysis and weighted gene
co-expression network analysis (WGCNA), as described further below.
All data were downloaded on 9th December 2024.
Differential expression analysis and
identification of differentially infiltrated T-cell subsets
The DESeq2 package (v. 1.42.0; http://bioconductor.org/packages/DESeq2/) was used to
identify differentially expressed genes (DEGs) between LUAD and
normal tissues in the TCGA-LUAD cohort. Raw count data were used as
input. DEGs were defined using the thresholds |log2 fold change
(FC)| >0.5 and adjusted P<0.05. Volcano plots were generated
using the ggplot2 package (v. 3.5.1; http://ggplot2.tidyverse.org) to visualise the DEG
results, with the 10 most upregulated and 10 most downregulated
genes labelled. The expression patterns of these 20 selected DEGs
were subsequently visualised using the pheatmap package (v. 1.0.12;
http://CRAN.R-project.org/package=pheatmap). To
identify T-cell subsets, the CIBERSORT algorithm (v. 0.1.0;
http://cibersort.stanford.edu/) was
applied with 1,000 permutations and relative mode enabled to
estimate the proportions of 22 immune cell types in TCGA-LUAD
samples. Only samples with a CIBERSORT P<0.05 were included in
subsequent immune infiltration analyses. The Wilcoxon rank-sum
test, performed using R software (v. 4.3.1; R Foundation for
Statistical Computing; http://www.r-project.org/), was then used to identify
T-cell subsets that differed significantly between LUAD and normal
samples (P<0.05).
WGCNA and identification of TRGs
WGCNA was performed using the TCGA-LUAD dataset to
identify TRGs. The WGCNA package [v. 1.7.1; Comprehensive R Archive
Network (CRAN), https://CRAN.R-project.org/package=WGCNA] was used,
with the differentially infiltrated T-cell subsets defined as
phenotypic traits. First, samples were hierarchically clustered to
identify and exclude potential outliers. Network topology analysis
was then performed using the pickSoftThreshold function to
determine the optimal soft-thresholding power (β) and assess the
scale-free topology fit index (R2). A gene co-expression
network was subsequently constructed. Gene modules were identified
using the dynamic tree-cutting algorithm, with a minimum module
size of 100 genes. Modules with similar expression profiles were
then merged based on the hierarchical clustering of the topological
overlap matrix, using a MEDissThres value of 0.4. Correlations
between the resulting modules and T-cell subsets were assessed
using Pearson correlation analysis with the psych package (v.
2.4.3; Comprehensive R Archive Network (CRAN); http://CRAN.R-project.org/package=psych). The
correlation coefficient was denoted as cor, and its absolute value
(|cor|) was used to indicate the strength of the correlation.
Associations with P<0.05 and |cor| >0.3 were considered
significant. The modules showing the strongest positive and
negative correlations with T-cell subsets were selected as key
modules, and the genes within these modules were defined as
TRGs.
Identification and functional analysis
of candidate genes
The overlapping genes among the DEGs, TRGs and URGs
were identified as candidate genes using the ggvenn package (v.
0.1.10; CRAN; http://CRAN.R-project.org/package=ggvenn). Gene
Ontology (GO) and Kyoto Encyclopaedia of Genes and Genomes (KEGG)
enrichment analyses were subsequently performed using the
clusterProfiler package (v. 4.8.3; Bioconductor; http://bioconductor.org/packages/clusterProfiler/) to
investigate the biological functions and pathways associated with
these candidate genes in LUAD. P<0.05 was considered
statistically significant for both analyses. The 10 pathways with
the highest gene counts were selected for visualisation. In
addition, a protein-protein interaction (PPI) network was
constructed using the STRING database (https://string-db.org/) with an interaction score
>0.4 and subsequently visualised using Cytoscape (v. 3.10.2;
Cytoscape Consortium; http://cytoscape.org/).
Identification of prognostic
genes
Prognostic analysis of patients from the TCGA-LUAD
dataset with available survival data was conducted using a
systematic analytical workflow. First, univariate Cox regression
analysis was performed for the candidate genes using the survival
package (v. 3.7–0; CRAN; http://CRAN.R-project.org/package=survival). Genes
meeting the criteria of P<0.05 and hazard ratio (HR)≠1 were
retained for subsequent analyses. The results were visualised using
a forest plot generated with the forestplot package (v. 3.1.3;
CRAN; http://CRAN.R-project.org/package=forestplot). The
proportional hazards (PH) assumption was then assessed for genes
identified by univariate Cox regression using the cox.zph function
in the survival package (v. 3.7–0; CRAN; http://CRAN.R-project.org/package=survival).
Genes without significant violations of the PH assumption
(P>0.05) were retained. Finally, least absolute shrinkage and
selection operator (LASSO) regression with 10-fold cross-validation
was performed using the glmnet package (v. 4.1–8; CRAN; http://CRAN.R-project.org/package=glmnet) to identify
prognostic genes.
Development and validation of the
prognostic model
A patient-specific risk score was calculated using
the linear combination formula ∑(β gene × expression gene),
incorporating the LASSO-derived coefficients and expression levels
of the prognostic genes. The prognostic model was developed using
TCGA-LUAD samples with available survival data. Patients were
stratified into a high-risk group (HRG) and low-risk group (LRG)
according to the maximally selected rank statistic. Risk score
distributions, survival status plots and prognostic gene expression
heatmaps were generated to characterise heterogeneity within the
cohort. The model was systematically validated in terms of survival
discrimination and predictive accuracy. Differences in survival
between the two risk groups were evaluated using Kaplan-Meier
analysis with the log-rank test (P<0.05), implemented with the
survminer package (v. 0.4.9; CRAN; http://CRAN.R-project.org/package=survminer).
Time-dependent receiver operating characteristic (ROC) curves were
generated using the survivalROC package (v. 1.0.3; CRAN; http://CRAN.R-project.org/package=survivalROC) to
assess predictive performance for 1-, 3- and 5-year survival. Area
under the curve (AUC) values >0.6 were considered indicative of
satisfactory discriminatory performance. External validation using
the GSE31210 cohort was performed to further assess the
generalisability of the model. Decision curve analysis (DCA) was
conducted using the rmda package (v. 1.9; CRAN; http://CRAN.R-project.org/package=rmda)
across a range of threshold probabilities to evaluate the clinical
utility of the nomogram. Its net benefit was compared with that of
the risk score alone and with each individual clinical factor.
Independent prognostic analysis and
nomogram construction
It was then assessed whether the risk score and
clinicopathological characteristics, including age, sex, T
category, N category, M category and overall stage, could serve as
independent prognostic indicators. The risk signature was
integrated with clinical information from patients from the
TCGA-LUAD dataset with complete survival data. Univariate Cox
regression analysis was initially performed using the survival
package (v. 3.7–0) and included the risk score and six clinical
variables: Age, sex, T stage (T1-T4), nodal status (N0/N1),
metastatic status (M0/M1) and overall stage (stages I–IV).
Variables meeting the criteria of P<0.05 and HR≠1 were retained
for further analysis. The PH assumption was assessed using the
cox.zph function in the survival package (v. 3.7–0), with P>0.05
indicating that the assumption was satisfied. Variables that met
the PH assumption were subsequently included in a multivariate Cox
regression analysis using the survival package (v. 3.7–0). Factors
with P<0.05 in the multivariate analysis were considered
independent prognostic factors. A nomogram incorporating these
independent factors was then constructed using the rms package (v.
6.5.0; CRAN; http://CRAN.R-project.org/package=rms) to estimate 1-,
3- and 5-year mortality probabilities in patients with LUAD.
Calibration curves at 1, 3 and 5 years were also generated using
the rms package (v. 6.5.0) to assess agreement between predicted
and observed outcomes.
Gene set enrichment analysis (GSEA)
and GeneMANIA network analysis
The patients from the TCGA-LUAD dataset were
stratified into an HRG and LRG according to the prognostic risk
model. Differential expression analysis between the two groups was
performed using DESeq2 (v. 1.42.0) with raw count data to obtain
log2FC values. Genes were ranked in descending order according to
their log2FC values, where positive and negative values indicate
upregulation and downregulation, respectively. GSEA was
subsequently performed using clusterProfiler (v. 4.8.3) with the
c2.cp.kegg.v7.5.1.symbols gene set obtained from the Molecular
Signatures Database (MSigDB; http://www.gsea-msigdb.org/gsea/msigdb/index.jsp).
Pathways with |normalized enrichment score (NES)| >1, P<0.05
and false discovery rate (FDR) <0.25 were considered
significantly enriched. NES is the enrichment score normalized for
gene set size and correlation with the ranked gene list. A positive
or negative NES indicates enrichment at the top or bottom of the
ranked list, respectively, and |NES| >1 indicates significant
enrichment regardless of direction. Functional associations
involving the prognostic genes were further investigated using the
GeneMANIA database (http://genemania.org), which was used to predict
related genes, molecular interactions and functional associations.
A co-expression network linking the prognostic genes with their
functionally associated genes was subsequently constructed.
Analysis of the immune
microenvironment
For TCGA-LUAD samples with available survival data,
four tumour microenvironment (TME)-related metrics were calculated
using the ESTIMATE algorithm (v. 1.0.13; MD Anderson Cancer Center;
http://r-forge.r-project.org/projects/estimate/):
StromalScore, ImmuneScore, ESTIMATEScore and tumour purity.
Differences in these metrics between the HRG and LRG were evaluated
using the Wilcoxon test, with P<0.05 considered statistically
significant. Immune cell infiltration involving 22 immune cell
subtypes was estimated using the CIBERSORT algorithm (v. 0.1.0).
The Wilcoxon rank-sum test (Mann-Whitney U-test) was then used to
identify immune cell populations that differed significantly
between the two risk groups (P<0.05), which were defined as
differential immune cells. The test was performed using R software
(version 4.3.1; R Foundation for Statistical Computing; http://www.r-project.org/). Spearman correlation
analyses were subsequently performed using the psych package (v.
2.4.3). Correlations among differential immune cells were
considered significant when |cor| >0.3 and P<0.05.
Gene mutation landscape and
immunotherapy response analysis
The TMB was calculated for each TCGA-LUAD sample
with available survival data using the maftools package (v. 2.18.0;
http://bioconductor.org/packages/maftools/). Waterfall
plots were generated to illustrate the mutation profiles of the 20
most frequently mutated genes separately in the HRG and LRG, as
well as the mutation profiles of the prognostic genes across all
samples. To evaluate potential differences in response to
immunotherapy between the two risk groups, Tumour Immune
Dysfunction and Exclusion (TIDE) scores were obtained from the TIDE
database (http://tide.dfci.harvard.edu) for TCGA-LUAD samples
with available survival information. Differences in TIDE scores
between the HRG and LRG were assessed using the Wilcoxon rank-sum
test (Mann-Whitney U-test), with P<0.05 considered statistically
significant, and visualised using violin plots generated with the
ggplot2 package (v. 3.5.1; http://ggplot2.tidyverse.org).
Drug sensitivity analysis
LUAD gene expression data and corresponding drug
half-maximal inhibitory concentration (IC50) values were
initially obtained from the Genomics of Drug Sensitivity in Cancer
(GDSC) database (http://www.cancerrxgene.org/). The oncoPredict package
(v. 1.2; Huang Laboratory, University of Minnesota; http://github.com/HuangLabUMN/oncoPredict) was
subsequently used for data processing and drug sensitivity
prediction. Ridge regression models were trained using the GDSC2
dataset, with drug-related gene expression data specified as the
training expression dataset (training ExprData), IC50
values as the training phenotype (training Ptype) and the
prognostic gene expression matrix as the test expression dataset
(test ExprData). Predicted IC50 values were then
calculated for each TCGA-LUAD tumour sample with available survival
data. The Wilcoxon rank-sum test (Mann-Whitney U-test) (P<0.05),
performed using R software (v. 4.3.1; R Foundation for Statistical
Computing; http://www.r-project.org/), was used
to compare the predicted IC50 values of different
antineoplastic agents between the HRG and LRG. The GDSC2 training
dataset contained gene expression profiles and corresponding
IC50 values for >200 drugs across >800 cancer cell
lines. Ridge regression models were constructed using the default
parameters of the oncoPredict package.
Expression and RT-qPCR validation of
prognostic genes
The Wilcoxon rank-sum test (Mann-Whitney U-test)
(P<0.05), performed using R software (v. 4.3.1; R Foundation for
Statistical Computing; http://www.r-project.org/), was used to compare the
expression levels of prognostic genes between LUAD and adjacent
normal samples in the TCGA-LUAD cohort. For independent validation,
20 LUAD tumour tissues and 20 paired adjacent normal tissue samples
were collected from The Second Hospital of Lanzhou University
(Lanzhou, China). The tissue samples were collected between July
2025 and December 2025. The median age of the patients was 65 years
(range, 54–72 years) and the patient population included 4 men and
16 women (Table SII). None of
these samples overlapped with those included in the TCGA-LUAD
dataset. All patients had pathologically confirmed LUAD and had not
received any chemotherapy or radiotherapy before sample collection.
Written informed consent was obtained from all participants before
enrolment. The study protocol was approved by the Medical Ethics
Committee of The Second Hospital of Lanzhou University (Lanzhou,
China; approval no. 2025A-648), and all procedures were conducted
in accordance with applicable guidelines and regulations. GraphPad
Prism 10 (Dotmatics) was used for data visualisation and P-value
calculation. Total RNA was extracted from the 40 tissue specimens
(20 tumour and 20 paired adjacent normal tissues) using TRIzol
reagent (Vazyme Biotech Co., Ltd.) according to the manufacturer's
instructions. Complementary DNA (cDNA) was synthesised from total
RNA using the Hifair® III 1st Strand cDNA Synthesis
SuperMix for qPCR kit (Shanghai Yeasen Biotechnology, Co., Ltd)
according to the manufacturer's instructions. qPCR was subsequently
performed using 2X Universal Blue SYBR Green qPCR Master Mix (Wuhan
Servicebio Technology Co., Ltd.) according to the manufacturer's
instructions. Each 10-µl reaction contained 5 µl of 2X Universal
Blue SYBR Green qPCR Master Mix, 3 µl of diluted cDNA and 1 µl each
of forward and reverse primers (10 µM). qPCR was performed on an
Archimed R4-2 Real-Time PCR System (RocGene Technology Co., Ltd.)
with the following thermocycling conditions: Initial denaturation
at 95°C for 3 min, followed by 40 cycles of 95°C for 15 sec and
60°C for 30 sec. A melting curve analysis was performed after the
amplification cycles to verify the specificity of the PCR products.
GAPDH was used as the endogenous reference gene for quantification
of prognostic gene expression. Primers were obtained from a
commercial supplier and are listed in Table SIII. Relative gene expression
differences between LUAD tumour and adjacent normal tissues were
calculated using the 2−∆∆Cq method (14).
Statistical analysis
All bioinformatics analyses were performed using R
software (v. 4.3.1; R Foundation for Statistical Computing;
http://www.r-project.org/). Wilcoxon
rank-sum test (Mann-Whitney U-test) for independent samples, the
Wilcoxon signed-rank test for paired samples or Student's t-test,
as appropriate, with P<0.05 considered to indicate a
statistically significant difference. To ensure reproducibility, a
fixed random seed [set.seed(123456)] was applied to all stochastic
procedures, including LASSO cross-validation and CIBERSORT
permutations. The same seed was also used for fold assignment
during LASSO regression. The principal R packages used in the
present study included DESeq2 (v. 1.42.0), WGCNA (v. 1.7.1), glmnet
(v. 4.1–8), survival (v. 3.7–0), survivalROC (v. 1.0.3) and rmda
(v. 1.9).
Results
Identification of DEGs and TRGs
Transcriptomic comparison between LUAD and adjacent
normal tissues in the TCGA-LUAD cohort identified 9,580 DEGs,
including 6,167 upregulated genes and 3,413 downregulated genes in
tumour tissues (Fig. 1A and B;
Table SIV). Immune infiltration
analysis revealed substantial T-cell infiltration in both LUAD and
normal samples, including CD8+ T cells and several other
T-cell subsets. With the exception of CD8+ T cells, the
infiltration levels of other T-cell subsets, including gamma delta
T cells and naïve CD4+ T cells, differed significantly
between the two groups (Fig. 1C and
D). WGCNA confirmed that no outlier samples were present in the
TCGA-LUAD cohort, and the optimal soft-thresholding power (β) was
determined to be 5 (R2>0.9) (Fig. 1E and F, Table SV). A total of 12 co-expression
modules were identified using a module-merging threshold of
MEDissThres=0.4 (Fig. 1G and H).
Differentially infiltrated T-cell subsets were used as phenotypic
traits. For resting CD4+ memory T cells, the MEbrown
module showed the strongest positive correlation (cor=0.47,
P=5×10⁻³⁰), whereas the MEmagenta module showed the
strongest negative correlation (cor=−0.47, P=2×10⁻²⁹)
(Fig. 1I). These two modules were
therefore considered to contain genes strongly associated with
T-cell infiltration. The MEbrown module contained 6,130 genes,
whereas the MEmagenta module contained 597 genes (Tables SVI and SVII). Accordingly, the genes in these two
modules were defined as TRGs, yielding a total of 6,727 genes.
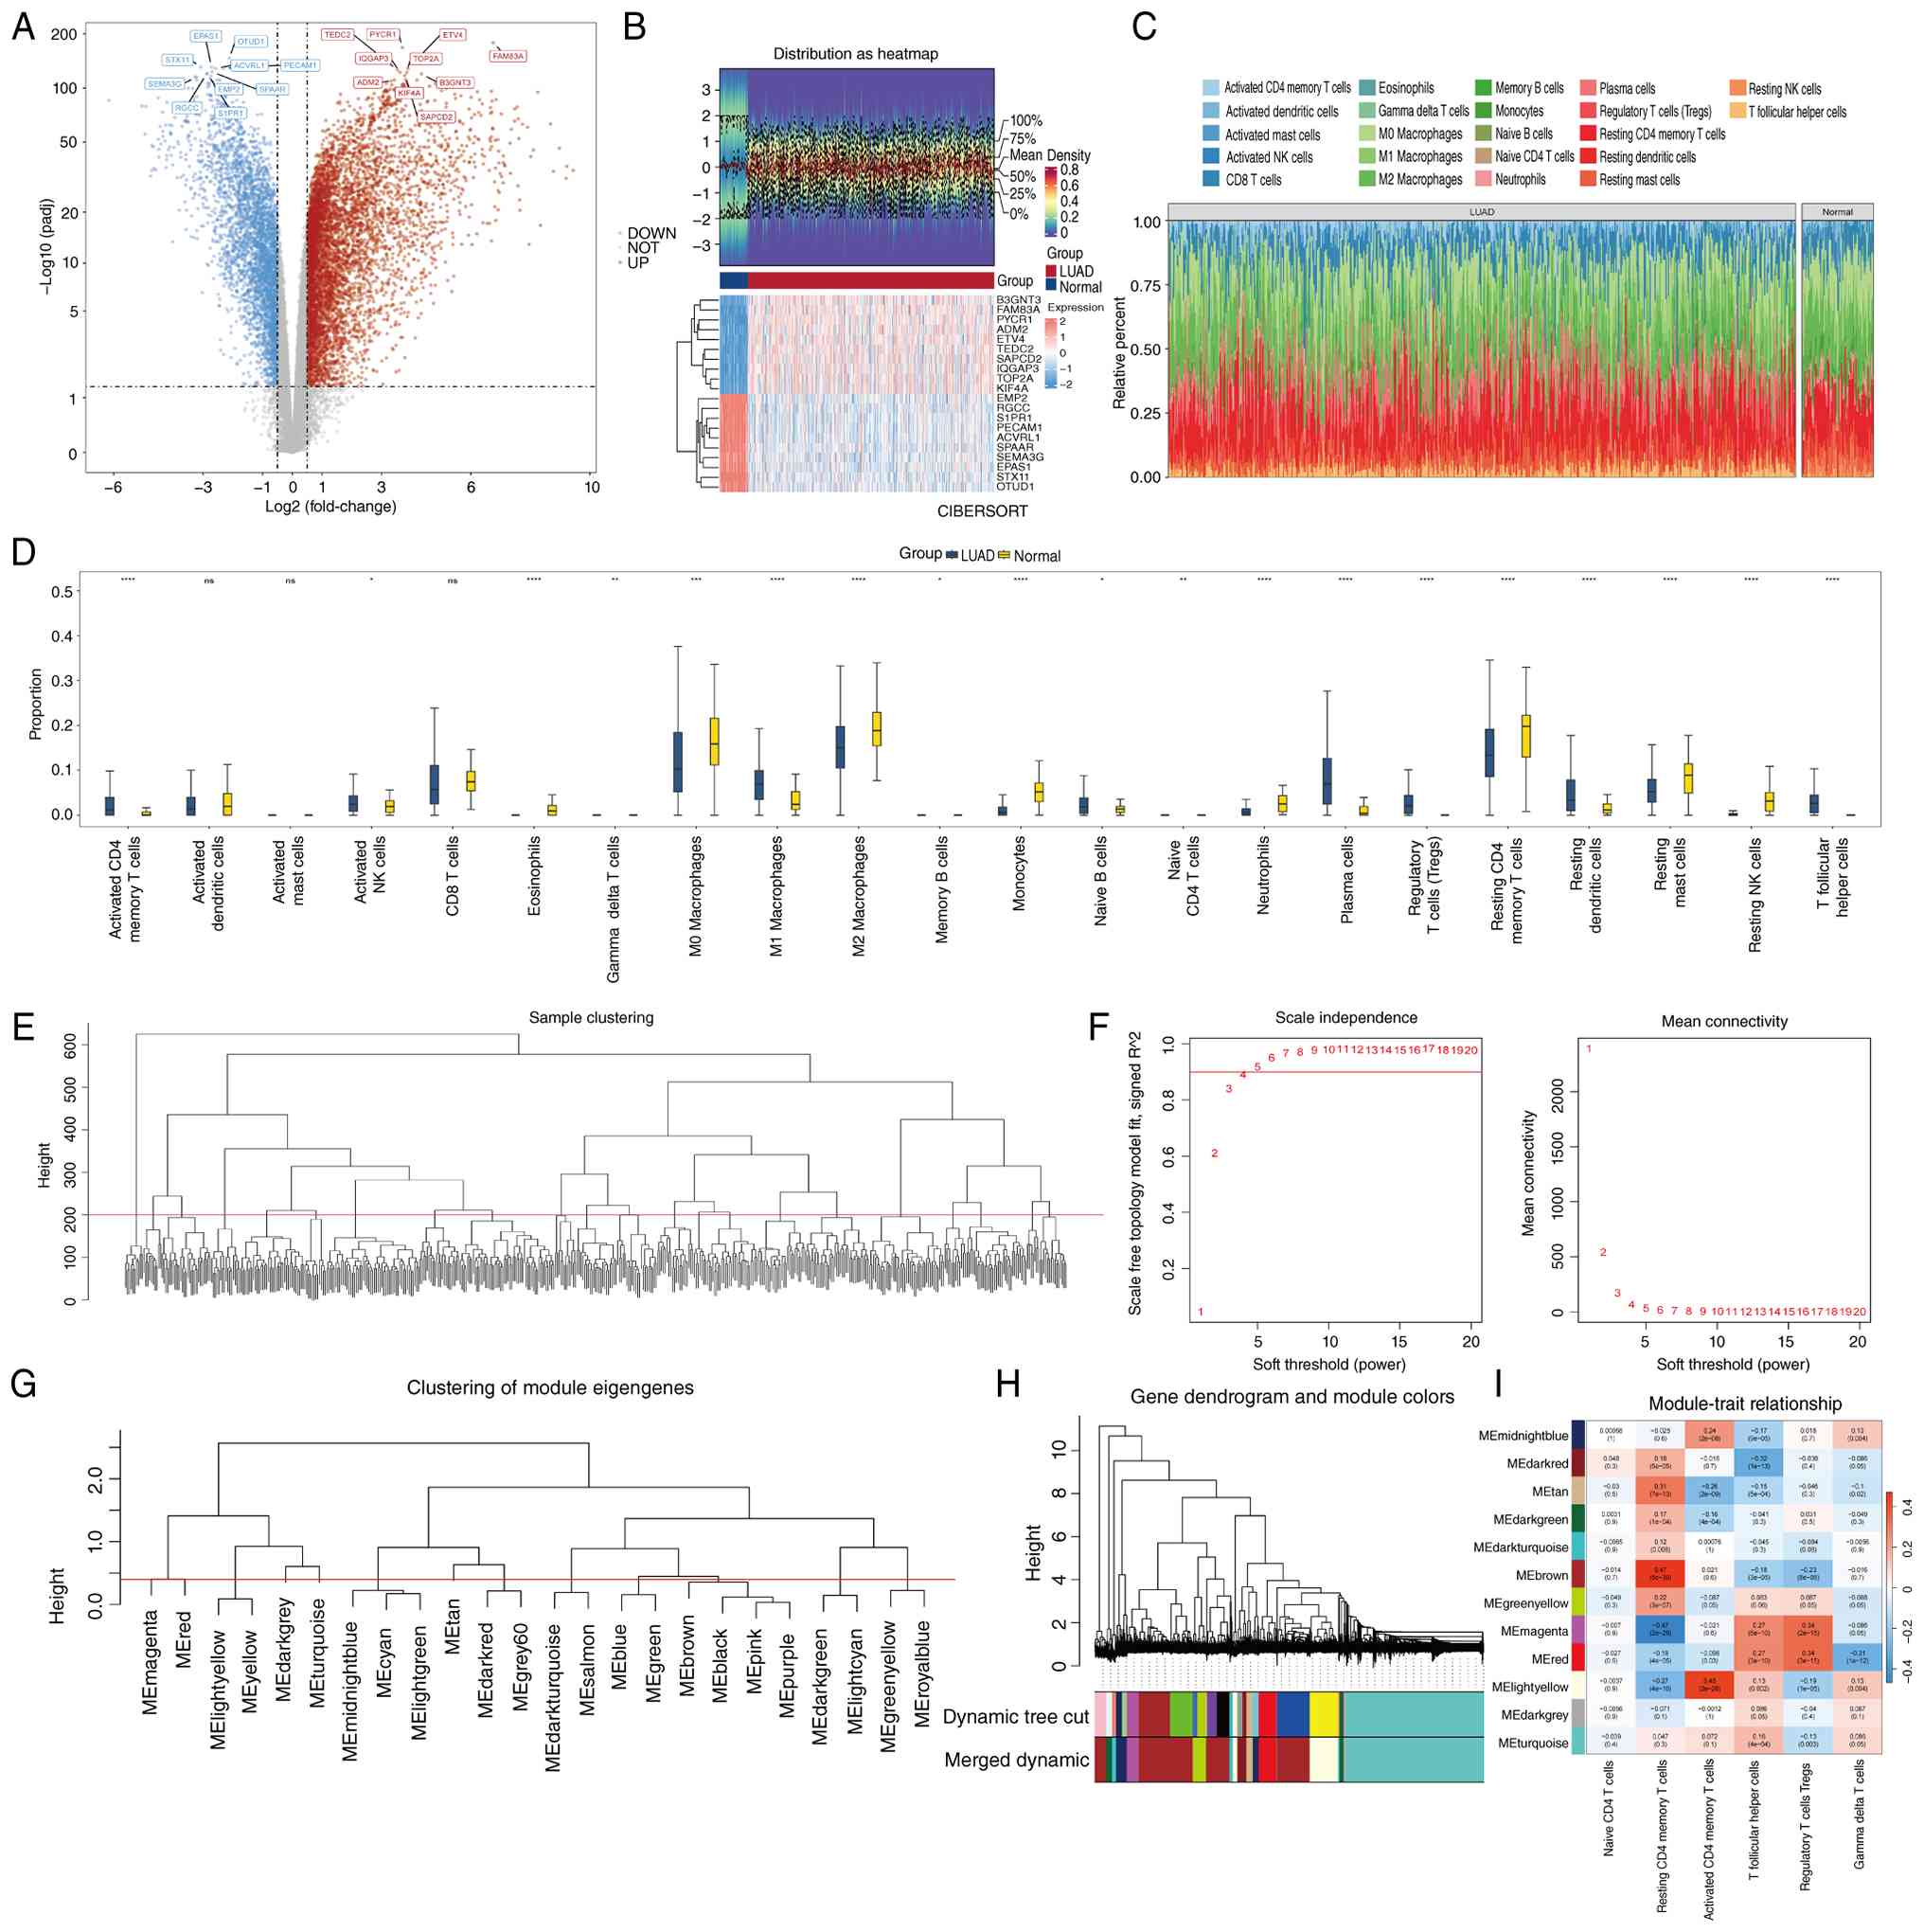 | Figure 1.Identification of DEGs and TRGs. (A)
Volcano plot of DEGs. Each dot represents a gene, and red and blue
dots represent upregulated and downregulated genes, respectively. A
total of 9,580 DEGs were identified, among which 6,167 were
upregulated and 3,413 were downregulated. (B) Heatmap of the top 10
upregulated and downregulated DEGs (q-value <0.05). Each small
square in the figure represents a gene, and its colour indicates
the expression level of the gene. A higher expression level is
indicated by a darker colour, with red indicating high expression
and blue low expression. (C) Infiltration of 22 immune cells in
tumour tissue samples and normal adjacent tissue samples of
patients with LUAD. The grids of each colour in the figure
represent the content of immune cells in the samples, with the left
being the LUAD group and the right being the normal control group.
(D) Enrichment score box plot of immune infiltrating cells. Yellow
represents LUAD group samples and blue represents normal group
samples. Differences between the two groups in C and D were
examined using the Wilcoxon rank-sum test. *P<0.05; **P<0.01;
***P<0.001; ****P<0.0001. (E) Analysis of sample clustering.
Vertical lines in the figure represent each sample in the dataset;
the vertical axis represents the height of hierarchical clustering
and the red horizontal line represents the sample screening cut-off
value. All samples have similar heights and can be retained for
subsequent analysis. (F) Scale-free soft threshold distribution
diagram. The scale-free soft threshold distribution had an optimal
soft threshold of 5. The horizontal axis in the figure represents
the weight parameter power value. The vertical axis in the left
figure represents the scale free fit index, R2. A higher
value indicates greater closeness of the network to the scale-free
distribution. The vertical axis in the right figure represents the
mean of all gene adjacency functions in the corresponding gene
module. (G) Clustering tree of genes from different modules. The
genes with closer relationships are highly similar in the
clustering tree. (H) Hierarchical clustering tree analysis. The
genes classified into various modules through hierarchical
clustering, with different colours representing different
functional modules. Gray defaults to genes that cannot be
classified into any module. (I) Correlation heatmap between the 12
co-expression modules and T-cell subsets. The vertical axis lists
the 12 modules, each represented by its ME; the horizontal axis
represents T-cell subsets used as phenotypic traits. Each cell
displays the correlation coefficient and the corresponding P-value
for one module-trait pair. Red indicates a positive correlation and
blue indicates a negative correlation. P-values are presented in
the ×10−30 format (e.g., 5×10⁻³⁰). DEG,
differentially expressed gene; TRG, T cell-related gene; LUAD, lung
adenocarcinoma; ME, module eigengene; ns, not significant. |
Interactions among the 97 candidate
genes
The intersection of the DEGs, TRGs and 1,793 URGs
yielded 97 candidate genes (Fig. 2A
and Table SVIII). GO enrichment
analysis identified 171 biological process (BP), 20 cellular
component (CC) and 42 molecular function (MF) terms (Fig. 2B and Table SIX, Table SX, Table SX, Table SXI). The candidate genes were
significantly enriched in MF terms such as ‘ubiquitin-like protein
transferase activity’. Significant CC terms included the ‘ubiquitin
ligase complex’ and ‘nuclear envelope’, whereas enriched BP terms
included ‘proteasome-mediated ubiquitin-dependent protein catabolic
processes’, among others. KEGG pathway analysis further revealed
significant enrichment in nine pathways, including
‘ubiquitin-mediated proteolysis’ (Fig.
2C and Table SXII). A PPI
network was then constructed for the 97 candidate genes. Of these,
31 genes showed no interactions with other genes in the network,
whereas the remaining genes formed 131 interactions, including an
interaction between PSMD4 and DDI1 (Fig. 2D). No prominent hub gene was
identified, as no node exhibited a markedly higher degree than the
others.
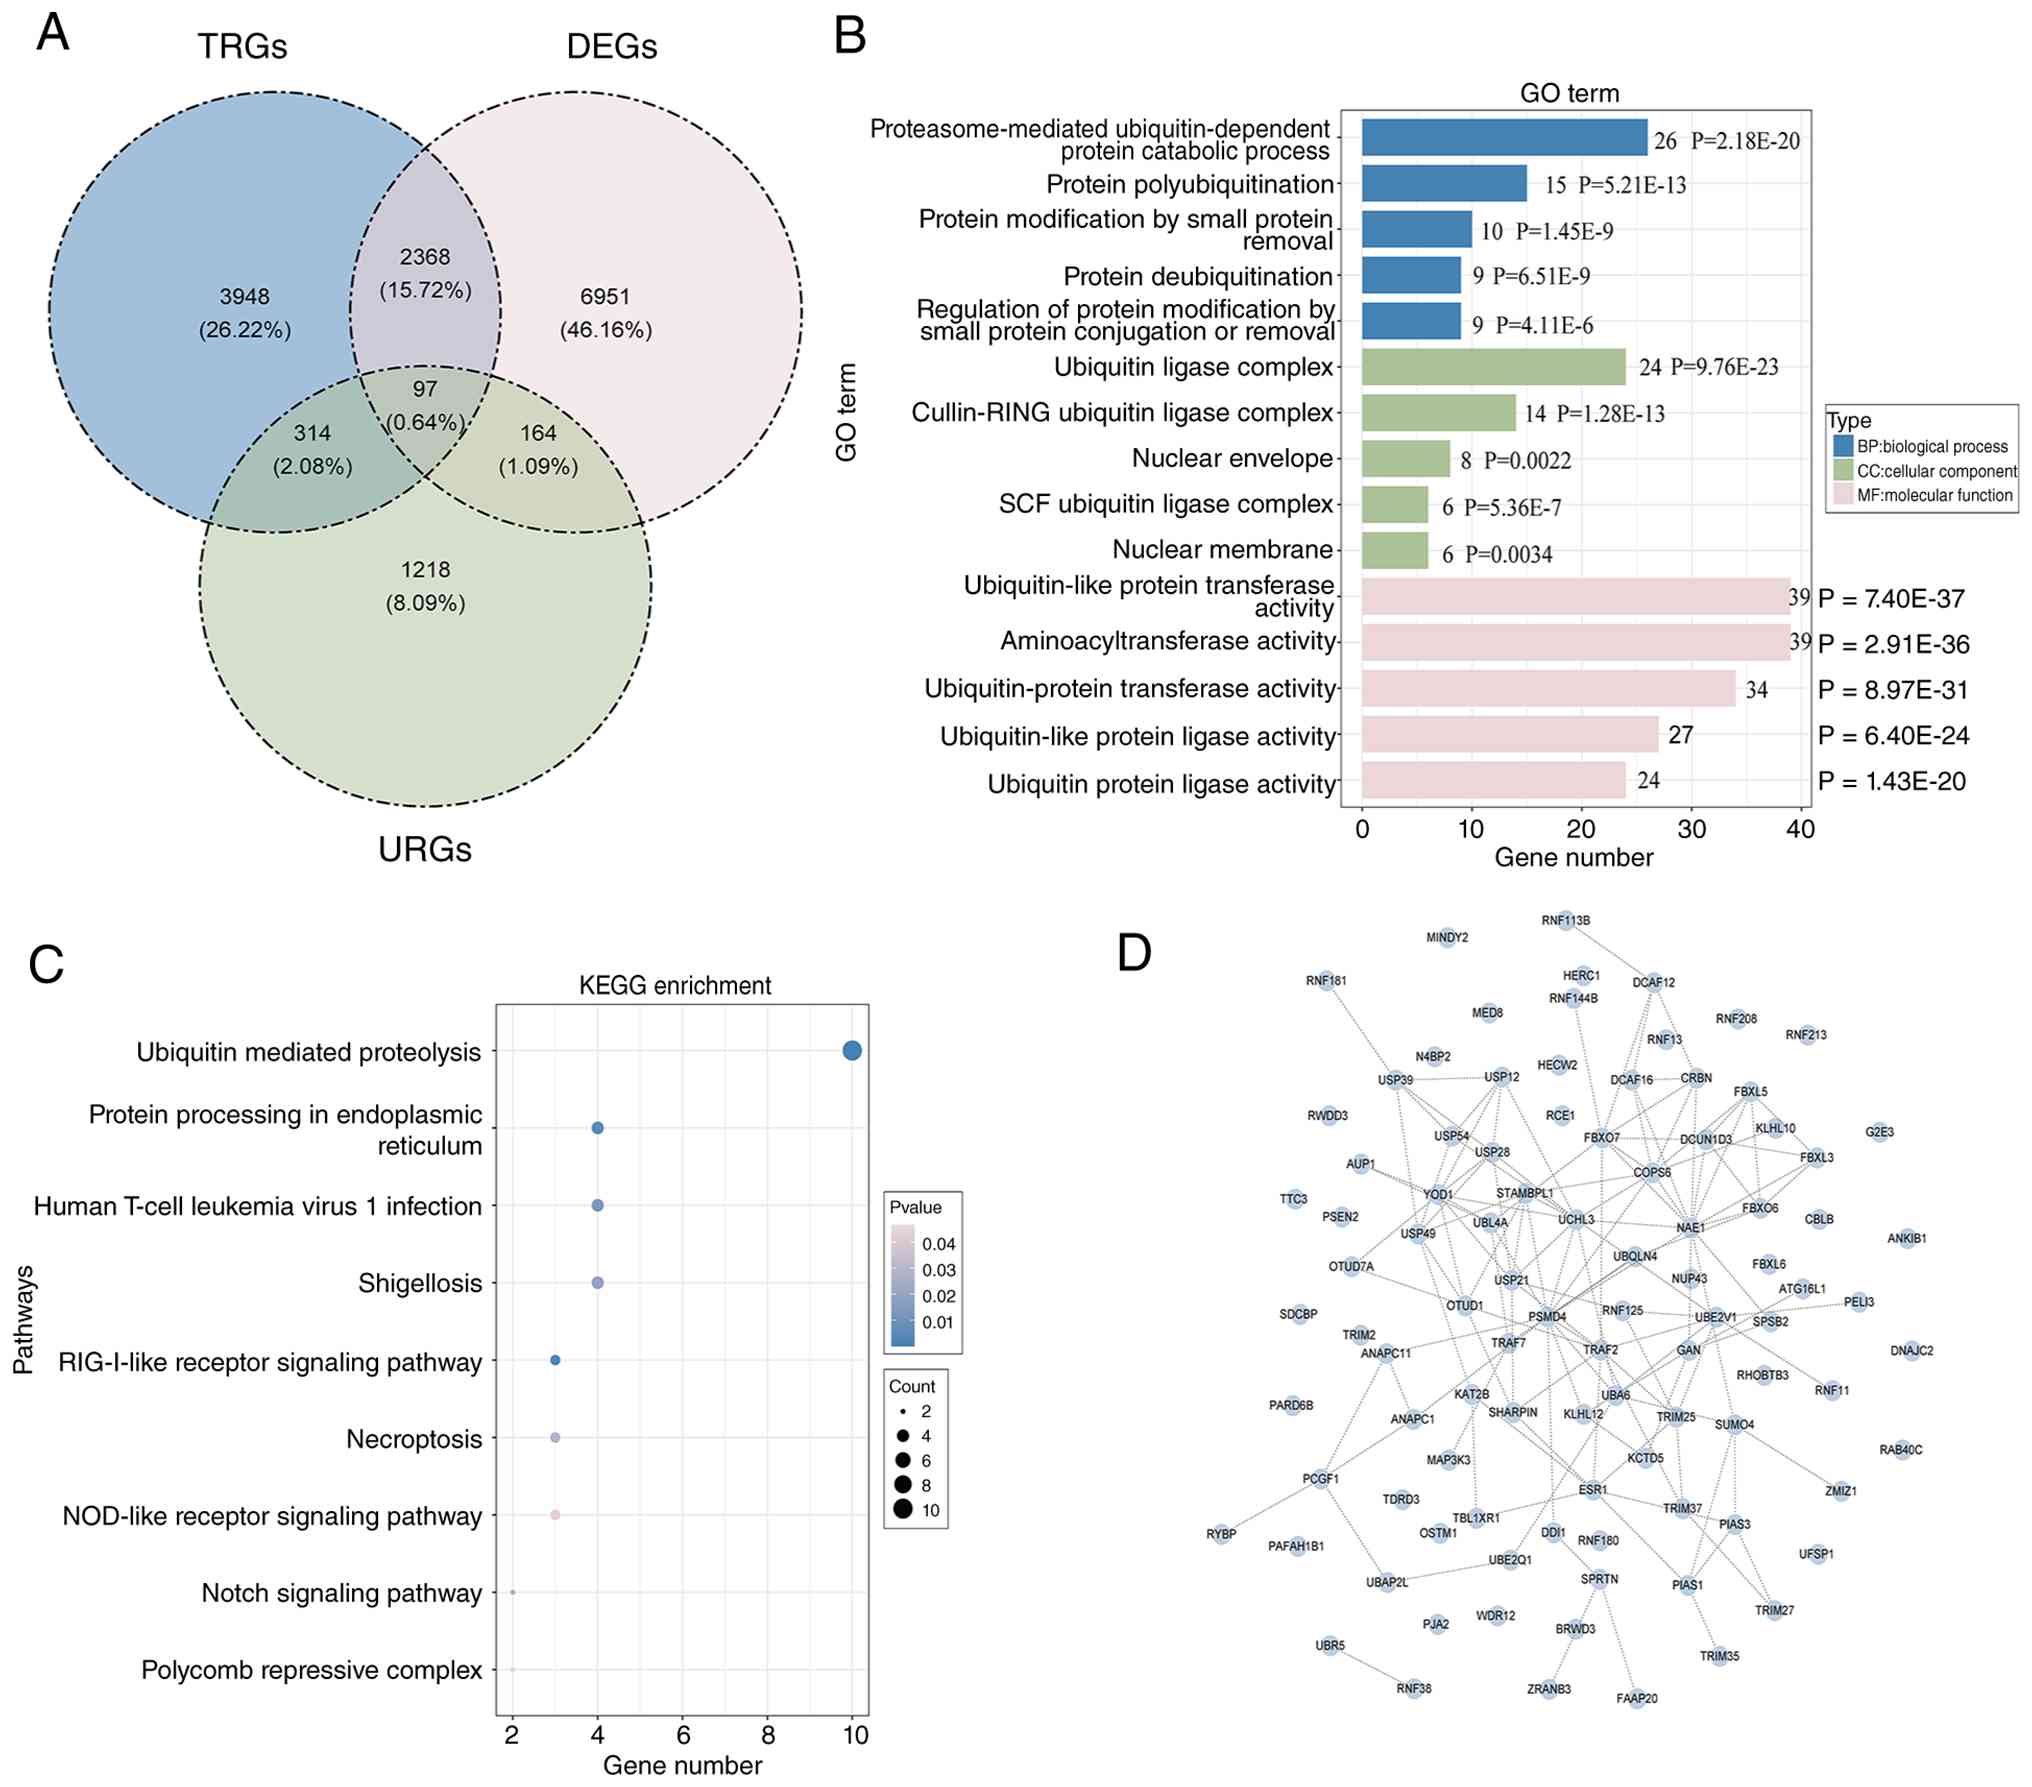 | Figure 2.Interaction among the 97 candidate
genes. (A) Venn diagram of overlapping genes in the three
algorithms. A total of 97 candidate genes were obtained. (B) GO
enrichment analysis of candidate genes. The top 15 enriched GO
terms are shown. The y-axis represents GO terms and the x-axis
represents the number of enriched genes in each term. Biological
process, cellular component and molecular function are colored in
blue, green and pink, respectively. Gene count and P-value of each
GO term were annotated. (C) KEGG enrichment analysis of candidate
genes. The top 9 enriched KEGG pathways are shown. The y-axis
represents KEGG pathway terms and the x-axis represents the
enrichment factor. The dot size indicates the number of enriched
genes and the dot color represents the P-value. (D) PPI network.
Blue nodes represent genes, dashed lines represent PPIs between
genes and the more lines there are, the more times genes interact
with other genes. Nodes without any connected lines are discrete
points. KEGG, Kyoto Encyclopaedia of Genes and Genomes; GO, gene
ontology; DEG, differentially expressed gene; TRG, T cell-related
gene; URG, ubiquitination-related gene; PPI, protein-protein
interaction. |
Strong prognostic performance of the
LUAD prognostic model
Using the candidate genes, univariate Cox regression
analysis in the TCGA-LUAD cohort was first performed and 14 genes
were identified to be significantly associated with patient
survival (P<0.05, HR≠1; Fig.
3A). The PH assumption was then evaluated and 11 potential
prognostic genes that satisfied the assumption (P>0.05) were
retained (Fig. S1). Subsequently,
LASSO regression with 10-fold cross-validation was performed. The
optimal regularization parameter λ (λ min=0.002767626) was selected
as the value that minimized the mean cross-validated error. At this
λ min=0.002767626, the regression coefficients of RNF180,
MAP3K3, TRIM2, RNF125, RWDD3, RNF144B, KCTD5 and TRIM27
remained non-zero (Fig. 3B and C
and Table SXIII). The
LASSO-derived coefficients for these eight prognostic genes were as
follows: RNF180 (−0.1427), MAP3K3 (0.0953),
TRIM2 (0.1286), RNF125 (−0.0734), RWDD3
(0.1121), RNF144B (−0.0918), KCTD5 (0.1572) and
TRIM27 (0.1039). The risk score for each patient was
calculated using the linear combination formula ∑(β gene ×
expression gene): RiskScore = −0.1427×RNF180 +
0.0953×MAP3K3 + 0.1286×TRIM2 - 0.0734×RNF125 +
0.1121×RWDD3 - 0.0918×RNF144B + 0.1572×KCTD5 +
0.1039×TRIM27. These eight genes were therefore defined as
the prognostic signature. Using the optimal risk-score cut-off of
1.183469, patients were stratified into an HRG (n=185) and LRG
(n=330). Patients in the HRG had significantly poorer overall
survival (P<0.0001) and a higher mortality rate (Fig. 3D-G). Time-dependent ROC analysis
yielded AUC values >0.6 for 1-, 3- and 5-year survival (Fig. 3H). In the GSE31210 cohort (n=226),
an optimal cut-off of 4.734456×10⁻⁵ was used to stratify
106 patients into the HRG and 120 into the LRG. The results
obtained in GSE31210 were consistent with those from the TCGA-LUAD
cohort, supporting the generalisability of the prognostic model to
an independent dataset (Fig.
3I-M).
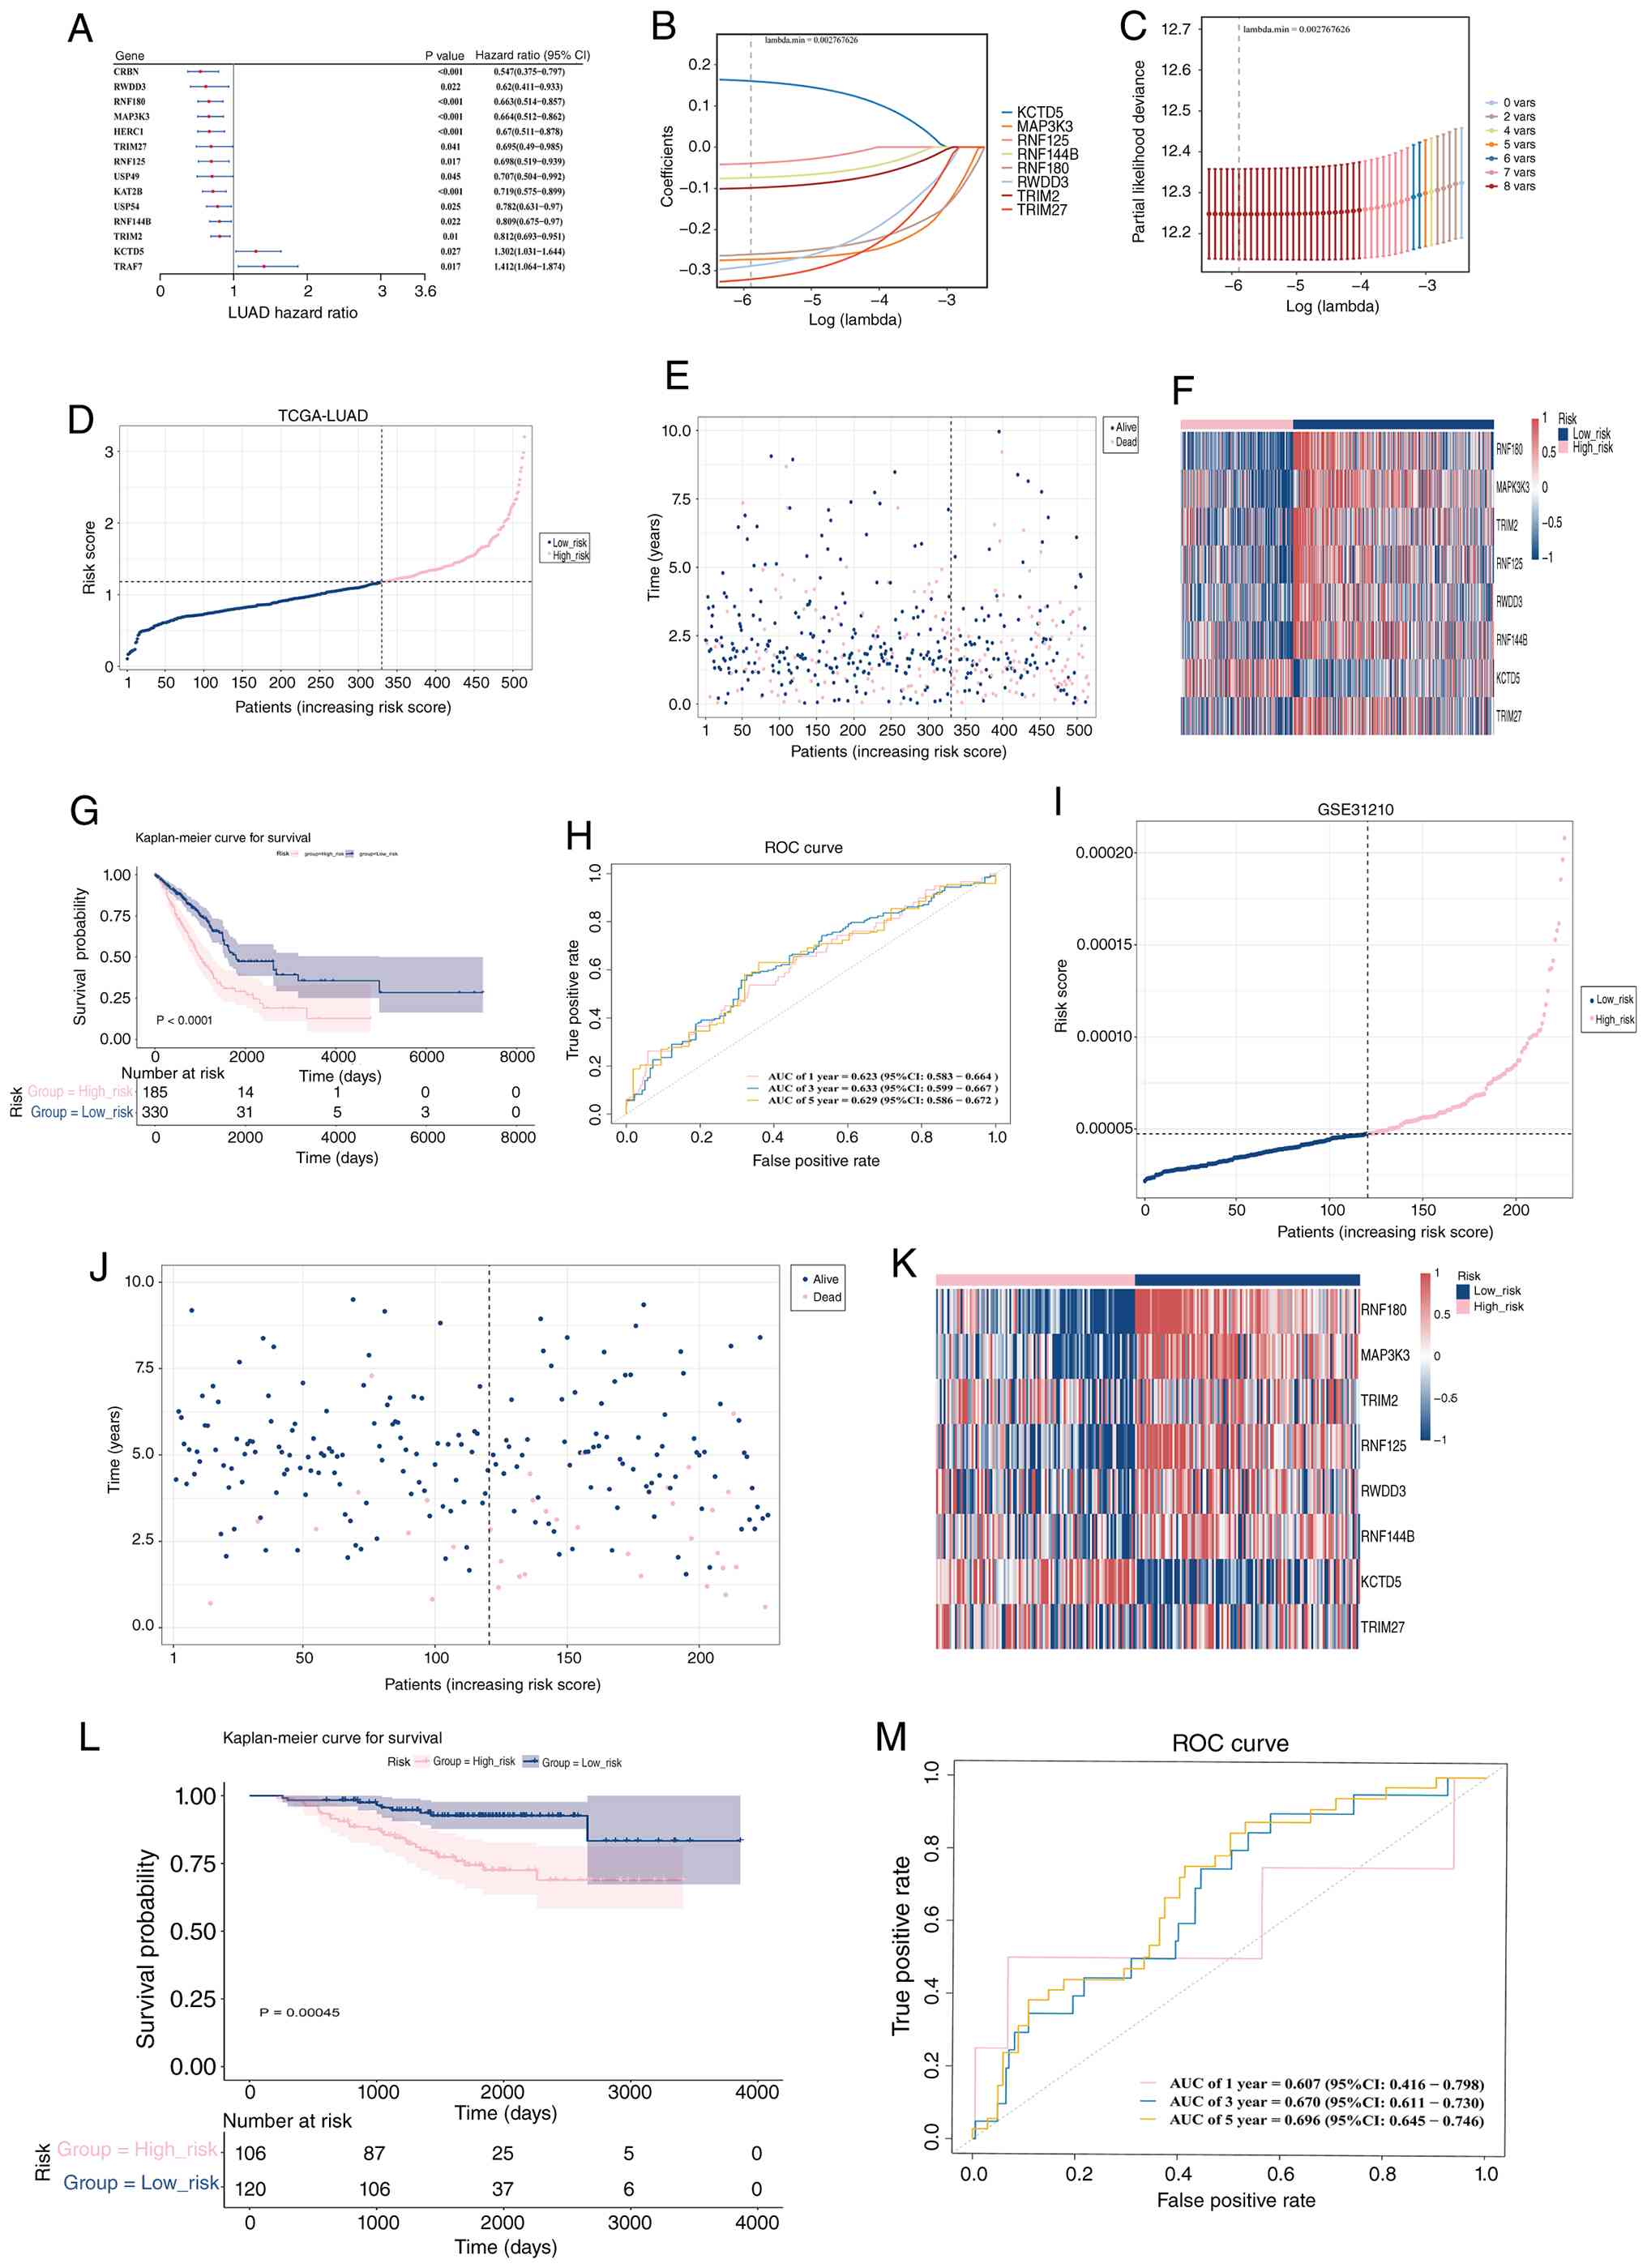 | Figure 3.Prognostic gene identification and
risk model construction. (A) The forest plot of 14 prognostic genes
selected by univariate Cox analysis. The first column represents
genes, the second column P-values and the third column HR values.
Each red dot represents a gene, with dots on the right representing
HR>1 and dots on the left representing HR<1. LASSO regression
analysis. The 8 prognostic genes were screened by LASSO. (B)
Trajectory of the coefficient changes for each independent
variable. The y-axis represents the coefficient values and the
x-axis the number of non-zero coefficients in the model at that
time. (C) LASSO regression with 10-fold cross-validation. The
horizontal axis represents log(λ) and the vertical axis represents
the cross-validation error. The red dots represent the mean
cross-validation error, and the error bars represent double the
standard deviation. The numbers above indicate the number of
independent variables (non-zero coefficients) remaining in the
model. The first dashed line indicates the λ value that minimizes
the mean cross-validation error, and the second dashed line marks
the largest λ within one standard error of the minimum. (D) Model
risk analysis. Blue dots represent low-risk patients and pink dots
represent high-risk patients. The x-axis represents patients ranked
by risk score and the y-axis represents the risk score. The risk
scores of patients increase from left to right in sequence. (E)
Survival status distribution analysis. Blue dots represent low-risk
patients and pink dots represent high-risk patients. (F) Risk model
gene expression heatmap. Each column represents a sample and each
row represents a gene. The colour of the small square indicates the
level of gene expression, with darker colours indicating higher
expression levels (red indicates high expression, blue indicates
low expression and white indicates no significant difference). (G)
Kaplan-Meier curve analysis. The horizontal axis represents the
total survival time (days) and the vertical axis represents
survival probability; pink represents the high-risk group and blue
the low-risk group. (H) ROC curve analysis. The specificity (false
positive rate) is displayed on the x-axis and sensitivity (true
positive rate) on the y-axis. The area enclosed by the curve and
x-axis is called AUC, and the closer the AUC value is to 1, the
better the diagnostic performance. (I) Risk score distribution of
patients in the GSE31210 cohort. Patients were ranked by risk
score; blue dots represent low-risk patients and pink dots
represent high-risk patients. (J) Survival status distribution of
patients in the GSE31210 cohort. Blue dots represent low-risk
patients and pink dots represent high-risk patients. (K) Expression
heatmap of the eight prognostic genes in the GSE31210 cohort. Each
column represents a sample and each row represents a gene; red
indicates high expression and blue indicates low expression. (L)
Kaplan-Meier survival curves for the high-risk and low-risk groups
in the GSE31210 cohort. The x-axis represents overall survival time
(days) and the y-axis represents survival probability; pink
represents the high-risk group and blue represents the low-risk
group. (M) Time-dependent ROC curves for 1-, 3- and 5-year survival
in the GSE31210 cohort. The x-axis represents the false positive
rate and the y-axis represents the true positive rate. AUC values
are shown. In both the TCGA-LUAD and GSE31210 cohorts, RNF180,
RNF125 and RNF144B were highly expressed in the low-risk
group, whereas MAP3K3, TRIM2, RWDD3, KCTD5 and TRIM27
were highly expressed in the high-risk group. These expression
patterns were consistent with the LASSO-derived coefficients and
the risk score formula. All GSE31210 results were consistent with
those of the TCGA-LUAD cohort, indicating that the constructed
prognostic model for LUAD was applicable to other samples. HR,
hazard ratio; LUAD, lung adenocarcinoma; TCGA, The Cancer Genome
Atlas; AUC, area under the ROC curve; ROC, receiver operating
characteristic; LASSO, least absolute shrinkage and selection
operator. |
Identification of independent
prognostic factors
A multivariable prognostic model incorporating the
risk score and six clinicopathological parameters was developed.
Univariate Cox regression identified two significant predictors of
overall survival: The risk score and M stage (M1) (HR≠1,
P<0.05). Both variables satisfied the PH assumption (P>0.05)
and remained statistically significant in the multivariate Cox
regression (HR≠1, P<0.05), confirming their roles as independent
prognostic factors (Fig. 4A and B,
Fig. S2, Tables SXIV and SXV). A nomogram incorporating these
independent prognostic factors was then constructed to estimate the
probabilities of death at 1, 3 and 5 years in patients with LUAD.
Higher total nomogram scores corresponded to higher predicted
probabilities of death (Fig. 4C).
The calibration curves showed close agreement between the predicted
and observed outcomes at 1, 3 and 5 years, indicating good
predictive performance (Fig. 4D).
DCA further showed that, within a limited threshold probability
range (e.g., 0.3–0.5), the nomogram provided a modest improvement
in net clinical benefit compared with the risk score alone. For
example, at a threshold probability of 0.3, the net benefit was
0.012 for the nomogram compared with 0.008 for the risk score
alone. Although the improvement was incremental rather than
substantial, these findings suggest potential clinical utility in
selected settings (Fig. 4E). Thus,
the nomogram may provide additional information for clinical
decision-making, such as identifying patients who may warrant more
intensive follow-up or consideration of treatment escalation,
compared with the use of the risk score or M stage alone.
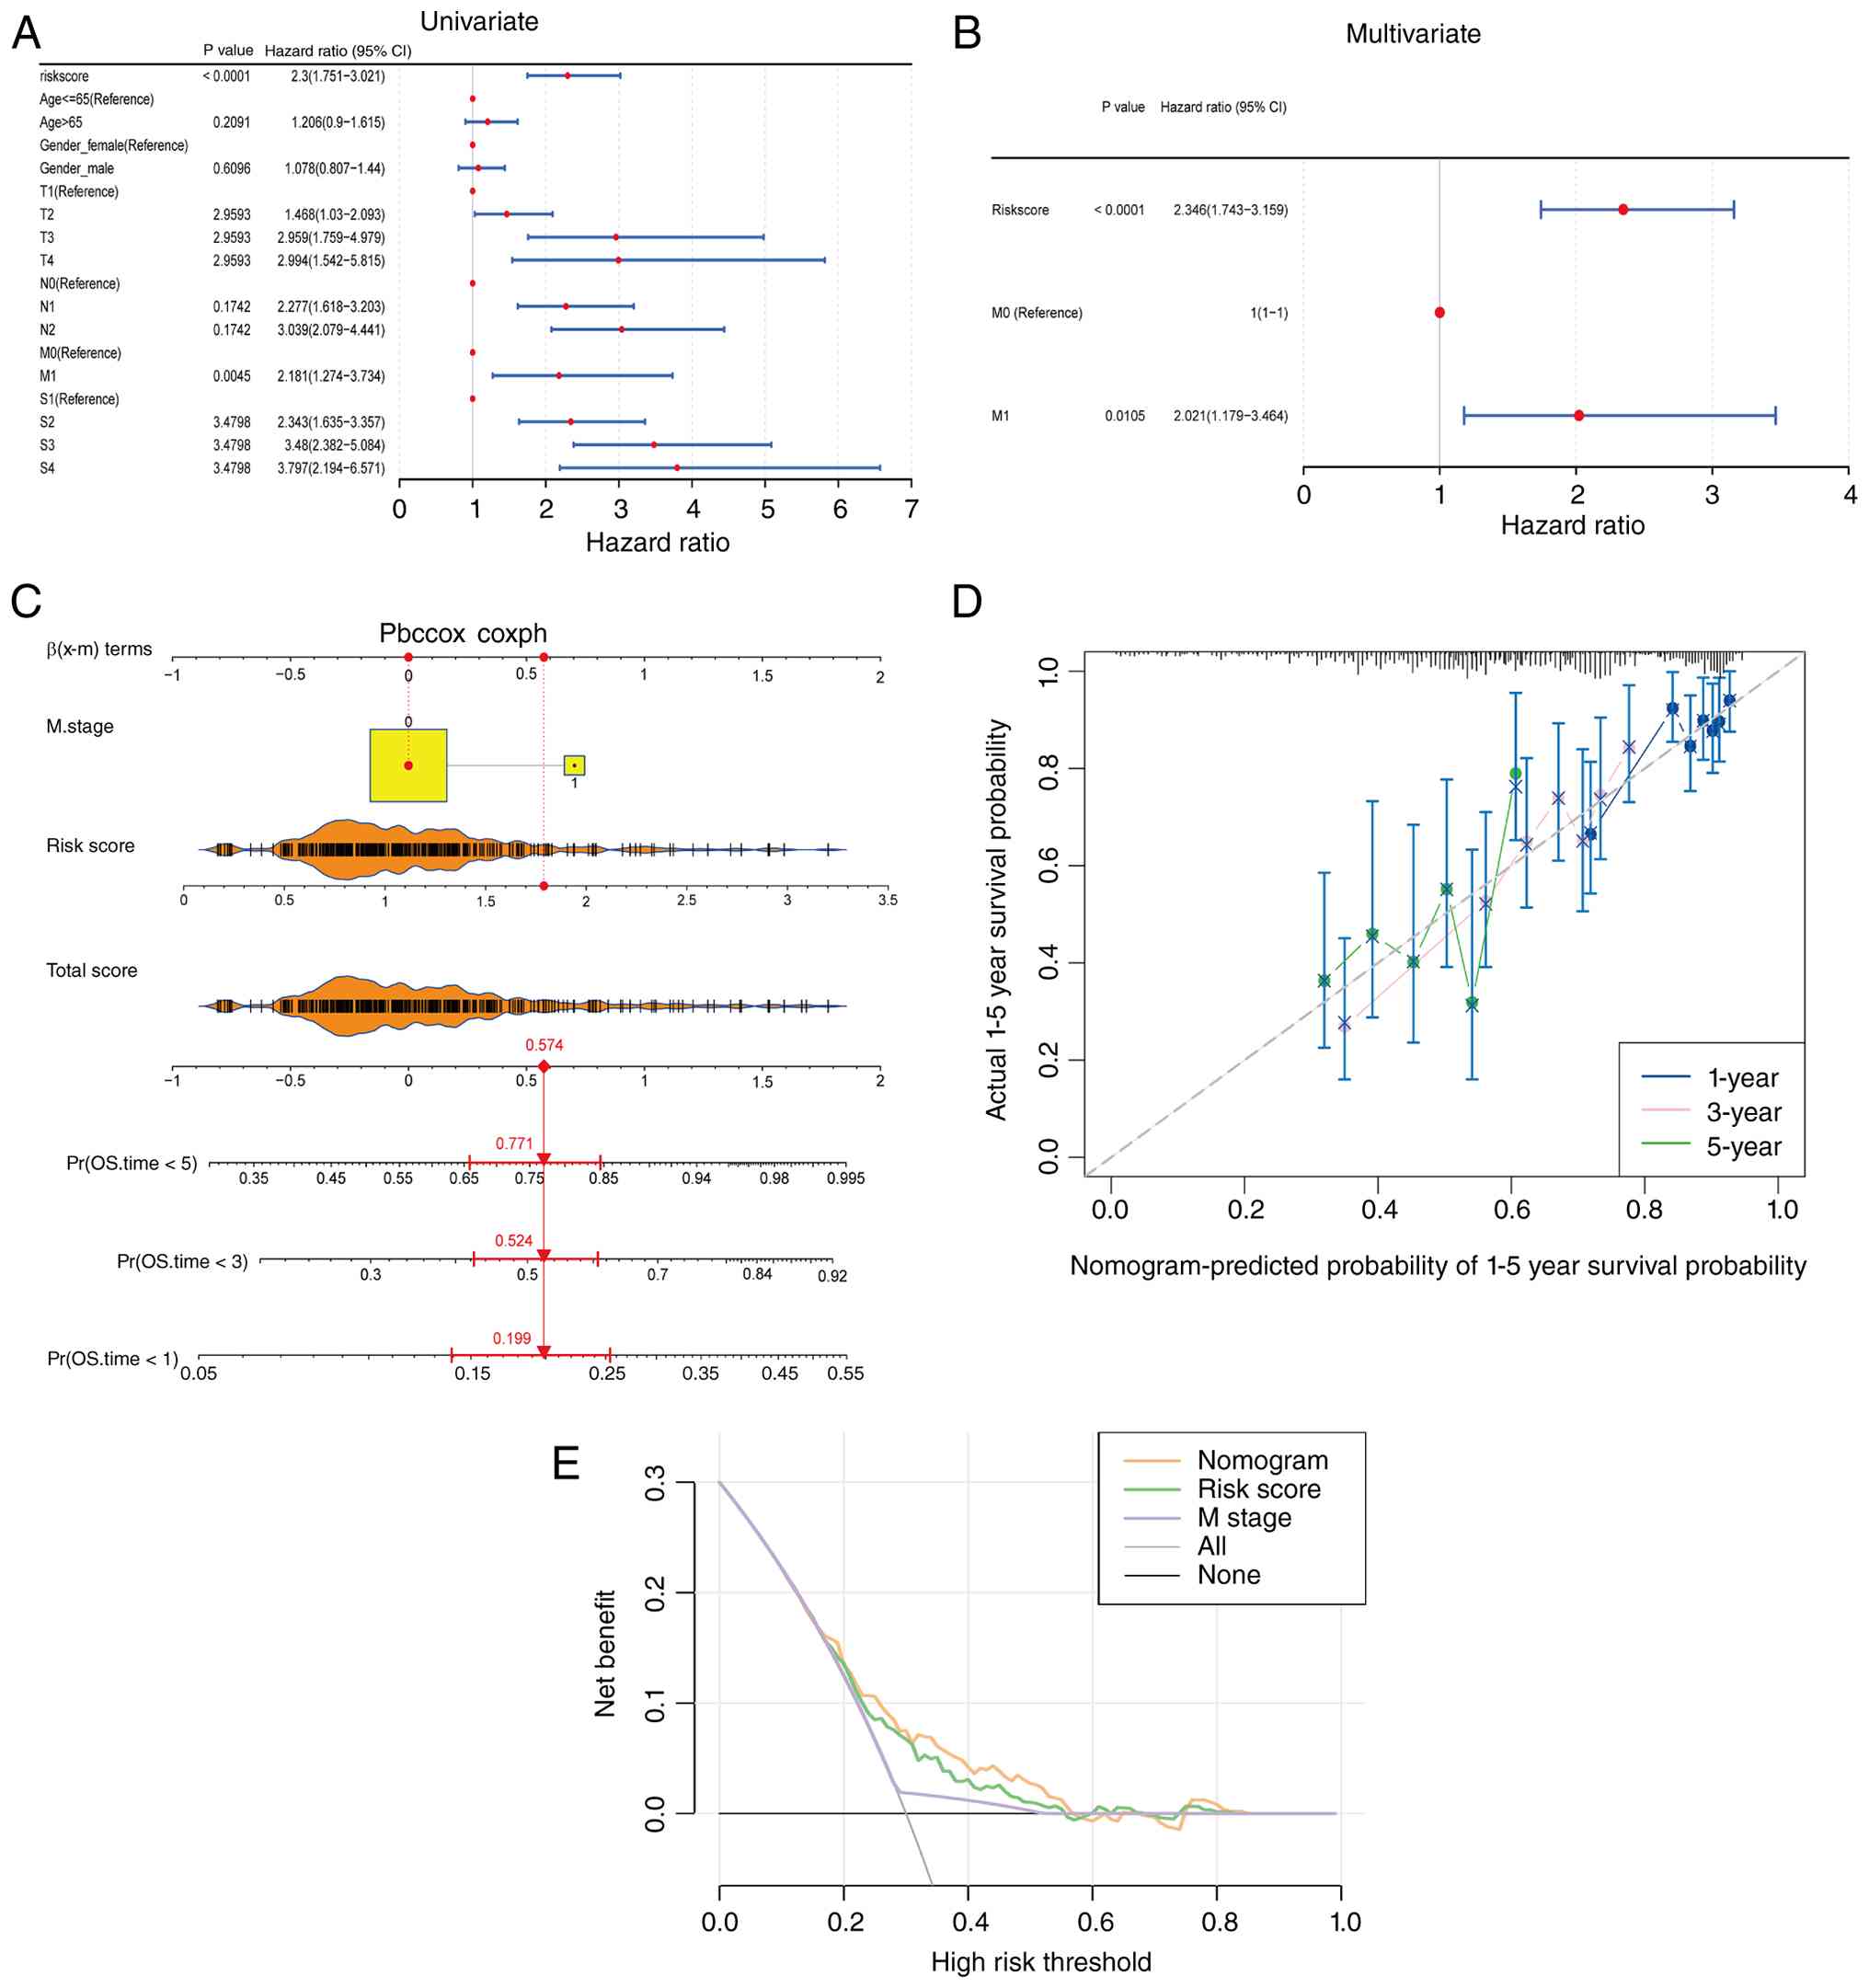 | Figure 4.Identification of independent
prognostic factors. (A) Univariate Cox analysis. (B) Multivariate
Cox analysis. The left column shows risk scores and clinical
features, and the second and third columns show corresponding
P-values and HR values, where the 95% confidence interval of the HR
value is indicated in parentheses after the HR value. In the figure
on the right, the red dot represents the HR value and the line
segments on both sides indicate the 95% confidence interval of the
HR value. (C) Nomogram for predicting 1-, 3- and 5-year mortality
probabilities. The first part is points including M stage and risk
group; the second part are variables, where the range of values of
the line segment after the variable represents the total
contribution of the variable to the outcome event, and the scale on
the line segment represents the value of the variable; the third
part is the total score, with a higher score indicating a greater
patient mortality rate; the fourth part is the 1-, 3- and 5-year
mortality probabilities, which represents the probability of death
after converting the patient's total score. (D) Event occurrence
rate analysis. The calibration curve of the column chart, where the
horizontal axis represents the predicted event occurrence rate and
the vertical axis represents the observed actual event occurrence
rate, shows a high degree of overlap between the predicted
probability of survival for 1, 3 and 5 years and the reference
line. (E) Decision curve analysis for the nomogram. The y-axis
represents the net benefit and the x-axis represents the threshold
probability. The nomogram (red line) showed a modest improvement in
net benefit compared with the risk score alone (blue line) or M
stage alone (green line) within a limited threshold probability
range (e.g., 0.3–0.5). Gray dashed lines represent ‘treat all’
(diagonal) and ‘treat none’ (horizontal) strategies. HR, hazard
ratio. |
Immune microenvironment
characteristics and correlations among immune cells
GSEA revealed 90 pathways significantly enriched in
the HRG and 63 pathways significantly enriched in the LRG. Based on
NES rankings, the top five pathways were ‘ribosome’, ‘cell cycle’,
‘oxidative phosphorylation’, ‘Parkinson's disease’ and ‘olfactory
transduction’ (Fig. 5A and Table SXVI, Table SXVII, Table SXVIII, Table SXIX). Among the enriched pathways,
the B-cell receptor signalling pathway was associated with immune
function. To further investigate immune-related mechanisms in LUAD,
additional analyses of the tumour immune microenvironment were
performed. Compared with the LRG, the HRG exhibited significantly
lower stromal and ESTIMATE scores, whereas immune scores were
comparable between the two groups. By contrast, tumour purity was
significantly higher in the HRG (Fig.
5B). In both risk groups, T lymphocytes, particularly
CD8+ T cells, naïve CD4+ T cells and resting
CD4+ memory T cells, accounted for a substantial
proportion of the infiltrating immune cells (Fig. 5C). Significant differences in 11
immune cell populations were identified between the HRG and LRG
(P<0.05), including activated CD4+ memory T cells and
activated natural killer cells (Fig.
5D). Significant correlations were also observed between
activated dendritic cells and M1 macrophages (cor=−0.46,
P=2.572×10⁻²⁸) and between resting dendritic cells and
monocytes (cor=0.39, P=1.379×10⁻²⁰) (Fig. 5E). TIDE scores were subsequently
compared between the two groups. Violin plots showed significantly
higher TIDE scores in the HRG than in the LRG (P=0.0037) (Fig. 5F). Collectively, these findings
indicate that the HRG is characterized by a distinct immune
microenvironment, including altered immune cell infiltration
patterns, increased tumour purity and higher TIDE scores, which may
be associated with poorer clinical outcomes and a reduced
likelihood of response to immunotherapy.
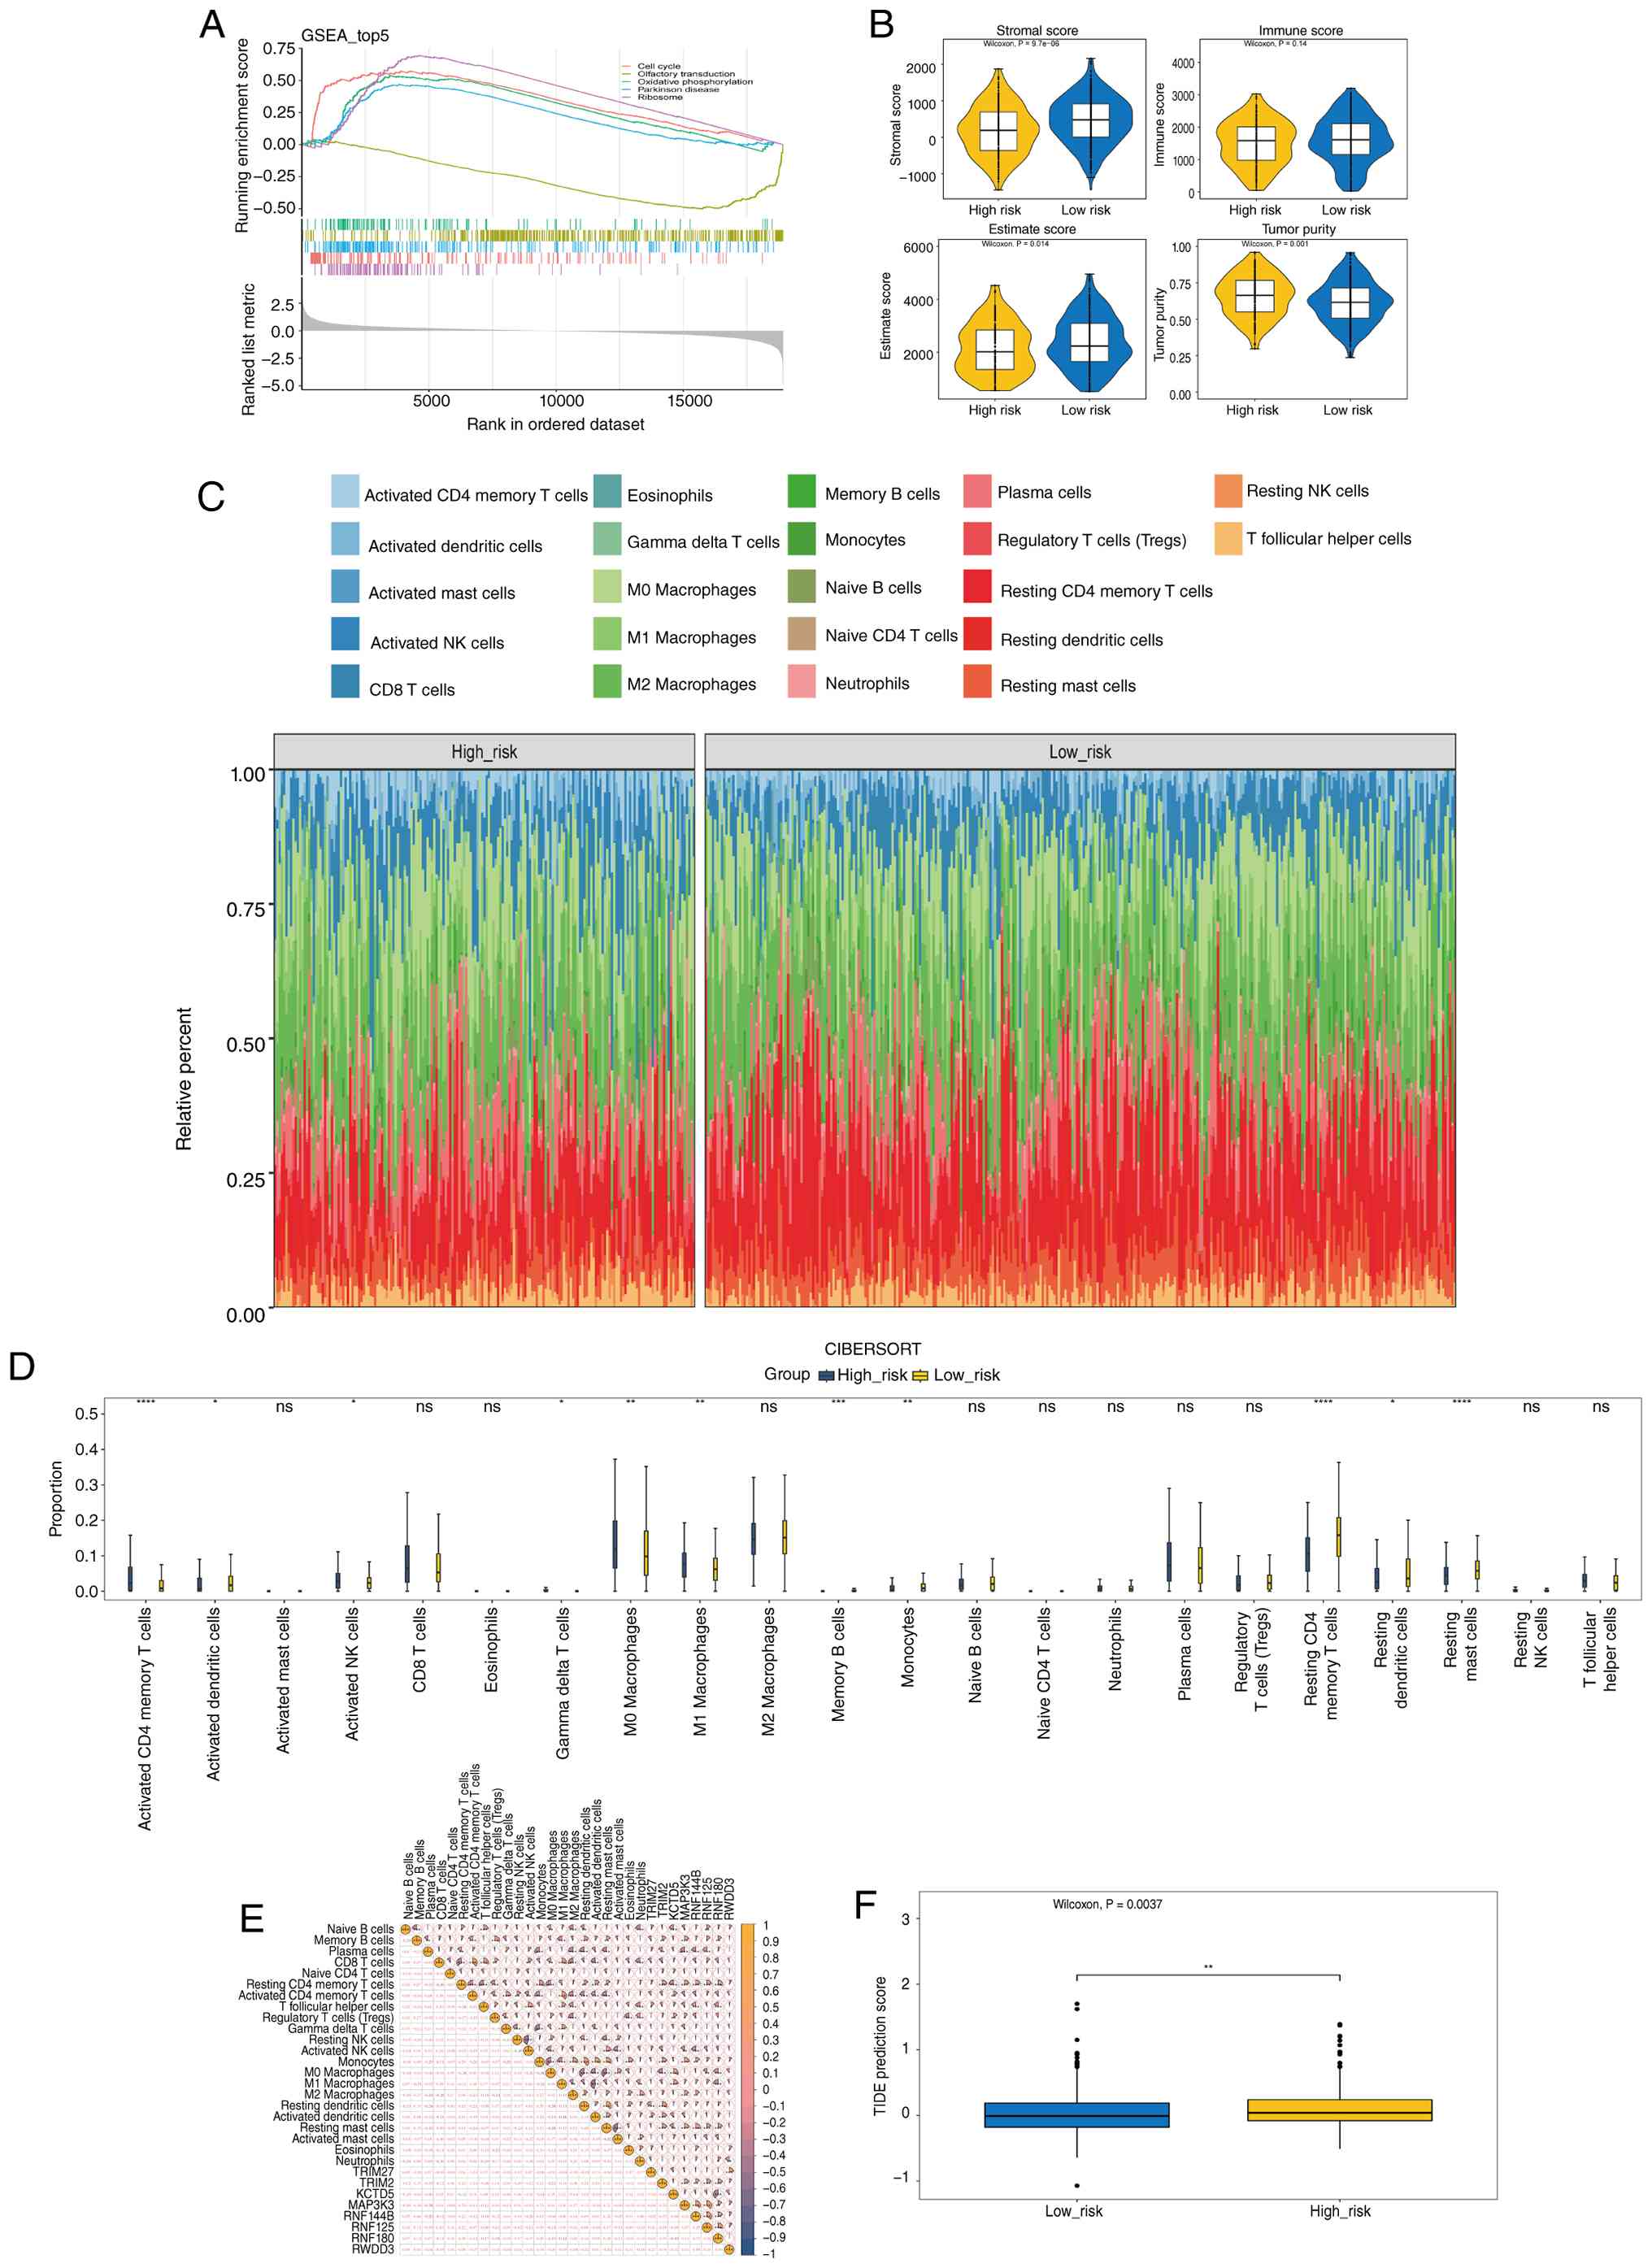 | Figure 5.Correlation between most immune
cells. (A) GSEA. The high- and low-risk groups are shown, where
each small vertical line on the X-axis represents a gene and the
Y-axis represents the enrichment score. Positive values indicate
that a certain functional gene set is enriched before the sorting
sequence, while negative values indicate that a certain functional
gene set is enriched after the sorting sequence. (B) TME-related
scores in the tumour microenvironment. Box plot comparing Stromal
score, Immune score, ESTIMATE score and Tumour purity in the high-
and low-risk groups. (C) Distribution of 22 types of immune cells
in the high-risk and low-risk groups, with each coloured grid
representing the content of immune cells in the sample. The left
represents the high-risk group and the right represents the
low-risk group. (D) Infiltration abundance of 22 immune cells in
high- and low-risk group samples. The dark blue box represents
low-risk patients and the red box represents high-risk patients.
(E) Immune differential cell correlation analysis. The lower
diagonal of the matrix represents the correlation and the upper
diagonal represents significance, where yellow represents a
positive correlation and blue a negative correlation, and the size
of the sector represents the absolute value of the correlation
coefficient. (F) TIDE scoring. Differences in TIDE scores between
the HRG and LRG were assessed using the Wilcoxon rank-sum test
(Mann-Whitney U-test). The horizontal axis represents the two risk
groups and the vertical axis represents TIDE scores. TIDE scores
were significantly higher in the HRG than in the LRG (P=0.0037).
*P<0.05; **P<0.01; ***P<0.001; ****P<0.0001. TIDE,
Tumour Immune Dysfunction and Exclusion; GSEA, gene set enrichment
analysis; NK, natural killer; ns, not significant. |
Gene mutation landscape and
differences in drug sensitivity
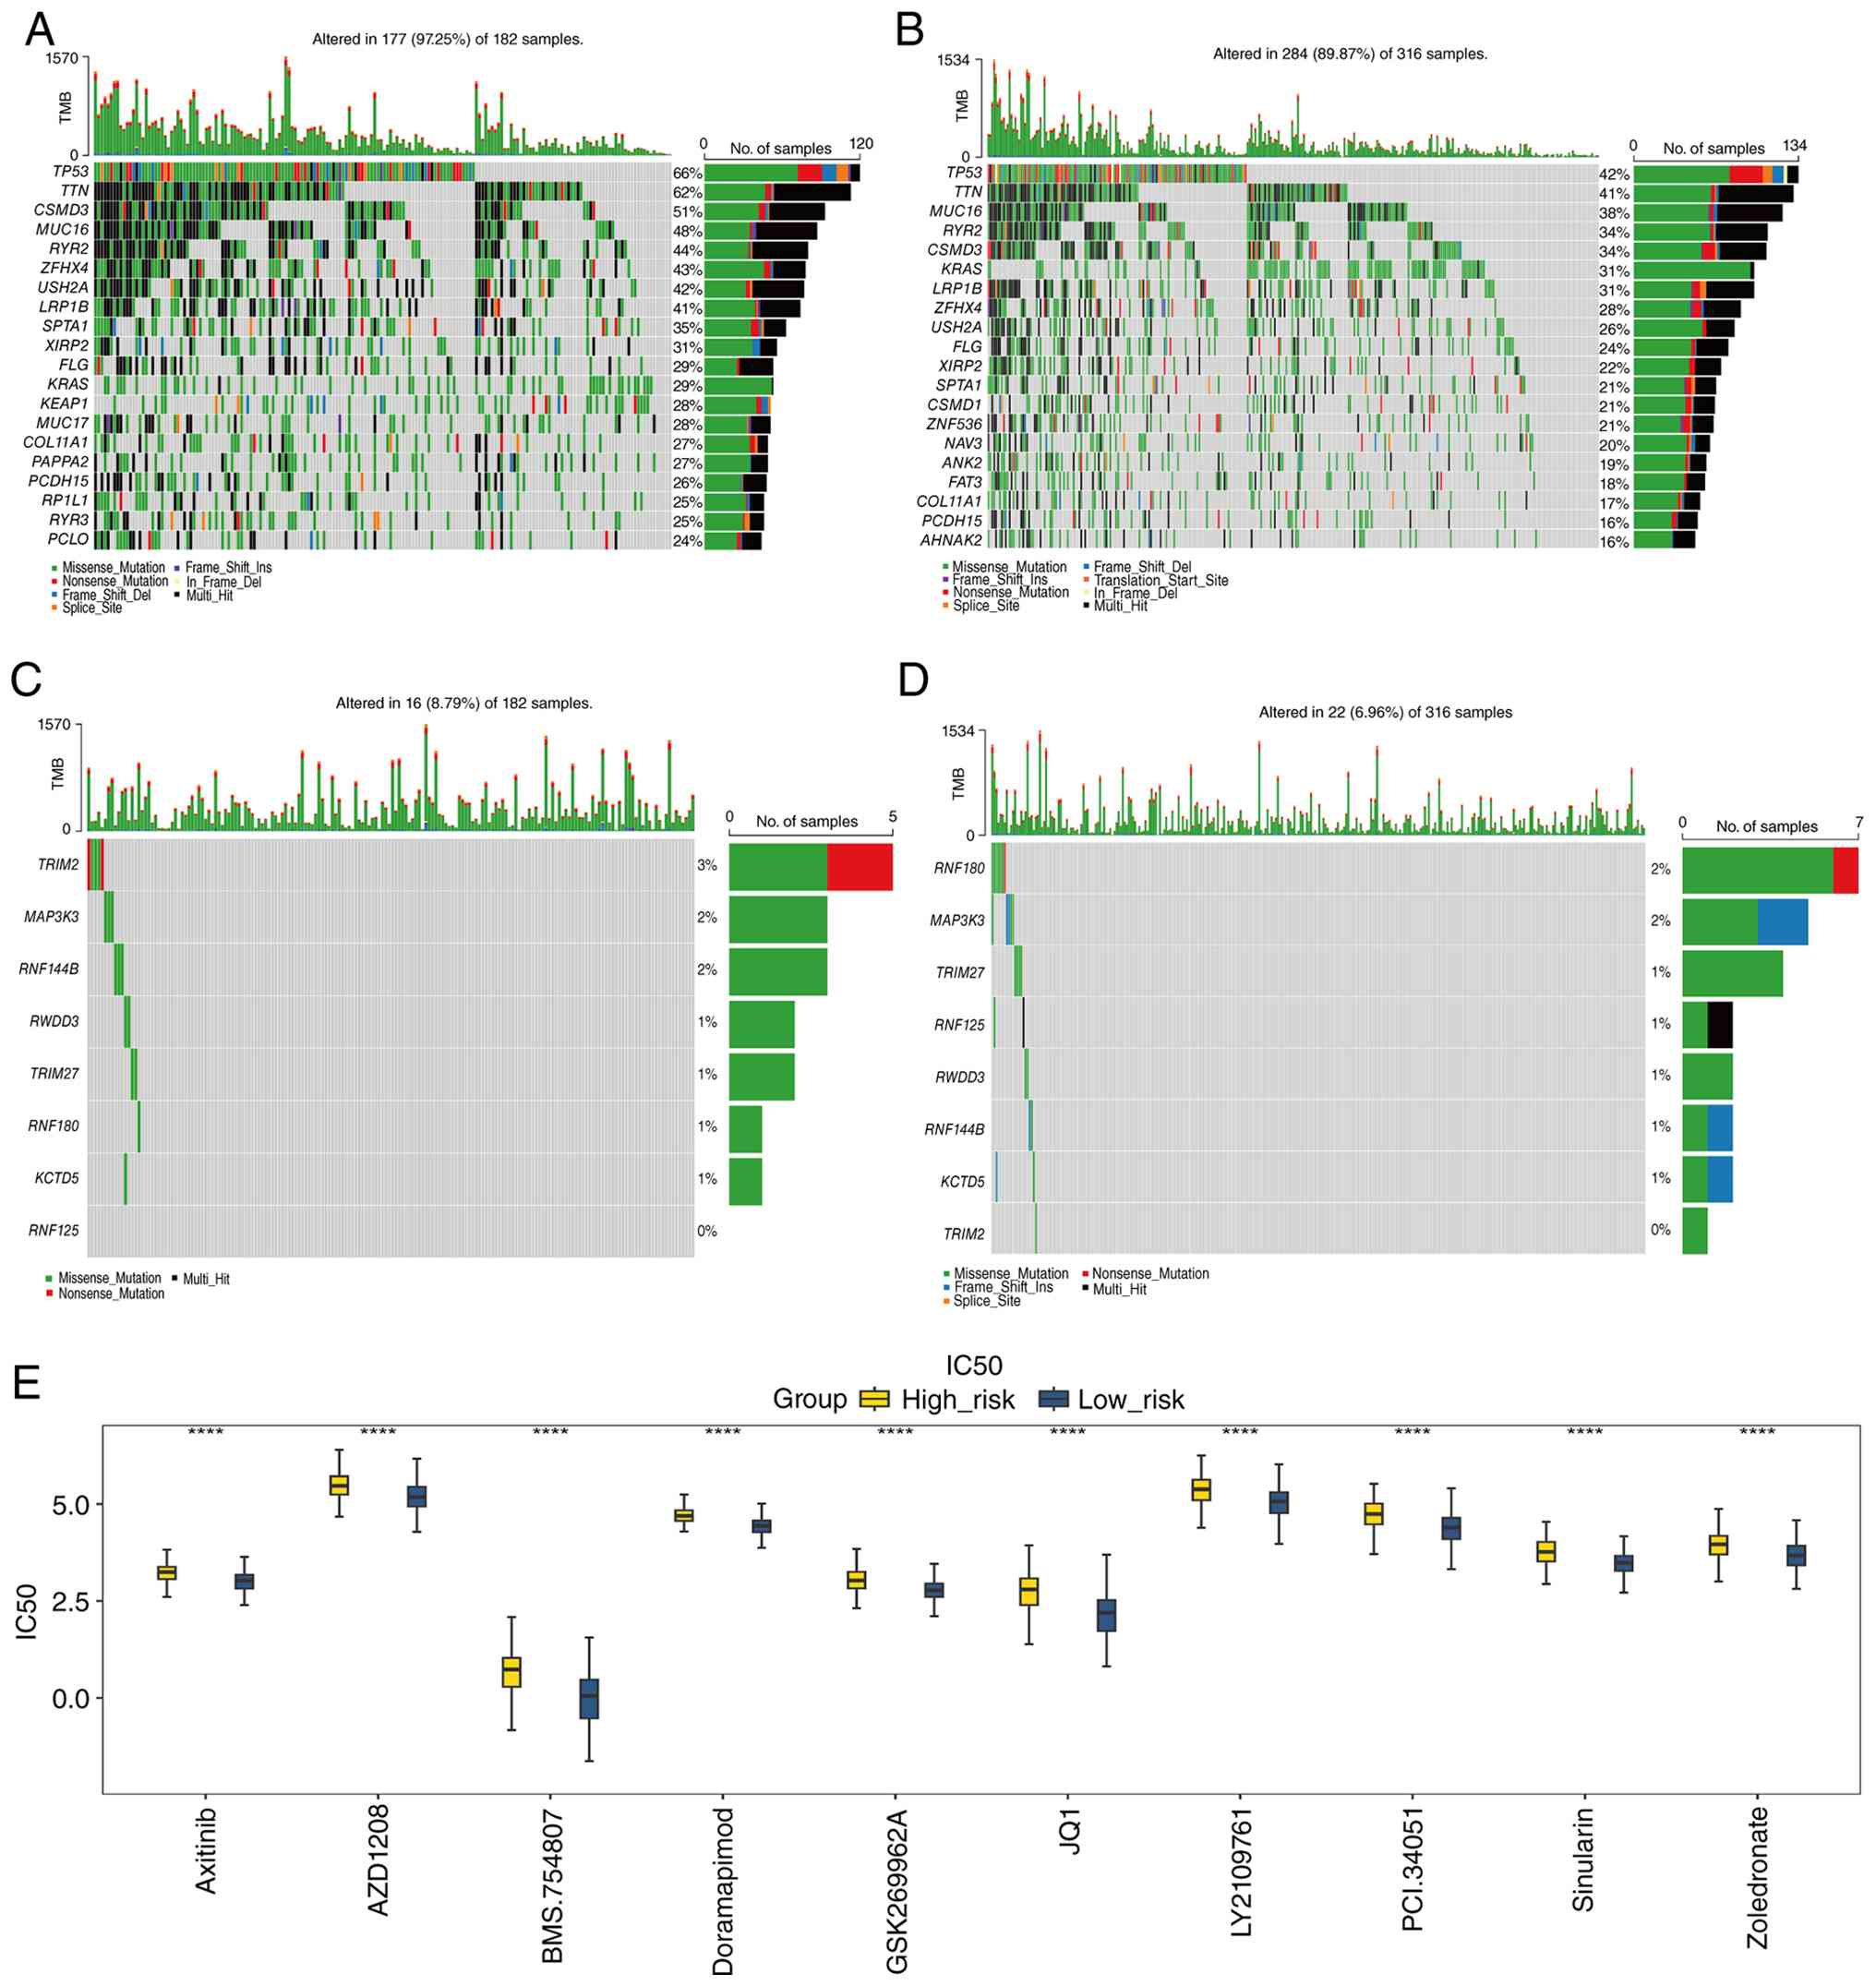
The mutational landscapes of the two risk groups
were systematically compared. Missense mutations represented the
predominant mutation type in both groups. In the HRG, the most
frequently mutated genes were TP53, TTN, CSMD3, MUC16 and
RYR2 (Fig. 6A). A similar
mutation pattern was observed in the LRG, in which TP53, TTN,
MUC16, RYR2 and CSMD3 had the highest mutation
frequencies (Fig. 6B). The mutation
profiles of the prognostic genes were also examined separately in
the HRG and LRG. TRIM2 showed the highest mutation frequency
in the HRG, including nonsense and missense mutations, whereas
RNF180 showed the highest mutation frequency in the LRG.
Missense mutations were the predominant mutation type among the
remaining prognostic genes in both groups (Fig. 6C and D). Drug sensitivity analysis
identified 125 agents with significantly different IC50
values between the HRG and LRG. To visualise the 10 drugs showing
the most significant differences between the two groups, box plots
were generated and ranked by P-value (P<0.0001). These drugs
included axitinib, AZD1208, BMS-754807 and doramapimod (Fig. 6E, Table
SXX). These findings highlight distinct molecular and
pharmacological characteristics between the two risk groups and may
provide potential clues for the development of precision treatment
strategies in LUAD.
Concordant expression of prognostic
genes in bioinformatics analyses and clinical samples
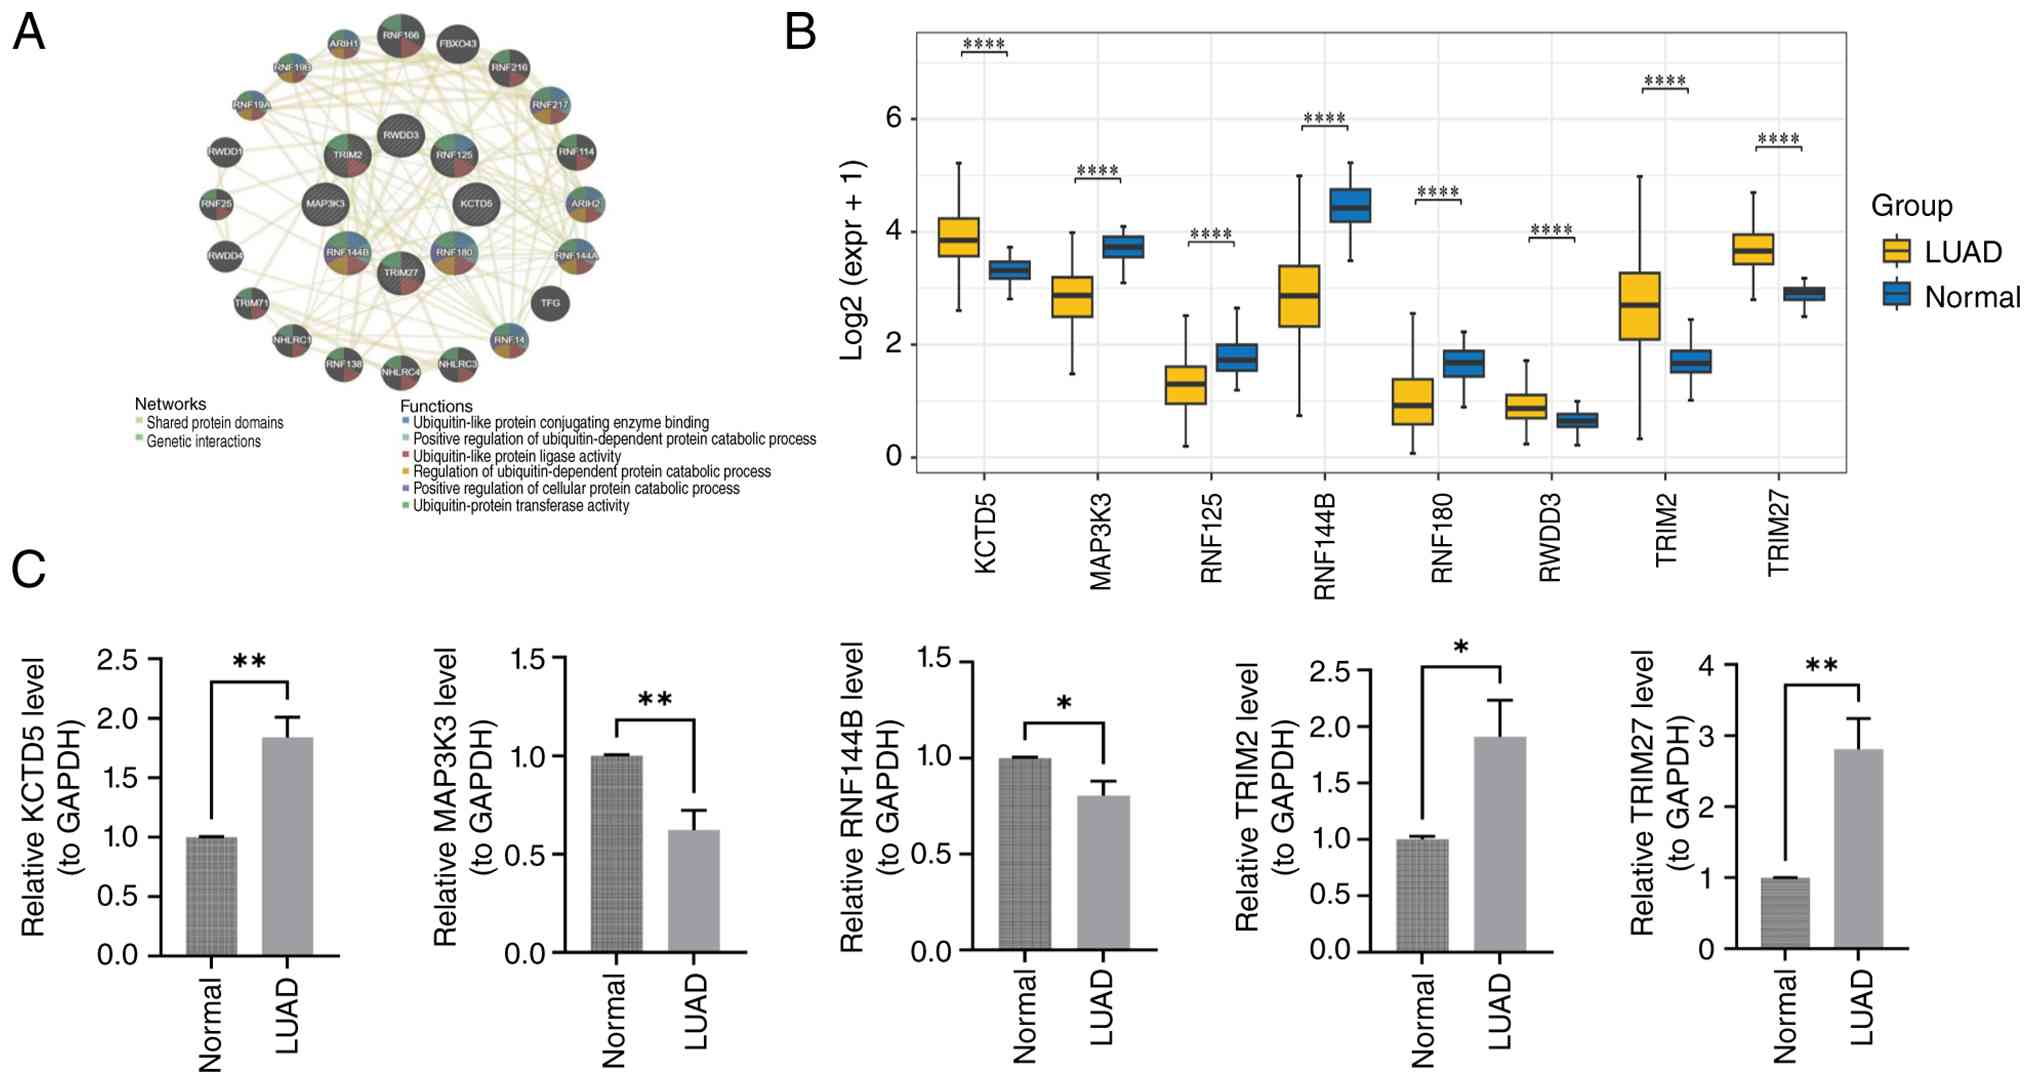
In the GeneMANIA network, the peripheral nodes
represented genes co-expressed with the prognostic genes, whereas
the central nodes represented the prognostic genes themselves. The
differently coloured blocks indicated functional categories
associated with these genes, such as ‘ubiquitin-like protein ligase
activity’ (Fig. 7A). In the
TCGA-LUAD cohort, expression analysis showed that KCTD5, RWDD3,
TRIM2 and TRIM27 were significantly upregulated in LUAD
tissues, whereas MAP3K3, RNF125, RNF144B and RNF180
were significantly downregulated (P<0.05; Fig. 7B). To validate the key prognostic
genes, five representative genes (KCTD5, MAP3K3, RNF144B,
TRIM2 and TRIM27) were selected for RT-qPCR validation
based on their significant differential expression in the TCGA-LUAD
cohort and their close association with LUAD progression reported
in previous studies. The remaining three genes (RNF180,
RNF125 and RWDD3) were not validated by RT-qPCR because
of limited clinical sample availability and unsuccessful primer
validation, although their differential expression was confirmed in
the TCGA-LUAD cohort. RT-qPCR was subsequently performed using 20
paired clinical samples. The clinicopathological characteristics of
the 20 patients are summarised in Table SII. Consistent with the
bioinformatics findings, KCTD5, TRIM2 and TRIM27 were
significantly upregulated in LUAD tissues, whereas MAP3K3
and RNF144B were significantly downregulated (P<0.05;
Fig. 7C). Thus, the expression
patterns observed in the clinical specimens were consistent with
those identified in the TCGA-LUAD cohort. These findings further
support the robustness of the prognostic gene signature and suggest
that these genes may contribute to LUAD progression, providing a
foundation for further investigation of the underlying molecular
mechanisms and potential therapeutic targets.
Discussion
LUAD is a major histological subtype of lung cancer
characterized by distinctive glandular differentiation and
papillary structures (15).
Surgical resection remains the cornerstone of treatment for
early-stage LUAD; however, its applicability is limited in advanced
disease. Once LUAD progresses to an advanced stage, the 5-year
survival rate falls <18%, reflecting its poor prognosis
(16). Therapeutic strategies
targeting ubiquitination in combination with T cell-related
immunotherapy have shown promising results in LUAD (17–19).
Therefore, clarifying the relationships among TRGs and URGs in LUAD
is of considerable importance, as it may improve our understanding
of disease mechanisms and contribute to more effective clinical
management. Unlike many bioinformatics-based studies that rely on a
single cohort, the present model was externally validated in the
independent GSE31210 cohort, supporting its generalizability beyond
the training dataset. The clinical utility of the nomogram was also
assessed using DCA, an evaluation that is often omitted from
prognostic model studies but is important for translational
relevance. The DCA showed that, within a limited threshold
probability range (0.3–0.5), the nomogram provided a modest
improvement in net clinical benefit compared with the risk score or
M stage alone. Although the incremental net benefit of the nomogram
over the risk score alone was modest, DCA remains a useful tool for
evaluating clinical utility. The modest improvement may still be
relevant in clinical settings where small absolute gains in net
benefit can translate to meaningful patient-level decisions.
In the present study, differential expression
analysis initially identified 9,580 genes that differed between
LUAD and normal tissues. Immune infiltration analysis combined with
WGCNA further identified 6,727 TRGs. In addition, 1,793 URGs were
obtained based on the study by Zhou et al (20). Intersection of these three gene sets
yielded 97 candidate genes associated with both T-cell biology and
ubiquitination in LUAD. GO and KEGG enrichment analyses showed that
these genes were predominantly involved in ubiquitin-mediated
proteasomal degradation, with significant enrichment in pathways
related to ubiquitin-mediated proteolysis. Further screening using
univariate Cox regression and LASSO analysis led to the
construction of an eight-gene prognostic model comprising
RNF180, MAP3K3, TRIM2, RNF125, RWDD3, RNF144B, KCTD5 and
TRIM27. RT-qPCR analysis subsequently confirmed that the
expression patterns of KCTD5, MAP3K3, RNF144B, TRIM2 and
TRIM27 in clinical specimens were consistent with those
observed in the training dataset, further supporting the potential
clinical relevance of the present findings.
RNF180, an E3 ubiquitin ligase located on
chromosome 5q, has been reported to exert tumour-suppressive
effects and was downregulated in LUAD in the present study,
consistent with its previously described antitumour role (21,22).
MAP3K3, a member of the MAPK family, regulates cellular
stress responses through the ERK, JNK and p38
signalling pathways (23). Aberrant
MAP3K3 expression has been reported in several malignancies,
including breast, cervical and esophageal cancers, and has been
associated with disease progression (24–26).
In lung cancer, MAP3K3 has been implicated in tumour
progression, although its prognostic significance remains
controversial (27,28).
TRIM2, a member of the TRIM family of E3
ubiquitin ligases, is highly expressed in lung cancer and has been
shown to promote tumour proliferation and metastasis (29,30).
Its oncogenic role has also been documented in pancreatic cancer
and other tumour types (31,32).
RNF125, a member of the RING-type E3 ubiquitin ligase family
located on chromosome 18, is significantly downregulated in lung
cancer. Reduced RNF125 expression has been associated with
metastasis, advanced tumour stage, and poor overall survival
(33).
RWDD3, also known as RSUME, is highly
expressed in lung cancer, where its upregulation has been reported
to promote metastasis (34). By
contrast, RNF144B (p53RFP) functions as an E3 ubiquitin
ligase with tumour-suppressive activity by activating p53 and
regulating p21-mediated apoptosis (35–38).
Reduced RNF144B expression in LUAD has been associated with
poor prognosis, enhanced proliferation and therapeutic resistance
(39–41). KCTD5, a member of the KCTD
protein family, is broadly expressed across multiple cancer types
and has been associated with clinical outcomes, the immune
microenvironment and cancer-associated fibroblast infiltration
(42–44). In LUAD specifically, KCTD5
has been proposed as a potential therapeutic target and diagnostic
biomarker (44).
TRIM27 is an E3 ubiquitin ligase that
regulates CD4+ T cell-mediated immunity and is
overexpressed in several malignancies, including lung, breast,
ovarian and endometrial cancers, where it promotes tumour invasion
and migration (45–49). These eight genes exhibit distinct
biological roles across different tumour types, and five have been
particularly closely associated with LUAD. In the present analysis,
KCTD5, RWDD3, TRIM2 and TRIM27 were significantly
upregulated in LUAD tissues, whereas MAP3K3, RNF125, RNF144B
and RNF180 were significantly downregulated compared with
normal tissues. RT-qPCR further confirmed that the expression
patterns of five selected genes (KCTD5, MAP3K3, RNF144B,
TRIM2 and TRIM27) in clinical specimens were consistent
with those observed in the training cohort.
To the best of our knowledge, the present study is
the first to integrate TRGs and URGs into a single prognostic model
for LUAD. Unlike previous studies that have examined immune
infiltration or post-translational modification separately, the
current dual-pathway approach captures the potential interplay
between adaptive immunity and the ubiquitin-mediated protein
degradation machinery, two biological processes that are frequently
dysregulated in LUAD. By integrating these biologically relevant
gene sets, the model not only enables effective risk stratification
but also provides a more comprehensive molecular characterization
of LUAD. This framework may also offer insights into combination
therapeutic strategies targeting both immune-regulatory mechanisms
and ubiquitination-related pathways.
GSEA was subsequently performed, revealing that the
top five enriched pathways were primarily associated with ribosomal
function, the cell cycle and related biological processes. These
pathways have been strongly implicated in tumour initiation and
progression in previous studies. In particular, cell cycle-related
genes are key drivers of LUAD tumourigenesis, consistent with
previous findings (50). The TME
also plays an important role in LUAD progression, as alterations in
its cellular and molecular composition can either promote or
suppress tumour development (51).
The immune status of the TME is particularly important for tumour
progression and therapeutic modulation of the TME through
immunotherapy can substantially improve patient prognosis and
survival (52). Immune cell
infiltration was therefore further investigated in the present
study. The LRG exhibited relatively greater T-cell infiltration. In
addition, activated dendritic cells were significantly negatively
correlated with M1 macrophages, whereas resting dendritic cells
were significantly positively correlated with monocytes. Previous
studies have shown that increased infiltration of CD8+ T
cells and activated CD4+ T cells can significantly
prolong survival in mouse models of LUAD (53). Consistent with these findings, the
present model revealed more pronounced T-cell infiltration in the
low-risk group.
Given the close association between the risk model
developed in the present study and immune infiltration, it was
further investigated whether the model may also provide information
on treatment sensitivity. Drug sensitivity was therefore compared
between the two risk groups. High-risk patients with LUAD exhibited
relatively higher IC50 values for agents such as
axitinib, BMS-754807 and AZD1208, suggesting lower sensitivity and
greater resistance to these drugs. Conversely, low-risk patients
may be more likely to respond to these agents. These findings
provide testable hypotheses for precision oncology. Clinical
studies have suggested that axitinib may have therapeutic potential
in lung cancer (54). In addition,
BMS-754807 has been reported to enhance the cytotoxic effects of
dasatinib in lung cancer (55),
while AZD1208 has demonstrated notable antitumour activity,
although its specific role in LUAD remains to be clarified
(56). Although these agents are
not currently standard treatments for LUAD, the current findings
suggest that risk-score-based stratification could potentially
inform the selection of targeted therapies in future clinical
trials. Such an approach may help bridge molecular risk prediction
and clinically relevant treatment selection. Nevertheless, several
limitations must be addressed before clinical translation. Most
notably, RT-qPCR validation was performed in only 20 paired
samples, limiting statistical power. In addition, protein-level
validation, such as immunohistochemistry (IHC) or western blotting,
and functional experiments, including gene knockdown or
overexpression, were not performed; therefore, the current findings
remain correlative. To address these limitations, additional
experiments are planned, including validation in larger cohorts,
protein-level analyses and in vitro functional studies.
These studies will help determine whether the observed associations
reflect direct regulatory mechanisms.
This risk model may have several potential clinical
applications. First, both the risk score and M stage were
identified as independent predictors of overall survival. When
incorporated into a nomogram, these factors yielded a modest
improvement in net clinical benefit within a limited threshold
probability range, as demonstrated by DCA. The model may therefore
help clinicians identify high-risk patients with LUAD who could
benefit from more intensive surveillance or consideration of
adjuvant treatment. Second, the drug sensitivity analysis showed
that high-risk patients were less sensitive to axitinib, AZD1208
and BMS-754807, whereas low-risk patients may be more likely to
benefit from these agents. Although these drugs are not currently
part of the standard LUAD treatment, the findings provide a
testable precision-oncology hypothesis in which risk-score
stratification could guide the selection of targeted agents in
future clinical trials. Third, the differential expression of
KCTD5, TRIM2, TRIM27, MAP3K3 and RNF144B was
confirmed in independent clinical samples, supporting their
potential value as prognostic biomarkers in LUAD. Although further
prospective validation is required, this model provides a
foundation for the development of more personalized treatment
strategies.
The current study has several limitations that
should be considered. First, RT-qPCR validation was performed using
only 20 paired LUAD and adjacent normal tissues. Although the
expression patterns were consistent with the bioinformatics
findings, the small sample size substantially limits the
statistical power and generalizability of the results. Second, the
present analysis was restricted to the mRNA level. Protein-level
validation using methods such as western blotting or IHC was not
performed, nor were functional experiments such as gene knockdown
or overexpression. Consequently, the associations involving the
prognostic genes should be interpreted as correlative rather than
causal. Third, all datasets used for model development and
validation were derived from retrospective public repositories.
Therefore, the clinical applicability of the model requires further
prospective validation in larger, multicentre patient cohorts.
These limitations are being addressed in ongoing work, including
expansion of the RT-qPCR validation cohort (planned n≥50 pairs), as
described above.
This prognostic model provides a basis for further
mechanistic and translational studies. To address the current lack
of protein-level and functional evidence, the following work is
planned: i) Perform IHC on an expanded cohort of LUAD tissue
microarrays (target n ≥100) to validate the protein expression of
key genes and examine their associations with clinical outcomes;
ii) conduct western blot analysis in LUAD and adjacent normal
tissues (n ≥30 pairs) to confirm differential expression at the
protein level; iii) perform gain- and loss-of-function experiments
in LUAD cell lines to determine how these genes influence cell
proliferation, migration and T cell-mediated immune regulation; and
iv) apply single-cell RNA sequencing to characterize the cell
type-specific roles of these genes within the TME. These studies
will help determine whether the observed associations reflect
direct regulatory mechanisms and may facilitate the identification
of novel therapeutic targets for LUAD.
In conclusion, in the present study, a robust
prognostic model integrating TRGs and URGs was developed, with
potential clinical value for risk stratification and personalized
treatment in LUAD. External validation and DCA further supported
the model's predictive potential, although the incremental net
benefit was modest and limited to a narrow threshold probability
range. This model may help identify high-risk patients who could
benefit from more intensive follow-up and may also provide a
framework for selecting targeted therapies according to predicted
drug sensitivity in future clinical studies.
Supplementary Material
Supporting Data
Supporting Data
Acknowledgements
Not applicable.
Funding
This work was supported by the Natural Science Foundation of
Gansu Province (grant no. 25JRRA588) and the Gansu Health Industry
Scientific Research Program (grant no. GSWSKY2021-061).
Availability of data and materials
The data generated in the present study may be
requested from the corresponding author.
Authors' contributions
DZ conceptualized the study, provided project
administration and supervision, and was involved in writing the
original draft, reviewing and editing the manuscript. HG performed
data curation and investigation and applied established
bioinformatics methods for data preprocessing, differential
expression analysis, WGCNA, LASSO regression and drug sensitivity
analysis. HL contributed to clinical sample collection, clinical
data acquisition and interpretation, and manuscript review and
editing. SZ was responsible for formal analysis and contributed to
patient recruitment, clinical sample collection and clinical data
acquisition and interpretation, and performed review and editing.
All authors read and approved the final manuscript. SZ and DZ
confirm the authenticity of all the raw data.
Ethics approval and consent to
participate
The present study was approved by the Medical
Ethics Committee of the Second Hospital of Lanzhou University
(Lanzhou, China; approval no. 2025A-648). All methods were
performed in accordance with the relevant guidelines and
regulations. Written informed consent was obtained from all
participants.
Patient consent for publication
Not applicable.
Competing interests
The authors declare that they have no competing
interests.
Use of artificial intelligence tools
During the preparation of this work, artificial
intelligence tools were used to improve the readability and
language of the manuscript or to generate images, and subsequently,
the authors revised and edited the content produced by the
artificial intelligence tools as necessary, taking full
responsibility for the ultimate content of the present
manuscript.
References
|
1
|
Siegel RL, Kratzer TB, Giaquinto AN, Sung
H, Miller KD and Jemal A: Cancer statistics, 2025. CA Cancer J
Clin. 75:10–45. 2025.PubMed/NCBI
|
|
2
|
Wei X, Li X, Hu S, Chen J and Cai R:
Regulation of ferroptosis in lung adenocarcinoma. Int J Mol Sci.
24:146142023. View Article : Google Scholar : PubMed/NCBI
|
|
3
|
Yu Y, Li L, Luo B, Chen D, Yin C, Jian C,
You Q, Wang J, Fang L, Cai D and Sun J: Predicting potential
therapeutic targets and small molecule drugs for early-stage lung
adenocarcinoma. Biomed Pharmacother. 174:1165282024. View Article : Google Scholar : PubMed/NCBI
|
|
4
|
Shen Y, Chen JQ and Li XP: Differences
between lung adenocarcinoma and lung squamous cell carcinoma:
Driver genes, therapeutic targets, and clinical efficacy. Genes
Dis. 12:1013742025. View Article : Google Scholar : PubMed/NCBI
|
|
5
|
Sun L, Su Y, Jiao A, Wang X and Zhang B: T
cells in health and disease. Signal Transduct Target Ther.
8:2352023. View Article : Google Scholar : PubMed/NCBI
|
|
6
|
Ashby KM and Hogquist KA: A guide to
thymic selection of T cells. Nat Rev Immunol. 24:103–117. 2024.
View Article : Google Scholar : PubMed/NCBI
|
|
7
|
Kumar BV, Connors TJ and Farber DL: Human
T cell development, localization, and function throughout life.
Immunity. 48:202–213. 2018. View Article : Google Scholar : PubMed/NCBI
|
|
8
|
Belk JA, Daniel B and Satpathy AT:
Epigenetic regulation of T cell exhaustion. Nat Immunol.
23:848–860. 2022. View Article : Google Scholar : PubMed/NCBI
|
|
9
|
Hershko A: Lessons from the discovery of
the ubiquitin system. Trends Biochem Sci. 21:445–449. 1996.
View Article : Google Scholar : PubMed/NCBI
|
|
10
|
Roberts JZ, Crawford N and Longley DB: The
role of ubiquitination in apoptosis and necroptosis. Cell Death
Differ. 29:272–284. 2022. View Article : Google Scholar : PubMed/NCBI
|
|
11
|
Zhou XJ, Li R, Liu X and Qu YQ: Advances
in deubiquitinating enzymes in lung adenocarcinoma. J Cancer.
12:5573–5588. 2021. View Article : Google Scholar : PubMed/NCBI
|
|
12
|
Zhong T, Lei K, Lin X, Xie Z, Luo S, Zhou
Z, Zhao B and Li X: Protein ubiquitination in T cell development.
Front Immunol. 13:9419622022. View Article : Google Scholar : PubMed/NCBI
|
|
13
|
Chen Z, Luo X, Lu Y, Zhu T, Wang J, Tsun A
and Li B: Ubiquitination signals critical to regulatory T cell
development and function. Int Immunopharmacol. 16:348–352. 2013.
View Article : Google Scholar : PubMed/NCBI
|
|
14
|
Livak KJ and Schmittgen TD: Analysis of
relative gene expression data using real-time quantitative PCR and
the 2(−Delta Delta C(T)) method. Methods. 25:402–408. 2001.
View Article : Google Scholar : PubMed/NCBI
|
|
15
|
Chen Q, Zheng X, Cheng W and Li J:
Landscape of targeted therapies for lung squamous cell carcinoma.
Front Oncol. 14:14678982024. View Article : Google Scholar : PubMed/NCBI
|
|
16
|
Bade BC and Dela Cruz CS: Lung cancer
2020: Epidemiology, etiology, and prevention. Clin Chest Med.
41:1–24. 2020. View Article : Google Scholar : PubMed/NCBI
|
|
17
|
Dai X, Lu L, Deng S, Wan C, Huang J, Sun
Y, Hu Y, Wu B, Wu G, Lovell JF, et al: USP7 targeting modulates
anti-tumor immune response by reprogramming tumor-associated
macrophages in lung cancer. Theranostics. 10:9332–9347. 2020.
View Article : Google Scholar : PubMed/NCBI
|
|
18
|
Jiang J, Chen H, Zhao C, Li T, Zhang C, Ma
L, Su H, Ma L, Duan Z, Si Q, et al: PRTN3 promotes
IL33/Treg-mediated tumor immunosuppression by enhancing the M2
polarization of tumor-associated macrophages in lung
adenocarcinoma. Cancer Lett. 616:2175842025. View Article : Google Scholar : PubMed/NCBI
|
|
19
|
Chai L, Pang LR, Li YT, Wang JH, Chen J,
Yuan ZG and Jin XF: Ubiquitin-driven regulation of immune
checkpoints in lung cancer: Mechanisms and therapeutic implications
(Review). Exp Ther Med. 32:2482026. View Article : Google Scholar : PubMed/NCBI
|
|
20
|
Zhou J, Xu Y, Lin S, Guo Y, Deng W, Zhang
Y, Guo A and Xue Y: iUUCD 2.0: An update with rich annotations for
ubiquitin and ubiquitin-like conjugations. Nucleic Acids Res.
46:D447–D453. 2018. View Article : Google Scholar : PubMed/NCBI
|
|
21
|
Ogawa M, Mizugishi K, Ishiguro A, Koyama
Y, Imai Y, Takahashi R, Mikoshiba K and Aruga J: Rines/RNF180, a
novel RING finger gene-encoded product, is a membrane-bound
ubiquitin ligase. Genes Cells. 13:397–409. 2008. View Article : Google Scholar : PubMed/NCBI
|
|
22
|
Ding Y, Lu Y, Xie X, Cao L and Zheng S:
Ring finger protein 180 suppresses cell proliferation and energy
metabolism of non-small cell lung cancer through downregulating
c-myc. World J Surg Oncol. 20:1622022. View Article : Google Scholar : PubMed/NCBI
|
|
23
|
Hu Q, Shen W, Huang H, Liu J, Zhang J,
Huang X, Wu J and Shi Y: Insight into the binding properties of
MEKK3 PB1 to MEK5 PB1 from its solution structure. Biochemistry.
46:13478–13489. 2007. View Article : Google Scholar : PubMed/NCBI
|
|
24
|
Fan Y, Ge N, Wang X, Sun W, Mao R, Bu W,
Creighton CJ, Zheng P, Vasudevan S, An L, et al: Amplification and
over-expression of MAP3K3 gene in human breast cancer promotes
formation and survival of breast cancer cells. J Pathol. 232:75–86.
2014. View Article : Google Scholar : PubMed/NCBI
|
|
25
|
Cao XQ, Lu HS, Zhang L, Chen LL and Gan
MF: MEKK3 and survivin expression in cervical cancer: Association
with clinicopathological factors and prognosis. Asian Pac J Cancer
Prev. 15:5271–5276. 2014. View Article : Google Scholar : PubMed/NCBI
|
|
26
|
Hasan R, Sharma R, Saraya A, Chattopadhyay
TK, DattaGupta S, Walfish PG, Chauhan SS and Ralhan R: Mitogen
activated protein kinase kinase kinase 3 (MAP3K3/MEKK3)
overexpression is an early event in esophageal tumorigenesis and is
a predictor of poor disease prognosis. BMC Cancer. 14:22014.
View Article : Google Scholar : PubMed/NCBI
|
|
27
|
He Y, Wang L, Liu W, Zhong J, Bai S, Wang
Z, Thomas DG, Lin J, Reddy RM, Ramnath RM, et al: MAP3K3 expression
in tumor cells and tumor-infiltrating lymphocytes is correlated
with favorable patient survival in lung cancer. Sci Rep.
5:114712015. View Article : Google Scholar : PubMed/NCBI
|
|
28
|
Zhao L, Ni X, Zhao L, Zhang Y, Jin D, Yin
W, Wang D and Zhang W: MicroRNA-188 acts as tumor suppressor in
non-small-cell lung cancer by targeting MAP3K3. Mol Pharm.
15:1682–1689. 2018. View Article : Google Scholar : PubMed/NCBI
|
|
29
|
Xiao M, Li J, Liu Q, He X, Yang Z and Wang
D: Expression and role of TRIM2 in human diseases. Biomed Res Int.
2022:94305092022. View Article : Google Scholar : PubMed/NCBI
|
|
30
|
Lin Z, Lin X, Zhu L, Huang J and Huang Y:
TRIM2 directly deubiquitinates and stabilizes Snail1 protein,
mediating proliferation and metastasis of lung adenocarcinoma.
Cancer Cell Int. 20:2282020. View Article : Google Scholar : PubMed/NCBI
|
|
31
|
Sun Q, Ye Z, Qin Y, Fan G, Ji S, Zhuo Q,
Xu W, Liu W, Hu Q, Liu M, et al: Oncogenic function of TRIM2 in
pancreatic cancer by activating ROS-related NRF2/ITGB7/FAK axis.
Oncogene. 39:6572–6588. 2020. View Article : Google Scholar : PubMed/NCBI
|
|
32
|
Hatakeyama S: TRIM family proteins: Roles
in autophagy, immunity, and carcinogenesis. Trends Biochem Sci.
42:297–311. 2017. View Article : Google Scholar : PubMed/NCBI
|
|
33
|
Yan Y, Kong X, Jin X, Bu J, Ni B, Rao Z,
Guo J and Xu S: RNA-binding protein MBNL1 regulates tumor growth,
chemosensitivity and antitumor immunity in lung adenocarcinoma by
controlling the expression of tumor suppressor RNF125. Oncol Rep.
54:742025. View Article : Google Scholar : PubMed/NCBI
|
|
34
|
Diao X, Guo C, Zheng H, Zhao K, Luo Y, An
M, Lin Y, Chen J, Li Y, Li Y, et al: SUMOylation-triggered ALIX
activation modulates extracellular vesicles circTLCD4-RWDD3 to
promote lymphatic metastasis of non-small cell lung cancer. Signal
Transduct Target Ther. 8:4262023. View Article : Google Scholar : PubMed/NCBI
|
|
35
|
Nakamura N: The role of the transmembrane
RING finger proteins in cellular and organelle function. Membranes
(Basel). 1:354–393. 2011. View Article : Google Scholar : PubMed/NCBI
|
|
36
|
Spratt DE, Walden H and Shaw GS: RBR E3
ubiquitin ligases: New structures, new insights, new questions.
Biochem J. 458:421–437. 2014. View Article : Google Scholar : PubMed/NCBI
|
|
37
|
Huang J, Xu LG, Liu T, Zhai Z and Shu HB:
The p53-inducible E3 ubiquitin ligase p53RFP induces p53-dependent
apoptosis. FEBS Lett. 580:940–947. 2006. View Article : Google Scholar : PubMed/NCBI
|
|
38
|
Benard G, Neutzner A, Peng G, Wang C,
Livak F, Youle RJ and Karbowski M: IBRDC2, an IBR-type E3 ubiquitin
ligase, is a regulatory factor for Bax and apoptosis activation.
EMBO J. 29:1458–1471. 2010. View Article : Google Scholar : PubMed/NCBI
|
|
39
|
Zhuang H, Zhang Z, Wang W and Qu H:
RNF144B-mediated p21 degradation regulated by HDAC3 contributes to
enhancing ovarian cancer growth and metastasis. Tissue Cell.
86:1022772024. View Article : Google Scholar : PubMed/NCBI
|
|
40
|
Wang P, Dai X, Jiang W, Li Y and Wei W:
RBR E3 ubiquitin ligases in tumorigenesis. Semin Cancer Biol.
67:131–144. 2020. View Article : Google Scholar : PubMed/NCBI
|
|
41
|
Ding H, Wang Y, Cui Y, Chen Z, Li Y, Yang
J, Yang Y, Chen T, Xia D, Li C, et al: Comprehensive analysis of
the expression and prognosis for RBR E3 ubiquitin ligases in lung
adenocarcinoma. Thorac Cancer. 13:2459–2472. 2022. View Article : Google Scholar : PubMed/NCBI
|
|
42
|
Liao Y, Sloan DC, Widjaja JH and Muntean
BS: KCTD5 forms hetero-oligomeric complexes with various members of
the KCTD protein family. Int J Mol Sci. 24:143172023. View Article : Google Scholar : PubMed/NCBI
|
|
43
|
Shi YX, Yan JH, Liu W and Deng J:
Identifies KCTD5 as a novel cancer biomarker associated with
programmed cell death and chemotherapy drug sensitivity. BMC
Cancer. 23:4082023. View Article : Google Scholar : PubMed/NCBI
|
|
44
|
Shi YX, Zhang WD, Dai PH, Deng J and Tan
LH: Comprehensive analysis of KCTD family genes associated with
hypoxic microenvironment and immune infiltration in lung
adenocarcinoma. Sci Rep. 12:99382022. View Article : Google Scholar : PubMed/NCBI
|
|
45
|
Cai X, Srivastava S, Sun Y, Li Z, Wu H,
Zuvela-Jelaska L, Li J, Salamon RS, Backer JM and Skolnik EY:
Tripartite motif containing protein 27 negatively regulates
CD4+ T cells by ubiquitinating and inhibiting the class
II PI3K-C2β. Proc Natl Acad Sci USA. 108:20072–20077. 2011.
View Article : Google Scholar : PubMed/NCBI
|
|
46
|
Iwakoshi A, Murakumo Y, Kato T, Kitamura
A, Mii S, Saito S, Yatabe Y and Takahashi M: RET finger protein
expression is associated with prognosis in lung cancer with
epidermal growth factor receptor mutations. Pathol Int. 62:324–330.
2012. View Article : Google Scholar : PubMed/NCBI
|
|
47
|
Tezel GG, Uner A, Yildiz I, Guler G and
Takahashi M: RET finger protein expression in invasive breast
carcinoma: Relationship between RFP and ErbB2 expression. Pathol
Res Pract. 205:403–408. 2009. View Article : Google Scholar : PubMed/NCBI
|
|
48
|
Ma Y, Wei Z, Bast RC Jr, Wang Z, Li Y, Gao
M, Liu Y and Wang X, Guo C, Zhang L and Wang X: Downregulation of
TRIM27 expression inhibits the proliferation of ovarian cancer
cells in vitro and in vivo. Lab Invest. 96:37–48. 2016. View Article : Google Scholar : PubMed/NCBI
|
|
49
|
Tsukamoto H, Kato T, Enomoto A, Nakamura
N, Shimono Y, Jijiwa M, Asai N, Murakumo Y, Shibata K, Kikkawa F
and Takahashi M: Expression of Ret finger protein correlates with
outcomes in endometrial cancer. Cancer Sci. 100:1895–1901. 2009.
View Article : Google Scholar : PubMed/NCBI
|
|
50
|
Zhao S, Han X, Huang J, Zheng J, Zhao B
and Liang Z: DCUN1D5 is a prognostic biomarker and correlated with
immune infiltrates and glycolysis in lung adenocarcinoma. Sci Rep.
15:4032025. View Article : Google Scholar : PubMed/NCBI
|
|
51
|
Hu F, Hu C, He Y, Sun Y, Han C, Zhang X,
Yu L, Shi D, Sun Y and Zhang J: TLR7: A key prognostic biomarker
and immunotherapeutic target in lung adenocarcinoma. Biomedicines.
13:1512025. View Article : Google Scholar : PubMed/NCBI
|
|
52
|
Zeng Z, Li J, Zhang J, Li Y, Liu X, Chen
J, Huang Z, Wu Q, Gong Y and Xie C: Immune and stromal scoring
system associated with tumor microenvironment and prognosis: A
gene-based multi-cancer analysis. J Transl Med. 19:3302021.
View Article : Google Scholar : PubMed/NCBI
|
|
53
|
Cui C, Wang J, Fagerberg E, Chen PM,
Connolly KA, Damo M, Cheung JF, Mao T, Askari AS, Chen S, et al:
Neoantigen-driven B cell and CD4+ T follicular helper cell
collaboration promotes anti-tumour CD8+ T cell
responses. Cell. 184:6101–6118.e13. 2021. View Article : Google Scholar : PubMed/NCBI
|
|
54
|
Galffy G, Lugowska I, Poddubskaya E, Cho
BC, Ahn MJ, Han JY, Su WC, Hauke RJ, Dyar SH, Lee DH, et al: A
phase II open-label trial of avelumab plus axitinib in previously
treated non-small-cell lung cancer or treatment-naïve,
cisplatin-ineligible urothelial cancer. ESMO Open. 8:1011732023.
View Article : Google Scholar : PubMed/NCBI
|
|
55
|
Zhang C, Zhao X, Wang Z, Gong T, Zhao H,
Zhang D, Niu Y, Li X, Zhao X, Li G, et al: Dasatinib in combination
with BMS-754807 induces synergistic cytotoxicity in lung cancer
cells through inhibiting lung cancer cell growth, and inducing
autophagy as well as cell cycle arrest at the G1 phase. Invest New
Drugs. 41:438–452. 2023. View Article : Google Scholar : PubMed/NCBI
|
|
56
|
Trigg RM, Lee LC, Prokoph N, Jahangiri L,
Reynolds CP, Burke GA, Probst NA, Han M, Matthews JD, Lim HK, et
al: The targetable kinase PIM1 drives ALK inhibitor resistance in
high-risk neuroblastoma independent of MYCN status. Nat Commun.
10:54282019. View Article : Google Scholar : PubMed/NCBI
|