Introduction
Stomach adenocarcinoma (STAD) is a common malignant
tumor of the digestive system, characterized by high incidence and
mortality rates worldwide. This disease ranks as the fifth leading
cause of cancer-related mortality globally (1). Gastric cancer accounts for nearly one
million new cases annually worldwide, resulting in >650,000
mortalities (2). China accounts for
70 and 50% of all newly diagnosed cases of cardia and non-cardia
gastric cancer, respectively. The predominant histological subtype
is poorly differentiated (including poorly differentiated and
moderately-poorly differentiated), accounting for 73.35% of cases.
In total, ~50% patients present with already advanced-stage disease
(stage III or IV) at initial diagnosis, which not only poses
substantial challenges to the patient but also leads to a
diminished quality of life and imposes a considerable economic
burden on healthcare systems (3).
Current treatment modalities for STAD primarily encompass surgical
intervention, chemotherapy, radiotherapy and Traditional Chinese
Medicine therapy. However, these strategies are frequently
constrained by difficulties in early diagnosis and the necessity
for personalized treatment approaches (4–8).
Consequently, there exists an urgent need to identify and develop
suitable novel biomarkers that can enhance prognostic accuracy and
inform therapeutic decision-making in STAD.
Family with sequence similarity 20 member A
(FAM20A) was originally identified in mouse hematopoietic
cells (9). Due to the substitution
of the conserved glutamic acid at position 258 of human FAM20A to
glutamine, which lacks a negatively charged side chain, human
FAM20A does not have all the necessary catalytically active amino
acids that human FAM20C possesses. Consequently, FAM20A is
considered to be a pseudo-kinase (10,11).
Previous investigations on FAM20A have predominantly concentrated
on the positive regulation of osteogenesis and osteogenic
differentiation (12–14). In addition, it has been demonstrated
that FAM20A is involved in the development and progression
of lung squamous cell carcinoma (negative correlation with DNA
repair proteins may drive radiotherapy resistance) and papillary
thyroid carcinoma (highly expressed in tumor cells) (15,16).
However, to the best of our knowledge, the specific role of
FAM20A in STAD remains to be fully elucidated.
The specific objectives of the present investigation
were to examine the expression profiles of FAM20A across
various types of cancer, evaluate the association between
FAM20A expression and clinical outcomes and explore its
functional implications in the context of tumor behavior and the
immune microenvironment. By focusing on these objectives, the study
sought to provide insights into the intricate relationship between
FAM20A and cancer biology, whilst exploring its potential
application in clinical settings. The present experimental
validation utilized cell culture models to confirm the
bioinformatics findings and identify the underlying mechanisms.
Materials and methods
Gene expression and dataset
acquisition
Initially, the distribution of FAM20A across
various human tissues and organs was determined by accessing the
Human Protein Atlas (HPA) database (https://www.proteinatlas.org/). RNA sequencing data
were downloaded for bladder urothelial carcinoma (BLCA), breast
cancer (BRCA), cervical cancer (17), cholangiocarcinoma (CHOL), colorectal
adenocarcinoma (COAD), esophageal carcinoma (ESCA), glioblastoma
multiforme (GBM), head and neck squamous cell carcinoma (HNSC),
kidney chromophobe (KICH), kidney clear cell carcinoma (KIRC),
kidney papillary cell carcinoma (KIRP), liver hepatocellular
carcinoma (LIHC), lung adenocarcinoma (LUAD), lung squamous cell
carcinoma (LUSC), prostate adenocarcinoma (PAAD), pheochromocytoma
and paraganglioma (PCPG), prostate cancer (PRAD), rectal
adenocarcinoma (READ), stomach adenocarcinoma (STAD), thyroid
cancer (THCA) and uterine corpus endometrioid carcinoma (UCEC) from
The Cancer Genome Atlas (TCGA) database (https://portal.gdc.cancer.gov) in TPM format, along
with corresponding clinical information. The following TCGA data
screening protocol was used: Search terms used in the TCGA/GDC
portal were the individual project codes ‘TCGA-BLCA’, ‘TCGA-BRCA’,
‘TCGA-CESC’, ‘TCGA-CHOL’, ‘TCGA-COAD’, ‘TCGA-ESCA’, ‘TCGA-GBM’,
‘TCGA-HNSC’, ‘TCGA-KICH’, ‘TCGA-KIRC’, ‘TCGA-KIRP’, ‘TCGA-LIHC’,
‘TCGA-LUAD’, ‘TCGA-LUSC’, ‘TCGA-PAAD’, ‘TCGA-PCPG’, ‘TCGA-PRAD’,
‘TCGA-READ’, ‘TCGA-STAD’, ‘TCGA-THCA’, and ‘TCGA-UCEC’, together
with the filters ‘RNA-Seq’ and ‘Gene Expression Quantification’.
Criteria for screening datasets for download were as follows: i)
Inclusion of the aforementioned cancer types; ii) availability of
RNA-seq gene expression data in TPM format; iii) availability of
matched clinical information; iv) retention of samples with both
expression and clinical data; and v) exclusion of samples with
missing expression values or missing clinical annotation. Only
datasets meeting these criteria were used for downstream
analysis.
In addition, expression data were acquired from the
Genotype-Tissue Expression project (GTEx; http://www.gtexportal.org/) for normal tissues to
facilitate comparisons with tumor samples. The following GTEx data
screening protocol was used: Search terms used in the GTEx portal
were ‘GTEx’, ‘RNA-seq’, ‘gene expression’, ‘gene-level’, ‘TPM’, and
‘V8’. Criteria for screening datasets for download were as follows:
i) Normal tissue samples with available RNA-seq data; ii)
gene-level expression data available in TPM format; iii)
availability of sample metadata, including tissue type and donor
information; iv) retention of samples with both expression data and
tissue annotation; and v) exclusion of samples with missing
expression values or missing tissue annotation. Only datasets
meeting these criteria were used for downstream analysis. Prior to
conducting further analyses, log2(TPM +1) transformation
was performed on all transcriptomic data to reduce the skewness of
the data and enhance their robustness. This transformation is
commonly employed to normalize gene expression data, reduce data
skewness, stabilize variance and improve suitability for subsequent
parametric statistical tests (such as the Wilcoxon rank-sum
test).
For statistical analysis, R (version 4.2.2;
http://www.r-project.org/) and the
‘ggplot2’ package (v3.5.2, http://ggplot2.tidyverse.org) were applied to evaluate
the expression levels of FAM20A across various tumor types,
using median expression levels as thresholds for differential
expression analysis. The Wilcoxon rank-sum test was utilized to
evaluate differences in expression between tumor and normal
tissues.
Survival analysis
In the present study, survival analyses were also
conducted using TCGA data only to investigate the impact of
FAM20A expression on various tumor outcomes. Utilizing the
‘survival’ package (v3.5–7, http://cran.r-project.org/web/packages/survival/index.html)in
R, Kaplan-Meier analysis was performed for adrenocortical cancer
(10), BLCA, BRCA, CESC, CHOL,
COAD, large B-cell lymphoma (DLBC), ESCA, GBM, HNSC, KICH, KIRC,
KIRP, acute myeloid leukemia (LAML), lower grade glioma (LGG),
LIHC, LUAD, LUSC, mesothelioma (MESO), ovarian cancer (11), PAAD, PCPG, PRAD, READ, sarcoma
(SARC), skin cutaneous melanoma (SKCM), STAD, testicular germ cell
tumors (TGCT), THCA, thymoma (THYM), UCEC, uterine carcinosarcoma
(UCS) and uveal melanoma (UVM). Cox regression was employed to
compare overall survival (OS, time from diagnosis to mortality from
any cause or last follow-up), disease-specific survival (DSS, time
from diagnosis to mortality attributable to the specific cancer or
last follow-up) and the progression-free interval (PFI, time from
diagnosis to disease progression or mortality from any cause,
whichever occurred first) between high-expression and
low-expression groups of FAM20A. In addition, clinical
information was integrated from patients with STAD in TCGA database
to analyze differences in OS, DSS and PFI among all patients with
STAD, in addition to patients with different clinical stages of
STAD. Factors with samples meeting the preset P-value threshold
(P<0.05) in the univariate analysis were included in the
construction of the multivariate Cox regression model. The
‘survival’ package was utilized for proportional hazards assumption
tests and fitting survival regression models, whilst the
‘survminer’ (v0.4.9, http://cran.r-project.org/package=survminer) and
‘ggplot2’ packages were employed for visualization.
Functional enrichment analysis and
gene set enrichment analysis (GSEA)
To identify genes associated with the expression
levels of FAM20A, FAM20A expression data from patients with
STAD in TCGA database were extracted. Pearson pairwise correlation
analyses were performed between FAM20A and all other genes
profiled in TCGA dataset. The top 30 correlated genes were then
visualized using the ‘ggplot2’ package. In addition, the top 150
positively correlated genes and the top 150 negatively correlated
genes identified by screening were subjected to Gene Ontology
(11) and Kyoto Encyclopedia of
Genes and Genomes (KEGG) pathway enrichment analyses utilizing the
‘ClusterProfiler’ package (v4.14.4; http://www.bioconductor.org/packages/release/bioc/html/clusterProfiler.html)
in R, with ID conversion facilitated by the ‘R-org.Hs.eg.db’
package (v3.20.0; http://www.bioconductor.org/packages/release/data/annotation/html/org.Hs.eg.db.html).
Following this, the ‘clusterProfiler’ package was used to perform
GSEA on all molecules selected by correlation analysis after their
IDs had been converted. Data arising from the GO, KEGG and GSEA
analyses were visualized by the ‘ggplot2’ package.
Immune cell infiltration analysis
To comprehensively evaluate the tumor immune
microenvironment and its association with FAM20A expression, the
‘estimate’ package (version 1.0.13) (18) in R was first used to calculate
stromal cell scores (quantifies the extent of stromal cell
infiltration in a tumor sample based on the ssGSEA enrichment score
of a predefined stromal gene signature), immune cell scores
(quantifies the extent of immune cell infiltration in a tumor
sample based on the ssGSEA enrichment score of a predefined immune
gene signature) and tumor purity (calculated as the sum of the
StromalScore and ImmuneScore and represents the overall level of
stromal and immune cell infiltration in the tumor microenvironment)
across 33 cancer types (BLCA, BRCA, CESC, CHOL, COAD, DLBC, ESCA,
GBM, HNSC, KICH, KIRC, KIRP, LAML, LGG, LIHC, LUAD, LUSC, MESO, OV,
PAAD, PCPG, PRAD, READ, SARC, SKCM, STAD, TGCT, THCA, THYM, UCEC,
UCS and UVM), where the correlations among these three
immunerelated metrics and FAM20A expression were then examined in
each cancer type. Subsequently. focusing on STAD, two complementary
algorithms were applied to quantify the infiltration levels of a
range of immune cell subtypes and assess their correlation with
FAM20A expression. The ssGSEAalgorithm [implemented in the R
package ‘GSVA’ (version 1.46.0) (19)/] was used to evaluate the enrichment
scores of 24 immune cell types [activated dendritic cells (aDC), B
cells, CD8+ T cells, cytotoxic cells, DCs, eosinophils, immature
DCs (iDC), macrophages, mast cells, neutrophils, natural killer
(NK) CD56bright cells, NK CD56dim cells, NK cells, plasmacytoid DCs
(pDC), T cells, T helper (Th) cells, T central memory (Tcm), T
effector memory (Tem), T follicular helper (TFH) and γδT cells
(Tgd), Th1 cells, Th17 cells, Th2 cells and T-regulatory cells
(Tregs)].
The CIBERSORT algorithm (based on immune cell
markers from the CIBERSORTx website; http://cibersortx.stanford.edu/) was used to estimate
the relative proportions of 22 immune cell subtypes (naïve B cells,
memory B cells, plasma cells, CD8+ T cells, naïve CD4+ T cells,
resting memory CD4+ T cells, activated memory CD4+ T cells, TFH,
Tregs, Tgd, resting NK cells, activated NK cells, monocytes,
macrophages M0, macrophages M1, macrophages M2, resting DCs, aDC,
resting mast cells, activated mast cells, eosinophils and
neutrophils) in tumor tissue. Subsequently, the ‘survival’ module
in the TIMER database (https://cistrome.shinyapps.io/timer) was utilized to
evaluate the specific relationship between OS and the abundance of
six immune cell types (B cells, CD4+ T cells, CD8+ T cells,
neutrophils, macrophages and DCs) in patients with STAD, where
additionally generated Kaplan-Meier survival curves were used to
visualize the differences in OS according to immune infiltration
levels and FAM20A expression.
Cell culture and overexpression of
FAM20A
The STAD cell line HGC-27 (National Collection of
Authenticated Cell Cultures) was grown in DMEM (Wisent
Biotechnology) containing 10% FBS (Cegrogen Biotech GmbH). HGC-27
cells were cultured in a humidified incubator at 37°C with an
atmosphere containing 5% CO2. FAM20A
overexpression was achieved by the transfection of a FAM20A
overexpression lentivirus (cat. no. D02001, Genepharma Co., Ltd).
The lentiviral vector contained the full-length FAM20A cDNA
sequence (GenBank accession no. NM_017565.4; nucleotides 702–2,327;
corresponding to transcript variant 1). An empty lentiviral vector
[LV5(EF-1a/GFP&Puro)] was used as a negative control. To induce
FAM20A overexpression, HGC-27 cells at 30–50% confluence
were transfected with lentivirus (MOI=20) containing a control
vector or lentivirus overexpressing FAM20A following the
manufacturer's protocol. The time period between lentiviral
transduction and subsequent assays was 48 h.
Total RNA was extracted using a Super FastPure Cell
RNA Isolation Kit (Vazyme Biotech Co., Ltd.), where 1 µg RNA was
reverse transcribed into cDNA by using HiScript IV All-in-One Ultra
RT SuperMix for quantitative PCR (qPCR; Vazyme Biotech Co., Ltd.).
The reverse transcription (5)
reaction system was as follows: 4X All-in-One Ultra qRT SuperMix (5
µl), template RNA (1 µg of total RNA) and RNase-free ddH2O added to
a final volume of 20 µl. The RT conditions were as follows: 50°C
for 5 min, followed by 85°C for 5 sec. qPCR was performed using Taq
Pro Universal SYBR qPCR Master Mix (Vazyme Biotech Co., Ltd.) with
specific primers for FAM20A with GAPDH as the internal control.
Primers for FAM20A (forward, 5′-CAACTTTTCCCGAACCGAGC-3′ and
reverse, 5′-TGTGAAGCACCTCCCAGAAG-3′) and GAPDH (forward,
5′-AATGGGCAGCCGTTAGGAAA-3′ and reverse, 5′-GCGCCCAATACGACCAAATC-3′)
were used for qPCR. The qPCR reaction system was as follows: 2X Taq
Pro Universal SYBR qPCR Master Mix (10.0 µl), primer 1 (10 µM, 0.4
µl), primer 2 (10 µM, 0.4 µl), template DNA/cDNA (1 µl), and
ddH2O was added to a final volume of 20 µl. The qPCR
cycling conditions were as follows: Stage 1 (pre-denaturation) at
95°C for 30 sec, 1 cycle; stage 2 (cycling reaction) at 95°C for
3–10 sec and 60°C for 10–30 sec, 40 cycles; stage 3 (melt curve)
using the default melt curve acquisition program of the instrument.
qPCR was performed on an ABI VIIA 7 real-time PCR system (Applied
Biosystems; Thermo Fisher Scientific, Inc.). Relative expression
was calculated using the 2−ΔΔCq method (20).
Cell proliferation assay
The number of viable cells was determined by the
Cell Counting Kit-8 assay (Vazyme Biotech Co., Ltd). For this,
2,000 cells per well were seeded into 96-well plates for 24 h,
followed by the addition of 10 µl CCK-8 solution to each well. The
plates were then incubated at 37°C for 2 h, followed by measurement
of the optical density at 450 nm using a Synergy NEO microplate
reader (BioTek; Agilent Technologies, Inc.). For each condition,
three technical replicate wells were used, and the experiment was
repeated three times independently.
Wound-healing assay
HGC-27 cells were seeded into 6-well plates and
cultured until they reached confluence, forming a monolayer. A
straight line was then drawn at the bottom of each well. After
discarding the medium in each well, a 200-µl pipette tip was used
with a ruler to smoothly scrape the cells along the diameter of the
well. PBS was used to thoroughly wash away cells that detached.
Serum-free DMEM medium was added to the wells and the plate was
placed in the incubator at 37°C for further culture. The cells were
observed and photographed under a microscope (4× magnification;
Olympus Corporation) at predetermined time-points (0, 12 and 24 h)
before the distance of cell migration was calculated and
statistically analyzed. The wound width was measured at the same
fixed positions in each well at each time point, and the mean wound
width of three technical replicate wells was used for each
condition and each time point. The relative migration ability of
each group at each time point was calculated as1+
(W0-Wt)/W0, where W0 is
the mean wound width at 0 h and Wt is the mean wound
width at the indicated time point (12 or 24 h). For each condition,
three technical replicate wells were used, and the experiment was
repeated three times independently.
Transwell assay
For Transwell assays, 600 µl complete medium (DMEM
containing 10% FBS) was added to the wells of a 24-well plate and
200 µl cell suspension (containing 2×10⁴ HGC-27 cells
resuspended in serum-free culture medium) was added to the insert.
The Transwell insert (MilliporeSigma) used with a pore size of 8 µm
and without Matrigel coating. The Transwell system was then placed
in the incubator at 37°C for 24 h. The culture medium was discarded
from the insert, which was then thoroughly washed with PBS.
Fixation was performed with 4% formaldehyde solution at room
temperature for 30 min. The insert was washed with PBS to remove
the fixative and staining was conducted with 0.5% crystal violet
solution for 30 min at room temperature. After staining, the
residual staining solution was washed off with PBS and the cells
that had not transgressed through the membrane were scraped off
with a scraper. Images of five random fields of view were then
acquired (magnification, 40×) and statistical analysis was
performed. For each condition, three technical replicate wells were
used, and the experiment was repeated three times
independently.
Statistical analysis
Statistical analyses and the generation of graphs
were conducted using R (version 4.0.2) and GraphPad Prism version
9.0 (Dotmatics). The Wilcoxon rank-sum test was used to assess
differences in gene expression between different types of tumor
tissues and normal tissues. Survival analysis was conducted using
the Kaplan-Meier method, with the log-rank test used to compare
survival curves between groups. Multivariate Cox proportional
hazards regression analysis was performed to evaluate the impact of
variables on survival outcomes. The hazard ratio (HR) and its 95%
confidence interval (CI) were calculated using the Cox proportional
hazards regression model. Specifically, the HR was derived from the
exponentiated coefficient [exp(β)] of the Cox model, where β is the
regression coefficient for the grouping variable (high vs. low
FAM20A expression). The 95% CI for the HR was calculated as exp[β ±
1.96 × SE(β)], where SE(β) is the standard error of the
coefficient. The log-rank test was used to compare the survival
distributions between the high-expression and low-expression
groups. Spearman's or Pearson's algorithm was utilized to
investigate the correlation between two variables. Prior to
analyzing the outcomes of proliferation, Transwell and
wound-healing experiments, the Shapiro-Wilk normality test and
Levene's test were respectively employed to examine whether the
data were normally distributed, and the variance was homogeneous.
When the experimental data were normally distributed and the
variance was homogeneous, unpaired Student's t-test was used for
statistical analysis. If the data were normally distributed but the
variance was not homogeneous, Welch's t-test was used. If the data
did not satisfy the normal distribution and a non-parametric test
was required, the Wilcoxon rank-sum test was adopted. ImageJ
software (version 1.52a) (21) was
used to analyze results arising from the wound-healing and
Transwell assays. P<0.05 was considered to indicate a
statistically significant difference.
Results
Variability in the pan-cancer
expression of FAM20A
Initially, the tissue distribution of FAM20A
expression was investigated using the HPA database. As shown in
Fig. 1A, FAM20A exhibited
relatively high transcriptional levels in various organs, such as
the salivary gland, liver, stomach and lung. To elucidate the role
of FAM20A in tumors, its expression levels were analyzed
across multiple distinct tumor types utilizing data from TCGA and
GTEx databases. As shown in Fig. 1B and
C, group comparisons revealed that when compared with those in
normal tissues, the expression levels of FAM20A were
significantly reduced in BRCA (P<0.001), CESC (P<0.05), CHOL
(P<0.01), KICH (P<0.001), KIRC (P<0.001), KIRP
(P<0.001), LUSC (P<0.001), PAAD (P<0.05) and UCEC
(P<0.01). By contrast, the expression levels of FAM20A
were significantly increased in GBM (P<0.01), LIHC (P<0.001)
and THCA (P<0.001). In paired analyses, in comparison with the
respective matched non-cancerous tissues, a reduction in the
expression levels of FAM20A was observed for BRCA
(P<0.001), CHOL (P<0.05), KICH (P<0.001), KIRC
(P<0.001), LUSC (P<0.001) and UCEC (P<0.05). However, an
increase in the expression levels of FAM20A was identified
for COAD (P<0.05), LICH (P<0.05) and THCA (P<0.001). These
findings suggest that FAM20A may have diverse functions
across different tumor types.
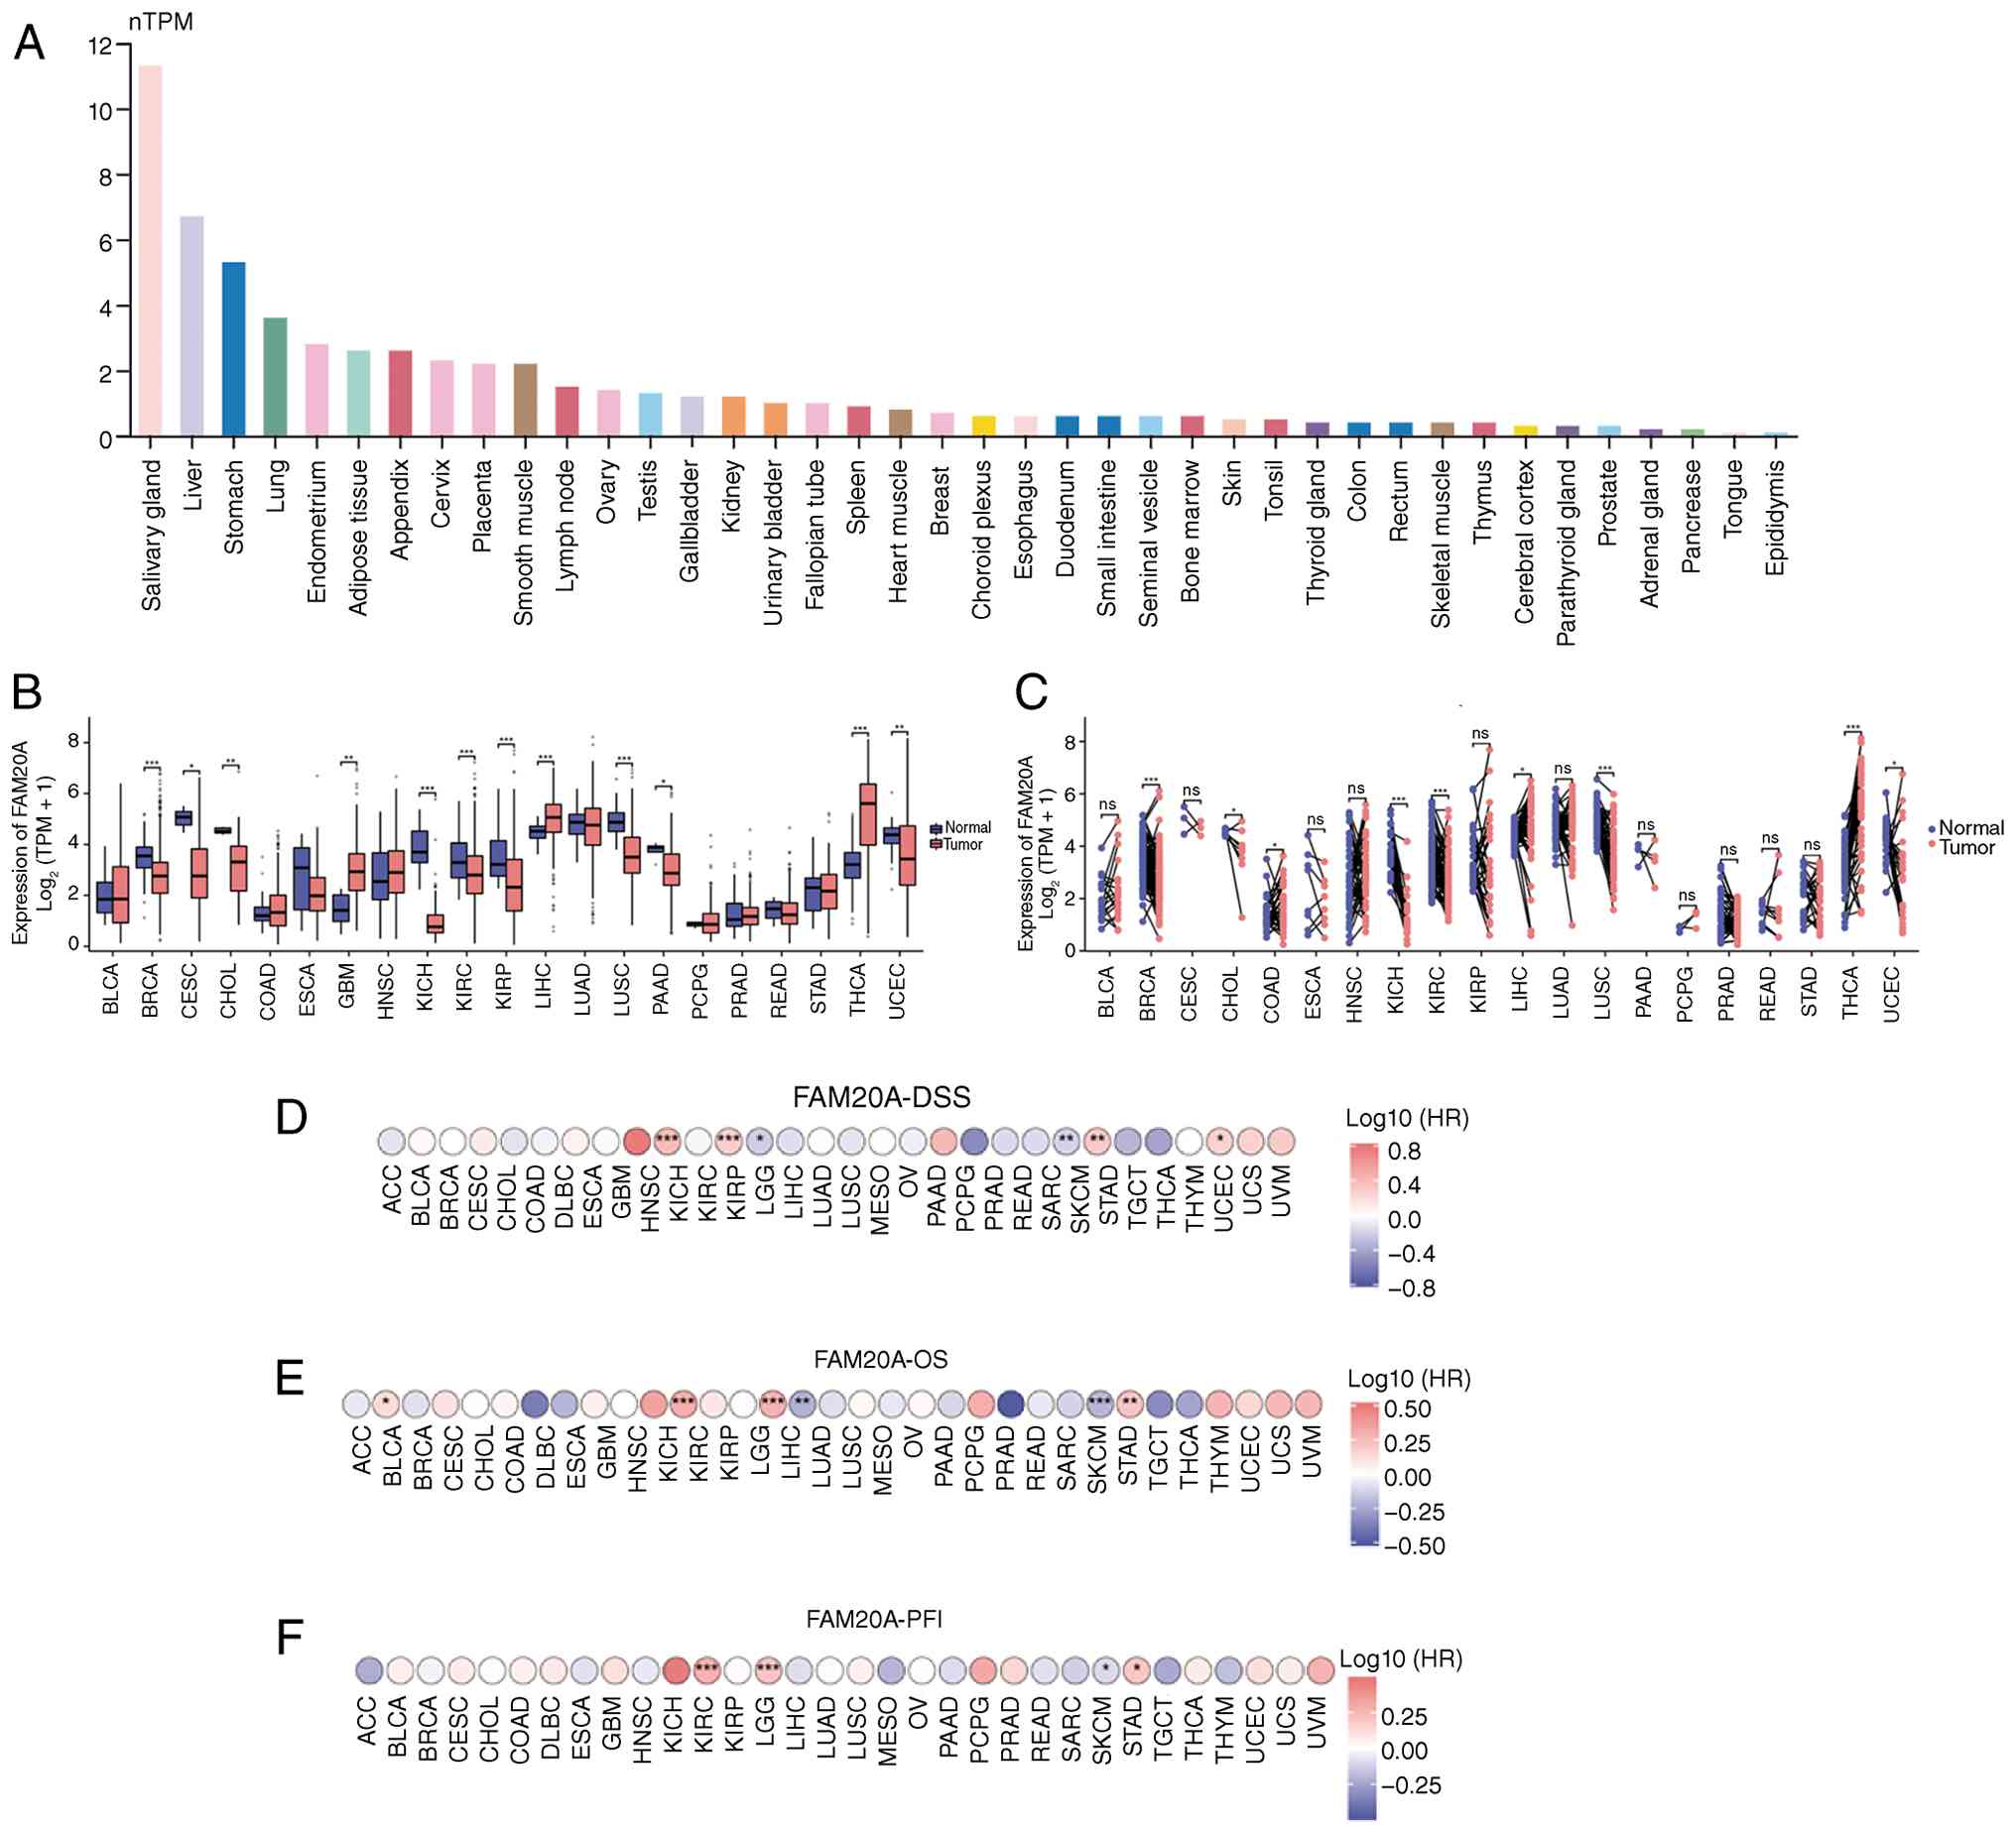 | Figure 1.FAM20A expression across
pan-cancer and its prognostic value. (A) mRNA expression levels of
FAM20A in normal human tissues. (B) Expression levels of
FAM20A in non-matched samples from cancerous and
non-cancerous tissues across different types of cancer. (C)
Expression of FAM20A in paired tissue samples from cancerous
and non-cancerous tissues in different types of cancer. Univariate
Cox regression analysis for (D) disease-specific survival, (E)
overall survival and (F) progression-free interval in pan-cancers.
*P<0.05, **P<0.01 and ***P<0.001. ns, no significance;
TPM, transcripts per million; HR, hazard ratio; FAM20A,
family with sequence similarity 20, member A; BLCA, bladder
urothelial carcinoma; BRCA, breast cancer; CESC, cervical
carcinoma; CHOL, cholangiocarcinoma; COAD, colorectal
adenocarcinoma; ESCA, esophageal carcinoma; GBM, glioblastoma
multiforme; HNSC, head and neck squamous cell carcinoma; KICH,
chromophobe renal cell carcinoma; KIRC, clear cell renal cell
carcinoma; KIRP, kidney papillary cell carcinoma; LIHC, liver
hepatocellular carcinoma; LUAD, lung adenocarcinoma; LUSC, lung
squamous cell carcinoma; PAAD, pancreatic ductal adenocarcinoma;
PCPG, pheochromocytoma and paraganglioma; PRAD, prostate
adenocarcinoma; READ, colorectal adenocarcinoma; STAD, stomach
adenocarcinoma; THCA, thyroid papillary carcinoma; UCEC, uterine
corpus endometrioid carcinoma; ACC, adrenocortical carcinoma; DLBC,
large B-cell lymphoma; LAML, acute myeloid leukemia; LGG, lower
grade glioma; MESO, mesothelioma; OV, ovarian serous
adenocarcinoma; SARC, sarcoma; SKCM, skin cutaneous melanoma; TGCT,
testicular germ cell tumors; THYM, thymoma; UCS, uterine
carcinosarcoma; UVM, uveal melanoma. |
Prognostic pan-cancer significance of
FAM20A
After confirming the expression of FAM20A in
different tumors, the impact of high and low expression levels of
FAM20A on OS, DSS and PFI in different tumor types was
analyzed (Fig. 1D-F). In terms of
OS, FAM20A acted as a risk factor in BLCA, KIRC, LGG and
STAD, with HR values of all >1 (all P<0.05) FAM20A
also served as a protective factor in LIHC and SKCM, with HR values
<1 (all P<0.01). In terms of DSS, FAM20A acted as a
risk factor in KIRC, LGG, STAD and UCEC, with HR values all >1
(all P<0.05). In addition, FAM20A was a protective factor
for LIHC and SKCM, with HR values <1 (all P<0.05). In terms
of PFI, FAM20A was identified as a risk factor in KIRC, LGG
and STAD, with HR values all >1 (all P<0.05) FAM20A
was a protective factor only for SKCM, with an HR <1 (all
P<0.05). Therefore, high expression levels of FAM20A may
be associated with the progression and poor prognosis of various
tumor types (KIRC, LGG and STAD).
FAM20A expression is associated with
the staging of STAD
The initial pan-cancer analysis confirmed that
FAM20A can serve as a risk factor for OS, DSS and PFI of
STAD. Therefore, the differences in FAM20A expression
between STAD and normal tissues were analyzed. As illustrated in
Fig. 2A and B, the expression level
of FAM20A in STAD tumor samples was found to be
significantly higher compared with that in normal tissues, both in
unmatched (P<0.001) and matched (P<0.001) sample cohorts.
FAM20A expression exhibited an increasing tendency in the
higher T stage (T2-T4; P<0.01) and higher N stage (N3; P
<0.05), where higher expression levels were detected in deceased
patients (P<0.05) and those with recurrence (P<0.05; Fig. 2C-F), suggesting that FAM20A
may be associated with a higher clinical stage and worse prognosis.
Therefore, the relationship between the expression of FAM20A
and patient prognosis was next analyzed. As shown in Fig. 2G-I, high expression of FAM20A
was significantly associated with worse prognosis in patients with
STAD, as indicated by a shorter OS, DSS and PFI, with HR values all
>1 (all P<0.01).
 | Figure 2.FAM20A expression in STAD and
its association with clinical outcomes. Expression levels of
FAM20A in (A) non-matched samples and (B) paired tissue
samples from cancerous and non-cancerous tissues from patients with
STAD. Expression levels of FAM20A in STAD tumor samples at
different (C) T and (D) N stages. Expression levels of
FAM20A in patients with STAD classified by (E) deceased or
alive or (F) death from STAD or patient was censored for DSS.
Univariate Cox regression analysis and survival analyses for (G)
OS, (H) DSS and (I) PFI in STAD. Univariate Cox regression analysis
for (J) OS, (K) DSS and (L) PFI in STAD at T1 and T2 stages.
Univariate Cox regression analysis for (M) OS, (N) DSS and (O) PFI
in STAD at T3 and T4 stages. Univariate Cox regression analysis for
(P) OS, (Q) DSS and (R) PFI in STAD at stages II, III and IV.
*P<0.05; **P<0.01; ***P<0.001. FAM20A, family with
sequence similarity 20, member A; OS, overall survival; DSS,
disease-specific survival; PFI, progression-free interval; STAD,
stomach adenocarcinoma; HR, hazard ratio. |
When considering the T stage and the expression of
FAM20A in patients, no significant differences were found in
OS, DSS and PFI of patients in the T1-T2 stage (Fig. 2J-L), whilst significant differences
were identified in OS, DSS and PFI in patients in the T3-T4 stage
(Fig. 2M-O), with HR values all
>1 (all P<0.05). When conducting OS, DSS and PFI analyses for
patients with STAD at different clinical stages, it was discovered
that higher expression levels of FAM20A significantly
reduced the OS, DSS and PFI of patients with STAD with more
advanced clinical stages, with HR values all >1 (all P<0.05)
(Fig. 2P-R). After demonstrating
the association between FAM20A expression levels and
clinicopathological features including T stage and N stage in
patients with gastric cancer, multivariate Cox regression analysis
was conducted among patients with STAD incorporating FAM20A
expression levels, T stage, N stage, clinical stage and age. As
presented in Table I, FAM20A
retained independent significance following adjustment for the
effects of other covariates. Furthermore, multivariate Cox
regression analysis revealed that, in addition to FAM20A
expression, age >65 years also retained independent significance
as a prognostic factor for OS (P<0.05), DSS (P<0.01) and PFI
(P<0.05) in patients with STAD. These analyses suggest that high
expression levels of FAM20A are associated with more severe
local tumor invasion and a higher clinical stage in patients with
STAD.
 | Table I.Multivariate Cox regression
analysis. |
Table I.
Multivariate Cox regression
analysis.
| Characteristic | Total (n) | Univariate analysis
[HR (95% CI)] | Univariate analysis
P-value | Multivariate
analysis [HR (95% CI)] | Multivariate
analysis (P-value) |
|---|
| FAM20A
expression | 370 | 1.234
(1.043–1.459) | 0.014 | 1.244
(1.028–1.504) | 0.025 |
| Pathological T
stage | 362 |
|
|
|
|
| T1 | 18 | Reference |
| Reference |
|
| T2 | 78 | 6.725
(0.913–49.524) | 0.061 | 4.998
(0.642–38.937) | 0.124 |
| T3 | 167 | 9.548
(1.326–68.748) | 0.025 | 6.416
(0.739–55.702) | 0.092 |
| T4 | 99 | 9.634
(1.323–70.151) | 0.025 | 5.719
(0.639–51.201) | 0.119 |
| Pathological N
stage | 352 |
|
|
|
|
| N0 | 107 | Reference |
| Reference |
|
| N1 | 97 | 1.629
(1.001–2.649) | 0.049 | 1.343
(0.674–2.679) | 0.402 |
| N2 | 74 | 1.655
(0.979–2.797) | 0.060 | 1.430
(0.608–3.362) | 0.412 |
| N3 | 74 | 2.709
(1.669–4.396) | <0.001 | 2.053
(0.874–4.824) | 0.099 |
| Pathological
stage | 347 |
|
|
|
|
| I | 50 | Reference |
| Reference |
|
| II | 110 | 1.551
(0.782–3.078) | 0.209 | 0.924
(0.345–2.471) | 0.874 |
|
III | 149 | 2.381
(1.256–4.515) | 0.008 | 0.870
(0.231–3.275) | 0.837 |
| IV | 38 | 3.991
(1.944–8.192) | <0.001 | 2.118
(0.566–7.928) | 0.265 |
| Age, years | 367 |
|
|
|
|
|
≤65 | 163 | Reference |
| Reference |
|
|
>65 | 204 | 1.620
(1.154–2.276) | 0.005 | 1.862
(1.292–2.684) | <0.001 |
Functional enrichment analysis of
differentially expressed genes associated with FAM20A in STAD
After finding that FAM20A was associated with
the prognosis of patients with STAD, the 300 genes most associated
with FAM20A were next screened before the top 30 positively
and negatively correlated genes were selected to create a heatmap
of correlation (Fig. 3A and B). The
genes positively correlated with FAM20A were co-upregulated in the
same subset of STAD samples in which FAM20A was highly expressed
and were expressed at low levels in samples with low FAM20A
expression; representative positively correlated genes included
HRH2, PI3KR5 and THEMIS2. By contrast, the genes negatively
correlated with FAM20A showed the opposite pattern, being highly
expressed in samples with low FAM20A expression and expressed at
low levels in samples with high FAM20A expression; representative
negatively correlated genes included CDK1, DKC1 and RAB25. To
investigate how the expression of FAM20A affected changes in
the signaling pathways associated with STAD, GO and KEGG analyses
were next conducted using the top 300 genes (Fig. 3C-F). The analysis identified
enriched pathways in cellular component (such as ‘external side of
plasma membrane’, ‘secretory granule membrane’, ‘cell leading edge’
and ‘membrane microdomain’), biological process (such as ‘immune
response-regulating signaling pathway’, ‘positive regulation of
cytokine production’, ‘leukocyte mediated immunity’, ‘regulation of
immune effector process’), molecular function (such as
‘nucleoside-triphosphatase regulator activity’, ‘GTPase regulator
activity’, ‘immune receptor activity’ and ‘cytokine receptor
activity’) and KEGG pathway categories (such as ‘tuberculosis’,
‘pathogenic Escherichia coli infection’, ‘chemokine
signaling pathway’ and ‘neutrophil extracellular trap formation’).
Several GO functional terms and KEGG pathways related to
immune-related functions were enriched by the
FAM20A-correlated genes. (such as ‘immune
response-regulating signaling pathway’ and ‘regulation of immune
effector process’). After conducting GSEA analysis using the genes
selected by correlation analysis with FAM20A, similar
conclusions (such as Thelper pathway, primary immunodeficiency,
Fcgr activation) were reached (Fig.
3G-J). These data suggest that FAM20A may be associated
with the immune response in STAD.
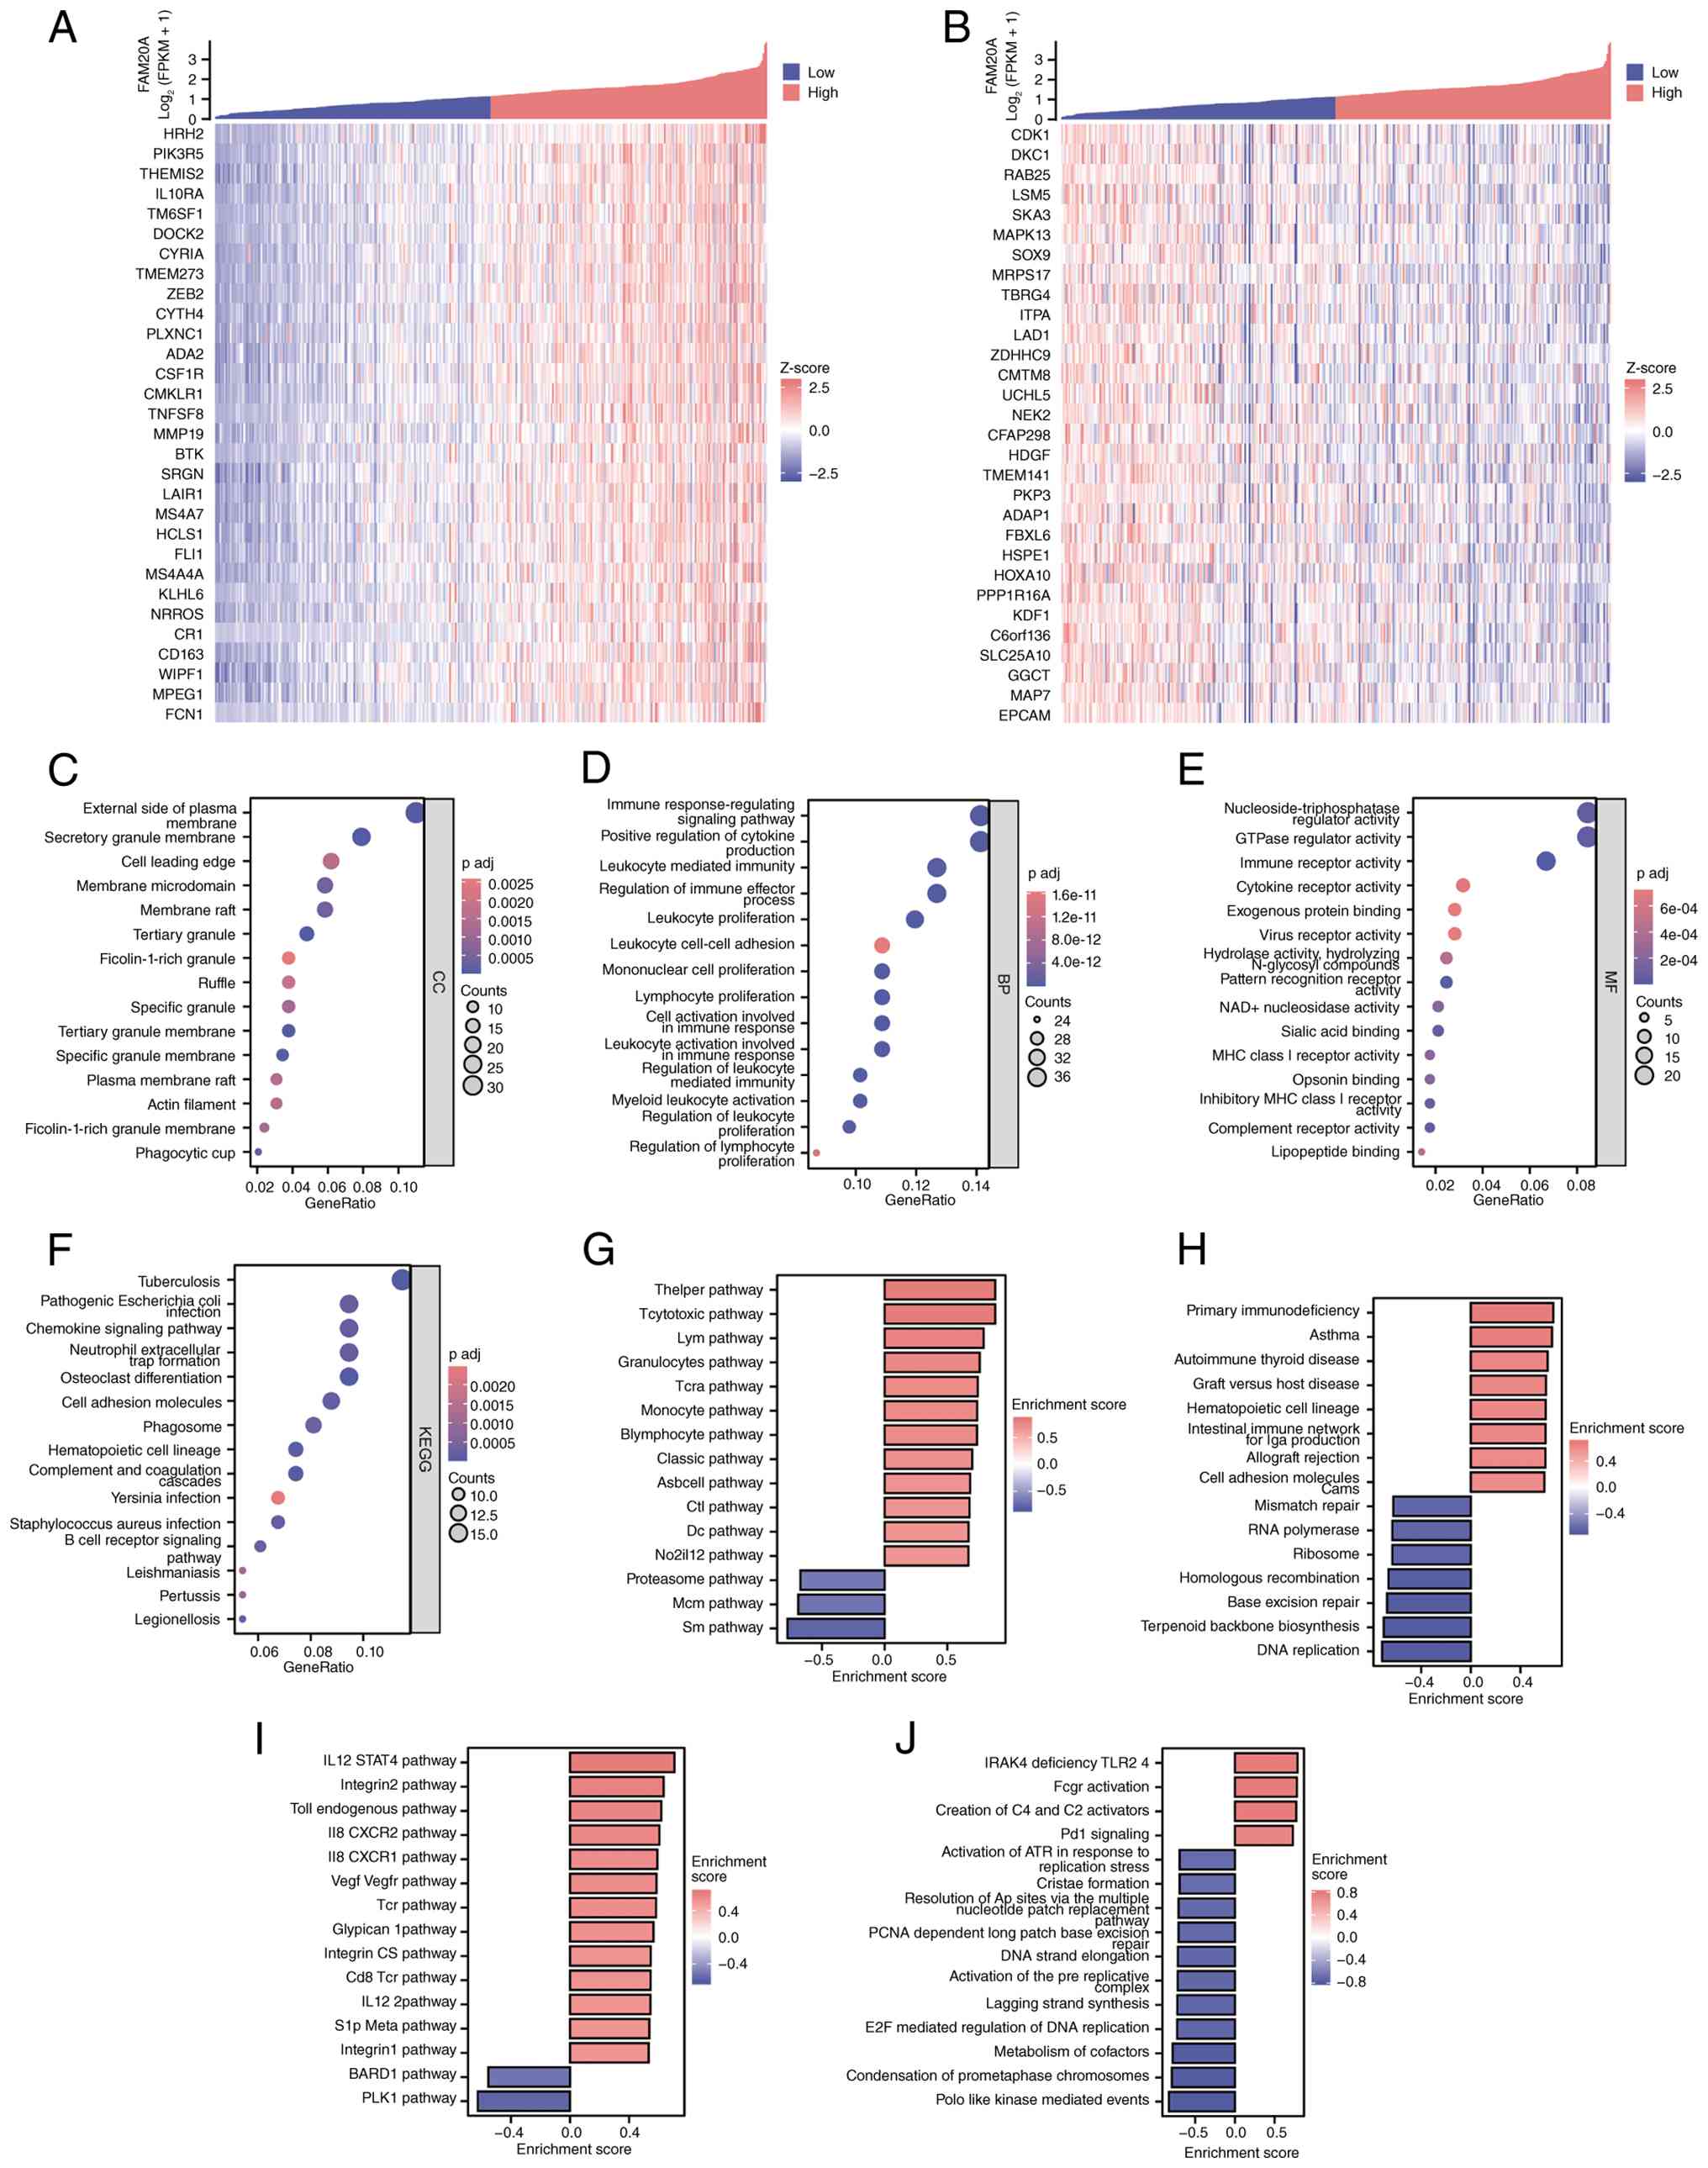 | Figure 3.Functional enrichment analysis of
FAM20A-associated genes in STAD. Top 30 genes that were most (A)
positively and (B) negatively correlated with FAM20A.
P-values were adjusted using the Spearman's algorithm. GO/KEGG
analysis for the top 300 genes most closely correlated with
FAM20A, with the classification of enrichment analysis
results according to (C) CC, (D) BP, (E) MF and (F) KEGG pathway
categories. Gene set enrichment analysis of genes with absolute
values >0.1 with FAM20A, with the classification of
enrichment analysis according to (G) BIOCARTA, (H) KEGG, (I) PID
and (J) REACTOME categories. FAM20A, family with sequence
similarity 20, member A; KEGG, Kyoto Encyclopedia of Genes and
Genomes; CC, cellular component; BP, biological process; MF,
molecular function; P adj, adjusted P-value. |
High infiltration of macrophages and
DCs correlated with FAM20A expression and poor prognosis in
STAD
Based on the present hypothesis that FAM20A
may be associated with the immune response in STAD the estimate,
ssGSEA and CIBERSORT algorithms were then used to analyze the
correlations among FAM20A expression and infiltration by
various tumor microenvironmental stromal cells and immune
cells.
FAM20A expression showed a strong association
with both stromal cell (P<0.001) and immune cell infiltration
(P<0.001) in STAD, where FAM20A expression was also
significantly association with tumor purity (P<0.001) (Fig. 4A). These data suggest a role of
FAM20A in the tumor microenvironment, where high levels of
FAM20A expression may be associated with poor prognosis in
STAD due to the ability of FAM20A to regulate the tumor
microenvironment. When analyzed using the ssGSEA algorithm,
FAM20A expression was positively correlated with all cell
types (including macrophage, DC, iDC, pDC and aDC), except for Th2
and Th17 cells (Fig. 4B). When
analyzed using the CIBERSORT algorithm, FAM20A was
positively correlated with M2 macrophages (P<0.001), monocytes
(P<0.01), resting mast cells (P<0.01), CD8+ T
cells (P<0.01), activated CD4+ memory T cells
(P<0.05) and eosinophils (P<0.01), whilst being negatively
correlated with resting CD4+ memory T cells (P<0.05),
activated mast cells (P<0.05), M0 macrophages (P<0.05),
activated NK cells (P<0.01) and Tregs (P<0.001; Fig. 4C). As shown in Fig. 4D and E, patients were further
divided into FAM20A high and low expression groups for
analysis with the ssGSEA algorithm, which revealed increased
infiltration by the majority of immune cell types in the
FAM20A-high group. The CIBERSORT algorithm revealed an
increase of CD8+ T cells (P<0.001), activated
CD4+ memory T cells (P<0.01), M2 macrophages
(P<0.01) and resting mast cells (P<0.05) in cells with high
expression levels of FAM20A, while Tregs (P<0.01) and
activated mast cells (P<0.05) were decreased. Collectively,
these results suggest that macrophages and DCs with high
FAM20A expression levels may be associated with the tumor
microenvironment in patients with STAD. Therefore, the relationship
between high and low expression levels of FAM20A and B cell,
T cell, macrophage and DC infiltration, along with survival of
patients with STAD, was analyzed using the TIMER database. As shown
in Fig. 4F, the infiltration of
levels (according to the median infiltration level of each immune
cell type) of macrophages (P<0.01) and DC cells (P<0.05) into
gastric cancer, were significantly associated with a shorter
survival time in patients with STAD. As depicted in Fig. 5A and B, when the range of the
analysis was extended to multiple malignant tumors, the estimate
algorithm demonstrated that the expression of FAM20A
exhibited a pronounced correlation with the stromal cell score,
immune cell score and tumor purity in various types of malignant
tumor (such as ACC, BLCA and BRCA). When analyzed using the ssGSEA
algorithm, FAM20A demonstrated a significant correlation
with immune cells in the majority of malignant tumors, except for a
few malignant tumor types, including CHOL, LIHC and MESO. This
result suggests that FAM20A may be associated with the tumor immune
microenvironment beyond STAD, providing a direction for future
research.
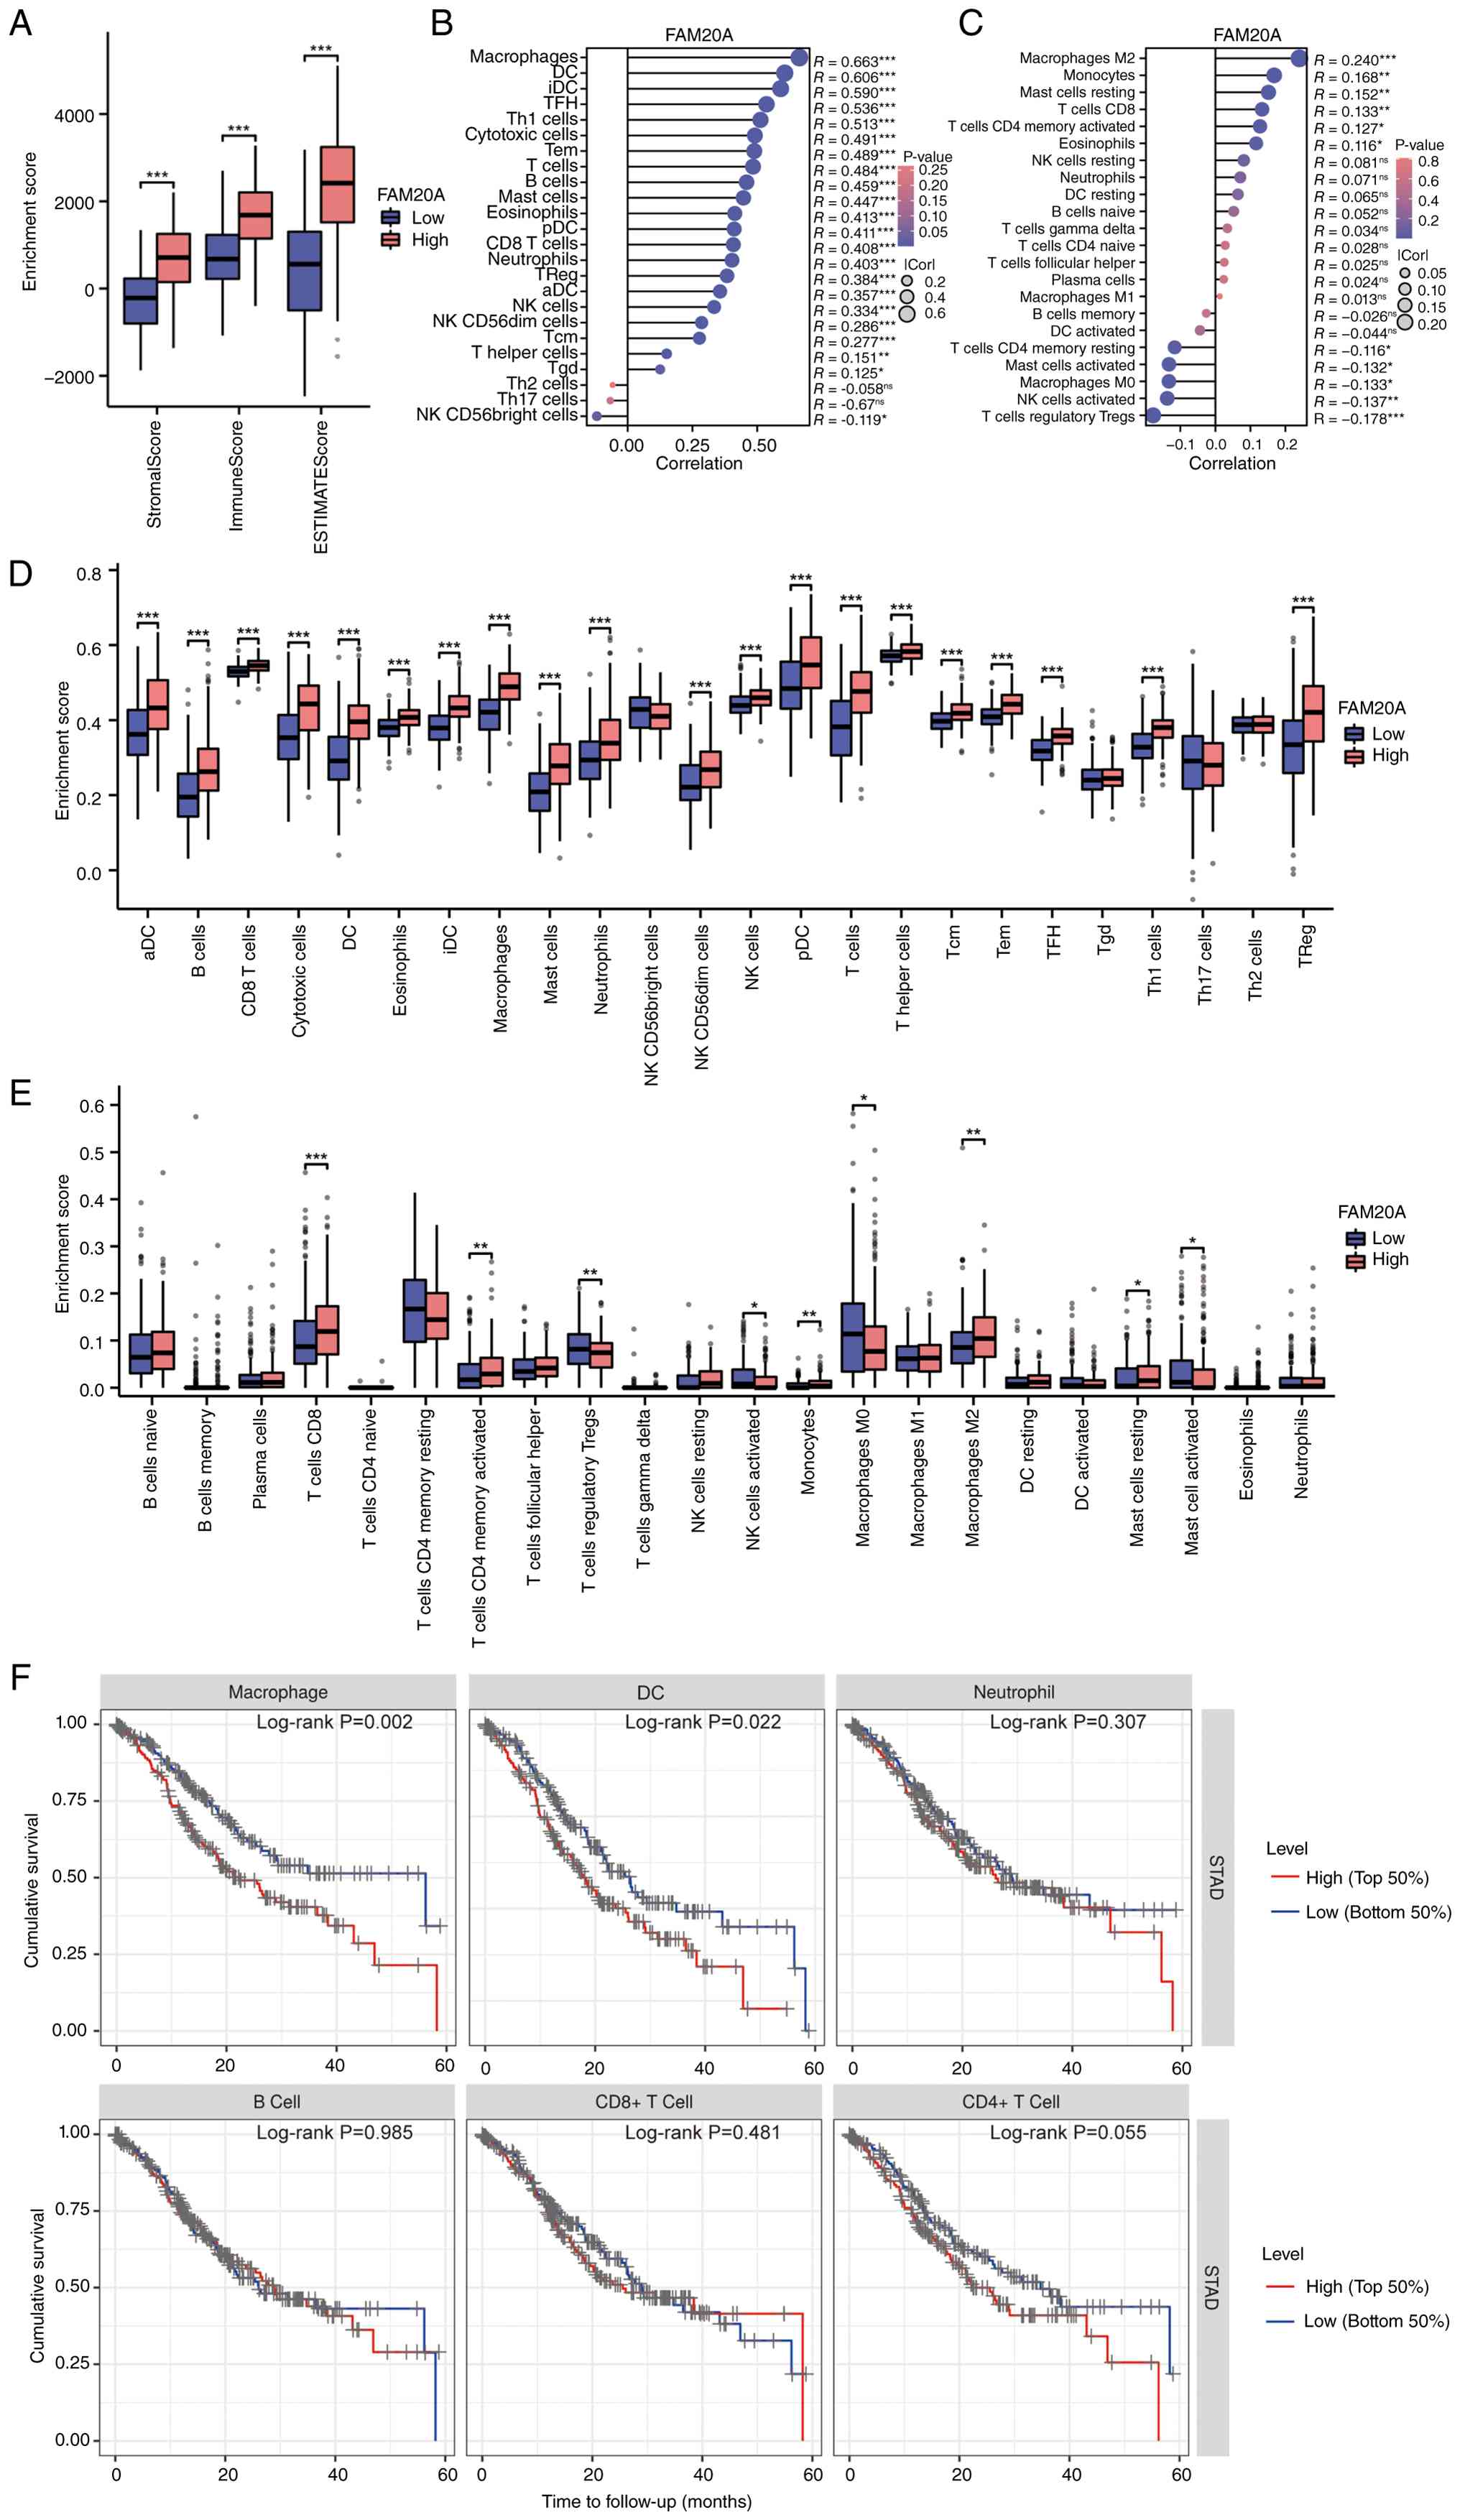 | Figure 4.Correlation between FAM20A expression
and immune cell infiltration in STAD. (A) Correlation between
FAM20A expression and stromal cells, immune cell
infiltration and tumor purity in STAD. The correlations between
FAM20A expression and various immune cells were analyzed
with the (B) ssGSEA and (C) CIBERSORT algorithms in STAD. The
enrichment score for immune cells with high and low expression
levels of FAM20A in tumors were analyzed with the (D) ssGSEA
and (E) CIBERSORT algorithms. (F) Impact of enrichment of immune
cells with high and low expression levels of FAM20A in
tumors on the overall survival of patients with STAD. P-values were
adjusted using the Pearson algorithm.*P<0.05, **P<0.01 and
***P<0.001. FAM20A, family with sequence similarity 20,
member A; ssGSEA, single sample gene set enrichment analysis; STAD,
stomach adenocarcinoma; Cor, correlation coefficient; aDC,
activated dendritic cells; DCs, dendritic cells; iDC, immature DCs;
NK, natural killer; pDC, plasmacytoid DCs; Th, T helper; Tcm, T
central memory; Tem, T effector memory; TFH, T follicular helper;
Tgd, gamma delta T cells; Th1, type 1 T-helper; Th17, Th17 cells;
Th2, Th2 cells; Tregs, T-regulatory cells. |
 | Figure 5.Correlation between FAM20A expression
and tumor microenvironment components across multiple cancer types.
(A) Correlation between FAM20A expression and stromal cells,
immune cell infiltration and tumor purity in different types of
cancer. (B) The correlation between FAM20A expression and
various immune cells in different types of cancer were analyzed by
the ssGSEA algorithm. P-values were adjusted using the Spearman's
algorithm.*P<0.05, **P<0.01 and ***P<0.001. FAM20A,
family with sequence similarity 20, member A; Cor, correlation
coefficient; aDC, activated dendritic cells; DCs, dendritic cells;
iDC, immature DCs; NK, natural killer; pDC, plasmacytoid DCs; Th, T
helper; Tcm, T central memory; Tem, T effector memory; TFH, T
follicular helper; Tgd, gamma delta T cells; Th1, type 1 T-helper;
Th17, Th17 cells; Th2, Th2 cells; Tregs, T-regulatory cells BLCA,
bladder urothelial carcinoma; BRCA, breast cancer; CESC, cervical
carcinoma; CHOL, cholangiocarcinoma; COAD, colorectal
adenocarcinoma; ESCA, esophageal carcinoma; GBM, glioblastoma
multiforme; HNSC, head and neck squamous cell carcinoma; KICH,
chromophobe renal cell carcinoma; KIRC, clear cell renal cell
carcinoma; KIRP, kidney papillary cell carcinoma; LIHC, liver
hepatocellular carcinoma; LUAD, lung adenocarcinoma; LUSC, lung
squamous cell carcinoma; PAAD, pancreatic ductal adenocarcinoma;
PCPG, pheochromocytoma and paraganglioma; PRAD, prostate
adenocarcinoma; READ, colorectal adenocarcinoma; STAD, stomach
adenocarcinoma; THCA, thyroid papillary carcinoma; UCEC, uterine
corpus endometrioid carcinoma; ACC, adrenocortical carcinoma; DLBC,
large B-cell lymphoma; LAML, acute myeloid leukemia; LGG, lower
grade glioma; MESO, mesothelioma; OV, ovarian serous
adenocarcinoma; SARC, sarcoma; SKCM, skin cutaneous melanoma; TGCT,
testicular germ cell tumors; THYM, thymoma; UCS, uterine
carcinosarcoma; UVM, uveal melanoma. |
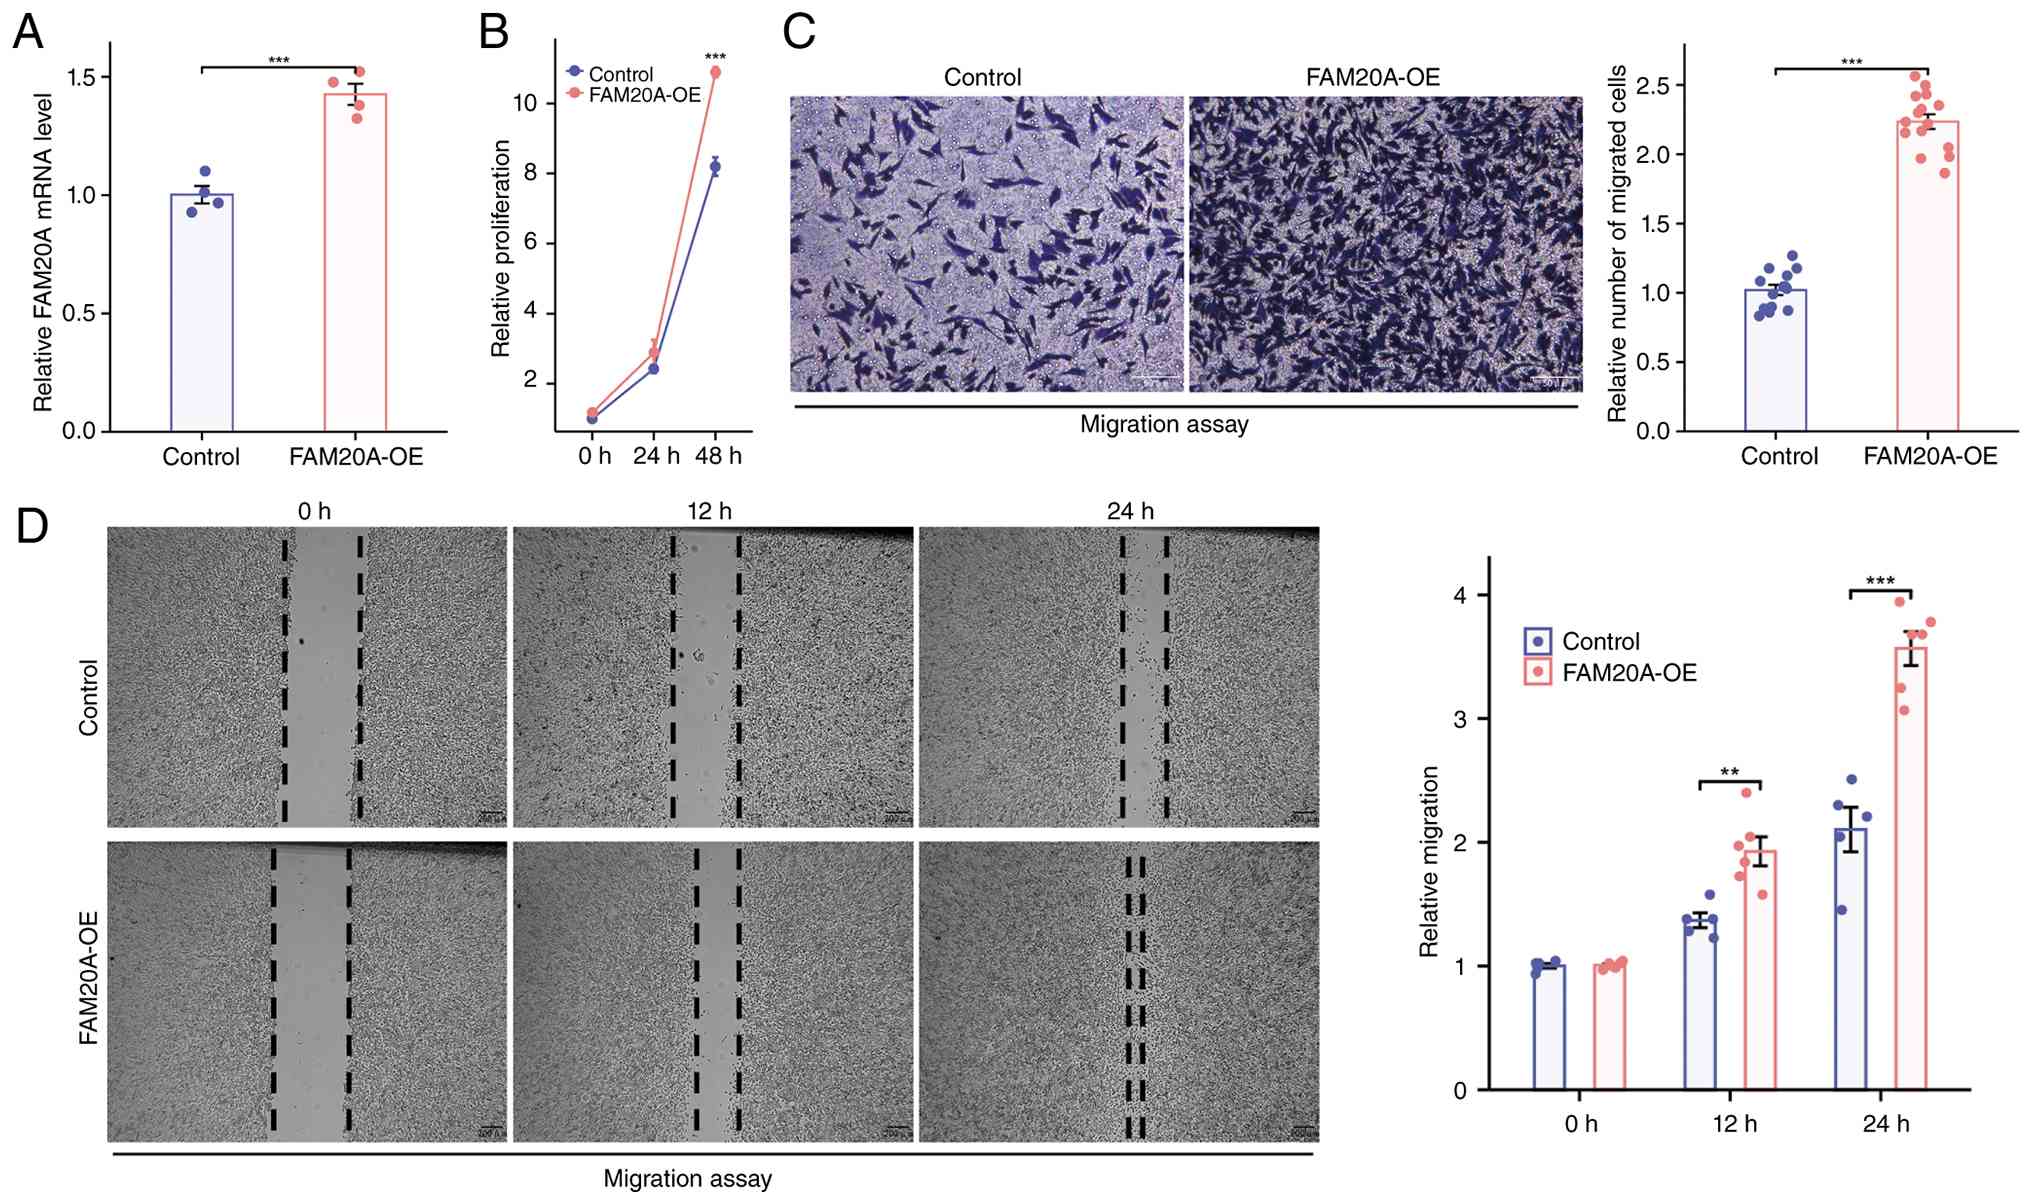
Impact of FAM20A on STAD cells
To investigate the influence of FAM20A
expression on gastric cancer cells, a lentivirus overexpressing
FAM20A was transfected into HGC-27 cells (Fig. 6A). Compared with that in the control
group, overexpression of FAM20A significantly promoted the
proliferation of HGC-27 cells at 48 h (relative proliferation,
10.826±0.439 vs. 8.199±0.460, P<0.001; Fig. 6B). After confirming that the
overexpression of FAM20A could enhance the proliferation of
gastric cancer cells, the impact of FAM20A on the migration
and invasion of gastric cancer cells was next assessed by wound
healing and Transwell assays, respectively. As depicted in Fig. 6C, compared with that in the control
group, overexpression of FAM20A significantly strengthened
the invasive ability of gastric cancer cells (2.235 vs. 1.020;
P<0.001). In the wound healing assay, overexpression of
FAM20A resulted in the wound closing faster over 24 h
(1.926±0.286 vs. 1.370±0.133, P<0.01 at 12 h;
3.566±0.336 vs. 2.103±0.400, P<0.001 at 24 h;
Fig. 6D). These results indicate
that overexpression of FAM20A possibly increased the
metastatic capabilities of tumors by promoting the proliferation,
migration and invasion of gastric cancer cells.
Discussion
STAD represents a significant global health
challenge due to its high incidence and mortality rates. This
disease is the fifth most common cancer type worldwide and ranks
fifth for all cancer-related mortalities, with >700,000
mortalities each year (1). Current
therapeutic strategies, including surgery, chemotherapy and
radiation, typically yield limited success (22–24),
highlighting the urgent need to identify novel biomarkers for early
detection and prognostic improvement.
In the present study, survival analysis demonstrated
an association between high FAM20A expression levels and
unfavorable outcomes across multiple types of cancer, including
gastric cancer, bladder cancer and kidney cancers. This
relationship is particularly concerning, as it suggests that
elevated levels of FAM20A may not only serve as a prognostic
indicator but could also be implicated in the aggressiveness of
tumors. Nonetheless, FAM20A has been shown to be associated
with improved prognosis in patients with SKCM and LIHC. This
suggests that FAM20A can modulate the development of various
tumor types through multiple signaling pathways or varying
activation levels within the same pathway.
The association between FAM20A expression and
immune cell infiltration patterns adds another layer of complexity
to its role in cancer biology. Accumulating evidence has
demonstrated that the infiltration of tumor-associated macrophages
(TAMs) and DCs in gastric cancer exhibits a well-defined
association with the prognosis of patients (25–27).
The findings demonstrate that high FAM20A expression correlates
with increased infiltration of macrophages and DCs. Notably, the
infiltration of these two cell types in gastric cancer is also
associated with poor prognosis, as they are commonly implicated in
the tumor microenvironment (28–32).
This suggests that FAM20A may contribute to immune evasion
mechanisms utilized by tumors, thereby negatively impacting patient
outcomes. The present results showed that high expression levels of
FAM20A in tumors correlated with the increased infiltration
of DCs, which is associated with a significantly unfavorable
prognosis for patients with STAD. Considering the subtypes of DCs,
FAM20A expression exhibited a positive correlation with the
infiltration of iDCs and pDCs. iDCs are known to differentiate into
tolerogenic DCs under the influence of IL-10, thereby inhibiting
T-cell responses (33).
Furthermore, pDCs are frequently associated with unfavorable
prognoses of patients with cutaneous malignancies (34), thus aligning with the current
findings. In STAD tissues characterized by high levels of
FAM20A expression, there was an increase in both total
macrophage and M2 macrophage infiltration. This is potentially key
because previous studies found that TAMs and M2 macrophages are
implicated in tumor progression (such as HNSC) (35,36).
These data suggest that elevated levels of FAM20A within
tumors may facilitate the recruitment of additional macrophages and
DCs, thereby promoting tumor growth within the tumor
microenvironment. Understanding the interplay between FAM20A
and the immune landscape of tumors may provide crucial insights
into the development of novel immunotherapeutic strategies. This,
however, remains contingent upon further investigations at the
single-cell level in future studies.
The present in vitro experiments demonstrated
that overexpression of FAM20A significantly enhanced the
proliferation and migration of gastric cancer cells. The HGC-27
cell line was selected because the majority of newly diagnosed
gastric cancer cases in China are of low or moderately low
differentiation (3). HGC-27
originates from a poorly differentiated tumor (37), optimally reflecting the
characteristics of the Chinese patient population. These findings
provide experimental support to the notion that FAM20A may
function as an oncogene in gastric cancer that promotes tumor
aggressiveness and metastatic potential. The mechanisms underlying
these effects warrant further investigation, particularly with
regard to the signaling pathways activated by FAM20A that
contribute to these phenotypic changes. Understanding these
pathways could ultimately lead to the identification of novel
therapeutic targets for the treatment of gastric cancer,
particularly for patients with high levels of FAM20A
expression. Furthermore, these results emphasize the importance of
integrating both in vitro and clinical data to develop
comprehensive models for the role of FAM20A in cancer
biology, thus facilitating the translation of these findings into
clinical practice.
According to previous reports, FAM20A is a
pseudokinase that forms a functional complex with Fam20C, which
then potentiates the phosphorylation of exogenous proteins
(ameloblastin and amelotin) within the secretory pathway (10). It appears that the function of
FAM20A is completely dependent on FAM20C. However, based on
data acquired from the BioGRID database (v4.4.230; http://thebiogrid.org), FAM20A can interact with
parkin RBR E3 ubiquitin protein ligase (PRKN), although FAM20C is a
protein known to interact with PRKN (38). The gene products of PRKN were
initially identified as being mutated in human Parkinson's disease,
which were subsequently demonstrated to function in concert to
promote mitophagy, thereby implicating dysfunctional mitochondria
in the etiology of Parkinson's disease (39). PRKN-mediated mitophagy has also been
reported to participate in the occurrence and development of
multiple types of tumor (LIHC, BRCA, COAD and PRAD) (40–43).
However, in the present study, an analysis of TCGA database
suggested that the expression of PRKN is not associated with
the prognosis of patients with STAD (data not shown).
There are certain limitations to the present study
that need to be considered. The study primarily relied on publicly
available databases (such as TCGA and GTEx), which may have
introduced inherent biases in sample selection, data processing and
clinical annotation. To address database bias, future studies
should validate FAM20A expression and its correlation with immune
infiltration in independent, multi-center clinical cohorts using
real-world patient samples with matched RNA-sequencing or reverse
transcription-quantitative PCR data. According to the HPA database,
FAM20A expression is undetectable in HGC-27 cells, making small
interfering RNA/short hairpin RNA knockdown experiments unfeasible
in this cell line. As a result, the present study could only rely
on exogenous overexpression to assess gain-of-function phenotypes.
Furthermore, when reviewing the HPA database, it was found that
only a limited number of gastric cancer cell lines (NCC-StC-K140,
TGBC11TKB, GSU) express FAM20A, which are not routinely available
from standard commercial cell repositories and can only be obtained
through direct requests to the originating laboratories or
specialized cell banks. This is a limitation of the present study.
To overcome the lack of experimental validation, future research
should employ in vitro gain/loss-of-function assays (such as
CRISPR-Cas9 knockout or overexpression in STAD cell lines) combined
with functional tests (proliferation, apoptosis, migration and
invasion) and in vivo xenograft models to directly confirm
the oncogenic role of FAM20A. In addition, the specific molecular
mechanisms by which tumors with high expression levels of
FAM20A recruit immune cells or how immune cells with high
expression levels of FAM20A influence tumor progression
remain undefined and further research is still required. Futures
studies also needs to determine whether there are more proteins
other than FAM20C that can interact with FAM20A and thereby affect
multiple signaling pathways. Specifically, understanding the
molecular interactions and regulatory networks involving FAM20A
could elucidate its function in distinct tumor microenvironments,
thereby facilitating the development of targeted therapies or
nanomedicines aimed at modulating its expression or activity in
various cancers (44). Furthermore,
the identification of FAM20A as a potential prognostic marker may
enhance clinical decision-making processes. Therefore, prospective
studies with larger, well-annotated patient cohorts (including
treatment history and survival follow-up) are needed to evaluate
its independent prognostic value in multivariate models and its
potential for guiding personalized therapy.
In conclusion, the present comprehensive
investigation of FAM20A revealed its significant association
with tumor biology and patient prognosis across various types of
cancer. The expression patterns identified herein emphasize the
potential of FAM20A as a prognostic biomarker and
therapeutic target, particularly for STAD. By elucidating the
interplay between FAM20A expression and the tumor immune
microenvironment, the present study provides a foundation for
future investigations aimed at developing novel therapeutic
strategies.
Acknowledgements
Not applicable.
Funding
The present study was financially supported by the Shengli
Oilfield Central Hospital (grant no. zxyy-ky-202510).
Availability of data and materials
The data generated in the present study may be
requested from the corresponding author.
Authors' contributions
TN contributed to writing the original draft,
bioinformatics analyses and formal analysis. ZL was involved in
data curation, including data extraction, cleaning and dataset
verification, formal analysis, including statistical analysis using
R and PRISM, writing the original draft and investigation. ZF was
responsible for writing the original draft, in vitro
experiments and visualization. QL obtained resources and was
involved in the investigation. LL was responsible for data curation
(organization and verification of experimental data) and formal
analysis (statistical analysis of the experimental data). JW was
involved in the acquisition and interpretation of data for
bioinformatics analysis, provided resources, and contributed to
visualization and supervision. YL performed conceptualization,
supervision, project administration, reviewing and editing, and
funding acquisition. JL made substantial contributions to the
conception and design of the study and to the acquisition, analysis
and interpretation of data, including the bioinformatics results
and experimental data, and was responsible for data curation,
including the verification of bioinformatics and experimental data;
JL also contributed to funding acquisition. All authors read and
approved the final version of the manuscript. YL and JL confirm the
authenticity of all the raw data.
Ethics approval and consent to
participate
Not applicable.
Patient consent for publication
Not applicable.
Competing interests
The authors declare that they have no competing
interests.
Glossary
Abbreviations
Abbreviations:
|
FAM20A
|
family with sequence similarity 20,
member A
|
|
STAD
|
stomach adenocarcinoma
|
|
TCGA
|
The Cancer Genome Atlas
|
|
GTEx
|
Genotype-Tissue Expression
project
|
|
HPA
|
Human Protein Atlas
|
|
BLCA
|
bladder urothelial carcinoma
|
|
BRCA
|
breast cancer
|
|
CESC
|
cervical cancer
|
|
CHOL
|
cholangiocarcinoma
|
|
COAD
|
colon adenocarcinoma
|
|
ESCA
|
esophageal cancer
|
|
GBM
|
glioblastoma multiforme
|
|
HNSC
|
head and neck squamous carcinoma
|
|
KICH
|
kidney chromophobe
|
|
KIRC
|
kidney clear cell carcinoma
|
|
KIRP
|
kidney papillary cell carcinoma
|
|
LICH
|
liver hepatocellular carcinoma
|
|
LUAD
|
lung adenocarcinoma
|
|
LUSC
|
lung squamous cell carcinoma
|
|
PAAD
|
pancreatic ductal adenocarcinoma
|
|
PCPG
|
pheochromocytoma and
paraganglioma
|
|
PRAD
|
prostate adenocarcinoma
|
|
READ
|
rectal cancer
|
|
THCA
|
tthyroid papillary carcinoma
|
|
UCEC
|
uterine corpus endometrioid
carcinoma
|
|
ACC
|
adrenocortical cancer
|
|
DLBC
|
large B-cell lymphoma
|
|
LAML
|
acute myeloid leukemia
|
|
LGG
|
lower grade glioma
|
|
MESO
|
mesothelioma
|
|
OV
|
ovarian serous adenocarcinoma
|
|
SARC
|
sarcoma
|
|
SKCM
|
skin cutaneous melanoma
|
|
TGCT
|
testicular germ cell tumors
|
|
THYM
|
thymoma
|
|
UCS
|
uterine carcinosarcoma
|
|
UVM
|
uveal melanoma
|
|
OS
|
overall survival
|
|
DSS
|
disease-specific survival
|
|
PFI
|
progression-free interval
|
|
HR
|
hazard ratio
|
|
GO
|
Gene Ontology
|
|
KEGG
|
Kyoto Encyclopedia of Genes and
Genomes
|
|
GSEA
|
gene set enrichment analysis
|
|
aDC
|
activated dendritic cells
|
|
iDC
|
immature DCs
|
|
pDC
|
plasmacytoid DCs
|
|
Tcm
|
T central memory
|
|
Tem
|
T effector memory
|
|
Tfh
|
T follicular helper
|
|
Tgd
|
gamma delta T cells
|
|
IL-10
|
interleukin-10
|
|
PRKN
|
parkin RBR E3 ubiquitin protein
ligase
|
References
|
1
|
Siegel RL, Giaquinto AN and Jemal A:
Cancer statistics, 2024. CA Cancer J Clin. 74:12–49.
2024.PubMed/NCBI
|
|
2
|
Sundar R, Nakayama I, Markar SR, Shitara
K, van Laarhoven HWM, Janjigian YY and Smyth EC: Gastric cancer.
Lancet. 405:2087–2102. 2025. View Article : Google Scholar : PubMed/NCBI
|
|
3
|
Chen Y, Jia K, Xie Y, Yuan J, Liu D, Jiang
L, Peng H, Zhong J, Li J, Zhang X and Shen L: The current landscape
of gastric cancer and gastroesophageal junction cancer diagnosis
and treatment in China: A comprehensive nationwide cohort analysis.
J Hematol Oncol. 18:422025. View Article : Google Scholar : PubMed/NCBI
|
|
4
|
Guan WL, He Y and Xu RH: Gastric cancer
treatment: Recent progress and future perspectives. J Hematol
Oncol. 16:572023. View Article : Google Scholar : PubMed/NCBI
|
|
5
|
Li GZ, Doherty GM and Wang J: Surgical
management of gastric cancer: A review. JAMA Surg. 157:446–454.
2022. View Article : Google Scholar : PubMed/NCBI
|
|
6
|
Gao S, Wang X, Liu P, Liu S, Ge S, Ye K,
Zhang Z, Wang W, Li J and Tan H: Polysaccharides from Cynomorium
songaricum Rupr: Extraction and purification strategies, structural
features, bioactivities, and structure-activity relationships.
Trends Food Sci Technol. 172:1056612026. View Article : Google Scholar
|
|
7
|
Gao S, Zhang Z, Ye K, Wang W, Li J, Xu T
and Tan H: Comprehensive characterization of Rubus idaeus L.
Polysaccharides: Extraction, purification, structural diversity,
biological efficacy, and structure-activity relationships. J
Ethnopharmacol. 355((Pt B)): 1206772026. View Article : Google Scholar : PubMed/NCBI
|
|
8
|
Liu Y, Yu X, Shen H, Hong Y, Hu G, Niu W,
Ge J, Xuan J, Qin JJ and Li Q: Mechanisms of traditional Chinese
medicine in the treatment and prevention of gastric cancer.
Phytomedicine. 135:1560032024. View Article : Google Scholar : PubMed/NCBI
|
|
9
|
Nalbant D, Youn H, Nalbant SI, Sharma S,
Cobos E, Beale EG, Du Y and Williams SC: FAM20: An evolutionarily
conserved family of secreted proteins expressed in hematopoietic
cells. BMC Genomics. 6:112005. View Article : Google Scholar : PubMed/NCBI
|
|
10
|
Cui J, Xiao J, Tagliabracci VS, Wen J,
Rahdar M and Dixon JE: A secretory kinase complex regulates
extracellular protein phosphorylation. Elife. 4:e061202015.
View Article : Google Scholar : PubMed/NCBI
|
|
11
|
Ohyama Y, Lin JH, Govitvattana N, Lin IP,
Venkitapathi S, Alamoudi A, Husein D, An C, Hotta H, Kaku M and
Mochida Y: FAM20A binds to and regulates FAM20C localization. Sci
Rep. 6:277842016. View Article : Google Scholar : PubMed/NCBI
|
|
12
|
Sriwattanapong K, Theerapanon T,
Khamwachirapitak C, Sae-Ear P, Sa-Ard-Iam N, Shotelersuk V and
Porntaveetus T: In-depth investigation of FAM20A insufficiency
effects on deciduous dental pulp cells: Altered behaviours,
osteogenic differentiation, and inflammatory gene expression. Int
Endod J. 57:745–758. 2024. View Article : Google Scholar : PubMed/NCBI
|
|
13
|
Lignon G, Beres F, Quentric M, Rouzière S,
Weil R, De La Dure-Molla M, Naveau A, Kozyraki R, Dessombz A and
Berdal A: FAM20A gene mutation: Amelogenesis or ectopic
mineralization? Front Physiol. 8:2672017. View Article : Google Scholar : PubMed/NCBI
|
|
14
|
Cui J, Zhu Q, Zhang H, Cianfrocco MA,
Leschziner AE, Dixon JE and Xiao J: Structure of Fam20A reveals a
pseudokinase featuring a unique disulfide pattern and inverted
ATP-binding. Elife. 6:e239902017. View Article : Google Scholar : PubMed/NCBI
|
|
15
|
Zhang Y, Sun Q, Liang Y, Yang X, Wang H,
Song S, Wang Y and Feng Y: FAM20A: A potential diagnostic biomarker
for lung squamous cell carcinoma. Front Immunol. 15:14241972024.
View Article : Google Scholar : PubMed/NCBI
|
|
16
|
Xue G, Lin X, Wu JF, Pei D, Wang DM, Zhang
J and Zhang WJ: Identification of key genes of papillary thyroid
carcinoma by integrated bioinformatics analysis. Biosci Rep.
40:BSR202015552020. View Article : Google Scholar : PubMed/NCBI
|
|
17
|
Boutros A, Croce E, Ferrari M, Gili R,
Massaro G, Marconcini R, Arecco L, Tanda ET and Spagnolo F: The
treatment of advanced melanoma: Current approaches and new
challenges. Crit Rev Oncol Hematol. 196:1042762024. View Article : Google Scholar : PubMed/NCBI
|
|
18
|
Elder DE, Bastian BC, Cree IA, Massi D and
Scolyer RA: The 2018 World Health Organization classification of
cutaneous, mucosal, and uveal melanoma: Detailed analysis of 9
distinct subtypes defined by their evolutionary pathway. Arch
Pathol Lab Med. 144:500–522. 2020. View Article : Google Scholar : PubMed/NCBI
|
|
19
|
Hänzelmann S, Castelo R and Guinney J:
GSVA: Gene set variation analysis for microarray and RNA-seq data.
BMC Bioinformatics. 14:72013. View Article : Google Scholar : PubMed/NCBI
|
|
20
|
Livak KJ and Schmittgen TD: Analysis of
relative gene expression data using real-time quantitative PCR and
the 2(−Delta Delta C(T)) Method. Methods. 25:402–408. 2001.
View Article : Google Scholar : PubMed/NCBI
|
|
21
|
Schneider CA, Rasband WS and Eliceiri KW:
NIH Image to ImageJ: 25 years of image analysis. Nat Methods.
9:671–675. 2012. View Article : Google Scholar : PubMed/NCBI
|
|
22
|
Joshi SS and Badgwell BD: Current
treatment and recent progress in gastric cancer. CA Cancer J Clin.
71:264–279. 2021.PubMed/NCBI
|
|
23
|
Taieb J, Bennouna J, Penault-Llorca F,
Basile D, Samalin E and Zaanan A: Treatment of gastric
adenocarcinoma: A rapidly evolving landscape. Eur J Cancer.
195:1133702023. View Article : Google Scholar : PubMed/NCBI
|
|
24
|
Girnyi S, Marano L, Skokowski J, Mocarski
P, Kycler W, Gallo G, Dyzmann-Sroka A, Kazmierczak-Siedlecka K,
Kalinowski L, Banasiewicz T and Polom K: Prehabilitation approaches
for gastrointestinal cancer surgery: A narrative review. Rep Pract
Oncol Radiother. 29:614–626. 2024. View Article : Google Scholar : PubMed/NCBI
|
|
25
|
Li J, Sun J, Zeng Z, Liu Z, Ma M, Zheng Z,
He Y and Kang W: Tumour-associated macrophages in gastric cancer:
From function and mechanism to application. Clin Transl Med.
13:e13862023. View Article : Google Scholar : PubMed/NCBI
|
|
26
|
Zhang J, Hu C, Zhang R, Xu J, Zhang Y,
Yuan L, Zhang S, Pan S, Cao M, Qin J, et al: The role of
macrophages in gastric cancer. Front Immunol. 14:12821762023.
View Article : Google Scholar : PubMed/NCBI
|
|
27
|
Hansen FJ, David P and Weber GF: The
multifaceted functionality of plasmacytoid dendritic cells in
gastrointestinal cancers: A potential therapeutic target? Cancers
(Basel). 16:22162024. View Article : Google Scholar : PubMed/NCBI
|
|
28
|
Vitale I, Manic G, Coussens LM, Kroemer G
and Galluzzi L: Macrophages and metabolism in the tumor
microenvironment. Cell Metab. 30:36–50. 2019. View Article : Google Scholar : PubMed/NCBI
|
|
29
|
Gerhard GM, Bill R, Messemaker M, Klein AM
and Pittet MJ: Tumor-infiltrating dendritic cell states are
conserved across solid human cancers. J Exp Med. 218:e202002642021.
View Article : Google Scholar : PubMed/NCBI
|
|
30
|
Zhu S, Yang N, Wu J, Wang X, Wang W, Liu
YJ and Chen J: Tumor microenvironment-related dendritic cell
deficiency: A target to enhance tumor immunotherapy. Pharmacol Res.
159:1049802020. View Article : Google Scholar : PubMed/NCBI
|
|
31
|
Kloosterman DJ and Akkari L: Macrophages
at the interface of the co-evolving cancer ecosystem. Cell.
186:1627–1651. 2023. View Article : Google Scholar : PubMed/NCBI
|
|
32
|
Chen XM, Liang YB, Zuo JX, Yang ZS, Zhang
LY, Zhang XY, Wan P and Ke Y: ZG16B: A key regulator of tumor
progression and immune microenvironment modulation in cancer
(Review). Int J Mol Med. 57:582026. View Article : Google Scholar : PubMed/NCBI
|
|
33
|
Steinbrink K, Wolfl M, Jonuleit H, Knop J
and Enk AH: Induction of tolerance by IL-10-treated dendritic
cells. J Immunol. 159:4772–4780. 1997. View Article : Google Scholar : PubMed/NCBI
|
|
34
|
Saadeh D, Kurban M and Abbas O:
Plasmacytoid dendritic cell role in cutaneous malignancies. J
Dermatol Sci. 83:3–9. 2016. View Article : Google Scholar : PubMed/NCBI
|
|
35
|
Chen S, Saeed AFUH, Liu Q, Jiang Q, Xu H,
Xiao GG, Rao L and Duo Y: Macrophages in immunoregulation and
therapeutics. Signal Transduct Target Ther. 8:2072023. View Article : Google Scholar : PubMed/NCBI
|
|
36
|
Troiano G, Caponio VCA, Adipietro I,
Tepedino M, Santoro R, Laino L, Lo Russo L, Cirillo N and Lo Muzio
L: Prognostic significance of CD68+ and
CD163+ tumor associated macrophages in head and neck
squamous cell carcinoma: A systematic review and meta-analysis.
Oral Oncol. 93:66–75. 2019. View Article : Google Scholar : PubMed/NCBI
|
|
37
|
Akagi T and Kimoto T: Human cell line
(HGC-27) derived from the metastatic lymph node of gastric cancer.
Acta Med Okayama. 30:215–219. 1976.PubMed/NCBI
|
|
38
|
Sun X, Shu Y, Ye G, Wu C, Xu M, Gao R,
Huang D and Zhang J: Histone deacetylase inhibitors inhibit
cervical cancer growth through Parkin acetylation-mediated
mitophagy. Acta Pharm Sin B. 12:838–852. 2022. View Article : Google Scholar : PubMed/NCBI
|
|
39
|
Youle RJ and Narendra DP: Mechanisms of
mitophagy. Nat Rev Mol Cell Biol. 12:9–14. 2011. View Article : Google Scholar : PubMed/NCBI
|
|
40
|
Yao J, Wang J, Xu Y, Guo Q, Sun Y, Liu J,
Li S, Guo Y and Wei L: CDK9 inhibition blocks the initiation of
PINK1-PRKN-mediated mitophagy by regulating the SIRT1-FOXO3-BNIP3
axis and enhances the therapeutic effects involving mitochondrial
dysfunction in hepatocellular carcinoma. Autophagy. 18:1879–1897.
2022. View Article : Google Scholar : PubMed/NCBI
|
|
41
|
Xiong Z, Yang L, Zhang C, Huang W, Zhong
W, Yi J, Feng J, Zouxu X, Song L and Wang X: MANF facilitates
breast cancer cell survival under glucose-starvation conditions via
PRKN-mediated mitophagy regulation. Autophagy. 21:80–101. 2024.
View Article : Google Scholar : PubMed/NCBI
|
|
42
|
Wu Q, Wang Z, Chen S, She X, Zhu S, Li P,
Liu L, Zhao C, Li K, Liu A, et al: USP26 promotes colorectal cancer
tumorigenesis by restraining PRKN-mediated mitophagy. Oncogene.
43:1581–1593. 2024. View Article : Google Scholar : PubMed/NCBI
|
|
43
|
Haggstrom L, Chan WY, Nagrial A, Chantrill
LA, Sim HW, Yip D and Chin V: Chemotherapy and radiotherapy for
advanced pancreatic cancer. Cochrane Database Syst Rev.
12:CD0110442024.PubMed/NCBI
|
|
44
|
Jiang Y, Wang C, Zu C, Rong X, Yu Q and
Jiang J: Synergistic potential of nanomedicine in prostate cancer
immunotherapy: Breakthroughs and prospects. Int J Nanomedicine.
19:9459–9486. 2024. View Article : Google Scholar : PubMed/NCBI
|