Introduction
Despite a declining incidence of distal gastric
cancer, the incidence of adenocarcinoma of the distal esophagus and
stomach has increased and remains among the most common
malignancies in the world and the second leading cause of
cancer-related death (1). There
exists marked geographical variation in incidence with higher
occurrence in Asia compared to Europe and the US (2). In the western world most patients with
esophageal or gastric cancer present at a late stage with locally
advanced or metastatic disease beyond curative options. Only in a
minority of patients presenting at an early stage, does surgical
resection have a real curative intent resulting in 5-year survival
rates of approximately 70% for stage I, while in stage II the
5-year survival drops to only 35% (3). Patients with advanced adenocarcinoma
of the distal esophagus or stomach have a dismal prognosis making
early detection of the utmost importance (4,5).
Although screening with gastroscopy has been used in endemic areas,
this approach has limitations regarding patient burden, accuracy,
availability and cost (6,7). In developed countries, the prognosis
of patients with solid malignancies has improved gradually. The use
of tailored surgery, sophisticated radiotherapy and the use of
adjuvant medical treatment in breast, colorectal and more recently
gastric cancer have increased significantly. Both postoperative
chemoradiotherapy and perioperative chemotherapy are associated
with better disease-free and overall survival in gastric cancer
(8,9). Concomitantly, with an improved
prognosis, the early costs of treatment have increased
significantly. Moreover, the treatment of metastatic disease with
novel agents is an increasingly costly undertaking. Therefore, in
light of the increased cost of health care, it is of major
importance to find easily applicable and robust technology that
improves the early detection of malignancy, and predicts treatment
response and patient survival.
Serum biomarkers within the proteome are among the
more promising future screening tools for cancer detection, as
prognostic markers for disease relapse and survival and potentially
as predictive markers of chemotherapy response. Surface-enhanced
laser desorption/ionization-time of flight (SELDI-TOF) mass
spectrometry (MS) technology enables the analysis of the relative
expression levels of proteins over a wide range of molecular
weights in biological samples, focusing on low abundant proteins.
Differences in serum protein expression levels may be used to
identify disease-specific proteomic profiles or ‘fingerprints’.
Proteomic analysis potentially also avoids overlooking
posttranslational modifications and may be a useful method in the
analysis of changes occurring over time during or following
chemotherapy (10).
Previously, our group identified several candidate
biomarkers for renal cell carcinoma by using the same proteomic
analytical technique. Although some m/z values were difficult to
reproduce, the increased expression of the previously identified
serum amyloid-α (SAA) peak cluster was validated in different
patient populations (11).
We hypothesized that we would be able to identify i)
novel and disease-specific peptides that differentiate patients
with advanced adenocarcinoma of the distal esophagus or stomach
(GC) from normal controls (NC), ii) peptide profiles that would be
able to predict response or prolonged survival following palliative
chemotherapy, and iii) peptides that change differentially over
time during chemotherapy in chemotherapy responsive and
non-responsive patients. Serum of GC patients was prospectively
collected, prior to and during first-line chemotherapy with
epirubicin, cisplatin and capecitabine, and simultaneously from
matched NC, and then analyzed by SELDI-TOF MS.
Materials and methods
Patient characteristics (Table I)
Serum samples were prospectively collected from all
chemotherapy naive patients with histologically confirmed advanced
adenocarcinoma of the distal esophagus or stomach (GC). The study
was approved by the local medical ethics committee, and the
patients gave written informed consent. Only patients with a
performance score WHO ≤2, measurable disease according to RECIST
criteria (12) and adequate
haematological, renal and hepatic functions [absolute neutrophil
count ≥1.5×10⁹/l, platelets ≥100×109/l,
bilirubin ≤1.5 times the upper limit of the normal range (ULN), AST
and ALT ≤2.0 ULN, but in the presence of liver metastases ≤5.0 ULN;
serum creatinine ≤2.0 times ULN] were eligible. Previous surgery
was allowed. The control group consisted of normal subjects that
were selected based on a short questionnaire and matched for age,
gender and time period of blood donation.
Treatment and tumor evaluation
Patients received first-line chemotherapy with
epirubicin (50 mg/m2) and cisplatin (60
mg/m2) intravenously on day 1, followed by oral
capecitabine (1,000 mg/m2) twice daily on days 1–14
(ECC), every 3 weeks (Table II).
Tumor response was assessed every other cycle by computer
tomography scan.
 | Table IITreatment characteristics. |
Table II
Treatment characteristics.
| No. of treatment
cycles | No. of patients |
|---|
| 0–1 | 5 |
| 2–4 | 31 |
| 5–6 | 41 |
| >6 | 5 |
Sample collection and definitions
Whole blood samples were obtained at regular
predefined times: intervals starting prior to the start of
chemotherapy and immediately prior to each chemotherapy cycle in
weeks 3, 6, 9, 12, 15 and 18 or later in case of treatment delay.
Whole blood samples of patients and normal controls were collected
by applying a standardized drawing and handling procedure in
standard tubes (BD Vacutainer™ SST II 8.5 ml; BD Company, Franklin
Lakes, NJ, USA). Samples were allowed to clot for 15 min and then
centrifuged at 3,000 rpm for 10 min at room temperature (13). Subsequently, the serum was
transferred in equal aliquots to five polypropylene tubes (1.4 ml)
and stored at −30°C until analysis. The serum samples originated
from the Netherlands Cancer Institute serum bank.
The primary analysis consisted of a comparison of
the proteomic profiles of GC patients and NC subjects. For the
subsequent analysis of proteomic profile differences between
responding patients and non-responders, the patients were divided
into two groups according to response: i) responder: patients
developing complete response, partial response and stable disease
for a duration of >6 months, respectively, and ii)
non-responders: patients developing stable disease for a duration
of <6 months or progressive disease, respectively. In the search
for a prognostic proteomic profile for predicting survival, we
divided the patients according to ≤ or >6-month survival.
SELDI-TOF analysis
Protein profiling was performed using SELDI-TOF MS
(Biorad Laboratories, Hercules, CA, USA). Previously, we screened
different chromatographic and binding conditions in patients with
colorectal cancer (14). The CM 10
chip is a weak cation exchange chip that contains anionic
carboxylate groups that bind positively charged proteins in serum.
A binding buffer of 20 mM sodium phosphate + 0.1% Triton X-100
(Sigma, St. Louis, MO, USA) (pH 5.0) and a 100% solution of
sinapinic acid (SPA; BioRad Laboratories) in 50% acetonitrile +
0.5% trifluoracetic acid as an energy absorbing matrix yielded the
most discriminating m/z values (12).
Samples were thawed only once and analyzed twice (in
doublets). After thawing, the serum samples were denatured by
adding 180 μl of a solution containing 9 M urea, 2% CHAPS, 1% DTT
(all from Sigma) to 20 μl of serum. CM 10 chips were assembled in
96-well format bioprocessors (BioRad Laboratories). During all
steps of the protocol, the bioprocessor was placed on a platform
shaker at 350 rpm. Chips were equilibrated twice with 200 μl of
binding buffer for 5 min. Subsequently, 180 μl of binding buffer
and 20 μl of denatured sample were applied to the chip surface.
Sample allocation was random for comparison of GC vs. NC sera. For
the analysis of serial GC sera, all samples from the same patient
were analyzed on the same chip whenever possible, and the remaining
samples were allocated at random. For quality control, a separate
sample from a healthy volunteer was used and spotted on the
remaining locations (4–6 spots) across the bioprocessor. Incubation
was set to 30 min. After binding, the chips were washed twice for 5
min with binding buffer, followed by two 5-min washings with
binding buffer without Triton X-100. Finally, the chips were rinsed
with deionised water, air dried and finished with two 1-μl SPA
applications to the sample spots. The reproducibility of the
applied methodology was previously validated by our group (11).
Protein chips were analyzed using the PBS-IIC
Protein Chip Reader (BioRad Laboratories). Data were collected
between 0 and 200,000 Da. Data collection was optimized for
detection of discriminating peaks, resulting in an average of 65
laser shots per spectrum at laser intensity 150, detector
sensitivity 8 and laser focusing at 3,000 Da. M/z values for the
detected proteins were calibrated externally with a standard
peptide mixture (BioRad Laboratories) containing vasopressin
(1,084.3 Da), somatostatin (1,637.9 Da), dynorphine (2,147.5 Da),
ACTH (2,933.5 Da), insulin β-chain (bovine; 3,495.5 Da), insulin
(human recombinant; 5,807.7 Da) and hirudin (7,033.6 Da) (11).
Bioinformatics
Serum proteomic MS data of GC patients and matched
NC were processed using the tbimass R-package (www.r-project.org). For pre-processing, the spectra
were re-sampled to a common m/z vector, and the baseline was
corrected using the PROcess R-Package. Furthermore, the intensity
of the spectra was normalised to the total ion current to reduce
noisy variance between replicate measurements (15). To correct for small deviations in
the m/z values due to calibration, the alignment algorithm by
Jeffries was implemented in tbimass and applied (16). For classification, the support
vector machine implementation within the MCRestimate R-package was
applied. For variable selection, a variable filtering procedure
based on the relative intensity variance was used for
classification. To assess the classification accuracy, a 10-fold
repetition of 10-fold cross validation with a nested 3-fold
parameter optimisation loop was conducted. The number of variables
used for classification was reduced in each classification by
recursive feature elimination (17).
Results
Clinical outcome
A total of 82 patients with adenocarcinoma of the
distal esophagus and stomach were treated with first-line
chemotherapy (Tables I and II). The mean age was 57 years (range
34–74) and there were 57 males (69.5%) and 25 females (30.5%).
Patients were previously untreated except one patient who had
received chemoradiotherapy, including capecitabine, and 8 patients
who had received radiotherapy for proximal gastric carcinoma,
respectively. The patients had locally advanced or metastatic
gastric cancer and were therefore all included in the survival
analysis and the proteomic profiling. Fourteen patients were not
assessable for response according to RECIST criteria (12). Seven patients had only localized
disease and were operable after chemotherapy, and 7 other patients
were excluded after radiological review of CT scans due to
non-measurable disease. The mean follow-up was 12 months, and the
mean number of chemotherapy cycles was five. Complete and partial
response was noted in 5 and 20 patients, respectively (response
rate, 37%; intention to treat, 30%). Additionally, 38 patients had
stable disease for >3 months; 18 of these for >6 months. Five
patients had chemotherapy-resistant disease and showed progression
at the time of first evaluation. The median time to progression was
6.2 months (95% CI, 5.6–6.7), median progression-free survival was
6 months (95% CI, 5.4–6.5) and median overall survival was 10.8
months (95% CI, 9.5–12.1), respectively. In case of progression,
the most common sites were local lymph nodes, peritoneal cavity,
liver and bones.
Proteomic profiling of gastric cancer
patients and normal controls
Serum obtained immediately prior to the start of ECC
chemotherapy in all 82 patients with advanced or metastatic GC was
analyzed by SELDI-TOF MS and compared with serum of 80 NC. Patients
were matched for age, gender and time-period of serum collection.
In the pre-processing normalization procedure, 4 serum samples from
the GC population were categorized as outliers and excluded from
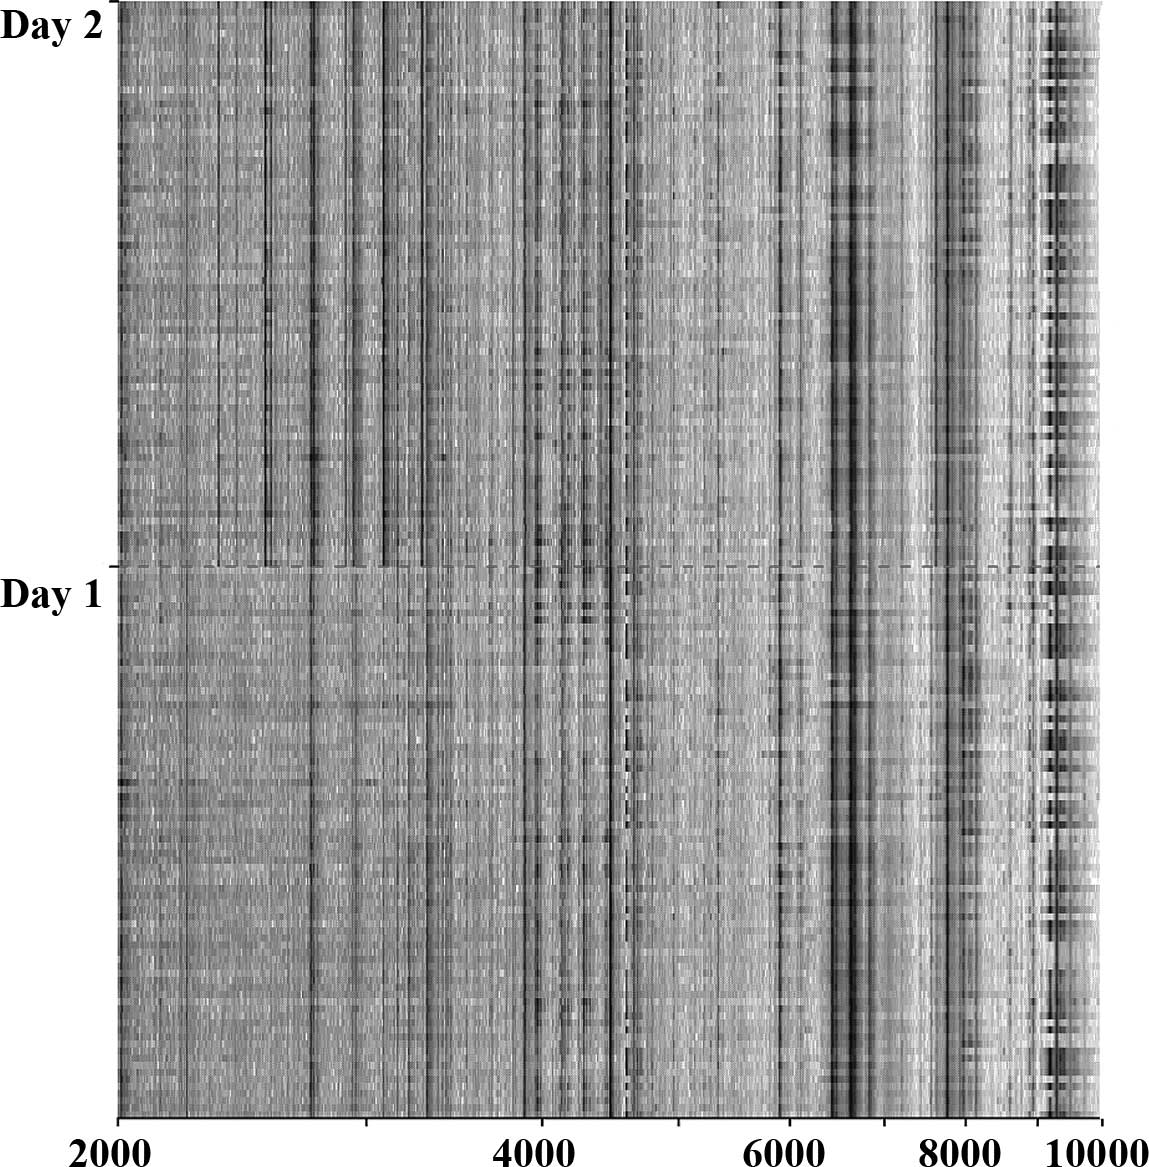
further analysis (13). By global
proteomic profiling, some differences in the proteomic profile of
GC patients, according to the day of SELDI-TOF analysis, was
noticed (Fig. 1). By comparing GC
patients and NC we identified 32 m/z values that differentiated
between the two groups (Table
III). Fourteen of these were identified during the first
measurement run 1, and 19 during the second measurement performed
one day later. One m/z value was identified by the two
measurements. To minimize the influence of day-to-day variations,
we based the further classification on the proteomic profiling of
all serum samples, independent of the day of measurement. The
quality of the classification model was not influenced by the
difference in identity and intensity of the most discriminating
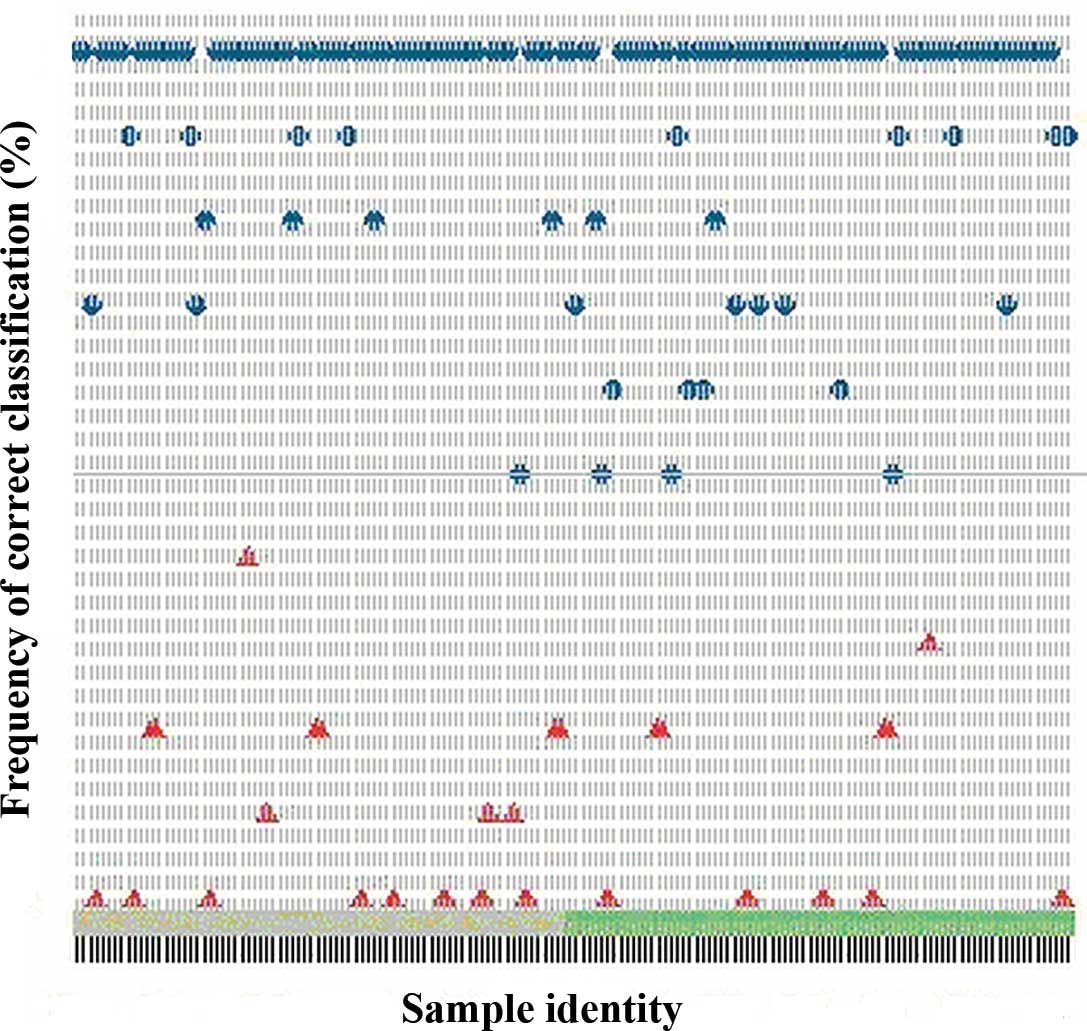
proteins for GC and NC. The classification model built on the
pooled dataset correctly classified 72 out of the 80 NC
(specificity, 90%) and 63 out of the 78 GC patients (sensitivity,
81%) (Fig. 2).
| Table IIIObjective response rate according to
RECIST criteria. |
Table III
Objective response rate according to
RECIST criteria.
| Response | No. of patients | % |
|---|
| Evaluable for
proteomics | 78 | 95 |
| Evaluable for
response | 68 | 83 |
| Complete
response | 5 | 7 |
| Partial response | 20 | 30 |
| Stable disease | 38 | 56 |
| (>6 months) | (18) | (26) |
| Progressive
disease | 5 | 7 |
Proteomic profiling and response
prediction
Proteomic profiles of serum obtained from GC
patients immediately prior to the start of ECC chemotherapy were
analyzed according to response to chemotherapy. Response evaluation
was determined prior to the start and after every second cycle,
according to the protocol, in 68 patients eligible for response
evaluation. Patients were divided into two groups: responders (43)
and non-responders (25),
respectively. By applying the Mann-Whitney U test, a positive
correlation was observed between six proteomic peaks (3.0, 3.1,
3.8, 4.7, 7.6 and 33.3 kDa) and treatment response, but none
significantly predicted chemotherapy effect.
Proteomic profiling and survival
prediction
Proteomic profiles of serum obtained from GC
patients immediately prior to the start of ECC chemotherapy were
related to overall survival. Median overall survival of the
patients was 11 months (95% CI, 9.5–12). Using data dichotomisation
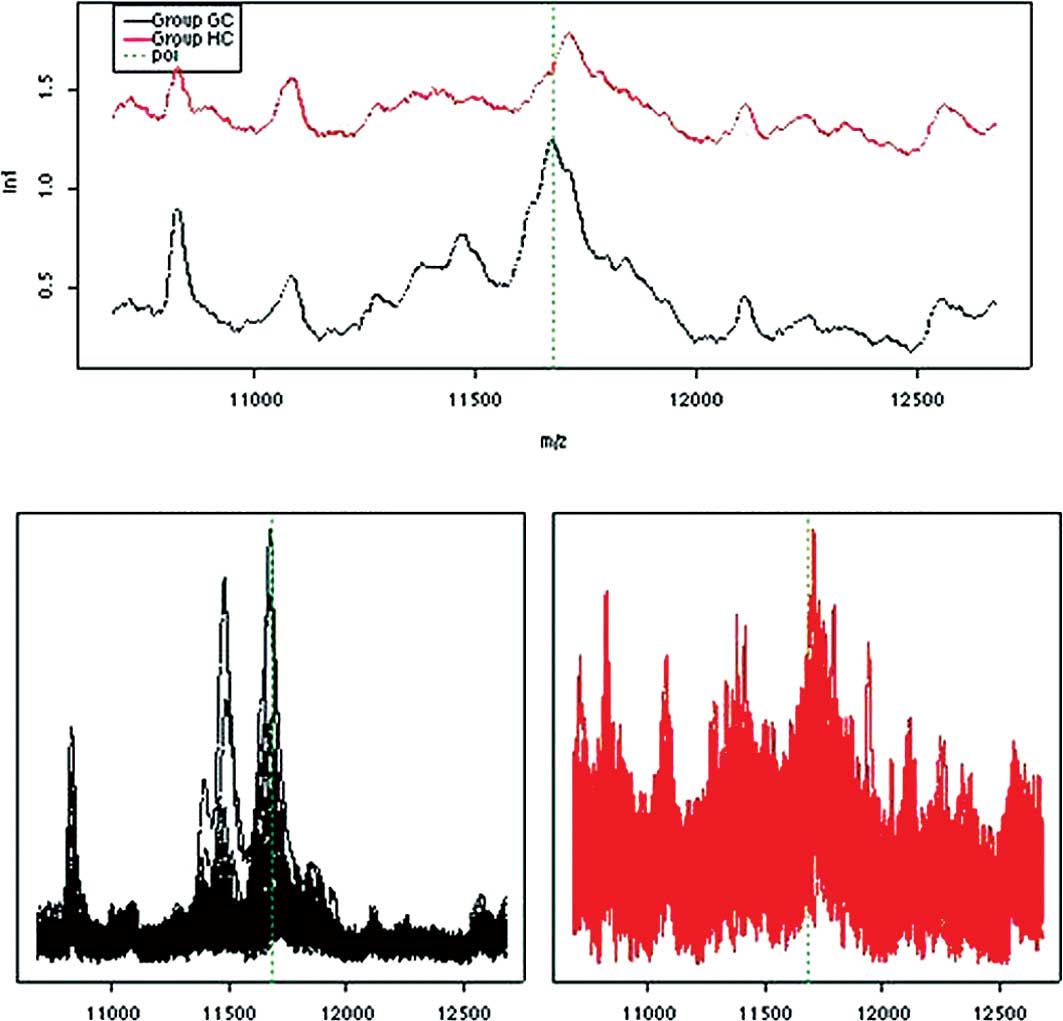
and multivariate Cox regression analysis, a significant positive
relationship was observed between low intensity (cut-off value
<0.4) of the protein m/z 11.6 kDa and longer survival of 12 vs.
9.6 months, respectively (p=0.003). This m/z value has been shown
to be SAA with a molecular weight of 11.6 kDa. In concordance, a
higher expression of SAA has previously been correlated with
advanced malignancies (18) and
various forms of acute phase reactions (19). These results correlate well with the
proteomic profiling of the NC subjects who had the lowest median
intensity of SAA (Fig. 3).
Serial proteomic profiling
Fifty patients with measurable disease according to
RECIST had adequate serial sample collections at baseline prior to
chemotherapy and sequentially thereafter at approximately 6, 12 and
18 weeks after the start of the treatment. These serially collected
serum samples were analyzed according to the best tumor response,
which frequently developed after four treatment cycles. No
significant proteomic changes or potential biomarkers associated
with therapy monitoring were detected.
Discussion
In this single institutional phase II study, we
described the detection of significantly different proteomic
patterns in GC patients vs. NC subjects serving as potential
biomarkers of gastric cancer. Protein analysis of serum from cancer
patients by advanced technologies, including SELDI-TOF MS, is a
promising tool with which to identify novel proteins, protein
fragments or proteomic profiles that are specific for particular
malignancies for use as biomarkers for disease detection, as
prognostic parameters or for the prediction of treatment
response.
The age distribution and metastatic pattern revealed
that the patients selected most likely represent a real life
population of GC patients. The median time to progression was 7
months and overall survival was 11 months, which is comparable to
other studies of anthracycline, cisplatin and 5-fluorouracil
chemotherapeutic combination regimens in patients with advanced
gastric cancer (20). The study was
conducted according to a strict protocol regarding serum
collection, handling and storage at −30°C to minimize pre-analytic
influence of serum sampling on the SELDI-TOF protein profiles
(21). The selected patients had
advanced gastric adenocarcinoma and underwent standard first-line
chemotherapy. This strategy enabled us to focus on a homogeneous
patient population acknowledging the usual variability between
different patient populations that may affect outcome of the
analysis. Samples were analyzed twice on two separate days after
sample preparation. By comparing GC and NC subjects, we identified
32 different m/z values, representing peptides and proteins, which
possibly correlate to the active malignant process, metastatic
disease or survival. By pooling all of the most important m/z
values differentiating GC patients and NC subjects, the potential
bias caused by differences in the outcome of proteomic analysis on
different analysis days was limited. This made the analysis
time-independent to the greatest extent possible. Selection of the
included m/z values was based on their relative importance of the
peak value in the classification between GC patients and matched NC
(Table IV). The classification
model based on the whole dataset correctly classified GC patients
and NC with 90% specificity and 81% sensitivity. This
classification served as a potential GC-specific proteomic profile
differentiating GC patients from normal subjects. A correlation
analysis of proteomic profile vs. clinical outcome, response and
survival, showed no predictive or prognostic biomarkers with any
certainty, although we identified protein 11.6 kDa as a potential
prognostic biomarker. This m/z value was previously identified as
SAA with a molecular weight of 11.6 kDa. In concordance, a higher
expression of SAA was previously related to advanced malignancies
(18) and various types of acute
phase reactions (19) and the
finding was therefore anticipated. We were not able to identify
reliable or predictive biomarkers of treatment response even though
the sample size was relatively large. Possibly this was related to
the intrinsic differences between the malignancies, differences in
disease extent and differences in patient characteristics, such as
gender and age. The influence of patient demographics on the
proteomic profile is not well known, but Villanueva et al
found that gender and age had negligible influence on the
discrimination between patients with thyroid cancer and healthy
subjects (22). In concordance with
the inability to identify predictive biomarkers, in the serial
analysis of 50 patients with gastric cancer, with consistent sample
collection and response evaluation throughout the entire treatment,
no significant changes in the predictive proteomic profile during
chemotherapy were identified. In proteomic profiling studies in
gastric cancer of comparable sample size and design performed by
others, changes could not be identified. Several studies analyzing
disease-specific proteomic patterns, in search of novel diagnostic
or predictive biomarkers in advanced and early breast cancer
patients have been published (23,24).
Irrespective of the different clinical setting and technical
approach, most of these analyses found an association between
several known proteins or their fragments, such as diverse
apolipoproteins, complement factors, fibrinogen and haptoglobin.
Many of these have been shown not to be disease-specific, and none
have been validated in a prospective clinical study (25).
| Table IVThe most important m/z values
contributing to the classification model according to the day of
SELDI-TOF analysis. |
Table IV
The most important m/z values
contributing to the classification model according to the day of
SELDI-TOF analysis.
| Peak (Da) | Importancea |
|---|
| Day 1b |
| 3892.7447 | 0.714944646 |
| 15625.932 | 0.675882146 |
| 29686.354 | 0.657327458 |
| 9989.2487 | 0.594808005 |
| 10574.214 | 0.589944646 |
| 46048.839 | 0.588948630 |
| 6674.9972 | 0.587991521 |
| 144017.79 | 0.576272771 |
| 7096.0364 | 0.570413396 |
| 3775.4055 | 0.562600896 |
| 8291.9817 | 0.560596815 |
| 4438.7837 | 0.550882146 |
| 9721.6843 | 0.548929021 |
| 124829.75 | 0.547933005 |
| Day 2c |
| 3892.745 | 1.459401 |
| 40544.12 | 1.200624 |
| 6623.487 | 1.141141 |
| 13736.36 | 1.048368 |
| 4245.927 | 1.034613 |
| 24024.73 | 0.868681 |
| 3639.509 | 0.783559 |
| 4548.882 | 0.768973 |
| 3316.726 | 0.621440 |
| 25482.25 | 0.608915 |
| 15618.04 | 0.603906 |
| 25270.93 | 0.577259 |
| 4641.661 | 0.556181 |
| 4751.328 | 0.544462 |
| 4377.272 | 0.544187 |
| 25100.50 | 0.536512 |
| 3891.431 | 0.534280 |
| 2183.326 | 0.524931 |
| 20841.38 | 0.505400 |
The most differentiating proteins, based on their
relative importance of the peak value in the classification between
gastric cancer patients and matched normal control subjects
(Table IV), varied on different
days of analysis. To further reduce any variability, analysis of
all samples needs to be carried out on one single day. Many
peptides detected by MS have not been structurally identified.
Although a further characterization of the peptides included in the
profile may help to understand the biological processes they
represent, identification is not a prerequisite for the use of the
profile for predictive or prognostic biomarkers. Our results need
further validation in a prospective study in order to explore the
reproducibility of the identified classifiers that may serve as
biomarkers of gastric cancer.
One limitation of our study was the manual handling
of the samples and the preparation of the samples for SELDI
analysis after thawing. This is possibly the most important cause
of the identified differences in the proteomic profiles on days 1
and 2 of the analysis. Automatic sample handling using robot
systems will allow a much faster analysis and near simultaneous
mass-spectrum analysis of complete sample sets eliminating the
confounding effect of manual sample handling.
In conclusion, the identified proteomic profile
enabled the differentiation between GC patients with advanced
disease and NC subjects. We identified 32 protein peaks
differentiating gastric cancer and normal controls that made it
possible to build a classification model separating these two
groups with a relatively high specificity and sensitivity. By
incorporating strict sample handling, storage and analyses, we
improved the robustness of SELDI-TOF MS analysis, but by
introducing automatic robot sample handling methods, further
optimization of proteomic profiling of solid malignancies may be
possible. Future studies aimed at identifying surrogate proteomic
profiles as prognostic biomarkers of gastric cancer and patient
survival and predictive biomarkers of treatment efficacy are
warranted.
Acknowledgements
Author contributions: Helgi H. Helgason and Jan H.M.
Schellens designed the research. Helgi H. Helgason, Annemieke Cats,
Henk Boot and Jan H.M. Schellens conducted the study. Helgi H.
Helgason analyzed the clinical data. Helgi H. Helgason, Judith
Y.M.N. Engwegen, Jos H. Beijnen and Mark Zapatka analyzed the
proteomic results. Helgi H. Helgason, Jan H. Schellens and Judith
Y.M.N. Engwegen wrote the manuscript.
References
|
1
|
Jemal A, Siegel R, Ward E, Hao Y, Xu J and
Thun MJ: Cancer statistics 2009. CA Cancer J Clin. 59:225–249.
2009. View Article : Google Scholar
|
|
2
|
Parkin DM, Bray F, Ferlay J and Pisani P:
Global cancer statistics, 2002. CA Cancer J Clin. 55:74–108. 2005.
View Article : Google Scholar
|
|
3
|
Hundahl SA, Phillips JL and Menck HR: The
National Cancer Data Base Report on poor survival of US gastric
carcinoma patients treated with gastrectomy: Fifth Edition American
Joint Committee on Cancer staging, proximal disease and the
‘different disease’ hypothesis. Cancer. 88:921–932. 2000.
|
|
4
|
Karpeh MS, Leon L, Klimstra D and Brennan
MF: Lymph node staging in gastric cancer: Is location more
important than number? An analysis of 1,038 patients. Ann Surg.
232:362–371. 2000. View Article : Google Scholar : PubMed/NCBI
|
|
5
|
Lim L, Michael M, Mann GB and Leong T:
Adjuvant therapy in gastric cancer. J Clin Oncol. 23:6220–6232.
2005. View Article : Google Scholar : PubMed/NCBI
|
|
6
|
Green PH, Fleischauer AT, Bhagat G, Goyal
R, Jabri B and Neugut AI: Risk of malignancy in patients with
celiac disease. Am J Med. 115:191–195. 2003. View Article : Google Scholar : PubMed/NCBI
|
|
7
|
Murakami R, Tsukuma H, Ubukata T,
Nakanishi K, Fujimoto I, Kawashima T, Yamazaki H and Oshima A:
Estimation of validity of mass screening program for gastric cancer
in Osaka, Japan. Cancer. 65:1255–1260. 1990. View Article : Google Scholar : PubMed/NCBI
|
|
8
|
Macdonald JS, Smalley SR, Bendedetti J,
Hundahl SA, Estes NC, Stemmermann GN, Haller DG, Ajani JA,
Gunderson LL, Jessup JM and Martenson JA: Chemoradiotherapy after
surgery compared with surgery alone for adenocarcinoma of the
stomach or gastroesophageal junction. N Engl J Med. 345:725–730.
2001. View Article : Google Scholar
|
|
9
|
Cunningham D, Allum WH, Stenning SP,
Thompson JN, van de Velde CJ, Nicolson M, Scarffe JH, Lofts FJ,
Falk SJ, Iveson TJ, Smith DB, Langley RE, Verma M, Weeden S and
Chua YJ: MAGIC Trial Participants: Perioperative chemotherapy
versus surgery alone for resectable gastroesophageal cancer. N Engl
J Med. 355:11–20. 2006. View Article : Google Scholar
|
|
10
|
Petricoin EF and Liotta LA:
SELDI-TOF-based serum proteomic pattern diagnostics for early
detection of cancer. Curr Opin Biotechnol. 15:24–30. 2004.
View Article : Google Scholar : PubMed/NCBI
|
|
11
|
Engwegen JY, Mehra N, Haanen JB, Bonfrer
JM, Schellens JH, Voest EE and Beijnen JH: Validation of SELDI-TOF
MS serum protein profiles for renal cell carcinoma in new
populations. Lab Invest. 87:161–172. 2007. View Article : Google Scholar : PubMed/NCBI
|
|
12
|
Therasse P, Arbuck SG, Eisenhauer EA,
Wanders J, Kaplan RS, Rubinstein L, Verweij J, van Glabbeke M, van
Oosterom AT, Christian MC and Gwyther SG: New guidelines to
evaluate the response to treatment in solid tumors. European
Organization for Research and Treatment of Cancer, National Cancer
Institute of the United States, National Cancer Institute of
Canada. J Natl Cancer Inst. 92:205–216. 2000. View Article : Google Scholar
|
|
13
|
Engwegen JY, Gast MC, Schellens JH and
Beijnen JH: Clinical proteomics: searching for better tumour
markers with SELDI-TOF mass spectrometry. Trends Pharmacol Sci.
27:251–259. 2006. View Article : Google Scholar : PubMed/NCBI
|
|
14
|
Engwegen JY, Helgason HH, Cats A, Harris
N, Bonfrer JM, Schellens JH and Beijnen JH: Identification of serum
proteins discriminating colorectal cancer patients and healthy
controls using surface-enhanced laser desorption ionisation-time of
flight mass spectrometry. World J Gastroenterol. 12:1536–1544.
2006.
|
|
15
|
Meuleman W, Engwegen JY, Gast MC, Beijnen
JH, Reinders MJ and Wessels LF: Comparison of normalisation methods
for surface-enhanced laser desorption and ionisation (SELDI)
time-of-flight (TOF) mass spectrometry data. BMC Bioinformatics.
9:882008. View Article : Google Scholar : PubMed/NCBI
|
|
16
|
Jeffries N: Algorithms for alignment of
mass spectrometry proteomic data. Bioinformatics. 21:3066–3073.
2005. View Article : Google Scholar : PubMed/NCBI
|
|
17
|
Guyon I, Weston J and Barnhill S: Gene
selection for cancer classification using support vector machines.
Machine Learning. 46:389–422. 2002. View Article : Google Scholar
|
|
18
|
Maciel CM, Junqueira M, Paschoal ME,
Kawamura MT, Duarte RL, Carvalho Mda G and Domont GB: Differential
proteomic serum pattern of low molecular weight proteins expressed
by adenocarcinoma lung cancer patients. J Exp Ther Oncol. 5:31–38.
2005.PubMed/NCBI
|
|
19
|
Kosuge M, Ebina T, Ishikawa T, Hibi K,
Tsukahara K, Okuda J, Iwahashi N, Ozaki H, Yano H, Kusama I, Nakati
T, Umemura S and Kimura K: Serum amyloid A is a better predictor of
clinical outcomes than C-reactive protein in non-ST-segment
elevation acute coronary syndromes. Circ J. 71:186–190. 2007.
View Article : Google Scholar : PubMed/NCBI
|
|
20
|
Wagner AD, Grothe W, Haerting J, Kleber G,
Grothey A and Fleig WE: Chemotherapy in advanced gastric cancer: a
systematic review and meta-analysis based on aggregate data. J Clin
Oncol. 24:2903–2909. 2006. View Article : Google Scholar : PubMed/NCBI
|
|
21
|
Timms JF, Arslan-Low E, Gentry-Maharaj A,
Luo Z, T’Jampens D, Podust VN, Ford J, Fung ET, Gammerman A, Jacobs
I and Menon U: Preanalytic influence of sample handling on
SELDI-TOF serum protein profiles. Clin Chem. 53:645–656. 2007.
View Article : Google Scholar : PubMed/NCBI
|
|
22
|
Villanueva J, Martorella AJ, Lawlor K,
Philip J, Fleisher M, Robbins RJ and Tempst P: Serum peptidome
patterns that distinguish metastatic thyroid carcinoma from
cancer-free controls are unbiased by gender and age. Mol Cell
Proteomics. 5:1840–1852. 2006. View Article : Google Scholar : PubMed/NCBI
|
|
23
|
Van Winden AW, Gast MC, Beijnen JH,
Rutgers EJ, Grobbee DE, Peeters PH and van Gils CH: Validation of
previously identified serum biomarkers for breast cancer with
SELDI-TOF MS: a case control study. BMC Med Genomics.
2:42009.PubMed/NCBI
|
|
24
|
Li J, Orlandi R, White CN, Rosenzweig J,
Zhao J, Seregni E, Morelli D, Yu Y, Meng XY, Zhang Z, Davidson NE,
Fung ET and Chan DW: Independent validation of candidate breast
cancer serum biomarkers identified by mass spectrometry. Clin Chem.
51:2229–2235. 2005. View Article : Google Scholar : PubMed/NCBI
|
|
25
|
Gast MC, Schellens JH and Beijnen JH:
Clinical proteomics in breast cancer: a review. Breast Cancer Res
Treat. 116:17–29. 2009. View Article : Google Scholar : PubMed/NCBI
|