Introduction
Stem cells, with the ability to proliferate
infinitely through self-renewal and differentiation, can be
isolated and cultured from inner cell mass of blastocyst (1), primordial germ cells (2), bone marrow (3), brain (4), skin (5), digestive canal (6), respiratory tract (7), cornea (8), muscle (9), liver (10), pancreas (11) and lung (12). Many tumors contain a sub-population
of stem cells known as cancer stem cells (CSCs). CSC has unlimited
potential for self-renewal and can drive tumorigenesis and develop
multidrug resistance (13,14). To date, CSCs have been identified in
human leukemia (15) and in solid
tumors including breast (16),
bladder (17), colorectal (18), gastric (19), hepatocellular (20) and lung carcinomas (21), malignant melanoma (22), nasopharyngeal (23), pancreatic (24), prostate (25) and renal carcinomas (26). However, the characterization of CSC
remains insufficient and CSC has not been isolated from some
tumors. CSC is regarded as the root of cancer, and thus should be
more important for cancer therapy than other tumor cells.
Therefore, CSC might be a good therapeutic target for cancer
treatment.
Side population (SP) cells, originally isolated from
murine hematopoietic stem cells using their characteristic to
efflux Hoechst 33342 dye and FACS method (27), have been sorted from many normal
human tissues such as heart (28),
prostate (29), limbal epithelium
(30), skin (31), mammary gland (32) and kidney (33), and have also isolated from human
cancer cells such as small cell lung cancer (34), glioma (35), prostate cancer (36), leukemia (37), neuroblastoma (38), hepatoma (39), nasopharyngeal carcinoma (23), colorectal cancer (39), thyroid cancer (40) and lung cancer (41). Cancer SP cells exhibit stem
cell-like functions such as resistance to chemotherapy drugs,
clonogenic ability and tumorigenicity. Therefore, SP cells can be
regarded as a kind of enriched CSCs.
The phenotype of SP cells depends on the expression
of ABCG2, a member of ATP binding cassette (ABC) transporters which
belong to one of the largest transmembrane protein families. They
use ATP to transport various substrates across cell membranes. The
substrates include chemotherapy drugs, metabolites and other
compounds such as Hoechst 33342 dye. To present, about 50 ABC
transporters have been identified (42) and are divided into seven subfamilies
(from A to G), among which ABCG2 is the second member of the G
subfamily. ABCG2 was first identified in doxorubicin-resistant
human MCF-7 breast cancer cells and thus also named as breast
cancer resistance protein (BCRP) (43). It is widely distributed in normal
tissues and stem cells including SP cells. High expression of ABCG2
has been detected in CSCs isolated from embryonic cancer (44), retinoblastoma (45), lung (41), liver (46), pancreas (47) and gallbladder cancer (48).
Previously we have identified LRCs in
nasopoharyngeal epithelia and NPC xenograft tissues with
bromodeoxyuridine (BrdU) (49). In
this study, we isolated ABCG2+ and ABCG2−
cells from 5–8F NPC cells by using MACS and then characterized
their biological properties and expression profiles. Our results
suggest that ABCG2 alone is insufficient to identify CSCs in 5–8F
NPC cells.
Materials and methods
Ethics statement
All animal work was performed under the
institutional guidelines approved by the Animal Care and Use
Committee of Central South University. The present study was also
approved ethically by the institutional review board of Central
South University.
Double labeling detection for LRC and
ABCG2 expression in 5–8F cells
We used immunofluorescence method to detect LRCs and
ABCG2 expression in 5–8F cells. Briefly, 5–8F cells was labeled
with BrdU, inoculated into nude mice and traced for 8 weeks. Then,
the tissue sections were made from formed tumor blocks, hydrated,
treated with 3% H2O2 for 10 min to remove
endogenous peroxidase, with 2 N hydrochloric acid for 30 min at
37°C, with 0.1 M sodium borate for 4 min and then treated with
0.25% trypsin and washed with PBS after each above treatment. The
treated tissue sections was added with antibody for BrdU (Sigma,
St. Louis, MO) at 4°C overnight. After washing with PBS, the
sections was added with goat anti-mouse IgG-FITC antibody (Santa
Cruz Biotechnology, Santa Cruz, CA) and incubated for 30 min at RT.
After washing with PBS, the sections were blocked with normal goat
serum, added with mouse anti-human ABCG2 antibody (BD Pharmingen,
USA), for 30 min at RT, then added with Texas Red conjugated goat
anti-mouse IgG (Santa Cruz Biotechology) and incubated for 30 min
at RT. After washing with PBS, the sections were observed and
photographed with a fluorescence microscope.
Separation of ABCG2+ cells by
MACS
5–8F NPC cells were harvested, prepared into single
cell suspension and counted. Less than 108 cells were
obtained for cell sorting. The volume of cell suspension was
adjusted to 200 μl with 1X PBS containing 0.5% bovine serum albumin
(BSA). Mouse anti-human ABCG2 antibody (20 μl) was added to the
cell solution, mixed and incubated for 20 min at 4–8°C. The cells
were washed with 1X PBS containing 0.5% BSA three times and the
cell volume was adjusted to 200 μl. The goat anti-mouse IgG2a bound
with magnetic beads (Miltenyi Biotec, Germany) was added to the
cell solution, mixed and incubated for 20 min at 4–8°C and then
washed with 1X PBS containing 0.5% BSA. The cells were harvested
and the volume of cell suspension was adjusted to 0.5 ml. The
sorting column was fixed on magnetic sorting stand (Miltenyi
Biotec) and equilibrated by applying 0.5 ml 1X PBS containing 0.5%
BSA. The bound cell suspension (0.5 ml) was applied to the column
and the effluent was harvested. 1X PBS (0.5 ml) containing 0.5% BSA
was applied to the column two times. The effluent was
ABCG2− cell fraction. Another 1 ml of 1X PBS containing
0.5% BSA was applied to the column, the effluent was repeated for
application to new columns and the ABCG2+ cells were
subsequently enriched. The final effluent was centrifuged for 5 min
at 4°C, 1,000 rpm to obtain the cells.
Identification of sorting effect
We used immunocytochemistry method to identify the
purity of ABCG2+ cells. Briefly, enriched
ABCG2+ were made into cell pellets. The cell pellets
were treated with 3% H2O2 for 10 min, with
0.25% trypsin for 15 min and blocked with normal goat serum for 20
min. The cells were added with mouse anti-human ABCG2 antibody and
incubated at 4°C overnight. After washing with PBS, the cells were
added with goat anti-mouse IgG-HRP and incubated for 30 min at RT.
After washing with PBS, the cells were developed with AEC
(Zhongshan Goldenbridge Biotech Co., Ltd., China), counterstained
with hematoxylin and mounted with Glycerol vinyl alcohol aqueous
mounting solution (GVA, Zymed Laboratories, Inc., USA). The red
ABCG2+ cells were observed with an optical microscope
and the purity was calculated.
We also used flow cytometry to identify the purity
of ABCG2+ cells. The MACS-sorted ABCG2+ cells
were resuspended, added with anti-human ABCG2 antibody-FITC
(1:200), incubated for 30 min at 4–8°C and washed with 1 ml of 1X
PBS containing 0.5% BSA three times. Then the purity of
ABCG2+ cells was measured with flow cytometry (FACS
Calibur, BD, USA). Unsorted 5–8F cells added with IgG-FITC were
used as control.
Cloning efficiency determination
Colony formation assay was performed as previously
described (50). Briefly, single
cell suspension was prepared from ABCG2+,
ABCG2− and unsorted 5–8F cells and counted. Each cell
type was seeded in 12-well plates (200 cells/well) and cultured at
37°C for 14 days in an incubator with 5% CO2. Then the
cells were fixed with methanol and stained with 0.4% crystal
violet. Colonies containing at least 50 cells were counted under an
inverse microscope. Cloning efficiency (%) = cell colony
amounts/200 × 100%.
Cell cycle analysis
ABCG2+, ABCG2− and unsorted
5–8F cells (2×10⁶) were harvested, respectively, washed
with PBS, fixed with 70% ice-cold ethanol for 30 min. The ethanol
was discarded and the cells were resuspended in 500 μl PBS, added
with RNase A to a final concentration of 100 μg/ml, incubated at
37°C for 30 min, stained with 20 μg/ml of propidium iodide (PI) for
30 min, measured with flow cytometry and analyzed with Mod Fit LT
software.
Analysis of tumorigenesis in NOD/SCID
mice
ABCG2+, ABCG2− and unsorted
5–8F cells (102, 103, 104 and
105 per each type) were injected s.c. into three 4–6
weeks old female NOD/SCID mice with body weight of 17–24 g
(Shanghai Slac Laboratory Animal Co., Ltd., Shanghai, China),
respectively. All the mice were sacrificed 6–16 weeks after
injection and examined for tumors. The tumor blocks were dissected
and made into tissue sections for inspection. Tumor blocks were
dissected and fixed by immersion in 4% paraformaldehyde phosphate
buffer. After fixation for 2–4 h, tissues were dehydrated,
paraffin- embedded, sectioned at 4 μm and stained with haematoxylin
and eosin (HE) for histological examination.
Microarray analysis
Microarray analysis was performed as previously
described (51). GeneChip Human
Genome U133 Plus 2.0 was used to analyze the gene expression
profile of ABCG2+ cells and ABCG2− cells. The
chip covers 47,400 transcripts and contains 38,500 known human
genes. A probe hits only one genomic location; probes that can be
mapped to the same target sequence in the correct direction are
grouped together in the same probe set; each probe set consists of
10–20 pairs of 25 mer probes; each probe pair consists of two probe
cells, one of which is perfect match and another of which is
mismatch containing one base mismatch. The gene sequences are
selected from GenBank, dbEST and RefSeq.
Total RNA of ABCG2+ cells and
ABCG2− cells was extracted and used to purify
polyA+ mRNA. The cDNA, double strand DNA and
biotin-labled cRNA were synthesized in turn. After fragmented, the
labled cRNA was loaded on the gene chip for microarray analysis.
Hybridization, elution and staining of the chip were conducted with
Affymetrix Hybridization Oven 640 and Affymetrix Fluidics Station
450 according to the manufacturer’s instruction. After the chips
were scanned, GCOS data processing software was used to calculate
and process the obtained data. Before comparison of the results of
two chips, the data of each chip were normalized to obtain reporter
signal value. For screening the differentially expressed genes
between ABCG2+ and ABCG2− group, signal log
ratio ≥1.0 or ≤-1.0 (indicating 2-fold upregulation or
downregulation of gene expression level) was set as screening
criterion.
Verification of differentially expressed
genes by RT-PCR
ABCG2+ and ABCG2− cells were
harvested, respectively. Total RNAs were extracted from the
harvested cells with TRIzol reagent according to the manufacturer’s
protocols and subsequently digested with DNase I to remove the
residual amount of genomic DNA. RT-PCR was carried out with AMV
reverse transcriptase system to detect the expression of selected
genes. The PCR conditions were as follows: 3 min at 95°C; 40 sec at
94°C, 30 sec at 55–58°C and 50 sec at 72°C for appropriate cycles;
10 min at 72°C for extension. GAPDH was used as internal control.
The used PCR primers and cycle number are shown in Table I. RT-PCR product bands were scanned
with image analyzer (Pharmacia, USA) and the accumulated optical
density value (IA) of each band was analyzed with Imagemaster VDS
software.
 | Table IPrimers and cycle numbers used in
RT-PCR analysis. |
Table I
Primers and cycle numbers used in
RT-PCR analysis.
| Primer name | | Primer sequence
from 5′ to 3′ | PCR cycles |
|---|
| GAPDH | Sense: |
5′-CCACCCATGGCAAATTCCATGGCA-3′ | 23 |
| Antisense: |
5′-TCTAGACGGCAGGTCAGGTCCACC-3′ | |
| ALPI | Sense: |
5′-TTCCCATACCTGGCTCTGTC-3′ | 30 |
| Antisense: |
5′-TGAGTACCAGTTGCGGTTCA-3′ | |
| ABCG2 | Sense: |
5′-TGTGGAGGAACTGGGTAGGA-3′ | 28 |
| Antisense: |
5′-AAGCCATTGGTGTTTCCTTG-3′ | |
| WNT5A | Sense: |
5′-CTCGCCATGAAGAAGTCCAT-3′ | 28 |
| Antisense: |
5′-CCTTCGATGTCGGAATTGAT-3′ | |
| BNC1 | Sense: |
5′-AACCCGGGAAAATAAACCAC-3′ | 30 |
| Antisense: |
5′-ATGATGCACCAGTGATCCAA-3′ | |
| IGFBP3 | Sense: |
5′-ACAGCCAGCGCTACAAAGTT-3′ | 30 |
| Antisense: |
5′-AGGCTGCCCATACTTATCCA-3′ | |
| SCEL | Sense: |
5′-GTGGTGCTCAACCGACATAA-3′ | 32 |
| Antisense: |
5′-TGCTCGAAGAGGCATTGTAA-3′ | |
Geneontology analysis
GOSTAT (http://gostat.wehi.edu.au) was used to analyze and
annotate the differentially expressed genes. GO provides three
kinds of specifying terminology to describe the characteristics of
gene products, including molecular function, biological process and
cellular component.
Statistical analysis
SPSS13.0 statistical software and one-way ANOVA were
used to analyze the cloning efficiency data. GCOS was used to test
gene expression level of ABCG2+ and ABCG2−
group and rank-test was applied to define the determinant interval.
A P-value <0.05 was considered to be statistically
significant.
Results
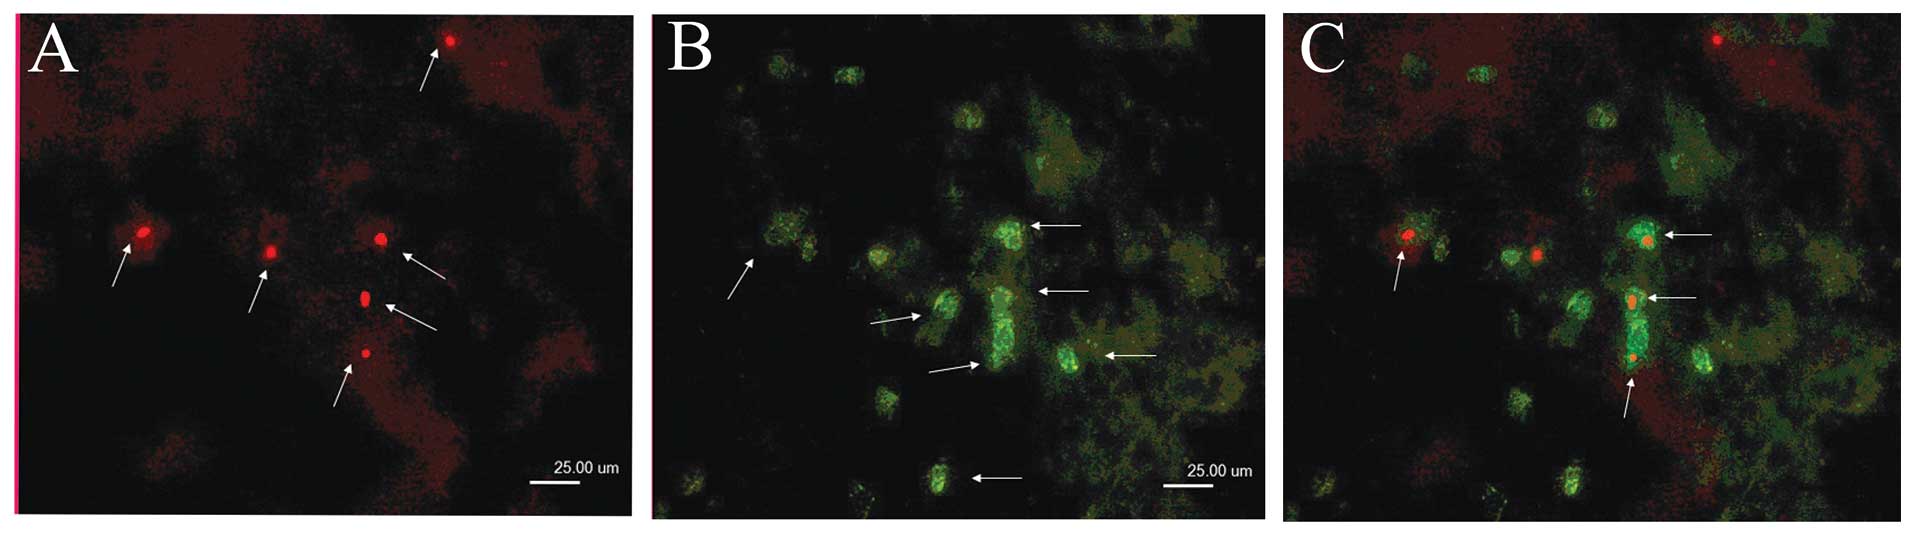
Double labeling detection of LRC and
ABCG2 expression in 5–8F cells
5–8F NPC cells were labeled with BrdU, inoculated
into nude mice, traced for 8 weeks and then detected for LRC and
ABCG2 expression. In LRCs, there was 61.69±8.31% (n=3) of
ABCG2+ cells, while in ABCG2+ cells, there
was 12.05±2.80% (n=3) of LRCs (Table
II, Fig. 1).
| Table IIResults of double labeling detection
for LRCs and ABCG2 expression. |
Table II
Results of double labeling detection
for LRCs and ABCG2 expression.
| DLCs/LRCs (%) |
DLCs/ABCG2+ cells (%) |
|---|
| Xenografted nude
mouse 1 | 60.12 | 9.64 |
| Xenografted nude
mouse 2 | 54.28 | 11.38 |
| Xenografted nude
mouse 3 | 70.67 | 15.12 |
| Mean ± SD | 61.69±8.31 | 12.05±2.80 |
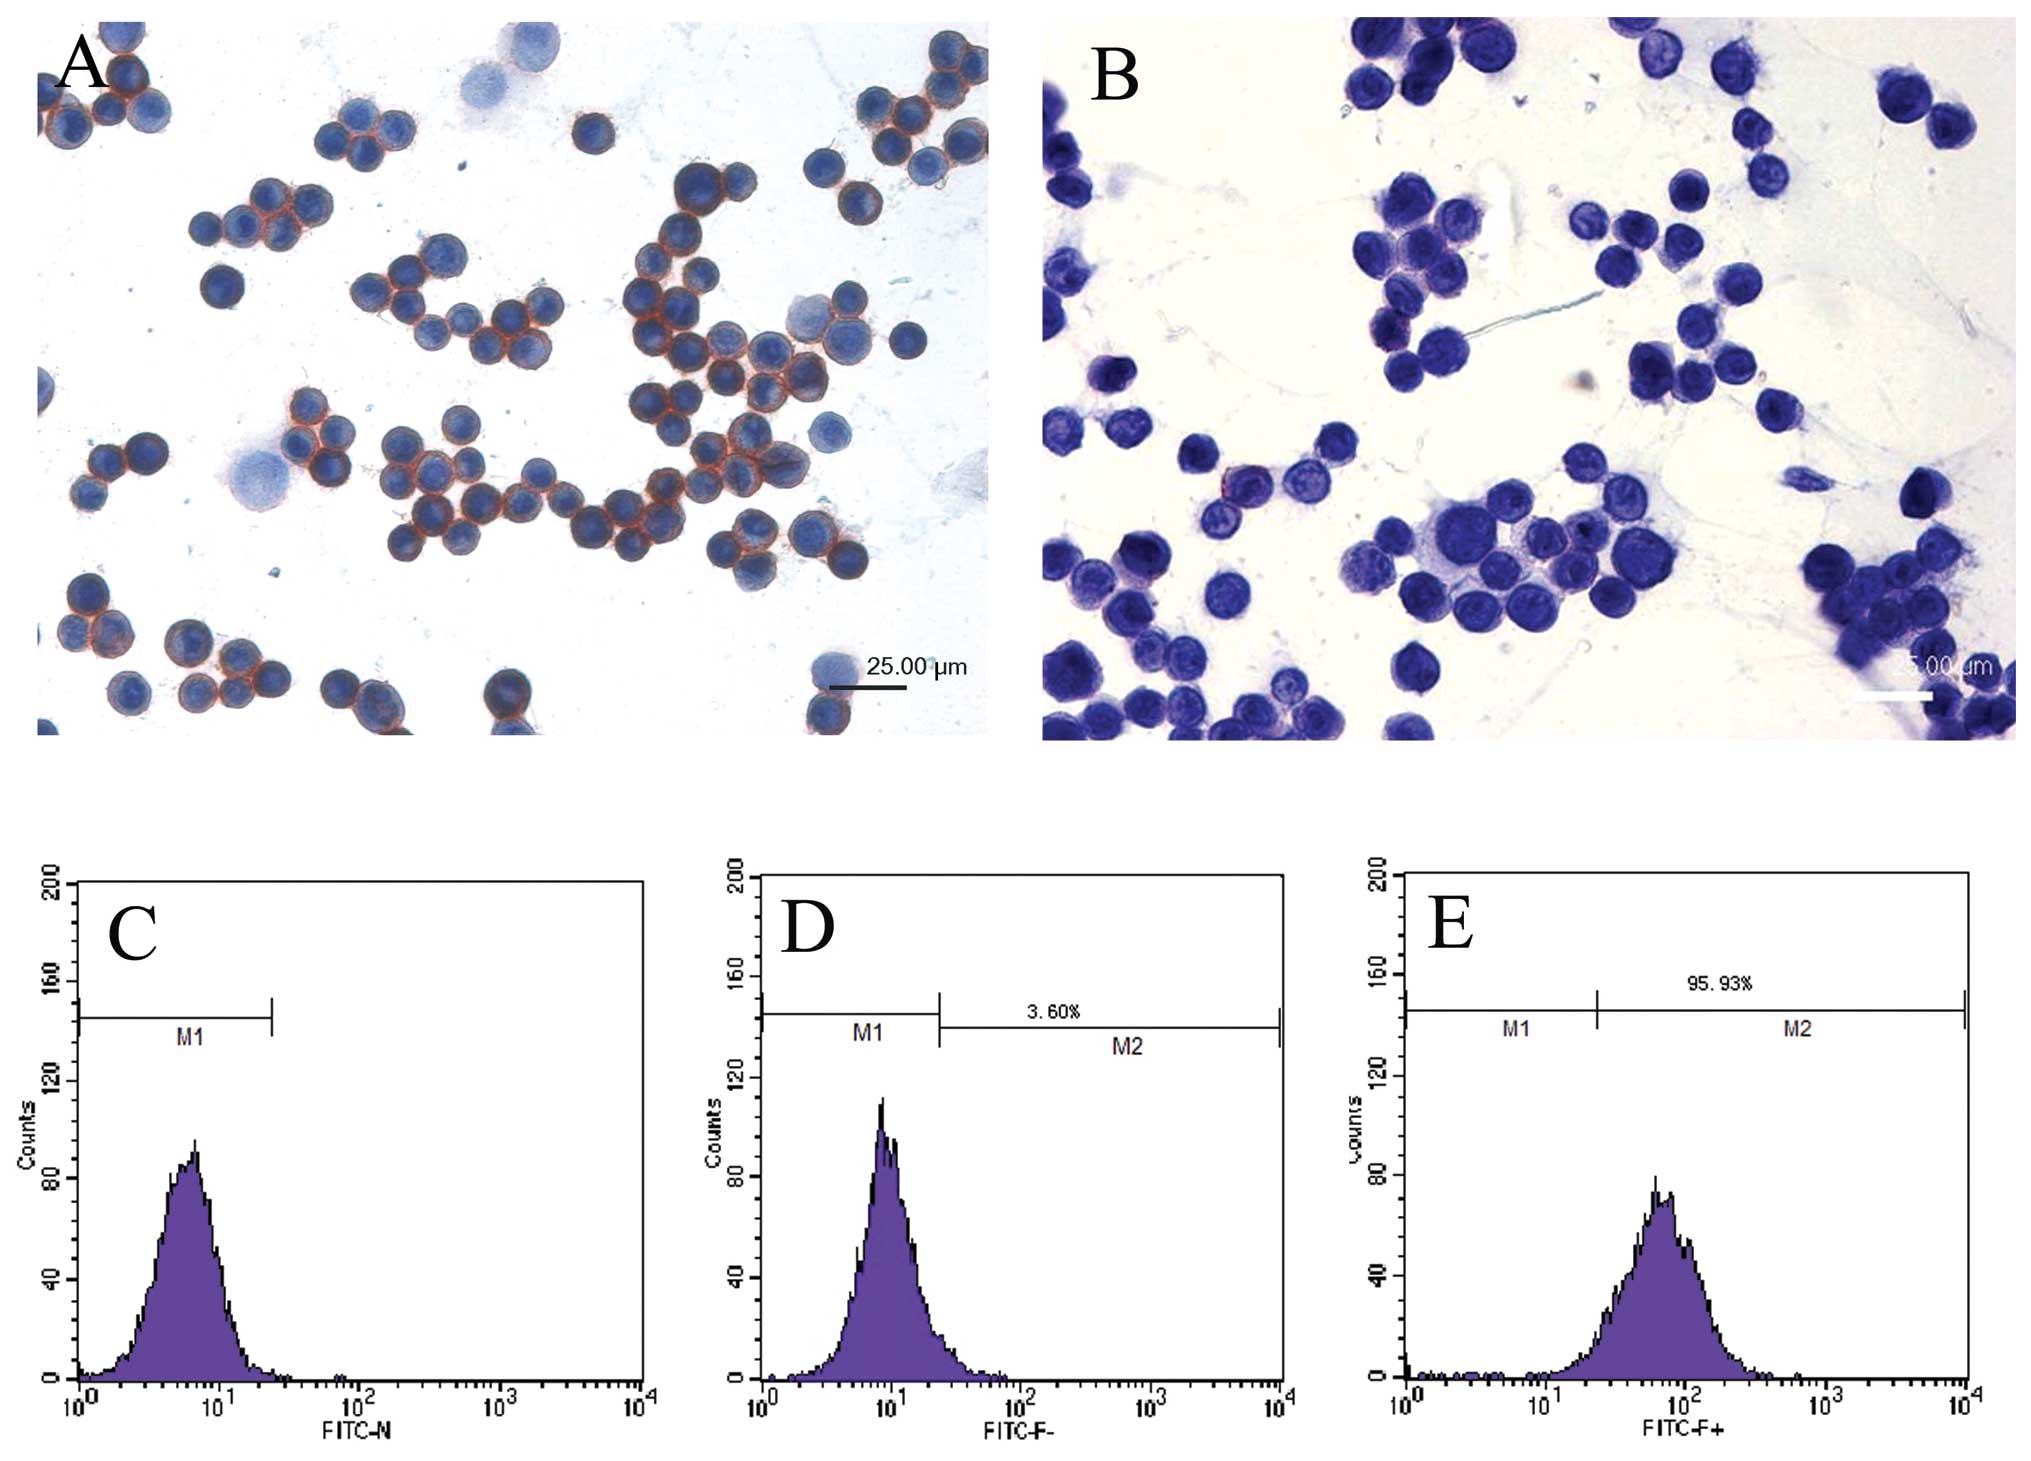
Sorting ABCG2+ cells by MACS
from 5–8F cells
5–8F NPC cells were cultured and harvested, labeled
with ABCG2 antibody and magnetic beads, and then sorted through MS
sorting column. The rate of ABCG2+ cells was 2.11±0.36%
(n=5). The ABCG2+ and ABCG2− cells were
smeared on slides, respectively and detected for ABCG2 expression
with immunocytochemistry methods. ABCG2 was highly expressed in
ABCG2+ cells, the positive signals located on the cell
membrane and the purity of ABCG2+ cells reached 90.73%.
ABCG2 was weakly expressed in only a minority of ABCG2−
cells (Fig. 2A and B). After
labeled with IgG-FITC, ABCG2+ and ABCG2−
cells were analyzed by flow cytometry. It was shown that the purity
of ABCG2+ cells was 95.93% (Fig. 2C–E). These data showed that we had
successfully enriched ABCG2+ cells.
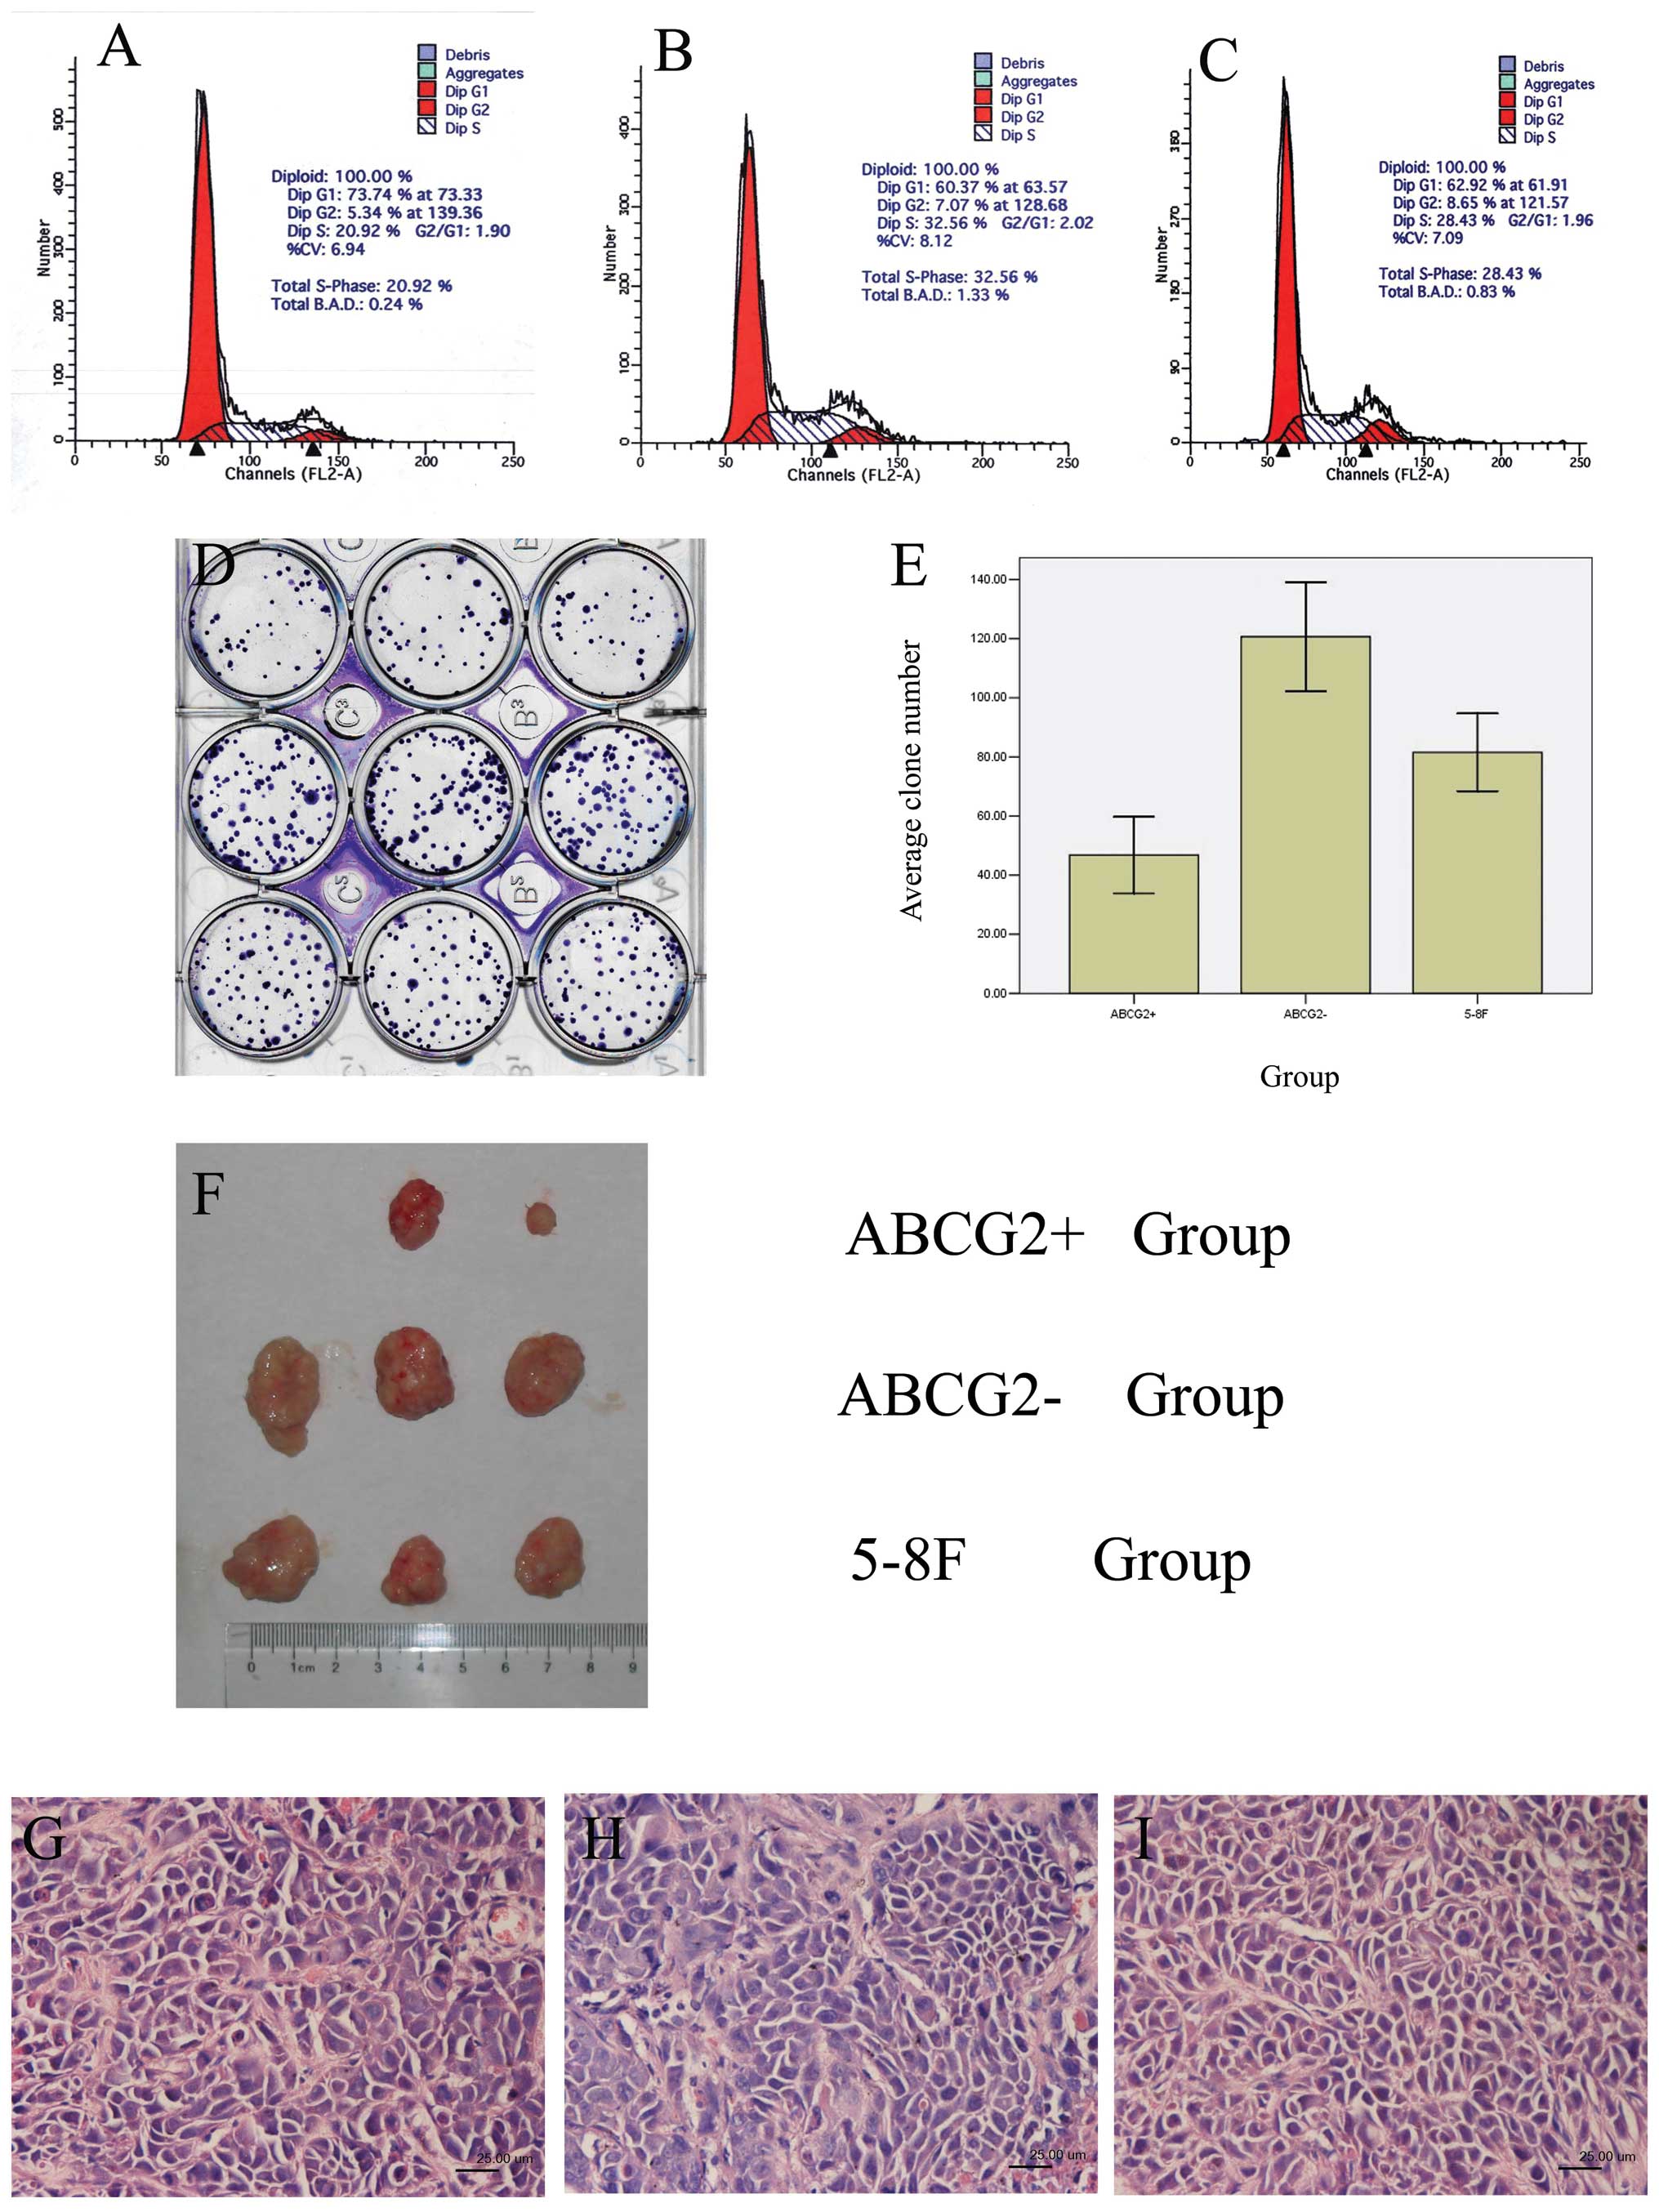
Identification of biological
characteristics of ABCG2+ cells
ABCG2+, ABCG2− and unsorted
5–8F cells were analyzed by flow cytometry, respectively. As seen
in Fig. 3A–C and Table III, the rate of G0/G1 phase cells
was the highest (73.74%) in ABCG2+ cells among these
three types of cells and the rate of S phase cells was the highest
(32.56%) in ABCG2− cells, indicating that
ABCG2+ cells were mostly quiescent and more
ABCG2− cells were in DNA synthesis period. Therefore,
some of the ABCG2− cells might be the transient
amplifying cells that could proliferate rapidly.
| Table IIICell cycle distribution of
ABCG2+, ABCG2− and unsorted 5–8F cells. |
Table III
Cell cycle distribution of
ABCG2+, ABCG2− and unsorted 5–8F cells.
| Cell cycle
distribution (%) |
|---|
|
|
|---|
| Cells | G0+G1 | S | G2+M |
|---|
|
ABCG2+ | 73.74 | 20.92 | 5.34 |
|
ABCG2− | 60.37 | 32.56 | 7.07 |
| Unsorted 5–8F | 62.92 | 28.43 | 8.65 |
Cloning efficiency was analyzed among
ABCG2+, ABCG2− and unsorted 5–8F cells. The
ABCG2+ cells formed smaller number of colonies compared
with ABCG2− cells and unsorted 5–8F cells (P<0.05),
while the formed colony number of ABCG2− cells was
higher than that of 5–8F cells (P<0.05) (Fig. 3D and E, Table IV).
| Table IVComparison of colony-forming capacity
of ABCG2+, ABCG2− and unsorted 5–8F
cells. |
Table IV
Comparison of colony-forming capacity
of ABCG2+, ABCG2− and unsorted 5–8F
cells.
|
ABCG2+ |
ABCG2− | 5–8F |
|---|
| Colony no. | 42, 48, 49 | 115, 129, 132 | 77, 86, 88 |
| 46, 49, 57 | 104, 122, 129 | 69, 78, 82 |
| 33, 48, 49 | 112, 118, 125 | 80, 83, 91 |
| Mean ± SDa | 46.78±6.48 | 120.67±9.22 | 81.56±6.58 |
To compare the tumorigenicity of ABCG2+,
ABCG2− and unsorted 5–8F cells, we inoculated these
cells into NOD/SCID mice, respectively. When inoculated with
102–104 cells, tumor formation could not be
observed even after 113 days in either group. When inoculated with
105 cells, tumor block could be seen after 12 days in
ABCG2− cell group and 5–8F cell group and after 20 days
in ABCG2+ cell group. The weight of tumor blocks was
highest in ABCG2− cell group and lowest in
ABCG2+ cell group (Fig.
3F, Table V). Tumor formation
rate was lowest in ABCG2+ cell group (2/3) and was 100%
(3/3) in other two groups. Paraffin sections were prepared from
these tumor blocks and detected by H&E staining. The morphology
of tumor cells from these three groups exhibited no significant
difference (Fig. 3G–I).
| Table VTumors formed by dorsal subcutaneous
inoculation of ABCG2+, ABCG2− and unsorted
5–8F cells into NOD/SCID mice. |
Table V
Tumors formed by dorsal subcutaneous
inoculation of ABCG2+, ABCG2− and unsorted
5–8F cells into NOD/SCID mice.
| Cells | Cell no. | Tumor formation
rate | Tumor weight
(g) | Latency period
(day) |
|---|
|
ABCG2+ |
1×10² | - | | |
|
1×10³ | - | | |
|
1×10⁴ | - | | |
|
1×10⁵ | 2/3 | 0.93, 0.17 | 20, 29 |
|
ABCG2− |
1×10² | - | | |
|
1×10³ | - | | |
|
1×10⁴ | - | | |
|
1×10⁵ | 3/3 | 2.44, 3.95,
2.29 | 12, 14, 14 |
| Unsorted 5–8F |
1×10² | - | | |
|
1×10³ | - | | |
|
1×10⁴ | - | | |
|
1×10⁵ | 3/3 | 2.96, 1.43,
1.69 | 12, 13, 15 |
Gene expression profile of
ABCG2+ and ABCG2− cells
Affymetrix oligonucleotide microarray (Human Genome
U133 Plus 2.0 Array) was used to monitor gene expression of about
47,400 transcripts containing 38,500 known genes in
ABCG2+ and ABCG2− cells. After the
differential gene expression profiles between ABCG2+ and
ABCG2− cells were constructed, differentially expressed
genes or ESTs which were upregulated (for 2 fold) or downregulated
(for 2 fold) were screened. There were 353 genes or ESTs
upregulated significantly in ABCG2+ cells and 590 genes
or ESTs upregulated significantly in ABCG2− cells out of
the 47,400 transcripts. The 80 most significantly differentially
expressed genes in ABCG2+ and ABCG2− cells
are listed in Table VI.
| Table VIEighty most differentially expressed
genes in ABCG2+ and ABCG2− cells. |
Table VI
Eighty most differentially expressed
genes in ABCG2+ and ABCG2− cells.
| Gene symbol | SLRa | UniGene ID | Gene title | Chromosomal
location |
|---|
| A2M | 6.4 | Hs.212838 |
α-2-macroglobulin |
chr12p13.3-p12.3 |
| ALPI | 5.9 | Hs.37009 | Alkaline
phosphatase, intestinal | chr2q37.1 |
| CGA | 5.7 | Hs.119689 | Glycoprotein
hormones, α polypeptide | chr6q12-q21 |
| SLC16A6 | 5.3 | Hs.42645 | Solute carrier
family 16, member 6 | chr17q24.2 |
| DAB2 | 5.2 | Hs.481980 | Disabled homolog 2,
mitogen-responsive phosphoprotein | chr5p13 |
| C1QTNF6 | 4.9 | Hs.22011 | C1q and tumor
necrosis factor related protein 6 | chr22q13.1 |
| SNAP25 | 4.6 | Hs.167317 |
Synaptosomal-associated protein, 25
kDa | chr20p12-p11.2 |
| DIO2 | 4.4 | Hs.202354 | Deiodinase,
iodothyronine, type II |
chr14q24.2-q24.3 |
| CTGF | 4.1 | Hs.410037 | Connective tissue
growth factor | chr6q23.1 |
| ECG2 | 4.1 | Hs.244569 | Esophagus
cancer-related gene-2 | chr5q32 |
| PDE3A | 4.1 | Hs.386791 | Phosphodiesterase
3A, cGMP-inhibited | chr12p12 |
| TFPI | 4.0 | Hs.516578 | Tissue factor
pathway inhibitor (lipoprotein-associated coagulation
inhibitor) | chr2q31-q32.1 |
| ADAM12 | 4.0 | Hs.386283 | ADAM
metallopeptidase domain 12 (meltrin α) | chr10q26.3 |
| C6orf176 | 3.9 | Hs.31917 | Chromosome 6 open
reading frame 176 | chr6q27 |
| EID3 | 3.9 | - | E1A-like inhibitor
of differentiation 3 | chr12q23-q24.1 |
| DUSP1 | 3.8 | Hs.171695 | Dual specificity
phosphatase 1 | chr5q34 |
| PCSK1 | 3.6 | Hs.78977 | Proprotein
convertase subtilisin/kexin type 1 | chr5q15-q21 |
| PRO0132 | 3.6 | - | PRO0132
protein | chr2q34 |
| SLC16A6 | 3.6 | Hs.463838 | Solute carrier
family 16, member 6 | chr17q24.2 |
| MRS2L | 3.4 | Hs.533291 | MRS2-like,
magnesium homeostasis factor |
chr6p22.3-p22.1 |
| SLC29A3 | 3.3 | Hs.438419 | Solute carrier
family 29, member 3 | chr10q22.1 |
| PRG1 | 3.2 | Hs.1908 | Proteoglycan 1,
secretory granule | chr10q22.1 |
| CES1 | 3.2 | Hs.535486 | Carboxylesterase
1 | chr16q13-q22.1 |
| UGT1A8 | 3.2 | - | UDP
glucuronosyltransferase 1 family, polypeptide A8 | chr2q37 |
| APOC3 | 3.1 | Hs.534984 | Apolipoprotein
C-III |
chr11q23.1-q23.2 |
| ABCG2 | 3.1 | Hs.480218 | ATP-binding
cassette, sub-family G, member 2 | chr4q22 |
| FYN | 3.1 | Hs.390567 | FYN oncogene
related to SRC, FGR, YES | chr6q21 |
| WNT5A | 3.1 | Hs.152213 | Wingless-type MMTV
integration site family, member 5A | chr3p21-p14 |
| FOSB | 3.0 | Hs.75678 | FBJ murine
osteosarcoma viral oncogene homolog B | chr19q13.32 |
| PAPSS2 | 3.0 | Hs.524491 | 3′-Phosphoadenosine
5′-phosphosulfate synthase 2 | chr10q23-q24 |
| VTN | 3.0 | Hs.2257 | Vitronectin | chr17q11 |
| CPS1 | 3.0 | Hs.149252 | Carbamoyl-phosphate
synthetase 1 | chr2q35 |
| RHOBTB1 | 3.0 | Hs.148670 | Rho-related BTB
domain containing 1 | chr10q21.2 |
| FTO | 3.0 | Hs.528833 | Fatso | chr16q12.2 |
| TBX3 | 3.0 | Hs.129895 | T-box 3 | chr12q24.1 |
| C20orf100 | 3.0 | Hs.26608 | Chromosome 20 open
reading frame 100 | chr20q13.12 |
| BMP2 | 2.9 | Hs.73853 | Bone morphogenetic
protein 2 | chr20p12 |
| PPP1R15A | 2.8 | Hs.76556 | Protein phosphatase
1, regulatory (inhibitor) subunit 15A | chr19q13.2 |
| MX1 | 2.8 | Hs.517307 | Myxovirus
resistance 1 | chr21q22.3 |
| PAPSS2 | 2.8 | Hs.524491 | 3′-Phosphoadenosine
5′-phosphosulfate synthase 2 | chr10q23-q24 |
| IF | −3.2 | Hs.312485 | I factor
(complement) | chr4q25 |
| TBX18 | −3.2 | Hs.251830 | T-box 18 | chr6q14-q15 |
| ITGB4 | −3.2 | Hs.370255 | Integrin, β 4 | chr17q25 |
| SLCO1B3 | −3.2 | Hs.504966 | Solute carrier
organic anion transporter family, member 1B3 | chr12p12 |
| CD300LG | −3.3 | Hs.147313 | CD300 antigen like
family member G | chr17q21.31 |
| GJA1 | −3.3 | Hs.74471 | Gap junction
protein, α 1, 43 kDa (connexin 43) | chr6q21-q23.2 |
| FLI1 | −3.4 | Hs.504281 | Friend leukemia
virus integration 1 |
chr11q24.1-q24.3 |
| IGFBP3 | −3.4 | Hs.450230 | Insulin-like growth
factor binding protein 3 | chr7p13-p12 |
| GABRB1 | −3.4 | Hs.27283 | γ-aminobutyric acid
(GABA) A receptor, β 1 | chr4p12 |
| LUM | −3.5 | Hs.406475 | Lumican | chr12q21.3-q22 |
| CALB1 | −3.5 | Hs.65425 | Calbindin 1, 28
kDa |
chr8q21.3-q22.1 |
| TP73L | −3.5 | Hs.137569 | Tumor protein
p73-like | chr3q28 |
| DSG3 | −3.5 | Hs.1925 | Desmoglein 3
(pemphigus vulgaris antigen) |
chr18q12.1-q12.2 |
| PPP1R14C | −3.6 | Hs.486798 | Protein phosphatase
1, regulatory (inhibitor) subunit 14C |
chr6q24.3-q25.3 |
| OR5K1 | −3.7 | Hs.531371 | Olfactory receptor,
family 5, subfamily K, member 1 | chr3q12.1 |
| GPR87 | −3.7 | Hs.58561 | G protein-coupled
receptor 87 | chr3q24 |
| RSAD2 | −3.7 | Hs.17518 | Radical S-adenosyl
methionine domain containing 2 | chr2p25.2 |
| EGLN3 | −3.8 | Hs.135507 | Egl nine homolog 3
(C. elegans) | chr14q13.1 |
| CLCA2 | −3.9 | Hs.241551 | Chloride channel,
calcium-activated, family member 2 | chr1p31-p22 |
| FST | −3.9 | Hs.9914 | Follistatin | chr5q11.2 |
| LOC196264 | −4.0 | Hs.15396 | Hypothetical
protein LOC196264 | chr11q23.3 |
| DSC3 | −4.0 | Hs.41690 | Desmocollin 3 | chr18q12.1 |
| KRT14 | −4.0 | Hs.355214 | Keratin 14
(epidermolysis bullosa simplex, Dowling-Meara, Koebner) | chr17q12-q21 |
| PDCD8 | −4.0 | Hs.424932 | Programmed cell
death 8 (apoptosis-inducing factor) | chrXq25-q26 |
| PRSS35 | −4.0 | Hs.98381 | Protease, serine,
35 | chr6q14.2 |
| BNC1 | −4.1 | Hs.459153 | Basonuclin 1 | chr15q25.2 |
| ITGB6 | −4.1 | Hs.470399 | Integrin, β 6 | chr2q24.2 |
| SCEL | −4.1 | Hs.492938 | Sciellin | chr13q22 |
| LAMC2 | −4.2 | Hs.530509 | Laminin, γ 2 | chr1q25-q31 |
| PDZK3 | −4.2 | Hs.481819 | PDZ domain
containing 3 | chr5p13.3 |
| GABRA2 | −4.3 | Hs.116250 | γ-aminobutyric acid
(GABA) A receptor, α 2 | chr4p12 |
| LAMB4 | −4.4 | Hs.62022 | Laminin, β 4 | chr7q22-q31.2 |
| KRT19 | −4.5 | Hs.514167 | Keratin 19 | chr17q21.2 |
| DSG3 | −4.5 | Hs.1925 | Desmoglein 3
(pemphigus vulgaris antigen) |
chr18q12.1-q12.2 |
| ITGB4 | −4.6 | Hs.370255 | Integrin, β 4 | chr17q25 |
| ROCK1 | −4.7 | Hs.306307 | Rho-associated,
coiled-coil containing protein kinase 1 | chr18q11.1 |
| IGFBP7 | −4.8 | Hs.479808 | Insulin-like growth
factor binding protein 7 | chr4q12 |
| IGFBP3 | −4.8 | Hs.450230 | Insulin-like growth
factor binding protein 3 | chr7p13-p12 |
| LIFR | −4.8 | Hs.133421 | Leukemia inhibitory
factor receptor | chr5p13-p12 |
| IL1A | −5.5 | Hs.1722 | Interleukin 1,
α | chr2q14 |
Differentially expressed genes were analyzed by Gene
Ontology. A group of genes generally involved in negative
regulation of cell cycle progression were discovered in
ABCG2+ cells, whereas this functional classification
could not be found in ABCG2− cells, which can explain
the fact that most ABCG2+ cells were in G0/G1 phase of
cell cycle. The stem cell associated genes PSCA, ABCG2 and ALPI
were upregulated significantly in ABCG2+ cells, while
another set of stem cell related genes including K19, integrin α6,
integrin β4, CD44 and K14 were upregulated significantly in
ABCG2− cells, suggesting that there are stem cells in
both ABCG2+ and ABCG2− cells.
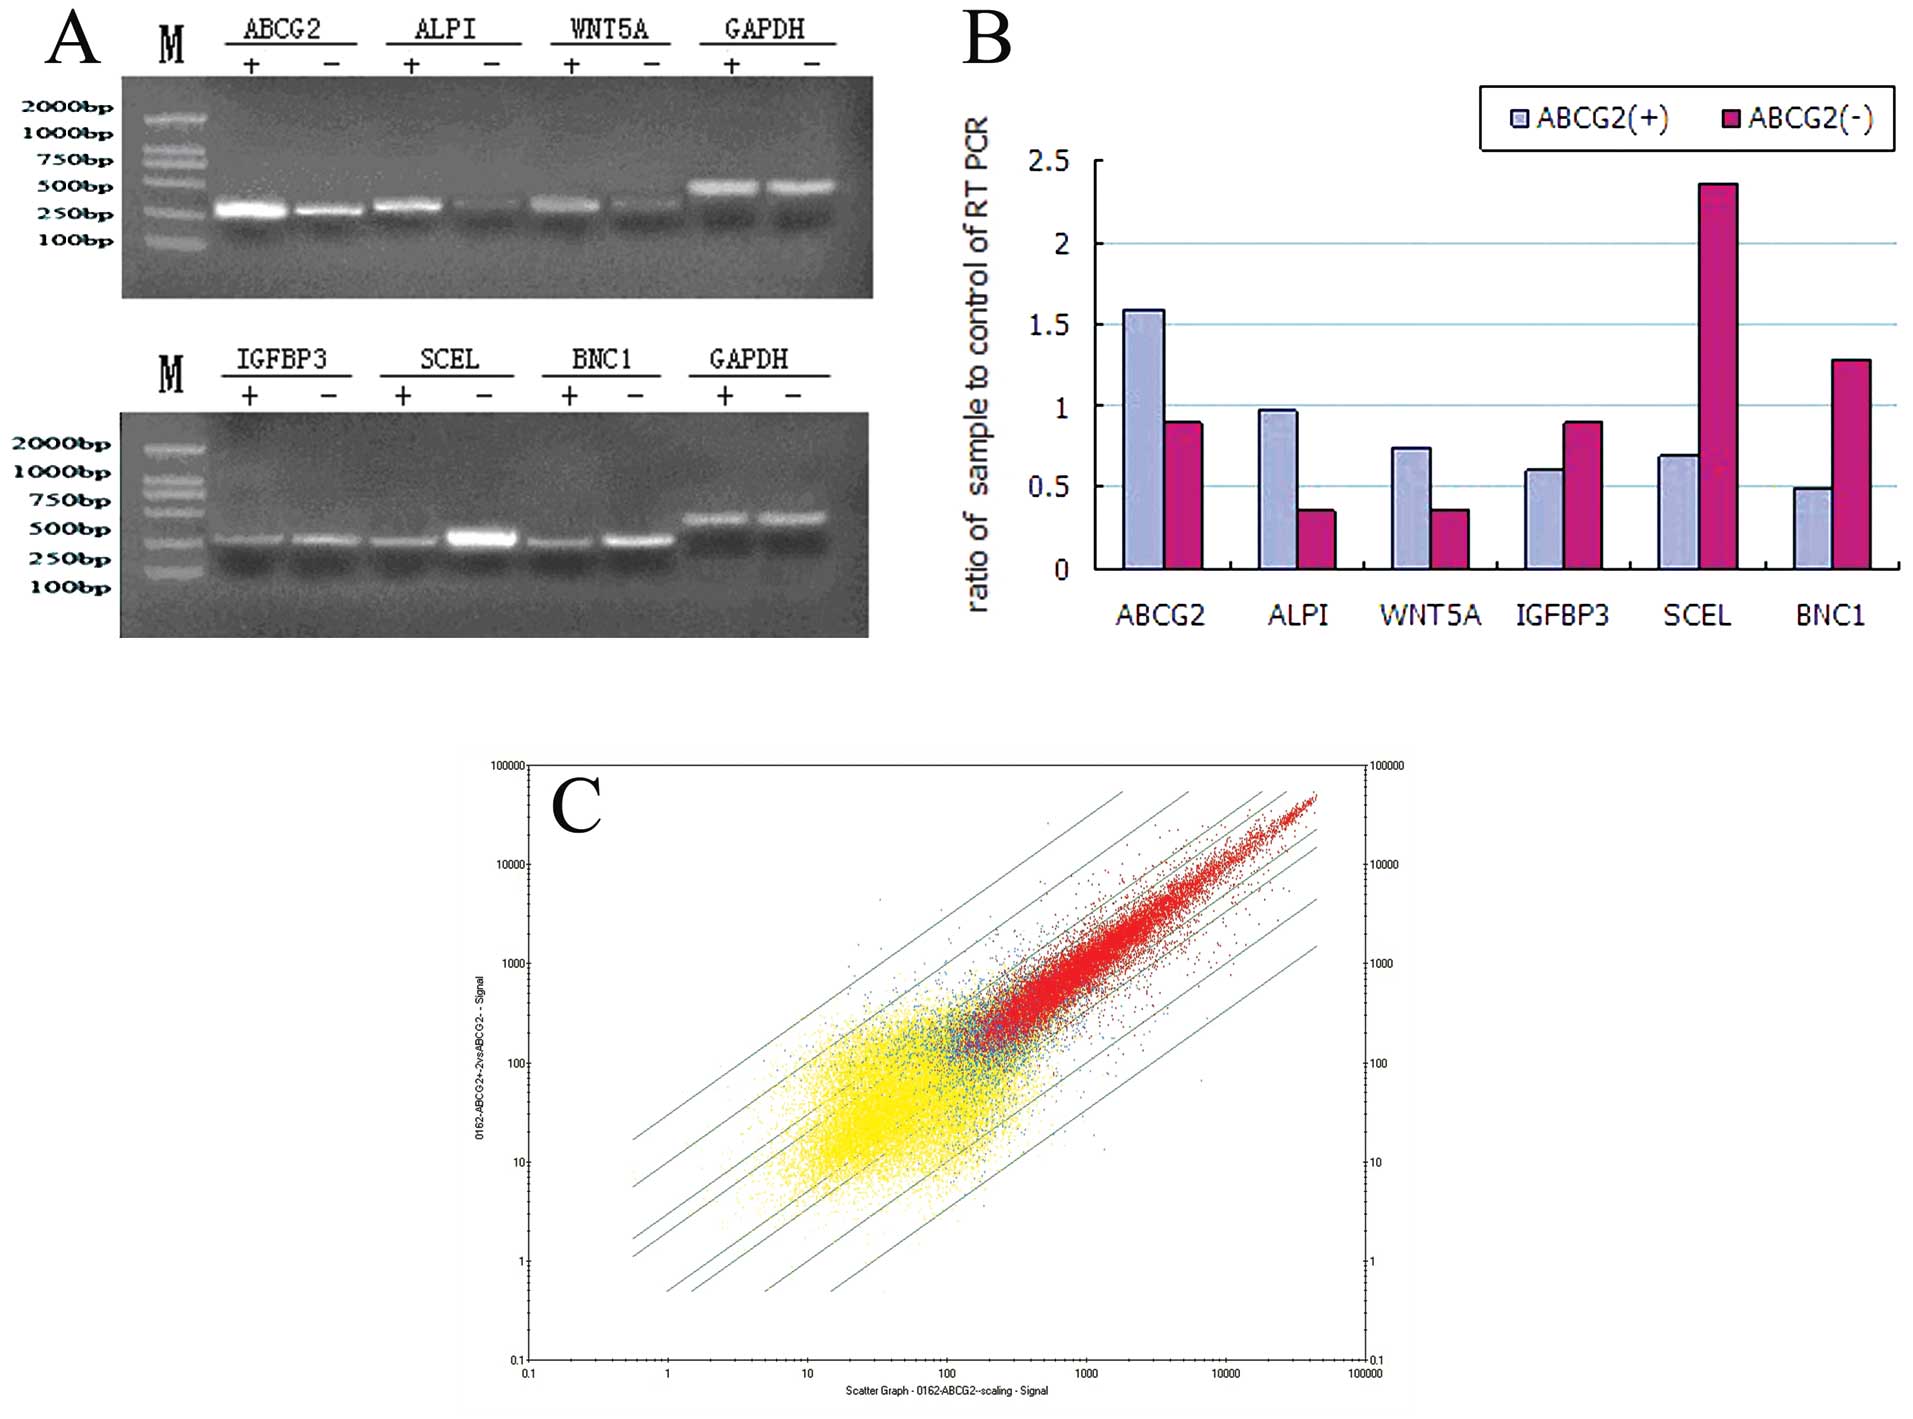
From the chip analysis results, we selected 6
meaningful genes such as ALPI, ABCG2 and WNT5A which were highly
expressed in ABCG2+ cells, and BNC1, IGFBP3 and SCEL
which were highly expressed in ABCG2− cells to perform
RT-PCR verification. The expression of these genes was consistent
with the results of chip analysis (Fig.
4A and B).
Fig. 4C exhibited
the scatterplot of average expression value in ABCG2+
and ABCG2− cells. The x-axis showed the signals of
ABCG2− cell group and the y-axis showed the signals of
ABCG2+ cell group. Red plots indicated genes whose
detection results were P (present) in two groups, blue blots
indicated genes whose detection results were P in only one of the
two groups and yellow plots represented genes whose detection
results were A (absent) in both groups. From top to bottom, the
green oblique lines represented expression difference at 30, 10, 4,
2, 1/2, 1/4, 1/10 and 1/30-fold between ABCG2+ and
ABCG2− cells, respectively. The result demonstrated that
the expression difference of most genes between ABCG2+
and ABCG2− cells was 2- to 4-fold and that only a
minority of the genes could reach 10- to 30-fold or above.
Discussion
Previously we have shown that LRCs exist in
nasopharynx, tongue, esophagus and xenograft NPC tissues (49). One of the characteristics of adult
stem cells is that they can be labeled for a long time and
therefore are known as LRCs (52).
Label retaining experiment is an effective method to label and
detect stem cells in tissue of living organism (53). BrdU and 3H-thymine deoxyribose
(3H-TdR) are commonly used labeling markers. The mechanism
underlying the label retaining of a marker in stem cells is
unclear. One explanation is that stem cells exhibit slow cell cycle
progression, therefore the marker can remain in DNA of LRCs after
tracing for a long time, while the marker in other cells will be
gradually diluted with rapid cell division. Cairns (54) raised another explanation for LRC.
Because of the asymmetry of stem cell division, labeled DNA is
always allocated to daughter stem cells and the newly synthesized
DNA is always allocated to daughter differentiated cells. We
consider that the above explanations can partly explain the
mechanism of the label retaining characteristic of stem cells.
In this study, we first labeled the cells in NPC
tissue formed by inoculation of 5–8F cells into nude mice. Although
scarce, the existence of LRCs indicated that there were cancer stem
cells in NPC tissue. To further identify these LRCs, we detected
the expression of ABCG2 in the same NPC tissue. ABCG2, a member of
ABC transporter superfamily, is a transmembrane protein in charge
of the efflux of chemotherapy drugs, metabolites and other
compounds such as Hoechst 33342 dye, thus it is responsible for the
phenotype of SP cells and has been widely used as a marker in CSCs
isolated from retinoblastoma (45),
embryonic (44), lung (41), liver (46), pancreas (47), gallbladder (48) and head and neck cancers (55) and NPC (23). Our results showed that there were
approximately 62% of ABCG2+ cells in LRCs, suggesting
that LRCs may represent a group of CSCs in NPC cells. This result
is similar to that of research work of Welm et al (56). They found that the number of LRCs in
SP cells was 4 times of those in non-SP cells.
Currently it is technically impossible to isolate
LRCs from tumor tissue. We tried to sort ABCG2+ cells by
MACS from 5–8F cells. The ABCG2-positive rate was 2.11%, which is
similar to those in other tumor cells (57). Subsequently, we identified the
biological characteristics of these ABCG2+ cells, and
found that among ABCG2+, ABCG2− and unsorted
5–8F cells, the rate of ABCG2+ cells were highest at
G0/G1 phase, while the rate of ABCG2− cells were highest
at S phase, indicating that ABCG2+ cells were mostly
quiescent, and more ABCG2− cells were in DNA synthesis
period. Therefore, some of the ABCG2− cells might be the
transient amplifying cells that could proliferate rapidly. Among
the three kinds of cells, the cloning efficiency of
ABCG2+ cells was lower than that of ABCG2−
cells and unsorted cells, and the tumorigenicity of
ABCG2+ cells was also the lowest. We suppose that there
may be several possibilities leading to the above results. One is
that ABCG2 alone can not sufficiently enrich CSCs from 5–8F cells,
therefore there are non-CSCs in ABCG2+ cells and there
are some CSCs in ABCG2− cells. Another is that
ABCG2+ cells are enriched in SP cells, but are not equal
to SP cells, thus may not exhibit typical properties of CSCs. Our
results are similar to those of Patrawala et al (57). They found that side population
isolated from prostate cancer, breast cancer and glioma was
enriched in tumorigenic, stem-like cancer cells, whereas
ABCG2+ and ABCG2− cancer cells were similarly
tumorigenic.
To explore the molecular mechanism underlying the
biological characteristics of ABCG2+ cells, Affymetrix
oligonucleotide microarray was used to monitor expression of about
47,400 transcripts containing 38,500 known genes in
ABCG2+ and ABCG2− cells. There were 353 genes
and ESTs upregulated significantly and 590 genes downregulated
significantly in ABCG2+ cells. As analyzed by Gene
Ontology, a group of genes generally involving in negative
regulation of cell cycle were discovered in ABCG2+ but
not in ABCG2− cells. The stem cell associated genes
PSCA, ABCG2 and ALPI were upregulated significantly in
ABCG2+ cells, while K19, integrin α6, integrin β4, CD44
and K14 were upregulated significantly in ABCG2− cells.
Together with the fact that the rate of LRC in ABCG2+
cells is only 12%, we suppose the most likely possibility is that
ABCG2 alone is insufficient to mark CSCs in 5–8F cells. Further
study waits to be conducted to isolate and identify CSCs from NPC
cells and NPC tissue.
Acknowledgements
This study was supported by National Basic Research
Program of China (2010CB833605), Program for New Century Excellent
Talents in University (NCET-10-0790), National Natural Science
Foundation of China (30801322, 81172206) and Incubation Program for
National Natural Science Funds for Distinguished Young Scholar.
References
|
1
|
Thomson JA, Itskovitz-Eldor J, Shapiro SS,
et al: Embryonic stem cell lines derived from human blastocysts.
Science. 282:1145–1147. 1998. View Article : Google Scholar : PubMed/NCBI
|
|
2
|
Shamblott MJ, Axelman J, Wang S, et al:
Derivation of pluripotent stem cells from cultured human primordial
germ cells. Proc Natl Acad Sci USA. 95:13726–13731. 1998.
View Article : Google Scholar : PubMed/NCBI
|
|
3
|
Pittenger MF, Mackay AM, Beck SC, et al:
Multilineage potential of adult human mesenchymal stem cells.
Science. 284:143–147. 1999. View Article : Google Scholar : PubMed/NCBI
|
|
4
|
Johansson CB, Momma S, Clarke DL, Risling
M, Lendahl U and Frisen J: Identification of a neural stem cell in
the adult mammalian central nervous system. Cell. 96:25–34. 1999.
View Article : Google Scholar : PubMed/NCBI
|
|
5
|
Janes SM, Lowell S and Hutter C: Epidermal
stem cells. J Pathol. 197:479–491. 2002. View Article : Google Scholar : PubMed/NCBI
|
|
6
|
Brittan M and Wright NA: Gastrointestinal
stem cells. J Pathol. 197:492–509. 2002. View Article : Google Scholar
|
|
7
|
Mason RJ, Williams MC, Moses HL, Mohla S
and Berberich MA: Stem cells in lung development, disease, and
therapy. Am J Respir Cell Mol Biol. 16:355–363. 1997. View Article : Google Scholar : PubMed/NCBI
|
|
8
|
Schermer A, Galvin S and Sun TT:
Differentiation-related expression of a major 64K corneal keratin
in vivo and in culture suggests limbal location of corneal
epithelial stem cells. J Cell Biol. 103:49–62. 1986. View Article : Google Scholar : PubMed/NCBI
|
|
9
|
Goldring K, Partridge T and Watt D: Muscle
stem cells. J Pathol. 197:457–467. 2002. View Article : Google Scholar : PubMed/NCBI
|
|
10
|
Strain AJ and Crosby HA: Hepatic stem
cells. Gut. 46:743–745. 2000. View Article : Google Scholar
|
|
11
|
Bonner-Weir S and Sharma A: Pancreatic
stem cells. J Pathol. 197:519–526. 2002. View Article : Google Scholar
|
|
12
|
Fujino N, Kubo H, Suzuki T, et al:
Isolation of alveolar epithelial type II progenitor cells from
adult human lungs. Lab Invest. 91:363–378. 2011. View Article : Google Scholar : PubMed/NCBI
|
|
13
|
Reya T, Morrison SJ, Clarke MF and
Weissman IL: Stem cells, cancer, and cancer stem cells. Nature.
414:105–111. 2001. View Article : Google Scholar : PubMed/NCBI
|
|
14
|
Pardal R, Clarke MF and Morrison SJ:
Applying the principles of stem-cell biology to cancer. Nat Rev
Cancer. 3:895–902. 2003. View Article : Google Scholar : PubMed/NCBI
|
|
15
|
Cox CV, Diamanti P, Evely RS, Kearns PR
and Blair A: Expression of CD133 on leukemia-initiating cells in
childhood ALL. Blood. 113:3287–3296. 2009. View Article : Google Scholar : PubMed/NCBI
|
|
16
|
Charafe-Jauffret E, Ginestier C, Iovino F,
et al: Breast cancer cell lines contain functional cancer stem
cells with metastatic capacity and a distinct molecular signature.
Cancer Res. 69:1302–1313. 2009. View Article : Google Scholar : PubMed/NCBI
|
|
17
|
Oates JE, Grey BR, Addla SK, et al:
Hoechst 33342 side population identification is a conserved and
unified mechanism in urological cancers. Stem Cells Dev.
18:1515–1522. 2009. View Article : Google Scholar : PubMed/NCBI
|
|
18
|
Huang EH, Hynes MJ, Zhang T, et al:
Aldehyde dehydrogenase 1 is a marker for normal and malignant human
colonic stem cells (SC) and tracks SC overpopulation during colon
tumorigenesis. Cancer Res. 69:3382–3389. 2009. View Article : Google Scholar : PubMed/NCBI
|
|
19
|
Takaishi S, Okumura T, Tu S, et al:
Identification of gastric cancer stem cells using the cell surface
marker CD44. Stem Cells. 27:1006–1020. 2009. View Article : Google Scholar : PubMed/NCBI
|
|
20
|
Ma S, Chan KW, Lee TK, et al: Aldehyde
dehydrogenase discriminates the CD133 liver cancer stem cell
populations. Mol Cancer Res. 6:1146–1153. 2008. View Article : Google Scholar : PubMed/NCBI
|
|
21
|
Jiang T, Collins BJ, Jin N, et al:
Achaete-scute complex homologue 1 regulates tumor-initiating
capacity in human small cell lung cancer. Cancer Res. 69:845–854.
2009. View Article : Google Scholar : PubMed/NCBI
|
|
22
|
Roesch A, Fukunaga-Kalabis M, Schmidt EC,
et al: A temporarily distinct subpopulation of slow-cycling
melanoma cells is required for continuous tumor growth. Cell.
141:583–594. 2010. View Article : Google Scholar : PubMed/NCBI
|
|
23
|
Wang J, Guo LP, Chen LZ, Zeng YX and Lu
SH: Identification of cancer stem cell-like side population cells
in human nasopharyngeal carcinoma cell line. Cancer Res.
67:3716–3724. 2007. View Article : Google Scholar : PubMed/NCBI
|
|
24
|
Li C, Heidt DG, Dalerba P, et al:
Identification of pancreatic cancer stem cells. Cancer Res.
67:1030–1037. 2007. View Article : Google Scholar : PubMed/NCBI
|
|
25
|
Li T, Su Y, Mei Y, et al: ALDH1A1 is a
marker for malignant prostate stem cells and predictor of prostate
cancer patients’ outcome. Lab Invest. 90:234–244. 2010.PubMed/NCBI
|
|
26
|
Bussolati B, Bruno S, Grange C, Ferrando U
and Camussi G: Identification of a tumor-initiating stem cell
population in human renal carcinomas. FASEB J. 22:3696–3705. 2008.
View Article : Google Scholar : PubMed/NCBI
|
|
27
|
Goodell MA, Brose K, Paradis G, Conner AS
and Mulligan RC: Isolation and functional properties of murine
hematopoietic stem cells that are replicating in vivo. J Exp Med.
183:1797–1806. 1996. View Article : Google Scholar : PubMed/NCBI
|
|
28
|
Alfakir M, Dawe N, Eyre R, et al: The
temporal and spatial expression patterns of ABCG2 in the developing
human heart. Int J Cardiol. Nov 24–2010.(Epub ahead of print).
|
|
29
|
Watanabe K, Nishida K, Yamato M, et al:
Human limbal epithelium contains side population cells expressing
the ATP-binding cassette transporter ABCG2. FEBS Lett. 565:6–10.
2004. View Article : Google Scholar : PubMed/NCBI
|
|
30
|
Pascal LE, Oudes AJ, Petersen TW, et al:
Molecular and cellular characterization of ABCG2 in the prostate.
BMC Urol. 7:62007. View Article : Google Scholar
|
|
31
|
Larderet G, Fortunel NO, Vaigot P, et al:
Human side population keratinocytes exhibit long-term proliferative
potential and a specific gene expression profile and can form a
pluristratified epidermis. Stem Cells. 24:965–974. 2006. View Article : Google Scholar : PubMed/NCBI
|
|
32
|
Clarke RB, Spence K, Anderson E, Howell A,
Okano H and Potten CS: A putative human breast stem cell population
is enriched for steroid receptor-positive cells. Dev Biol.
277:443–456. 2005. View Article : Google Scholar : PubMed/NCBI
|
|
33
|
Challen GA, Bertoncello I, Deane JA,
Ricardo SD and Little MH: Kidney side population reveals
multilineage potential and renal functional capacity but also
cellular heterogeneity. J Am Soc Nephrol. 17:1896–1912. 2006.
View Article : Google Scholar
|
|
34
|
Salcido CD, Larochelle A, Taylor BJ,
Dunbar CE and Varticovski L: Molecular characterisation of side
population cells with cancer stem cell-like characteristics in
small-cell lung cancer. Br J Cancer. 102:1636–1644. 2010.
View Article : Google Scholar : PubMed/NCBI
|
|
35
|
Yin B, Yang Y, Zhao Z, et al: Arachidonate
12-lipoxygenase may serve as a potential marker and therapeutic
target for prostate cancer stem cells. Int J Oncol. 38:1041–1046.
2011.PubMed/NCBI
|
|
36
|
Tabuse M, Ohta S, Ohashi Y, et al:
Functional analysis of HOXD9 in human gliomas and glioma cancer
stem cells. Mol Cancer. 10:602011. View Article : Google Scholar : PubMed/NCBI
|
|
37
|
Feuring-Buske M and Hogge DE: Hoechst
33342 efflux identifies a subpopulation of cytogenetically normal
CD34(+)CD38(−) progenitor cells from patients with acute myeloid
leukemia. Blood. 97:3882–3889. 2001.PubMed/NCBI
|
|
38
|
Hirschmann-Jax C, Foster AE, Wulf GG, et
al: A distinct ‘side population’ of cells with high drug efflux
capacity in human tumor cells. Proc Natl Acad Sci USA.
101:14228–14233. 2004.
|
|
39
|
Haraguchi N, Utsunomiya T, Inoue H, et al:
Characterization of a side population of cancer cells from human
gastrointestinal system. Stem Cells. 24:506–513. 2006. View Article : Google Scholar : PubMed/NCBI
|
|
40
|
Mitsutake N, Iwao A, Nagai K, et al:
Characterization of side population in thyroid cancer cell lines:
cancer stem-like cells are enriched partly but not exclusively.
Endocrinology. 148:1797–1803. 2007. View Article : Google Scholar : PubMed/NCBI
|
|
41
|
Ho MM, Ng AV, Lam S and Hung JY: Side
population in human lung cancer cell lines and tumors is enriched
with stem-like cancer cells. Cancer Res. 67:4827–4833. 2007.
View Article : Google Scholar : PubMed/NCBI
|
|
42
|
Schinkel AH and Jonker JW: Mammalian drug
efflux transporters of the ATP binding cassette (ABC) family: an
overview. Adv Drug Deliv Rev. 55:3–29. 2003. View Article : Google Scholar : PubMed/NCBI
|
|
43
|
Doyle LA, Yang W, Abruzzo LV, et al: A
multidrug resistance transporter from human MCF-7 breast cancer
cells. Proc Natl Acad Sci USA. 95:15665–15670. 1998. View Article : Google Scholar : PubMed/NCBI
|
|
44
|
Inowa T, Hishikawa K, Matsuzaki Y, et al:
GADD45β determines chemoresistance and invasive growth of side
population cells of human embryonic carcinoma. Stem Cells Int.
2010:7829672010.
|
|
45
|
Ma B, Lei X, Guan Y, et al: Maintenance of
retinal cancer stem cell-like properties through long-term
serum-free culture from human retinoblastoma. Oncol Rep.
26:135–143. 2011.PubMed/NCBI
|
|
46
|
Shi GM, Xu Y, Fan J, et al: Identification
of side population cells in human hepatocellular carcinoma cell
lines with stepwise metastatic potentials. J Cancer Res Clin Oncol.
134:1155–1163. 2008. View Article : Google Scholar : PubMed/NCBI
|
|
47
|
Wang YH, Li F, Luo B, et al: A side
population of cells from a human pancreatic carcinoma cell line
harbors cancer stem cell characteristics. Neoplasma. 56:371–378.
2009. View Article : Google Scholar : PubMed/NCBI
|
|
48
|
Yin BB, Wu SJ, Zong HJ, Ma BJ and Cai D:
Preliminary screening and identification of stem cell-like sphere
clones in a gallbladder cancer cell line GBC-SD. J Zhejiang Univ
Sci B. 12:256–263. 2011. View Article : Google Scholar : PubMed/NCBI
|
|
49
|
Zhang HB, Ren CP, Yang XY, et al:
Identification of label-retaining cells in nasopharyngeal epithelia
and nasopharyngeal carcinoma tissues. Histochem Cell Biol.
127:347–354. 2007. View Article : Google Scholar : PubMed/NCBI
|
|
50
|
Zhang H, Feng X, Liu W, et al: Underlying
mechanisms for LTF inactivation and its functional analysis in
nasopharyngeal carcinoma cell lines. J Cell Biochem. 112:1832–1843.
2011. View Article : Google Scholar : PubMed/NCBI
|
|
51
|
Zhao M, Ren C, Yang H, et al:
Transcriptional profiling of human embryonic stem cells and
embryoid bodies identifies HESRG, a novel stem cell gene. Biochem
Biophys Res Commun. 362:916–922. 2007. View Article : Google Scholar : PubMed/NCBI
|
|
52
|
Cotsarelis G, Sun TT and Lavker RM:
Label-retaining cells reside in the bulge area of pilosebaceous
unit: implications for follicular stem cells, hair cycle, and skin
carcinogenesis. Cell. 61:1329–1337. 1990. View Article : Google Scholar : PubMed/NCBI
|
|
53
|
Potten CS: Keratinocyte stem cells,
label-retaining cells and possible genome protection mechanisms. J
Investig Dermatol Symp Proc. 9:183–195. 2004. View Article : Google Scholar : PubMed/NCBI
|
|
54
|
Cairns J: Mutation selection and the
natural history of cancer. Nature. 255:197–200. 1975. View Article : Google Scholar : PubMed/NCBI
|
|
55
|
Tabor MH, Clay MR, Owen JH, et al: Head
and neck cancer stem cells: the side population. Laryngoscope.
121:527–533. 2011. View Article : Google Scholar : PubMed/NCBI
|
|
56
|
Welm BE, Tepera SB, Venezia T, Graubert
TA, Rosen JM and Goodell MA: Sca-1(pos) cells in the mouse mammary
gland represent an enriched progenitor cell population. Dev Biol.
245:42–56. 2002. View Article : Google Scholar : PubMed/NCBI
|
|
57
|
Patrawala L, Calhoun T,
Schneider-Broussard R, Zhou J, Claypool K and Tang DG: Side
population is enriched in tumorigenic, stem-like cancer cells,
whereas ABCG2+ and ABCG2− cancer cells are
similarly tumorigenic. Cancer Res. 65:6207–6219. 2005. View Article : Google Scholar : PubMed/NCBI
|