Introduction
Hemangiopericytomas (HPCs) are rare, highly cellular
and vascular tumors derived from pericytes of Zimmerman, which are
contractile smooth-muscle cells surrounding the endothelium of the
capillaries, and are ubiquitous in all types of mesenchymal tissue.
HPCs may arise in the soft tissues anywhere in the body (1,2) and
the most common sites are head and neck, lower extremities and
retroperitoneum. HPCs affecting the central nervous system are
considered malignant (3,4), existing in low-grade and high-grade
form with predictably aggressive clinical behavior, including high
rates of recurrence and distant metastases (5). Macroscopically, HPC is a solid tumor
that is well demarcated from the adjacent brain tissue (3,6). The
tumor is typically treated by complete microsurgical removal,
followed by local irradiation of the tumor bed. The majority of
tumors can be removed in a seemingly complete manner. However,
local recurrences are almost ine- vitable in the long run and tumor
metastasis eventually occurs in over 60% of patients after 15 years
(3,6,7).
Intracranial HPCs, classified under the heading of
non-meningothelial mesenchymal tumors (8), are difficult to distinguish from
meningiomas based on location, clinical presentation (9–11) and
brain imaging (5,12–14).
Due to their more aggressive behavior, intracranial HPCs require
different management and a correct diagnosis is critical (15–17).
However, data from two studies (18,19)
suggest that the discrimination between HPC and meningiomas seems
to be possible by using in vivo MR spectroscopy (MRS) and
the authors hypothesized that the discrimination can be obtained
based on the much higher levels of myo-inositol (Myo) in the HPCs.
Moderately increased concentrations of Myo in the in vivo MR
spectra of four HPCs have been also reported by Fountas et
al (10).
Additional studies have reported on the in
vivo 1H-MRS spectra from HPC, but they are not as
informative as high resolution magic angle spinning (HR-MAS) MRS
about the complete metabolic profile of this type of tumor. The
choline containing compounds (ChoCC) peak is dominant in these
in vivo spectra (20,21).
HPCs are rare tumors, therefore performing a
significant study on a large amount of samples in order to improve
the diagnosis remains a challenge, however it is important to know
more about the biochemical composition of this tumor. With this
aim, we studied the metabolic profile of HPC using ex vivo
HR-MAS MRS, which allows the whole analysis of intact tissue with
minimal sample preparation (22–24). A
comparison between the in vivo and ex vivo MRS
spectra was performed with the goal to better understand HPC and
edema tissues. Moreover, the difference between the HPC and
meningothelial meningioma will be highlighted.
Materials and methods
Sample
Informed consent before spectroscopic examination
was obtained from the patient. MRI and in vivo localized
single voxel 1H-MRS were performed with a 3 Tesla
whole-body scanner (General Electric Medical Systems, Milwaukee,
WI) following the routine standard clinical protocol previously
described (25). MR imaging was
performed with T2-weighted fast spin-echo (FSE) sequences (TR, 4200
ms; TE, 93 ms; NEX, 2; 24-cm field of view; 512×512 matrix; 4-mm
sections), fluid-attenuated inversion recovery (FLAIR) sequences
(TR, 9002 ms; TE, 91 ms; NEX, 2; 24-cm field of view; 320×320
matrix; 4-mm sections) in the axial plane, and T1-weighted
spin-echo (SE) sequences (TR, 560 ms; TE, 18 ms; NEX, 2; 24-cm
field of view; 384×224 matrix; 4-mm sections) in the sagittal and
coronal planes before administration of a contrast agent and
coronal and axial planes after administration of a contrast agent.
For choosing a voxel for spectroscopy, homogeneous regions on the
T2-weighted image were selected carefully excluding cystic,
necrotic, or hemorrhagic region. The volume of interest (VOI) size
ranged from 1.2 to 8 cm3. 1H-MR spectra were acquired
before administration of the contrast agent with a point-resolved
spectroscopy sequence (PRESS) for localization, with TR 2000 ms and
TE 35 ms, 128 acquisitions, and a 3-pulse chemical shift selection
suppression (CHESS) sequence to provide water suppression. We used
automated optimization of gradient shimming, transmitter pulse
power, and water suppression.
MRI revealed a left frontobasal perisellar lesion.
The lesion is an extra-axial round mass with homogeneous intense
enhancement after contrast administration and it is associated with
severe cerebral edema in underlying brain parenchyma and midline
shifts. According to Chernov et al (26) the extension of perilesional edema,
evaluated by T2-weighted MR image, was graded as severe. The
patient received mannitol as the only anti-edema drug. After MRI
and in vivo MRS the patient underwent surgery and one sample
was obtained from the lesion and a second sample was obtained from
the edema area. A small portion of tumor and edema, were used for
HR-MAS MRS analysis. A portion of tumoral specimen was used for
routine histopathology and revealed a grade II WHO HPC (27). During surgery, resected tissue was
sent for histological analysis, and remainder of the tissue was
immediately frozen in liquid nitrogen and stored at −80°C until MRS
analyses. The manipulation time for sample storing under nitrogen
is around 1 min.
Ex vivo HR-MAS MRS
Before MRS examination, each sample was flushed with
D2O to improve the homogeneity, the water suppression,
and to add deuterium as a nucleus for the lock system. The sample
was introduced in a MAS zirconia rotor (4 mm OD) maintained on ice,
fitted with a 50-μl cylindrical insert to increase sample
homogeneity, and then transferred into the probe cooled to 4°C.
Total time for sample preparation prior to NMR analysis was only a
few minutes.
1H and 13C HR-MAS spectra were
recorded with a Bruker Avance 400 (Bruker BioSpin, Karlsruhe,
Germany) spectrometer operating at a frequency of 400.13 and 100.61
MHz, respectively. The instrument was equipped with a
1H,13C HR-MAS probe. Experiments were
performed at a temperature of 4°C controlled by a Bruker cooling
unit.
Samples were spun at 4000 Hz and three different
types of one-dimensional (1D) proton spectra were acquired by using
the sequences implemented in the Bruker software: i) a composite
pulse sequence (zgcppr) (28) with
1.5 s water presaturation during the relaxation delay, 8 kHz
spectral width, 32k data points, 32 scans, ii) a water-suppressed
spinecho Carr-Purcell-Meiboom-Gill (CPMG) sequence (cpmgpr)
(29) with 1.5 s water
presaturation during the relaxation delay, 1 ms echo time (τ) and
360 ms total spin-spin relaxation delay (2nτ), 8 kHz spectral
width, 32k data points, 256 scans and iii) a sequence for diffusion
measurements based on stimulated echo and bipolar-gradient pulses
(ledbpgp2s1d) (30) with Δ 200 ms,
eddy current delay Te 5 ms, δ 2×2 ms, sine-shaped gradient with 32
G/cm followed by a 200-μs delay for gradient recovery, 8 kHz
spectral width, 8k data points, 256 scans. Two-dimensional (2D)
1H,1H-correlation spectroscopy (COSY)
(31,32) spectra were acquired using a standard
pulse sequence (cosygpprqf) and 0.5 s water presaturation during
relaxation delay, 8 kHz spectral width, 4k data points, 32 scans
per increment, 256 increments. 2D 1H,1H-total
correlation spectroscopy (TOCSY) (33,34)
spectra were acquired using a standard pulse sequence (mlevphpr)
and 1 s water presaturation during relaxation delay, 100 ms mixing
time (spin-lock), 4 kHz spectral width, 4k data points, 32 scans
per increment, 128 increments. 2D
1H,13C-heteronuclear single quantum coherence
(HSQC) (35) spectra were acquired
using an echo-anti-echo phase-sensitive standard pulse sequence
(hsqcetgp) and 0.5 s relaxation delay, 1.725 ms evolution time, 4
kHz spectral width in f2, 4k data points, 128 scans per increment,
17 kHz spectral width in f1, 256 increments.
Relative quantification of
metabolites
In each spectrum, relative ratios of all of the
quantificable metabolites were calculated by measuring the area of
individual metabolites signal with respect to the area of Glu
signal at 2.34 ppm. The intensity of the Glu remained consistent in
HPC and meningioma spectra as noted by the visual inspection of the
1H spectra of all tissue samples. Metabolite ratios
relative to Glu are expressed as mean ± SD (standard
deviation).
Results
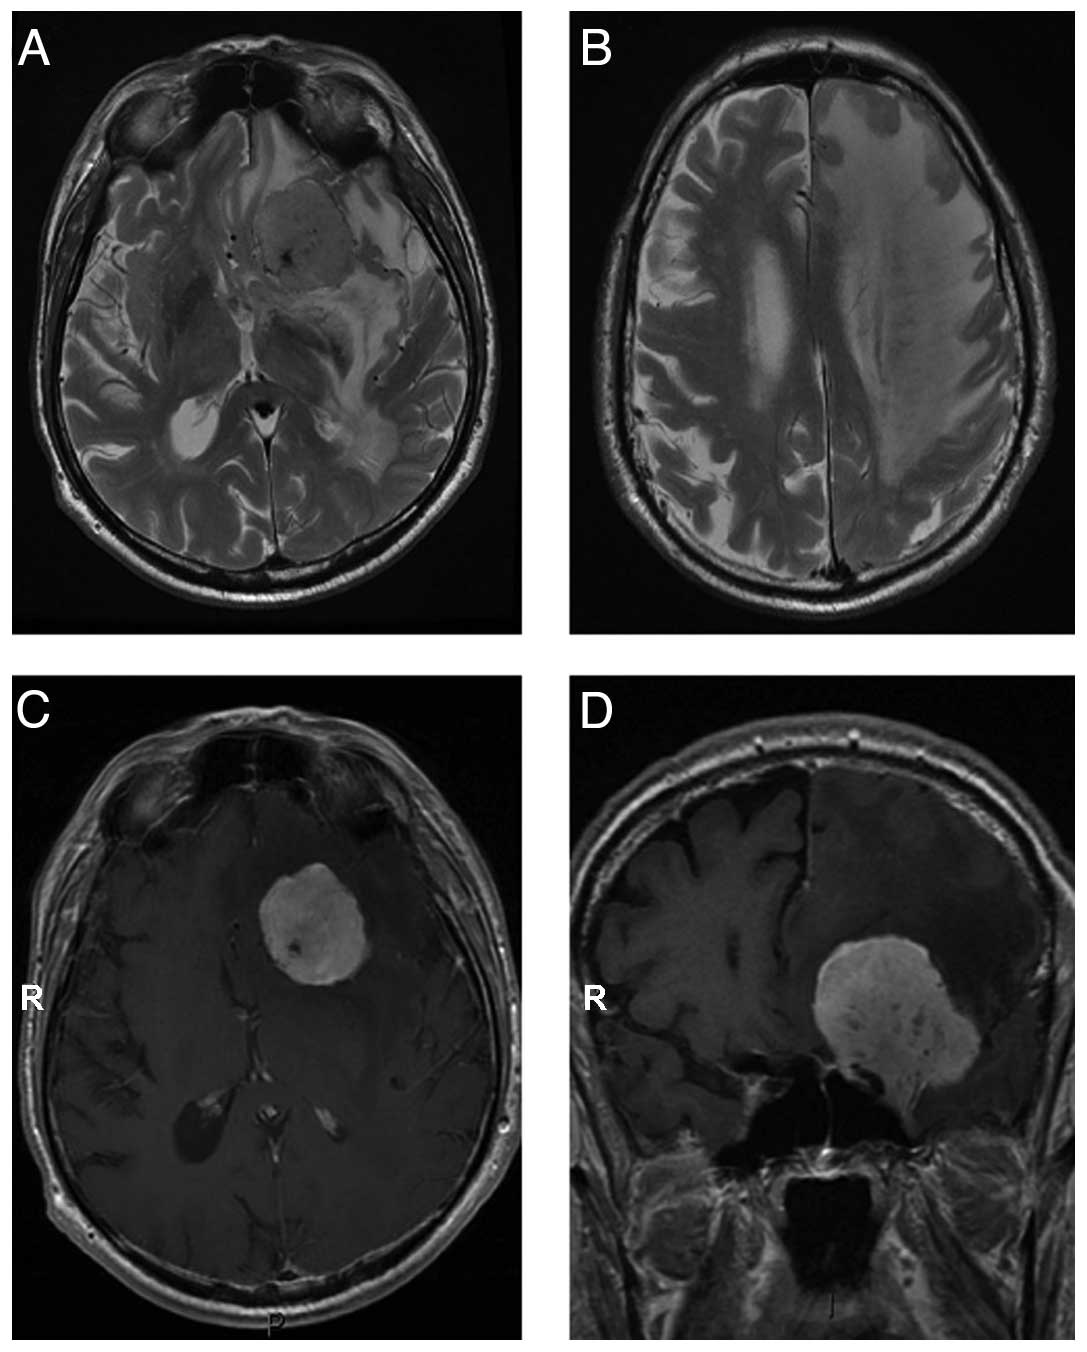
Typical axial T2-weighted MR images of HPC, edema,
axial T1-weighted and coronal T1-weighted MR images after contrast
administration are shown in Fig. 1.
The HPC demonstrate a large abnormal mass with severe edema. T1-
and T2-weighted MR imaging characteristics, and contrast uptake
appear compatible with both meningiomas and HPCs. The tumor
demonstrates heterogeneous intensity being both hypo- and
isointense to white matter and iso- and hyperintense to gray
matter. Small vascular elements are evident in the lesion (Fig. 1A). Significant edema in underlying
brain parenchyma is present (Fig.
1B). The lesion shows intense contrast enhancement (Fig. 1C) and dural attachment (Fig. 1D). MRI shows a sharply demarcated
extra-assial tumor with dural attachment in left para/suprasellar
region and contrast enhancement on T1-weighted images after
gadolinium. The lesion is isointense with grey matter on
T2-weighted images with small hypointense areas due to vessels.
Significant edema in underlying brain parenchyma is present.
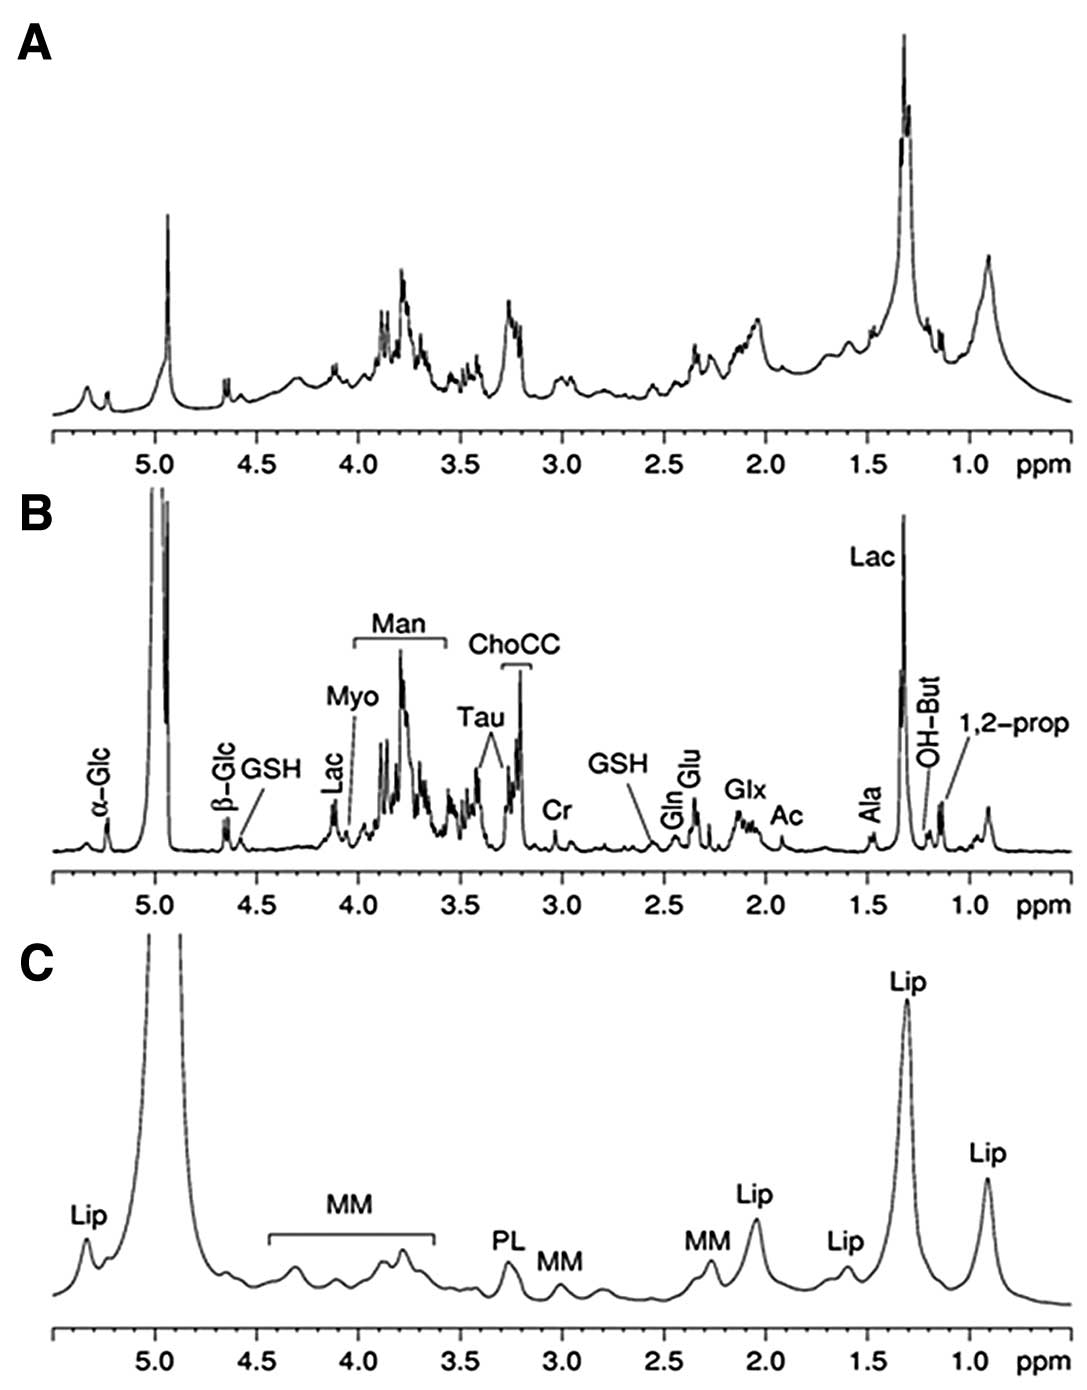
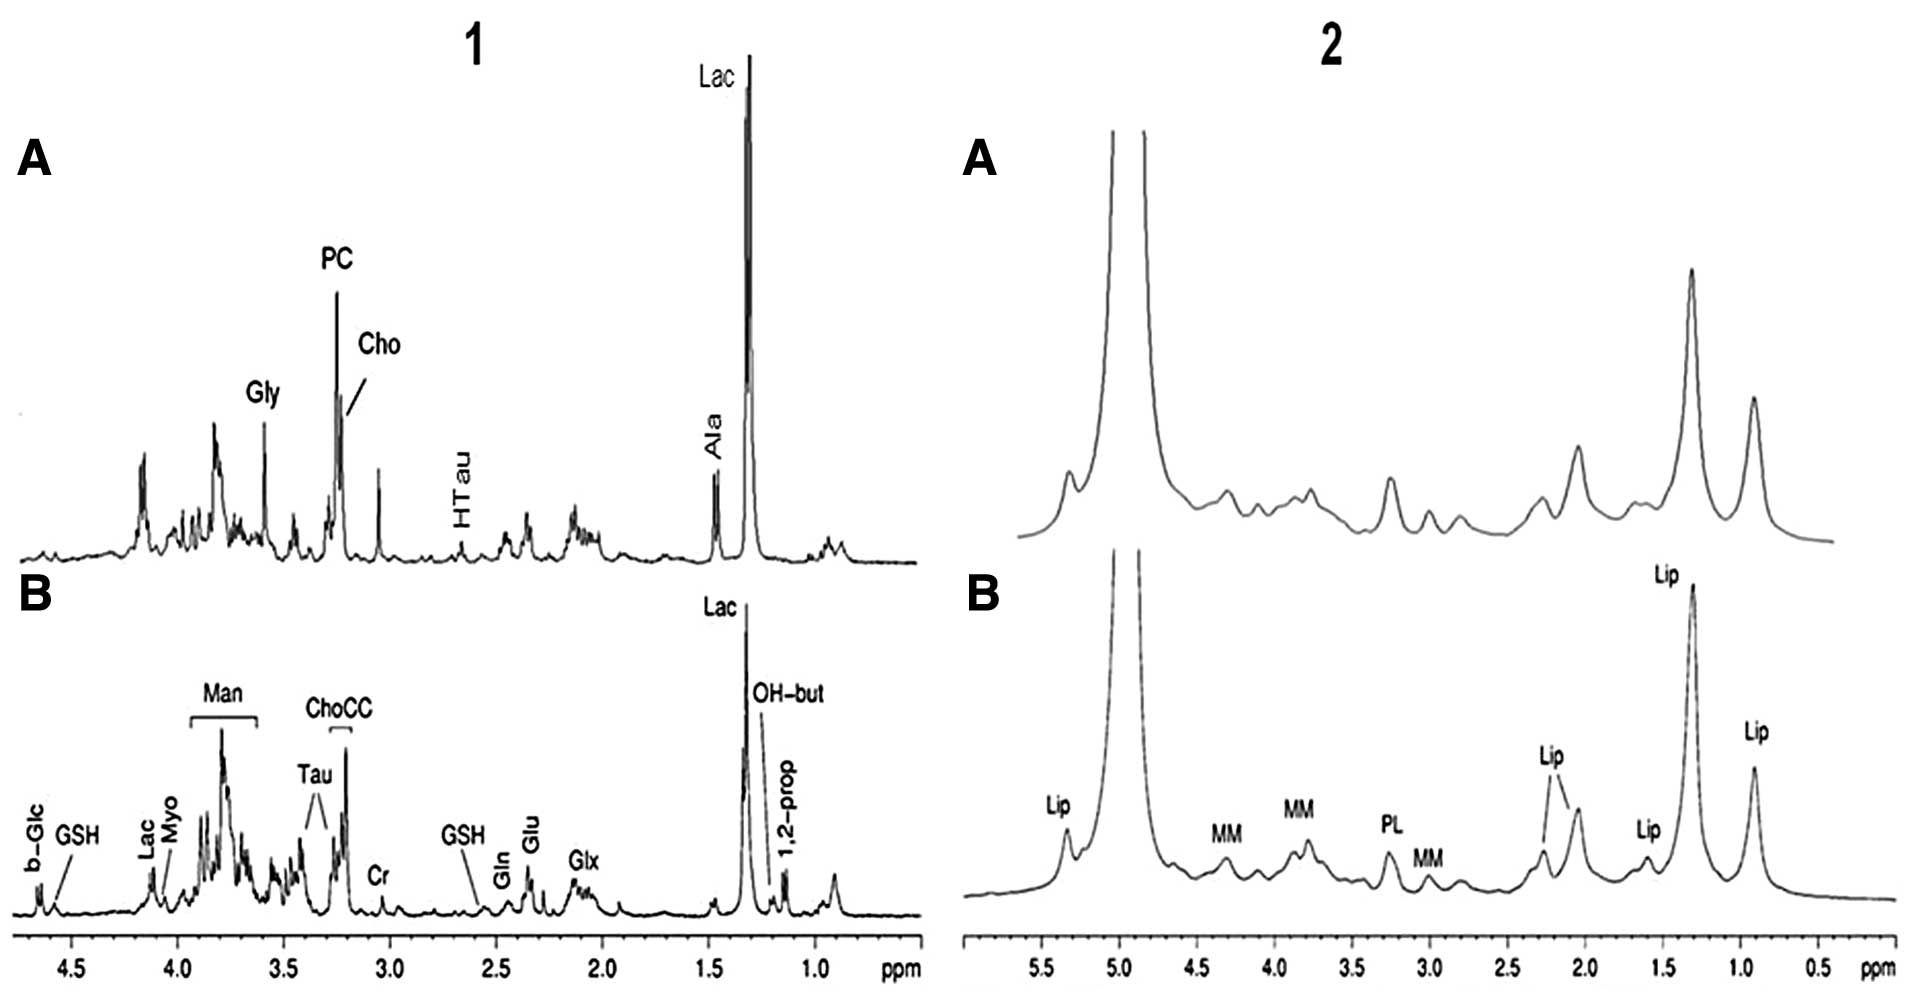
Fig. 2 shows the
ex vivo 1D 1H HR-MAS MR spectra of HPC lesion.
The spectrum (Fig. 2A) was obtained
using a conventional 1H spectrum with water
presaturation, and it represents the global biochemical composition
of lesion. The second spectrum (Fig.
2B), acquired with a spin-echo sequence, displays signals
deriving from small metabolites. After the analysis several
metabolites are identified: 1,2-propanediol (1,2-propanendiol is an
exogenous compound used as solvent in pharmaceutical preparations
containing some water-soluble ingredients), β-hydroxybutyrate
(OH-But), lactate (Lac), alanine (Ala), acetate (Ac), glutamine
plus glutamate (Glx), glutamate (Glu), glutamine (Gln), glutathione
(GSH), creatine (Cr), ChoCC, taurine (Tau), mannitol (Man), Myo, α-
and β-glucose (α- and β-Glc). The assignment of 1,2-propanediol is
based on the analysis of 1D 1H, and selected 2D (COSY,
TOCSY and HSQC) NMR spectra, where we highlight the H-H
correlations of 1,2-propanediol. The signals are at 1.14 ppm (d)
CH3, 3.55/3.44 ppm CH2 and 3.87 ppm CH. The
spectrum (Fig. 2C) was acquired
with a diffusion edited sequence and shows the contribution from
lipids and macromolecules. The complete metabolic assignments were
confirmed using two dimensional COSY, TOCSY and HSQC spectra. All
of the experiments permit clarification of the metabolite pattern
of the lesion and the same experiments were also used to
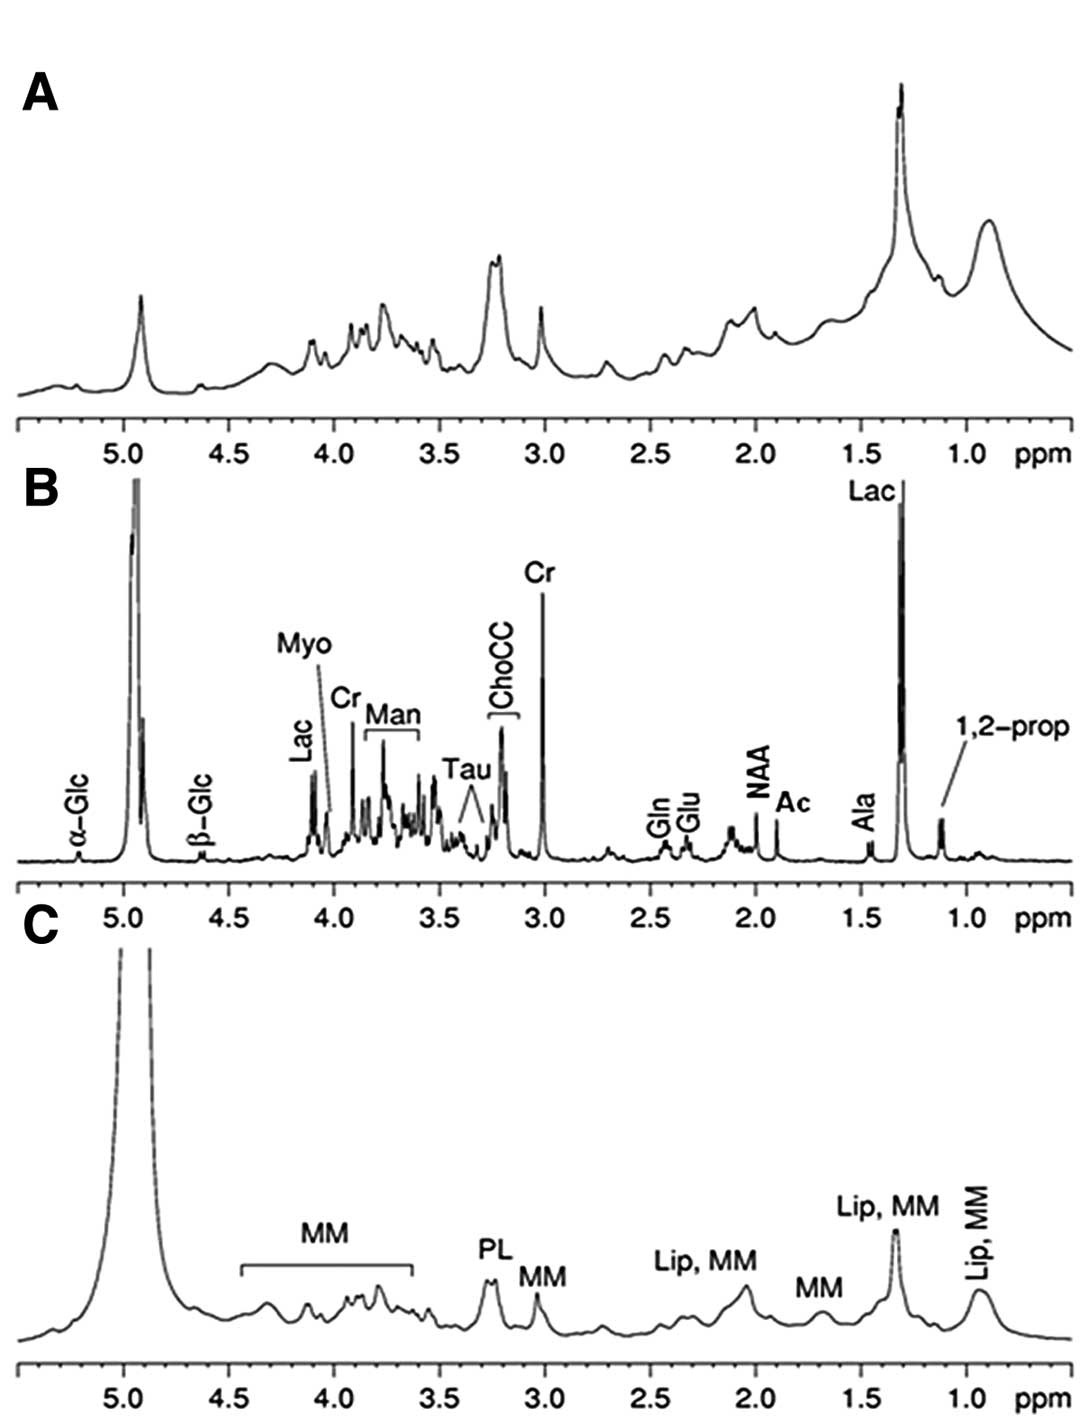
characterize the metabolic profile of edema (Fig. 3).
The results were compared with data from the
literature (36) and, when
possible, with the experimental spectra in the Human Metabolome
Database (37) to assign the
different metabolites.
The same small metabolites were found in both tumor
and edema, but in different amounts. For instance, the amount of Cr
and Myo is lower in the lesion compared to in the edema, whereas
levels of α- and β-Glc together with Tau seem to be higher in the
lesion. Furthermore, we observed a different Glu/Gln ratio in the
two types of tissues, and that OH-But and GSH were present only in
HPC. Different profiles were observed for macromolecules (MM) and
lipids: HPC diffusion spectrum (Fig.
2C) is characterized by the presence of lipids (manly
triglycerides, probably as lipid bodies) and MM signals, whereas
that of the edema (Fig. 3C) shows
signals mainly due to MM.
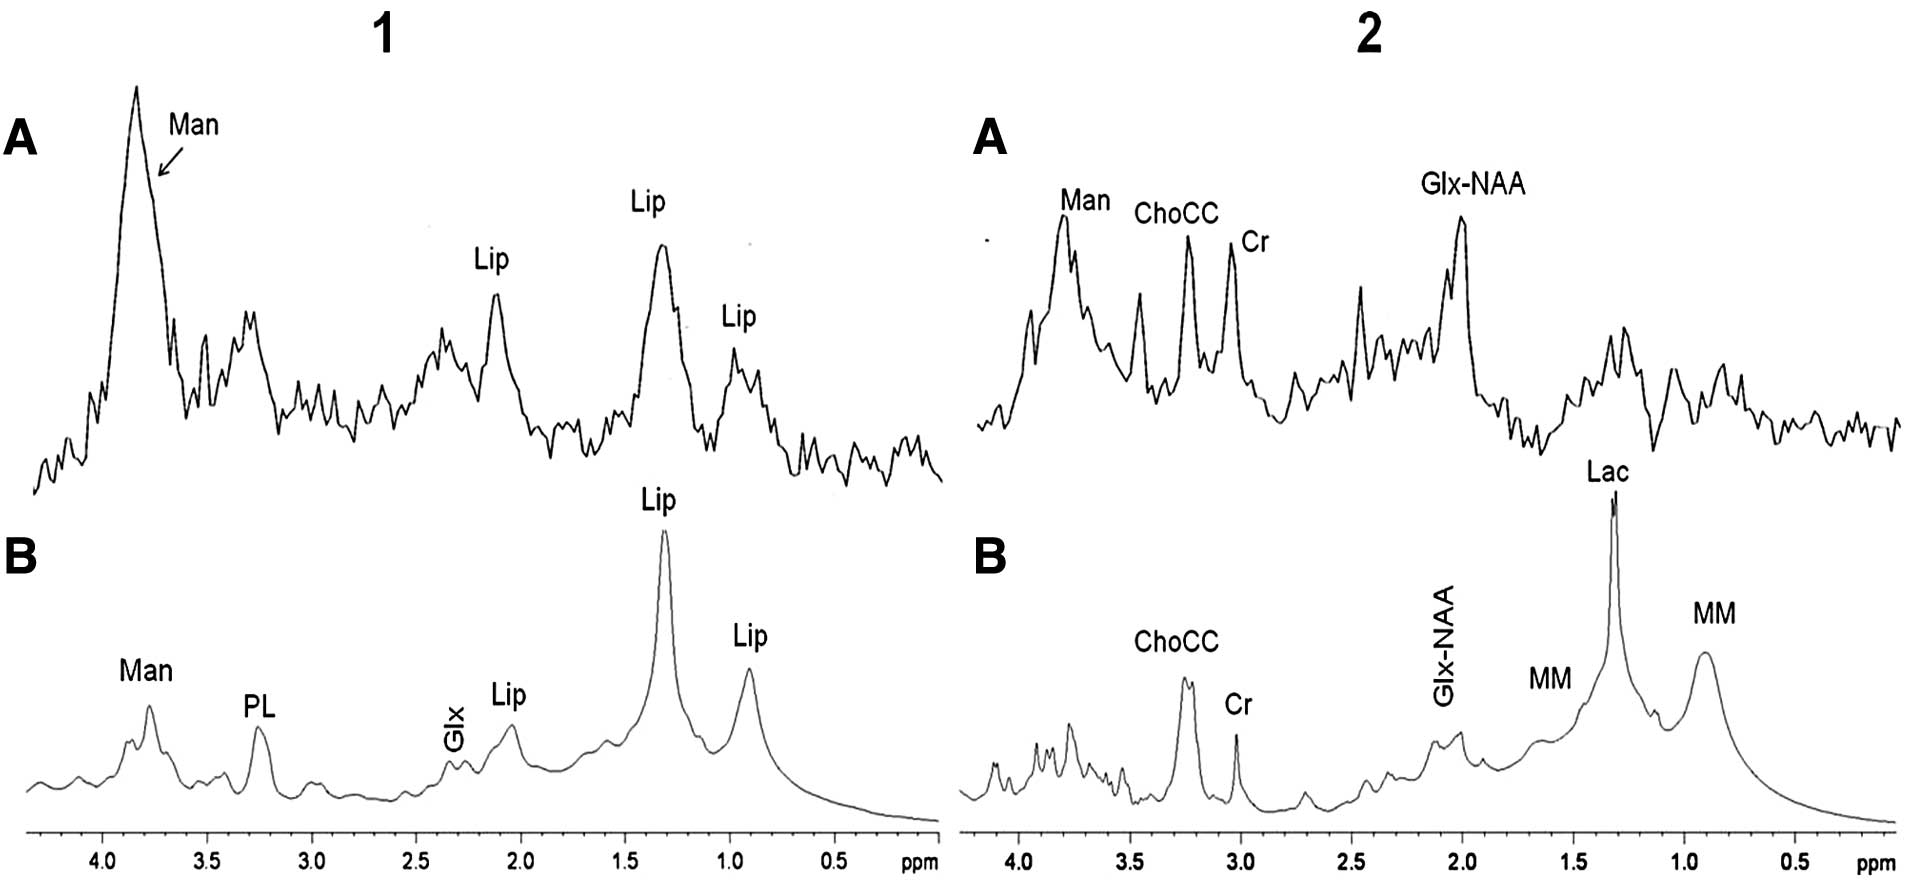
A direct comparison between in vivo (TE, 35)
and conventional ex vivo spectra of the lesion after a
suitable broadening process (Fig.
4, panel 1) shows that there is good agreement between the two
profiles. The main difference between in vivo and ex
vivo spectra is found in the Man signals due to the different
magnetic fields used. At 3T, the field for in vivo MRS, the
signals due to Man appear as a broad signal centred at 3.8 ppm,
whereas at 9.4T, the field for ex vivo MRS spectra, Man
signals are distributed in a region between 3.6 and 4.0 ppm and
structured at low line broadening. Man is an exogenous metabolite
used to reduce brain pressure produced by the tumoral mass in
patients.
The ex vivo HR-MAS spectrum of the edema
(Fig. 4, panel 2B) shows more Lac
and MM and less N-acetylacetylaspartate (NAA) than the in
vivo spectrum (Fig. 4, panel
2A). The Lac signal is higher in the ex vivo than in the
in vivo spectrum of the edema, but this is likely not
significant, since the Lac signal is always observed in ex
vivo spectra due to the unavoidable period of ischemia during
the biopsy procedure (38). The
signal usually assigned to NAA in the in vivo spectrum at
2.01 ppm in this case receives the contributions of Glu and Gln as
can be seen from the HR-MAS ex vivo spectrum. The decrease
in NAA and the increase in acetate (Ac) in the 1H ex
vivo HR-MAS spectrum of the edema are notable (Fig. 3B), suggesting the degradation of NAA
to Ac and aspartate (39).
Comparing the HR-MAS spectra of HPC and meningioma
(Fig. 5), we observe many
differences between the two tumors. The phosphocholine (PC)/choline
(Cho) ratio appears to be different comparing meningioma to HPC
(Fig. 5, panel 1), but in our
opinion this aspect needs further investigation. In fact, we
observed a high variability of PC/Cho in our meningioma set. It is
to be noted that HR-MAS MRS allows the detection of Ala in HPC,
which has been reported to be absent (19,20).
This is probably due to the higher sensitivity of HR-MAS MRS with
respect to in vivo MRS. Nevertheless, both techniques show
that the Ala content is lower in HPC than in meningioma. The
diffusion edited spectra of HPC and meningioma are shown in
Fig. 5, panel 2. The comparison
shows a very similar profile with slightly higher amounts of lipids
in HPC compared to meningioma.
Discussion
We applied ex vivo HR-MAS MRS to assess the
metabolic status of HPC and edema. Several differences in the
metabolic profile of HPC and edema can be detected.
The resonance deriving from the OH-But was
identified in the lesion spectrum (Fig.
2B). It has been shown that elevated ketone bodies can target
brain tumors while enhancing the metabolic efficiency of normal
neurons glia. Moreover, the ketones bodies are toxic to some tumor
cells and they might restrict availability of glutamine (40–42).
In our case, the pre- sence of OH-But together with Glc in the
lesion could suggest the bioenergetic transition from normal to
neoplastic brain. In contrast to a normal brain, which oxidizes Glc
as well as ketone bodies for energy, malignant brain tumors are
largely dependent on Glc for energy. OH-But is also reported to
prolong cell survival time and to inhibit cerebral edema by
improving energy metabolism in the hypoxia, anoxia and global
cerebral ischemia models. The cerebroprotective effect of OH-But
was examined in rats with permanent (p)-occlusion and transient
(t)-occlusion of middle cerebral artery (MCA) (43).
The low intensity of the NAA signal (singlet at 2.01
ppm; Fig. 3B) is evident in
peritumoral edema tissue analyzed in ex vivo, in agreement
with the decrease of NAA in peritumoral lesion reported in in
vivo spectra MRS (25,44). The NAA is belived to be a marker of
neuronal integrity (45), and its
decrease in the edema may reflect neuronal alteration responsible
for associated epilepsy. Our HR-MAS data obtained from biopsy
samples confirm a strong neuronal alteration and the patient showed
neurological disorders, including seizure epilepsy. Regional brain
reduction of NAA levels measured by MRS is a well recognized marker
of neuronal or axonal loss in many neurologic disorders, including
traumatic brain injury, ischemic stroke, epilepsy, multiple
sclerosis, neoplastic and non-neoplastic lesions (46,47).
Another important difference between HPC and edema
is the Cr amount, which was very low in HPC and higher in the
edema. This is in agreement with our previous in vivo MRS
study of peritumoral brain edema where an energy-linked metabolic
alteration was associated with injury to the myelin sheath
(25).
The biochemical profile of HPC can be compared with
that of meningioma, the molecular characterization of which, by
ex vivo HR-MAS MRS, has already been reported (48,49).
The more suitable comparison is between HPC and meningothelial
meningioma, which is the most common meningioma. We used the Glu
signal at 2.34 ppm as a reference for the analysis because this
signal does not overlap with others and it is easy to integrate.
Moreover, we did not observe appreciable differences among the
meningothelial meningioma (grade I) and HPC samples.
We observed that the relative ratios of Myo, Glc and
GSH with respect to Glu are higher in HPC compared to meningioma;
and vice versa the relative ratios of Cr, Gln, Ala, Gly and ChoCC
with respect to Glu are lower in HPC compared to meningioma
(Table I).
 | Table IRelative ratios metabolite/Glu from
CPMG HR-MAS experiments in HPC and MN (meningothelial
meningioma). |
Table I
Relative ratios metabolite/Glu from
CPMG HR-MAS experiments in HPC and MN (meningothelial
meningioma).
| Metabolites | HPC (1 sample) | MN (5 samples) |
|---|
| Ala | 0.3 | 1.01±0.42 |
| Gln | 0.4 | 0.77±0.34 |
| Cr | 0.3 | 0.59±0.38 |
| ChoCC | 1.84 | 3.39±1.51 |
| Gly | 0.14 | 0.93±0.31 |
| Myo | 0.15 | 0.09±0.08 |
| Glc | 0.47 | - |
| GSH | 0.24 | - |
Hypotaurine (HTau) is detected only in meningioma,
whereas OH-But is present only in HPC. Overall, these data are
consistent with published studies (19–21).
It is difficult to quantify the Tau content in HPC due to
overlapping signal from α-, β-Glc.
In conclusion, HR-MAS spectra permit the
characterization of the metabolic profiles of HPC and peritumoral
edema tissue. The presence of OH-But together with Glc in the
lesion could suggest the bioenergetic transition from normal to
neoplastic brain. The variations in the NAA amount in the edema
area may reflect neuronal alteration responsible for associated
epilepsy. Our HR-MAS data performed on biopsy confirmed a strong
neuronal alteration, and the patient showed neurological disorders
including seizure epilepsy.
We identified many differences between HPC and
meningioma. The relative ratios of Myo, Glc, and GSH with respect
to Glu are higher in HPC compared to meningioma; and, vice versa,
the relative ratios of Cr, Gln, Ala, Gly and ChoCC with respect to
Glu are lower in HPC compared to meningioma. Ala was detected by
HR-MAS MRS in HPC but not in vivo MRS.
The ex vivo HR-MAS allows for a comprehensive
metabolic characterization of HPC tissues. We hope that
identification of key metabolites would provide a basis for studies
aimed at better understanding of the biochemical processes of this
tumor. These data obtained from a large number of samples would be
useful to improve the interpretation of in vivo MRS spectra
and allow for better diagnosis and prognosis.
Acknowledgements
This study was supported by a grant of MUR ex 60% to
V.T. and from a L'Oréal-Unesco Fellowship to Valeria Righi.
Abbreviations:
|
Ala
|
alanine
|
|
Ac
|
acetate
|
|
CPMG
|
Carr-Purcell-Meiboom-Gill
|
|
ChoCC
|
choline containing compounds
|
|
Cr
|
creatine
|
|
HPCs
|
hemangiopericytomas
|
|
HR-MAS
|
high resolution magic angle
spinning
|
|
MRS
|
magnetic resonance spectroscopy
|
|
MRI
|
magnetic resonance imaging
|
|
1D
|
one-dimensional
|
|
2D
|
two-dimensional
|
|
COSY
|
correlation spectroscopy
|
|
TOCSY
|
total correlation spectroscopy
|
|
HSQC
|
heteronuclear single quantum
coherence
|
|
OH-But
|
β-hydroxybutyrate
|
|
Lac
|
lactate
|
|
Glx
|
glutamine plus glutamate
|
|
Glu
|
glutamate
|
|
Gln
|
glutamine
|
|
GSH
|
glutathione
|
|
Tau
|
taurine
|
|
Man
|
mannitol
|
|
Myo
|
myo-inositol
|
|
NAA
|
N-acetylaspartate
|
|
α- and β-Glc
|
α- and β-glucose
|
|
MM
|
macromolecules
|
|
HTau
|
hypotaurine
|
|
PC
|
phosphocholine
|
References
|
1
|
Espat NJ, Lewis JJ, Leung D, et al:
Conventional hemangiopericytoma: modern analysis of outcome.
Cancer. 95:1746–1751. 2002. View Article : Google Scholar : PubMed/NCBI
|
|
2
|
Koch M, Nielsen GP and Yoon SS: Malignant
tumors of blood vessels: angiosarcomas, hemangioendotheliomas, and
hemangiopericytomas. J Surg Oncol. 97:321–329. 2008. View Article : Google Scholar : PubMed/NCBI
|
|
3
|
Mena H, Ribas JL, Pezeshkpour GH, Cowan DN
and Parisi JE: Hemangiopericytoma of the central nervous system: a
review of 94 cases. Hum Pathol. 22:84–91. 1991. View Article : Google Scholar : PubMed/NCBI
|
|
4
|
Scheithauer BW, Fuller GN and VandenBerg
SR: The 2007 WHO classification of tumors of the nervous system:
controversies in surgical neuropathology. Brain Pathol. 18:307–316.
2007. View Article : Google Scholar : PubMed/NCBI
|
|
5
|
Wu W, Shi JX, Cheng HL, et al:
Hemangiopericytomas in the central nervous system. J Clin Neurosci.
16:519–523. 2009. View Article : Google Scholar : PubMed/NCBI
|
|
6
|
Jääskeläinen J, Louis DN, Paulus W and
Haltia MJ: Haemangiopericytoma. Pathology and Genetics of the
Nervous System Tumors. Kleihues P and Cavenee WK: WHO
Classification of Tumors. IARC Press; Lyon: pp. 190–192. 2000
|
|
7
|
Kim JH, Jung HW, Kim YS, et al: Meningeal
hemangiopericytomas: long-term outcome and biological behavior.
Surg Neurol. 59:47–54. 2003. View Article : Google Scholar : PubMed/NCBI
|
|
8
|
Kleihaus P, Louis DN, Burger PC, et al:
The WHO classification of tumors of the nervous system. J
Neuropathol Exp Neurol. 61:215–229. 2002.
|
|
9
|
Galanis E, Buckner JC, Scheithauer BW, et
al: Management of recurrent meningeal hemangiopericytoma. Cancer.
82:1915–1920. 1998. View Article : Google Scholar : PubMed/NCBI
|
|
10
|
Fountas KN, Kapsalaki E, Kassam M, et al:
Management of intracranial meningeal hemangiopericytomas: outcome
and experience. Neurosurg Rev. 29:145–153. 2006. View Article : Google Scholar : PubMed/NCBI
|
|
11
|
Sundaram C, Uppin SG, Uppin MS, et al: A
clinicopathological and immunohistochemical study of central
nervous system hemangiopericytomas. J Clin Neurosci. 17:469–472.
2010. View Article : Google Scholar : PubMed/NCBI
|
|
12
|
Akiyama M, Sakai H, Onoue H, Miyazaki Y
and Abe T: Imaging intracranial hemangiopericytomas: study of seven
cases. Neuroradiology. 46:194–197. 2004. View Article : Google Scholar : PubMed/NCBI
|
|
13
|
Sibtain NA, Butt S and Connor SE: Imaging
features of central nervous system hemangiopericytomas. Eur Radiol.
17:1685–1693. 2007. View Article : Google Scholar : PubMed/NCBI
|
|
14
|
Tashjian VS, Khanlou N, Vinters HV, et al:
Hemangiopericytoma of the cerebello pontine angle: a case report
and review of the literature. Surg Neurol. 72:290–295. 2009.
View Article : Google Scholar : PubMed/NCBI
|
|
15
|
Soyuer S, Chang EL, Selek U, et al:
Intracranial meningeal hemangiopericytoma: the role of
radiotherapy: report of 29 cases and review of the literature.
Cancer. 100:1491–1497. 2004. View Article : Google Scholar : PubMed/NCBI
|
|
16
|
Olson C, Yen CP, Schlesinger D and Sheehan
J: Radiosurgery for intracranial hemangiopericytoma: outcomes after
initial and repeat Gamma Knife surgery. J Neurosurgery.
112:133–139. 2010. View Article : Google Scholar : PubMed/NCBI
|
|
17
|
Rutkowski MJ, Sughrue ME, Kane AJ, et al:
Predictors of mortality following treatment of intracranial
hemangiopericytoma. Neurosurgery. 113:340–351. 2010.
|
|
18
|
Barba I, Moreno A, Martinez-Pérez I, et
al: Magnetic resonance spectroscopy of brain hemangiopericytomas:
high myoinositol concentrations and discrimination from
meningiomas. J Neurosurg. 94:55–60. 2001. View Article : Google Scholar : PubMed/NCBI
|
|
19
|
Fortuniak J, Jaskólski DJ, Stefańczyk L,
Zawirski M and Gajewicz W: Magnetic resonance imaging of rare
intracranial neoplasms - role of the in vivo 1 h spectroscopy in
the radiological differential diagnostics. Cen Eur Neurosurg.
71:181–188. 2010. View Article : Google Scholar : PubMed/NCBI
|
|
20
|
Cho YD, Choi GH, Lee SP and Kim JK:
(1)H-MRS metabolic patterns for distinguishing between meningiomas
and other brain tumors. Magn Reson Imaging. 21:663–672. 2003.
View Article : Google Scholar : PubMed/NCBI
|
|
21
|
Hattingen E, Pilatus U, Good C, et al: An
unusual intraventricular haemangiopericytoma: MRI and spectroscopy.
Neuroradiology. 45:386–389. 2003. View Article : Google Scholar : PubMed/NCBI
|
|
22
|
Beckonert O, Coen M, Keun HC, et al:
High-resolution magic-angle-spinning NMR spectroscopy for metabolic
profiling of intact tissue. Nat Protoc. 5:1019–1032. 2010.
View Article : Google Scholar : PubMed/NCBI
|
|
23
|
DeFeo EM and Cheng LL: Charactrizing human
cancer metabolomics by ex vivo 1HRMAS MRS. Technol Cancer Res
Treat. 9:381–391. 2010. View Article : Google Scholar : PubMed/NCBI
|
|
24
|
Moestue S, Sitter B, Bathen TF, Tessem MB
and Gribbestad IS: HR MAS MR spectroscopy in metabolic
characterization of cancer. Curr Top Med Chem. 11:2–26. 2011.
View Article : Google Scholar : PubMed/NCBI
|
|
25
|
Ricci R, Bacci A, Tugnoli V, et al:
Metabolic findings on 3T 1H-MR spectroscopy in
peritumoral brain edema. Am J Neuroradiol. 28:1287–1291. 2007.
|
|
26
|
Chernov MF, Kubo O, Hayashi M, et al:
Proton MRS of the peritumoral brain. J Neurol Sci. 228:137–142.
2005. View Article : Google Scholar : PubMed/NCBI
|
|
27
|
Louis DN, Ohgaki H, Wiestler OD, et al:
The 2007 WHO classification of tumours of the central nervous
system. Acta Neuropathol. 114:97–109. 2007. View Article : Google Scholar : PubMed/NCBI
|
|
28
|
Bax A: A spatially selective composite 90°
radiofrequency pulse. J Magn Reson. 65:142–145. 1985.
|
|
29
|
Meiboom S and Gill D: Modified spin-echo
method for measuring nuclear relaxation time. Rev Sci Instrum.
20:688–691. 1958. View Article : Google Scholar
|
|
30
|
Wu D, Chen A and Johnson CS Jr: An
improved diffusion ordered spectroscopy experiment incorporating
bipolar gradient pulses. Magn Reson Series A. 115:260–264. 1995.
View Article : Google Scholar
|
|
31
|
Jeener J: Pulse pair techniques in high
resolution NMR. Ampere International Summer School; Basko Polje:
1971
|
|
32
|
Aue WP, Bartholdi E and Ernst RR:
Two-dimensional spectroscopy. Application to nuclear magnetic
resonance. J Chem Phys. 64:2229–2246. 1976. View Article : Google Scholar
|
|
33
|
Braunschweiler L and Ernst RR: Coherence
transfer by isotropic mixing: application to proton correlation
spectroscopy. J Magn Reson. 53:521–528. 1983.
|
|
34
|
Bax A and Davis DG: MLEV-17-based
two-dimensional homonuclear magnetization transfer spectroscopy. J
Magn Res. 65:355–360. 1985.
|
|
35
|
Bodenhausen G and Ruben DJ: Natural
abundance nitrogen-15 NMR by enhanced eteronuclear spectroscopy.
Chem Phys Lett. 69:185–189. 1980. View Article : Google Scholar
|
|
36
|
Fan TMW: Metabolite profiling by one- and
two-dimensional NMR analysis of complex mixtures. Prog Nuc Mag Res
Spec. 28:161–219. 1996. View Article : Google Scholar
|
|
37
|
Wishart DS, Tzur D, Knox C, et al: HMDB:
the human metabolome database. Nucleic Acids Res. 35:D521–D526.
2007. View Article : Google Scholar : PubMed/NCBI
|
|
38
|
Opstad KS, Wright AJ, Bell BA, et al:
Correlations between in vivo 1H MRS and ex
vivo 1H HRMAS metabolite measurements in adult human
gliomas. J Magn Reson Imag. 31:289–297. 2010.
|
|
39
|
Harting I, Jost G, Hacke N and Hartmann M:
Magnetic resonance spectroscopy of brain tumours. Nervenarzt.
76:403–417. 2005.PubMed/NCBI
|
|
40
|
Kashiwaya Y, Pawlosky R, Markis W, et al:
A ketone ester diet increases brain malonyl-CoA and uncoupling
proteins 4 and 5 while decreasing food intake in the normal Wistar
Rat. J Biol Chem. 285:25950–25956. 2010. View Article : Google Scholar : PubMed/NCBI
|
|
41
|
Yudkoff M, Daikhin Y, Melø TM, et al: The
ketogenic diet and brain metabolism of amino acids: relationship to
the anticonvulsant effect. Annul Rev Nutr. 27:415–430. 2007.
View Article : Google Scholar : PubMed/NCBI
|
|
42
|
Skinner R, Trujillo A, Ma X and Beierle
EA: Ketone bodies inhibit the viability of human neuroblastoma
cells. J Pediatr Surg. 44:212–216. 2009. View Article : Google Scholar : PubMed/NCBI
|
|
43
|
Suzuki M, Suzuki M, Kitamura Y, et al:
β-hydroxybutyrate, a cerebral function improving agent, protects
rat brain against ischemic damage caused by permanent and transient
focal cerebral ischemia. Jpn J Pharmacol. 89:36–43. 2002.
|
|
44
|
Chernov MF, Kawamata T, Amano K, et al:
Possible role of single-voxel (1)H-MRS in differential diagnosis of
suprasellar tumors. J Neurooncol. 91:191–198. 2009. View Article : Google Scholar : PubMed/NCBI
|
|
45
|
Demougeot C, Garnier P, Mossiat C, et al:
N-Acetylaspartate, a marker of both cellular dysfunction and
neuronal loss: its relevance to studies of acute brain injury. J
Neurochem. 77:408–415. 2001. View Article : Google Scholar
|
|
46
|
Moffett JR, Ross B, Arun P, et al:
N-Acetylaspartate in the CNS: from neurodiagnostics to
neurobiology. Prog Neurobiol. 81:89–131. 2007. View Article : Google Scholar
|
|
47
|
Rigotti DJ, Inglese M and Gonen O:
Whole-brain N-acetylaspartate as a surrogate marker of
neuronal damage in diffuse neurologic disorders. Am J Neuroradiol.
28:1843–1849. 2007.
|
|
48
|
Tugnoli V, Schenetti L, Mucci A, et al:
Ex vivo HR-MAS MRS of human meningiomas: a comparison with
in vivo 1H MR spectra. Int J Mol Med. 18:859–869.
2006.
|
|
49
|
Monleon D, Morales JM, Gonzalez-Darder J,
et al: Benign and atypical meningioma metabolic signatures by
high-resolution magic-angle spinning molecular profiling. J
Proteome Res. 7:2882–2888. 2008. View Article : Google Scholar : PubMed/NCBI
|