Introduction
Lung cancer is the leading cause of cancer death in
the world. In 2011, an estimated 221,000 new cases of lung and
bronchial cancer will be diagnosed, and 156,900 deaths are
estimated to occur due to the disease. Only approximaely 15.6% of
all lung cancer patients are alive 5 years or more after diagnosis
(1). Human lung cancers comprise
two major groups, small cell lung cancer (SCLC) and non-small cell
lung cancer (NSCLC). SCLC accounts for appoximately 15% of all lung
cancers. When compared with NSCLC, SCLC generally has a more rapid
doubling time, a higher growth fraction, and earlier development of
widespread metastases (2). Most
patients with SCLC present with hematogenous metastases, while only
about one third of patients with limited disease confined to the
chest (3).
For all patients with SCLC, chemotherapy is an
essential component of appropriate treatment. Adjuvant chemotherapy
is recommended for those who have undergone surgical resection. For
patients with limited stage SCLC and good performance status (PS)
(0–2), recommended treatment consists of chemotherapy with
concurrent thoracic radiotherapy. For patients with extensive stage
disease, chemotherapy alone is the recommended treatment and
combination chemotherapy has been shown to be active in SCLC
(4). Etoposide and cisplatin (EP)
combination is the most commonly used initial chemotherapy regimen.
Although progress has been seen with combination chemotherapy,
patients with this cancer continue to have a poor prognosis,
especially those with disseminated disease (5).
Since the 80s, researchers have paid attention to
the factors that could be useful in predicting response to
treatment and survival. Several studies have attempted to identify
clinical, laboratory and molecular markers that may help clinicians
and researchers distinguish subgroups of chemotherapy resistant
SCLC patients. However, relatively few prognostic factors have been
widely accepted as useful predictive markers for individual
patients undergoing chemotherapy (6).
Advances in the proteomics study have introduced
novel techniques for the screening of new cancer biomarkers and are
taking our technology for early diagnosis of cancer diseases to a
new horizon (7). Surface-enhanced
laser desorption/ionization time-of-flight mass spectrometry
(SELDI-TOF MS) is a relatively new approach for analysis of complex
biological specimens, including serum (8,9), urine
(10), and tears (11). It has proven to be a sensitive
system for simultaneously investigating thousands of proteins and
identifying the proteomic patterns associated with biological
characteristics (12–14).
In this study, we used SELDI-TOF MS to evaluate
serum samples from SCLC patients prior to chemotherapy and on day 4
of treatment. The goal was to identify potential serum biomarkers
that influence resistance to chemotherapy, and to build a model
that could be used to predict chemotherapy resistance, among
patients with advanced SCLC treated with standard first-line
chemotherapy.
Materials and methods
Patients and chemotherapy regimen
A total of 60 patients with SCLC and 48 healthy
individuals were enrolled between October 2009 and June 2011. All
patients had PS of 0–2 and none had brain metastasis. The
chemotherapy regimen was etoposide (100 mg/m2 on days
1–3), combined with cisplatin (75 mg/m2 on day 1),
3-week cycle. All patients received two cycles of chemotherapy.
Patients who had received prior chemotherapy and radiotherapy were
ineligible for the study. The criteria for eligibility included
confirmed disease (measurable or non-measurable), ≥18 years of age,
adequate hematological function as indicated by a white cell count
of ≥4000/cm3 and a platelet count of
≥100,000/cm3, and normal hepatic function as indicated
by a bilirubin concentration that did not exceed 17 mmol/l. Tumor
response was evaluated after two courses by repeating appropriate
radiographic studies on measurable lesions determined before
inclusion. Treatment response was evaluated according to the World
Health Organization criteria (15).
Briefly, complete response was defined as the absence of disease at
all known sites for at least 4 weeks. Partial response was defined
as a 50% reduction in the sum of the perpendicular diameters of all
measurable lesions, lasting ≥4 weeks. Progressive disease was
defined as either a 25% increase in the area of any one lesion over
the prior measurement, or the development of one or more new
lesions. Others were defined as stable disease. Chemotherapy
resistance includes stable disease and progressive disease. The
objective response in the malignant pleural effusion was evaluated
by CT scan after two courses using the response criteria of the
Japan Lung Cancer Society (16).
Complete response was defined as the complete disappearance of
pleural fluid and negative cytological findings for 4 weeks.
Partial response was defined as a distinguishable decrease or no
increase in pleural fluid and negative cytological findings for 4
weeks. No response was defined as failure to meet the above
criteria. Patients with SCLC had an average age of 53.6 years
(range 44–73 years; 39 men and 17 women) and consisted of 38 and 18
patients suffering from limited and extensive disease. Staging of
SCLC was carried out according to the Veteran’s Administration lung
cancer group staging system (17),
limited stage was defined as a disease as a confined to one
hemithorax including mediastinal lymph nodes and/or supraclavicular
lymph nodes. Extensive disease was defined by opposition to the
criteria of limited disease. The study was approved by the
Institutional Ethics Committee and conducted in accordance with
Helsinki declaration. Patients gave informed consent.
Serum sample
Blood samples were collected by venipuncture at the
Shandong Provincial Hospital of Shandong University. Two
milliliters of whole blood were collected from SCLC patients before
chemotherapy and on day 4 of chemotherapy during the first course
of treatment. The blood was stored at 4°C within 1 h following
collection and later centrifugated for 20 min at 4000 g. Serum
samples were divided into 100 ml aliquots and stored at −80°C until
use.
Proteinchip array analysis
All serum specimen tubes were thawed in wet ice and
centrifugated at 5000 rpm for 5 min, sampled for 10 μl and
buffered with 90 μl of 0.5% CHAPS (pH 7.4) for 5 min, to
which was added 100 μl Cibcron blue 3.0 G (Sigma, St. Louis,
MO, USA) and vortexed at 4°C for 60 min on a platform shaker, then
50 μl samples were taken and diluted with 20 mmol/l HEPES to
240 μl (total reaction volume) and applied to each spot on
the Protein Chip Array by a 96-well bioprocessor (Ciphergen, which
can hold 12 pieces of chips). After the samples were allowed to
bind at 4°C for 60 min on a platform shaker, the array was washed
twice with 200 μl of 20 mmol/l HEPES for 5 min, followed by
two quick rinses with 200 μl of distilled H2O.
After air-drying, 0.5 μl of CHCA (saturation in 50%
acetonitrile and 0.5% trifluoroacetic acid) were applied twice to
each spot. Proteins bound to the H4 chips (through hydrophobic
amino acids) were detected with the ProteinChip Reader. Data were
collected by averaging 80 laser shots with intensity of 155 and
detector sensitivity of 8.
Bioinformatics analysis
Our method analyzing all the data relies on the
undecimated discrete wavelet transform (UDWT) as a first step to
denoise of spectra. The UDWT method is based on the version 2.4 of
the Rice Wavelet Toolbox (RWT). Wavelets have been used previously
to denoise signals in a number of contexts, including magnetic
resonance imaging, ultrasound blood flow. It has been reported to
yield better visual and qualitative denoising. After denoising, the
spectra performed baseline correction (by fitting a monotone local
minimum curve) and mass calibration (adjusting the intensity scale
according to 3 labeled peaks that appears in all the selected
spectra). The proteomic peaks detected and quantified by an
algorithm locates all local maxima height in each denoised,
baseline-corrected, calibrated spectrum. Then the peaks are
filtered by the signal-to-noise ratio >3 (the signal-to-noise
ratio of a peak is estimated as the height above baseline divided
by a wavelet-defined noise). To match peaks across spectra, we
pooled the list of detected peaks and combined peaks in relative
mass by 0.3%, and the percentage of each peak appears in spectra is
specified to 10. The matched peak across spectra is defined as
peaks cluster. The spectra that do not have a peak within a given
cluster will be assigned a maximal height in the cluster for the
peak.
SVM classifier
SVM is a new machine learning approach originally
proposed and developed by Vapnik (18). SVM applications are being actively
pursued in various areas recently, from face recognition to
genomics (19). It is a powerful
tool for analyzing complex data derived from SELDI-TOF MS. We
constructed a non-linear SVM classifier with a radial based
function (RBF) kernel, and with the parameter Gamma 0.6, being the
cost of the constrain violation 19 to discriminate the different
groups. Cross-validation approach (10-fold) was applied to estimate
the accuracy of the classifier. This approach randomly selected the
9/10 of all the samples to be the blinded training set, and the
remaining 1/10 samples to be the test set and repeated the
procedure 10 times. SVM classifier is based on the shareware
program OSU_SVM v.3.00 Toolbox of Junshui Ma and Yi Zhao.
Feature selection and model
establishment
The power of each peak in discriminating different
groups was estimated by receive option curve (ROC). The greater
area under the curve value of the peak shows the higher relative
importance value of the ability to accurately distinguish the
different groups. The peaks with lower area under the curve values
are excluded. To further select the set of candidate biomarkers, a
stepwise approach was used for training many SVM. The top 1 peak
that had the highest ability to predict the two groups (having the
highest area under curve values) was selected as single input to
build the SVM. The discriminating ability of this SVM was estimated
by the accuracy of blind test set. Then, the top 2 peaks were
inputted to the SVM and the accuracy was calculated. The following
peaks were added in input stepwise fashion to train the SVM and the
accuracy was calculated. In this way, many models with different
peaks were built. The peaks inputted to the model with highest
accuracy were selected as the set of potential biomarkers. And the
SVM with the highest accuracy was selected for detecting SCLC.
Western blot analysis
Briefly, serum proteins were separated by
electrophoresis in a SDS-polyacrylamide gel (SDS-PAGE), and
subsequently transferred onto polyvinylidene fluoride membranes.
The membranes were blocked for 1 h at room temperature in 5% skim
milk, then incubated for overnight at 4°C with mouse anti-human
S100-A9 antibody (Novus Biologicals, USA). After washing with PBS,
the membranes were incubated with rabbit anti-mouse antibody for 1
h at 37°C. Finally, the membranes were developed using a Super
Signal West PicoChemiluminescent Substrate kit (Pierce, USA)
followed by Imaging System.
Results
Reproducibility of the experiment
The reproducibility of the SELDI spectra, i.e., mass
and intensity intraassay and interassay, was determined with the
pooled normal serum quality control (QC) sample. A total of four
proteins in the range of 2–30 kDa observed on spectra randomly
selected over the course of the study were used to calculate the
mean coefficient of variance (CV). The intra- and interassay mean
CV for mass were 0.3 and 0.5%, respectively, and the intra- and
interassay mean CV for the normalized intensity were 10 and 14%,
respectively. There was little variation with day-to-day sampling
and instrumentation or chip variations.
Serum SELDI profiles of lung cancer vs.
healthy controls
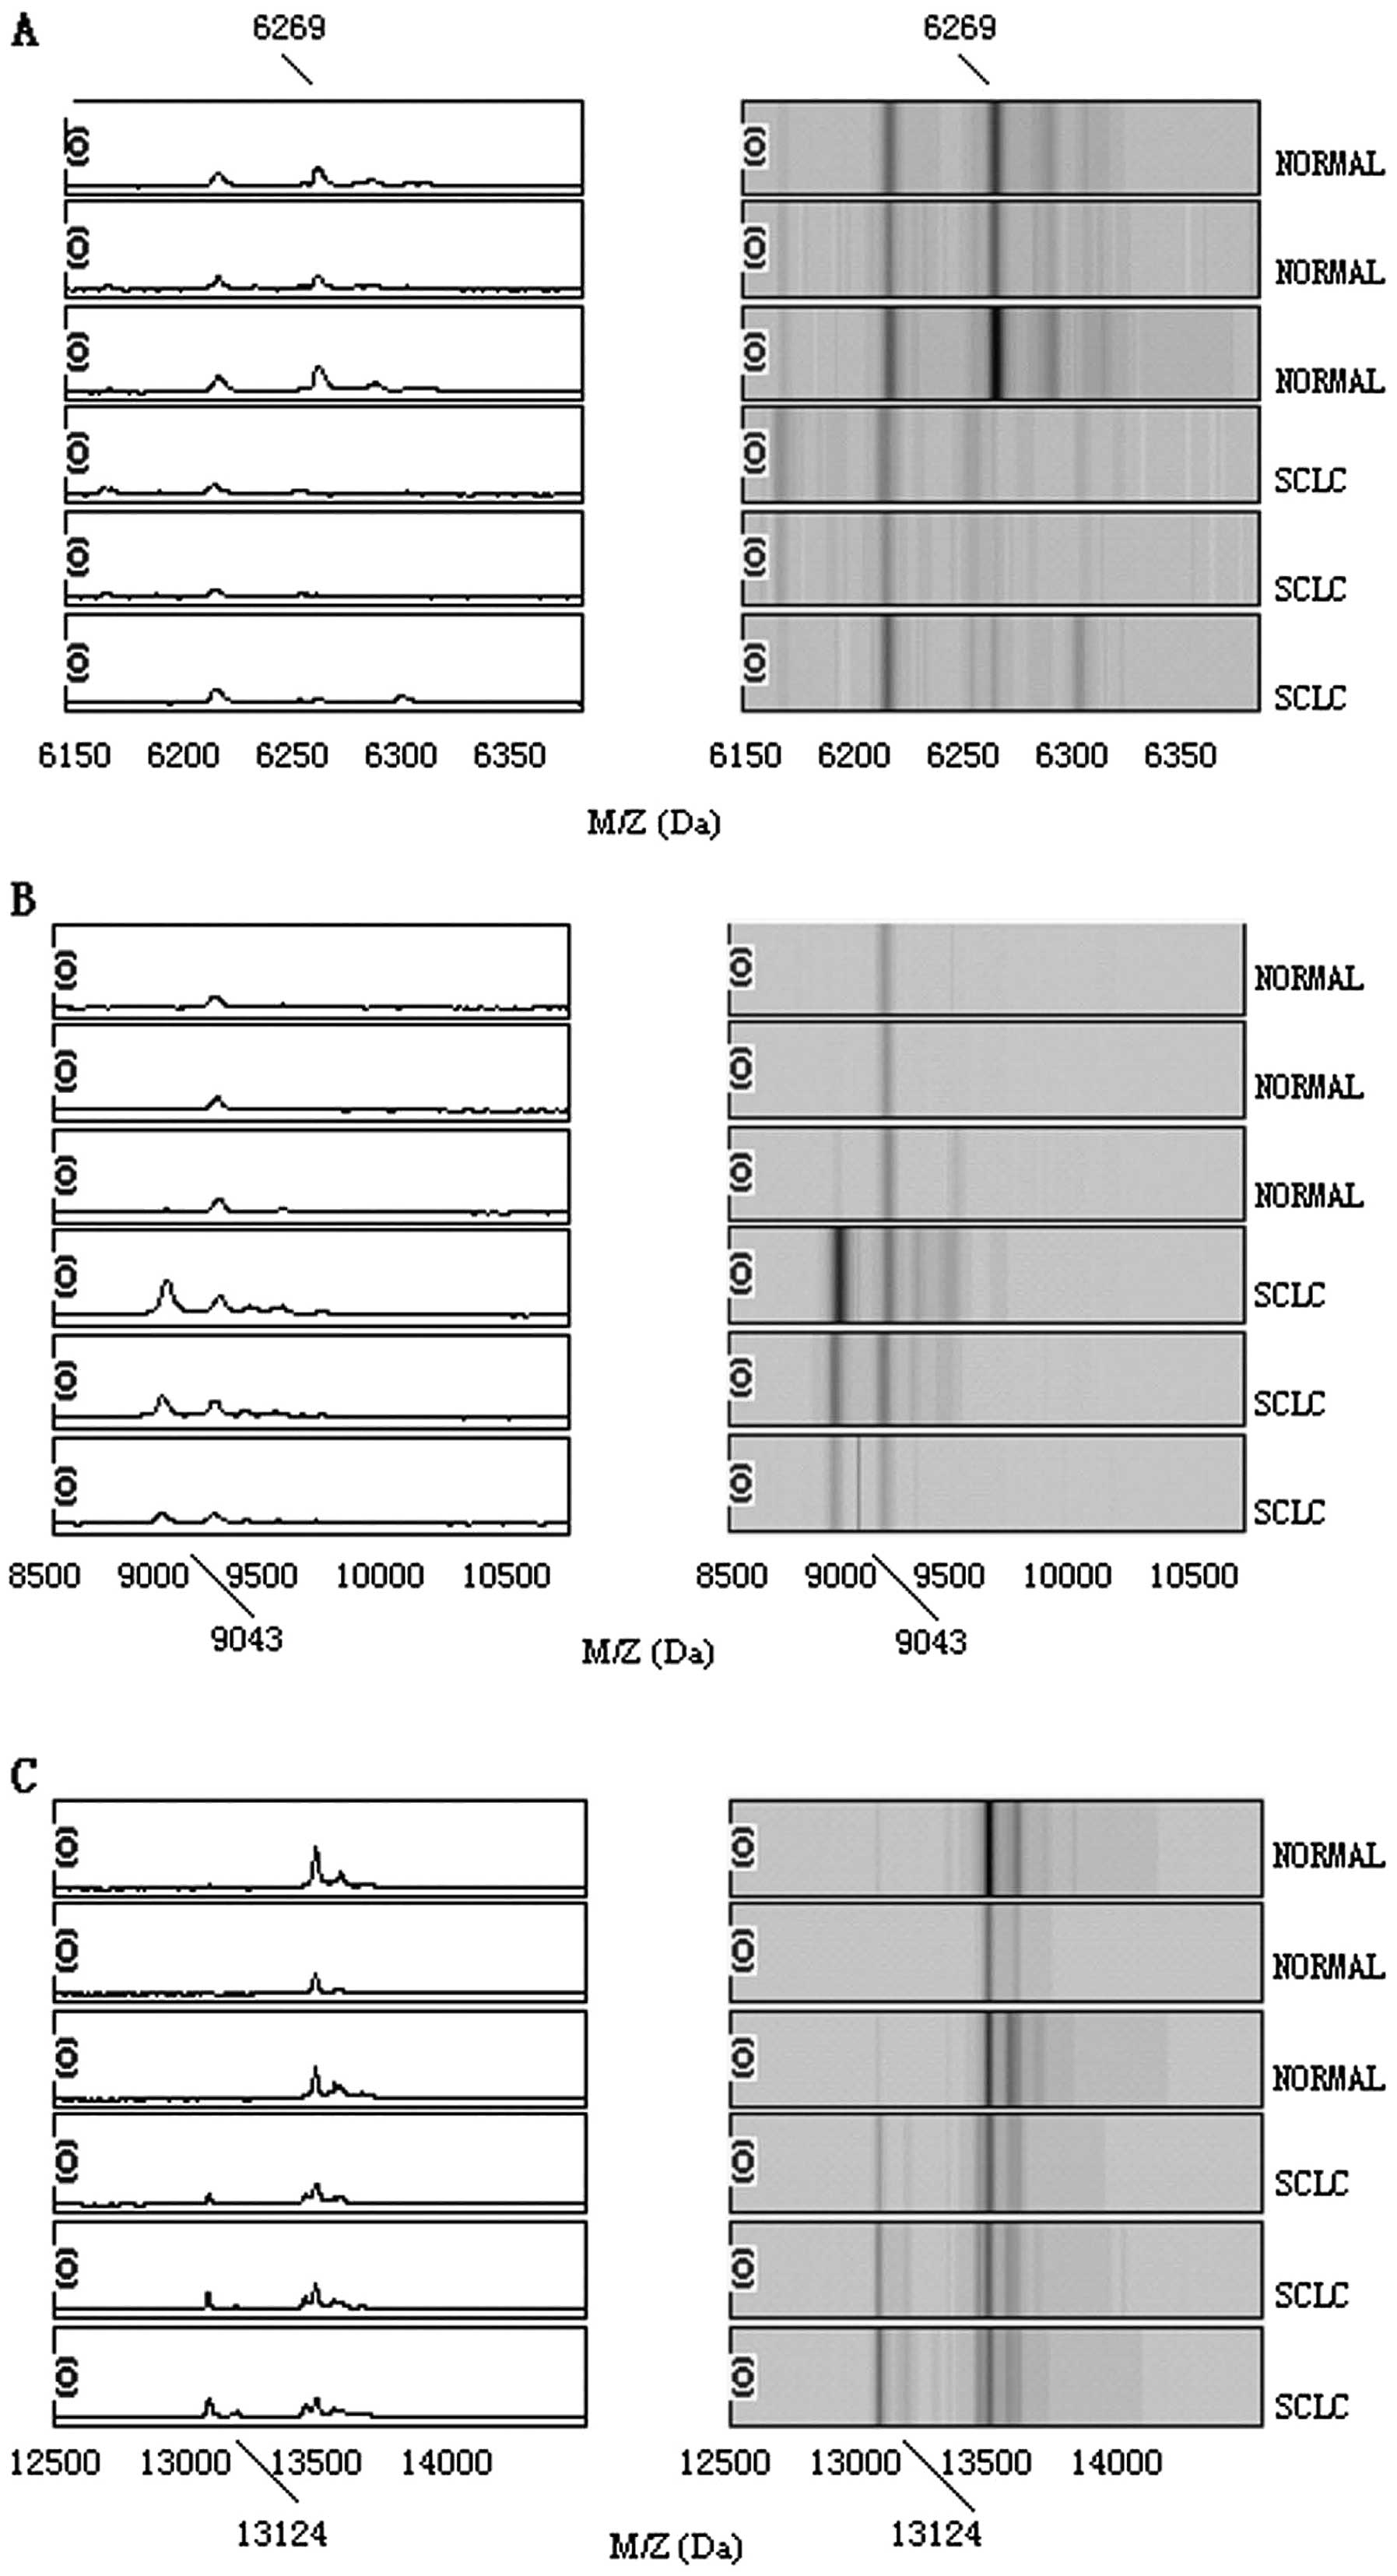
After noise filtering and peak cluster
identification, 108 mass peaks were detected in the training set.
These qualified peaks detected from the SCLC and healthy control
groups were ranked by ROC. The top 10 peaks with higher area under
curve values were selected, randomly combined, and fed into SVM.
The accuracy of each combination in distinguishing SCLC from
healthy control was analyzed, and the SVM model with the highest
accuracy was used as the diagnostic model. This model, comprised
three potential biomarkers with mass/charge (m/z) of 6269, 9043 and
13124 Da, respectively. The peaks with m/z of 9043 and 13124 Da
were highly expressed in SCLC but weakly expressed in healthy
people; the peaks with m/z of 6269 Da appeared to be expressed in a
contrasting way, as shown in Fig.
1. The descriptive statistics of these three peaks are shown in
Table I.
 | Table IThe descriptive statistics of 3
protein peaks in pattern distinguishing SCLC patients from HP. |
Table I
The descriptive statistics of 3
protein peaks in pattern distinguishing SCLC patients from HP.
| m/z | AUC | P-value
(×10−5) | HP | SCLC | Mean S/N of
healthy | Mean S/N of
cancer |
|---|
| 6269 | 0.86 | 0.02 | 11.77±4.98 | 4.09±2.24 | 12.03 | 3.88 |
| 9043 | 0.84 | 0.08 | 3.67±4.21 | 12.68±7.12 | 2.96 | 14.89 |
| 13124 | 0.77 | 0.11 | 2.95±2.33 | 7.87±3.29 | 2.64 | 6.12 |
The diagnostic model was trained with 72 samples and
tested with the remained 36 samples. Through the 10-fold
cross-validation SVM, the specificity is 96.4%, the sensitivity is
93.5% in the training set. By analyzing the blind serum samples, it
yielded a sensitivity of 92.4% and a specificity of 92.5% (Table II).
| Table IIThe predicted results of 10-fold
cross-validation SVM for distinguishing SCLC patients from HP. |
Table II
The predicted results of 10-fold
cross-validation SVM for distinguishing SCLC patients from HP.
| Training set
(72×10) | Test set (36×10) |
|---|
|
|
|
|---|
| SCLC | HP | SCLC | HP |
|---|
| SCLC (60×10) | 388 | 27 | 171 | 14 |
| HP (48×10) | 11 | 294 | 13 | 162 |
| Sensitivity (%) | 93.5
[388/(388+27)] | 92.4
[171/(171+14)] |
| Specificity (%) | 96.4
[294/(294+11)] | 92.5
[162/(162+13)] |
| Positive value
(%) | 97.2
[388/(388+11)] | 92.9
[171/(171+13)] |
Chemotherapy resistance and chemotherapy
response
Among the 60 patients enrolled in the study, 4
patients were found ineligible. Four patients underwent reduction
of the etoposide dose because of grade 4 neutropenia lasting for 3
days. For the 56 eligible patients, 4 had a complete response
(7.14%), 39 patients had a partial response (69.6%); 9 patients had
a stable disease (16.1%) and 4 patients had a progressive disease
(7.14%). There were 13 patients with resistance to chemotherapy and
43 patients with chemotherapy sensitivity.
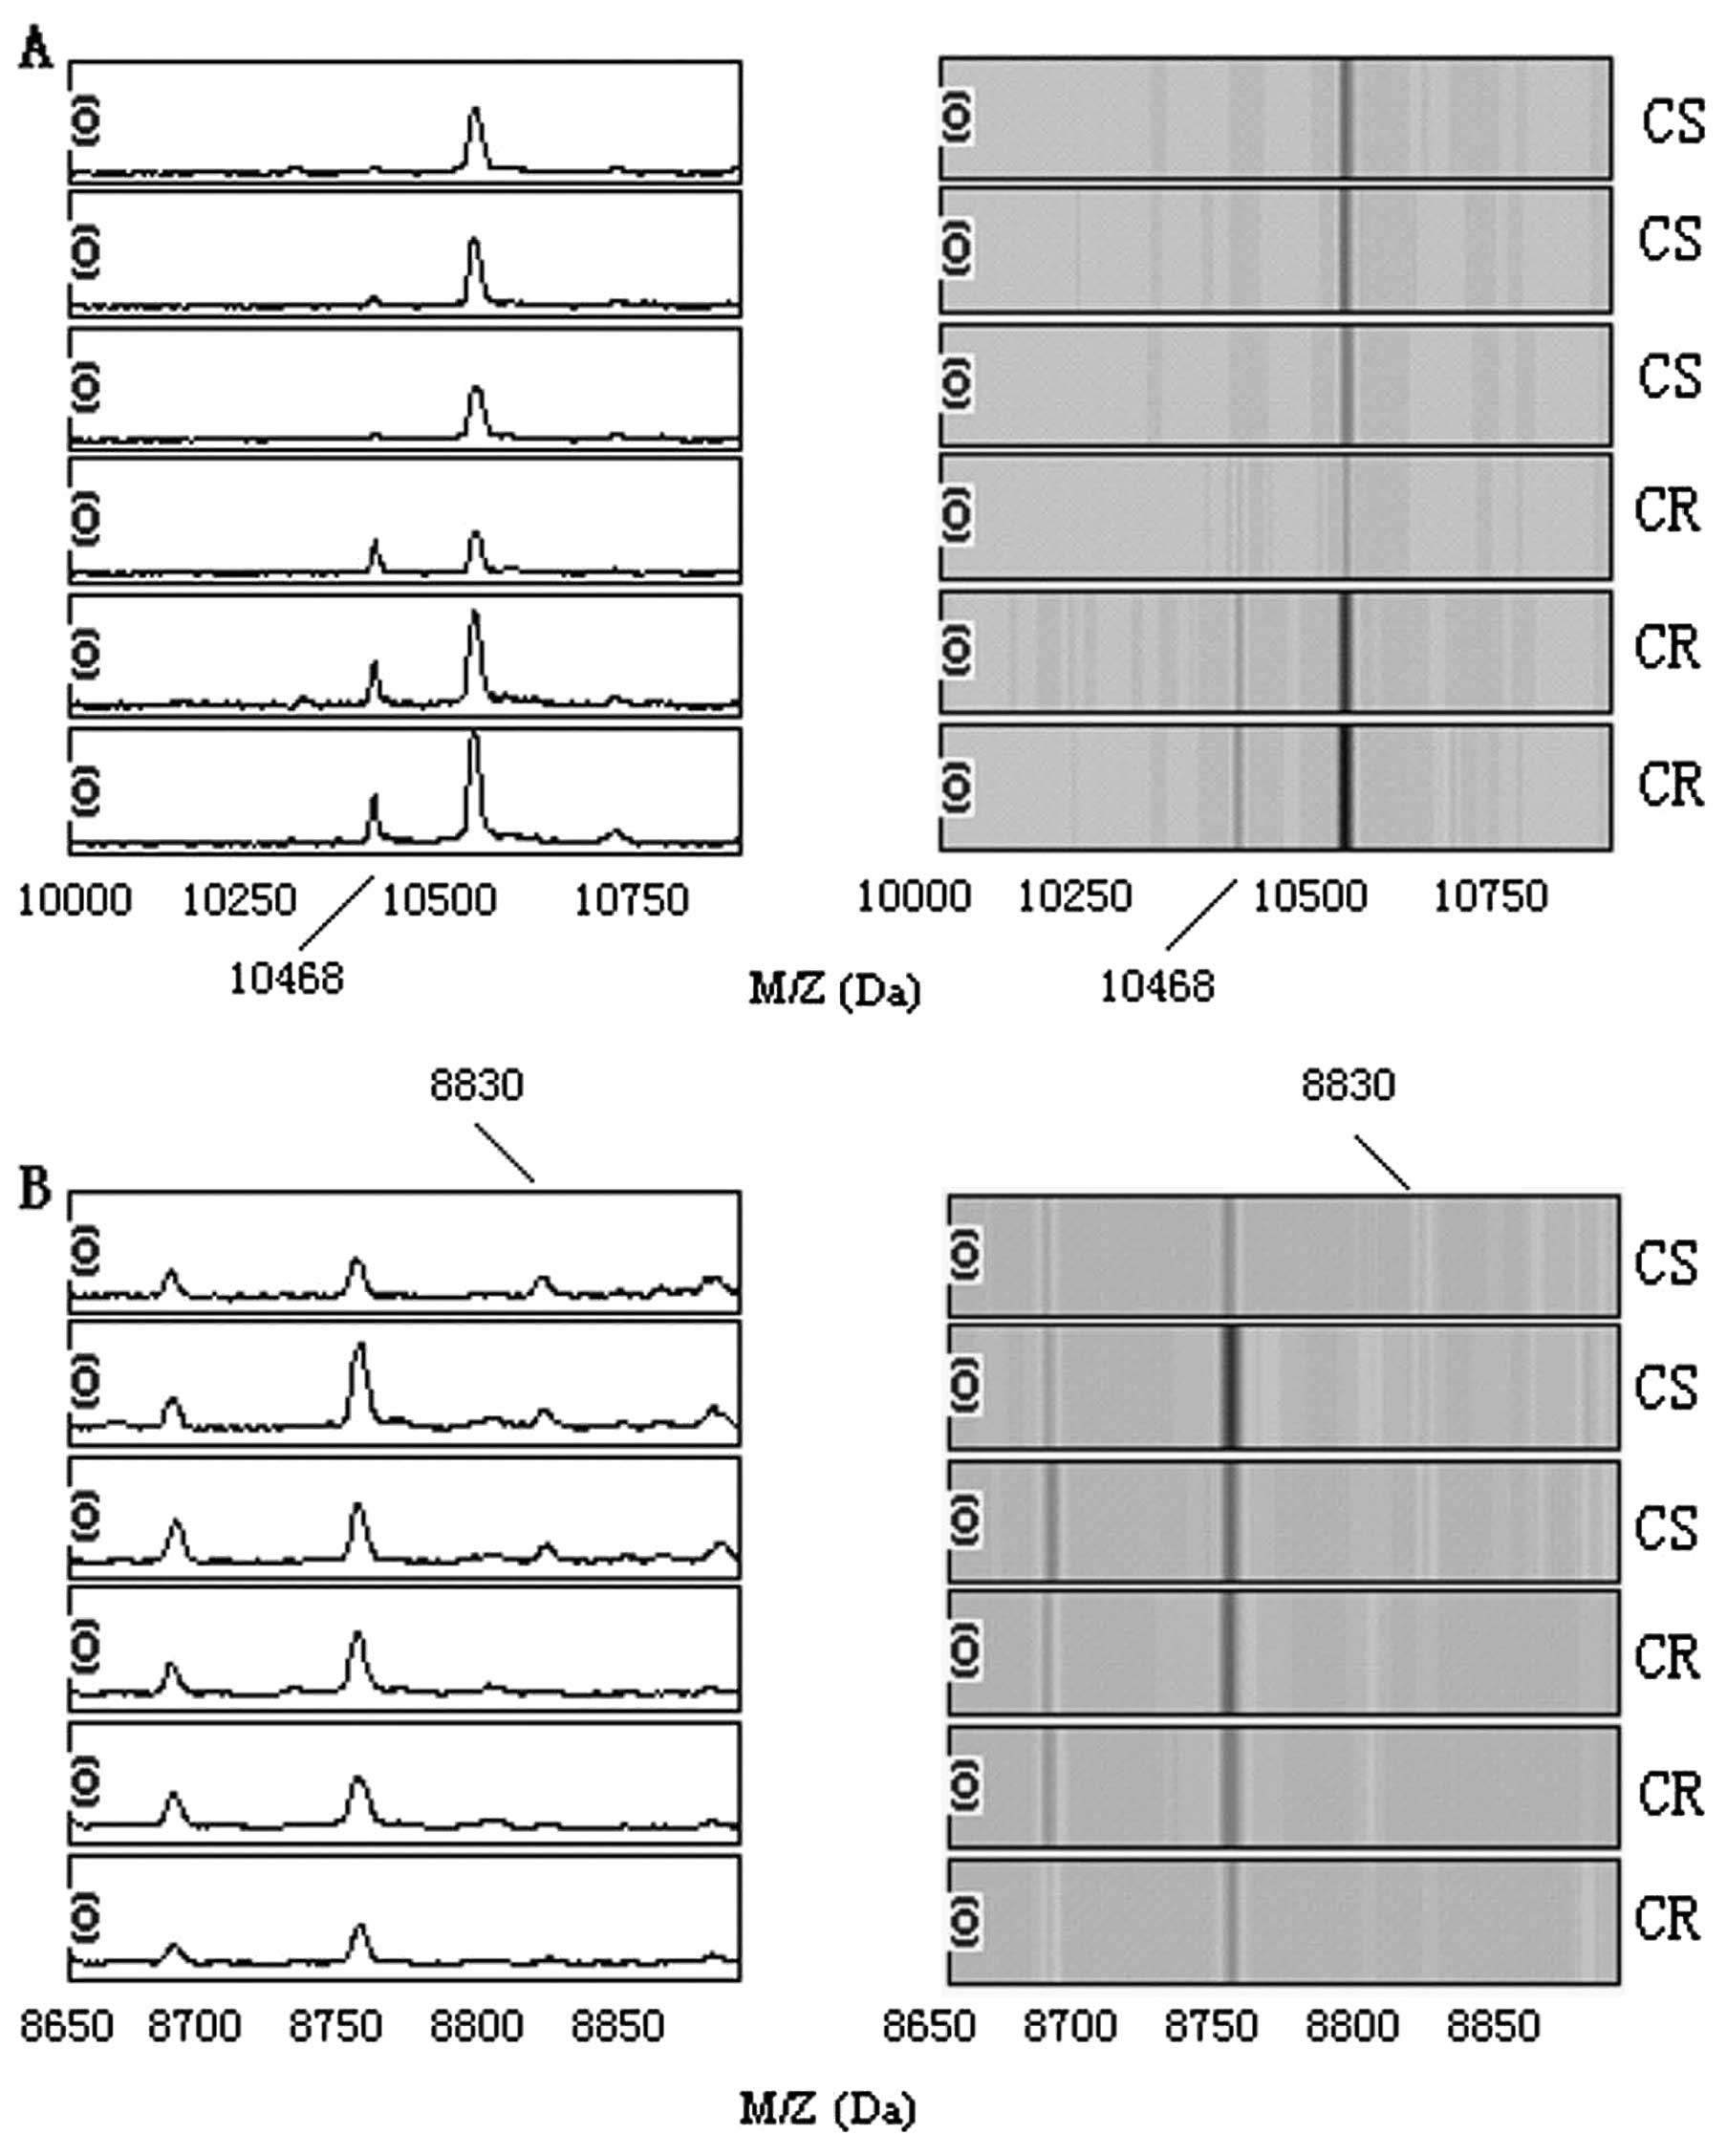
Serum SELDI profiles of resistant group vs.
sensitive group of SCLC chemotherapy. After noise filtering and
peak cluster identification, 102 mass peaks were detected from the
chemotherapy resistant group and chemotherapy sensitive group by
ROC. The top 10 peaks with higher area under curve values were
selected, randomly combined, and fed into the SVM. The accuracy of
each combination for distinguishing the chemotherapy resistant
group and chemotherapy sensitive group was analyzed. The SVM model
with the highest accuracy was used as the diagnostic model. This
model comprised two potential biomarkers with a m/z of 8830 and
10468 Da. The peaks with m/z of 10468 Da were highly expressed in
the chemotherapy resistant group but weakly expressed in the
chemotherapy sensitive group; the peaks with m/z of 8830 Da
appeared to be expressed in opposite ways (Fig. 2).
The construction and validation of
chemotherapy resistance predictive model
The predictive model was trained using 36 samples
and tested with the remaining 20 samples. Following the 10-fold
cross-validation SVM, the specificity was 75.0%, and the
sensitivity was 85.7% in the training set. In the blind test sets,
12 out of 15 chemotherapy sensitive group samples and 4 of 5
chemotherapy resistant group were correctly classified by analyzing
the blind serum samples. This yielded a sensitivity of 80.0%, and a
specificity of 80.0% (Table
III).
| Table IIIThe predicted results of patterns
distinguishing chemotherapy resistance from chemotherapy
sensitivity. |
Table III
The predicted results of patterns
distinguishing chemotherapy resistance from chemotherapy
sensitivity.
| Training set
(36) | Testing set (20) |
|---|
|
|
|
|---|
| CR | CS | CR | CS |
|---|
| CR (13) | 24 | 4 | 12 3 | |
| CS (43) | 2 | 6 | 1 | 4 |
| Sensitivity
(%) | 85.7
[24/(24+4)] | 80.0
[12/(12+3)] |
| Specificity
(%) | 75.0 [6/(6+2)] | 80.0 [4/(4+1)] |
Identification of S100A9
According to molecular weight and electric charge of
different protein peaks, the peaks identified were retrieved in
SWISS-PROT database (http://www.uniprot.org/) (20) for their identification. The protein
peak m/z 10468 Da was identified as protein S100-A9. To confirm
this, we performed western blot analysis and found that S100-A9 was
indeed at higher level in chemotherapy resistant group (Fig. 3).
Discussion
In this study, we used the integrated approach of
SELDI-TOF MS and SVM tools to analyze the large data of spectra. We
established a protein fingerprint pattern for SCLC with three
potential biomarkers, m/z at 6269, 9043 and 13124 Da to distinguish
SCLC from healthy controls. The specificity and the sensitivity of
this pattern were 92.5 and 92.4%, respectively. This result showed
that the selection of a combination of multiple proteins obtained
from SELDI may become a potential diagnostic approach. The peaks
with m/z of 9043 and 13124 Da were highly expressed in lung cancer
but weakly expressed in healthy people, so the two protein peaks
remain of interest to be further investigated.
The commonly used biomarkers for clinical diagnosis
and prognosis in patients with lung cancer today are
carcinoembryonic antigen (CEA), cytokeratin-19 fragments
(CYFRA-211), and NSE (21).
However, all these biomarkers have a poor positive predictive value
especially during the early-stage of lung cancer, and some
biomarkers are not specific to lung cancer. In light of the
multifactorial nature of cancer, it is very likely that a
combination of several markers will be necessary to improve the
detection and diagnosis of lung cancer. SELDI-TOF MS ProteinChip
technology is a new technique that allows multiple serum samples
obtained directly from patients to be analyzed in a relatively
short time (22). It is a
high-throughput approach used to generate protein expression
profiles, which in combination with bioinformatics tools to extract
information for biomarker discovery, has been essential in
identifying novel protein biomarkers.
As we hypothesized, changes in serum proteins will
occur after chemotherapy and such changes could be detected with
SELDI-TOF MS. In this study, we used the integrated approach of
SELDI-TOF MS and SVM tools to compare protein spectra of
chemotherapy resistant patients with chemotherapy sensitive
patients. We established a protein fingerprint patterns for
predictive chemotherapy resistant in SCLC patients. Two potential
biomarkers, m/z at 10468 and 8830 Da, were identified and
constructed a pattern to distinguish chemotherapy resistant
patients from chemotherapy sensitive patients. The specificity and
the sensitivity of this pattern were 80.0 and 80.0%, respectively.
This result showed that selection of a combination of multiple
proteins identified by from SELDI may become a potential predictive
approach.
Using SELDI-TOF MS profiling, we examined proteomic
changes in the serum of patients with SCLC before and after
chemotherapy. The peaks with m/z of 10468 Da were highly expressed
in the chemotherapy resistant group, but weakly expressed in the
chemotherapy sensitive group. Thus, the protein peak may be
chemotherapy resistant protein and of interest for further
investigation. The peaks with m/z of 8830 Da were highly expressed
in the chemotherapy sensitive group, but weakly expressed in the
chemotherapy resistant group. The presence of the protein peak
suggests that the protein may represent a cytotoxic therapy induced
response that may originate from the carcinoma itself or be a host
response to cytotoxic therapy.
The protein peak m/z 10468 Da was identified as
protein S100-A9, and further confirmed by western blot analysis,
S100 protein family consists of at least 24 members, and are small
Ca21 binding proteins that participate in many cellular functions
including tumor growth (23).
Protein S100-A9 (S100A9), was suggested to be a marker for
pancreatic cancer, inflammatory bowel disease, lung adenocarcinoma
and breast cancer (24). Our
results suggested that the protein S100-A9 may be not only a tumor
marker but also for the chemotherapy resistance in SCLC.
One of the challenges in the analysis of SELDI-TOF
MS generated data is to reduce the false protein peaks, in which
the discriminatory power is due to random variation (25). The SVM classification technique used
in the study is a sophisticated machine learning method based on
the statistical theory. The SVM can solve problems such as the
generalization of the medium and small samples in pattern
recognition, pattern selection, and over-fitting (26–30).
In this study, we instituted various preventive
measures to avoid generation of biased results caused by artifacts
related to the nature of the clinical samples. All serum samples
were collected and processed within the same clinical and
laboratory settings. To avoid variation in the procedure, freshly
collected sera were immediately aliquoted, stored at -80°C, and
thawed only once. Standard protocols must be developed to minimize
unwanted fluctuation, and CVs between proteinchips must be
calculated by using common peaks across different spectra. The use
of paired serum samples from individual patients in the study
removed most of genetic and environmental variables and made it
likely that the changes in protein profile reflected the disease
state more exactly. We also used quality control serum to allow
detection of any unusual features during the process. Such
precautions led to very good reproducibility of the protein peak
patterns.
In conclusion, we have shown that using proteomics
approaches in combination with bioinformatics tools could
distinguish small cell lung cancer patients from healthy controls
with relatively high sensitivity and specificity. The combination
of SELDI-TOF MS with SVM could identify new potential tumor markers
for chemotherapy resistant. Further research is needed to elucidate
the sequence of the interesting peptides identified in our current
study, and to confirm our current findings in larger cohorts of
study samples.
Acknowledgements
This study was supported by General Programs of
Natural Science Foundation of Shandong Province (No.BS2009SW050)
and Key Development Program for Basic Research of Shandong Province
(2007GG20002007).
Abbreviations:
|
CR
|
complete response
|
|
CV
|
coefficient of variance
|
|
m/z
|
mass/charge
|
|
ROC
|
receive option curve
|
|
SELDI-TOF MS
|
surface-enhanced laser
desorption/ionization time-of-flight mass spectrometry
|
|
SVM
|
support vector machine
|
|
UDWT
|
undecimated discrete wavelet
transform
|
References
|
1
|
Siegel R, Ward E, Brawley O and Jemal A:
Cancer statistics, 2011: the impact of eliminating socioeconomic
and racial disparities on premature cancer deaths. CA Cancer J
Clin. 61:212–236. 2011. View Article : Google Scholar : PubMed/NCBI
|
|
2
|
Gaspar LE, McNamara EJ, Gay EG, Putnam JB,
Crawford J, Herbst RS and Bonner JA: Small cell lung cancer:
Prognostic factors and changing treatment over 15 years. Clin Lung
Cancer. 13:115–122. 2011.PubMed/NCBI
|
|
3
|
Neal JW, Gubens MA and Wakelee HA: Current
management of small cell lung cancer. Clin Chest Med. 32:853–863.
2011. View Article : Google Scholar : PubMed/NCBI
|
|
4
|
Guo H, Deng Q, Wu C, et al: Variations in
HSPA1B at 6p21.3 are associated with lung cancer risk and prognosis
in Chinese populations. Cancer Res. 71:7576–7581. 2011. View Article : Google Scholar : PubMed/NCBI
|
|
5
|
Szkorupa M, Klein J, Bohanes T, Neoral C,
Kolek V and Grygárková I: Neoadjuvant chemotherapy and surgical
treatment in advanced stages of non-small cell lung cancer. Rozhl
Chiv. 90:433–439. 2011.PubMed/NCBI
|
|
6
|
Zeng HZ, Qu YQ, Liang AB, et al:
Expression of CD147 in advanced non-small cell lung cancer
correlated with cisplatin-based chemotherapy resistance. Neoplasma.
58:449–454. 2011. View Article : Google Scholar : PubMed/NCBI
|
|
7
|
Titulaer MK, Siccama I, Dekker LJ, van
Rijswijk AL, Heeren RM, Sillevis Smitt PA and Luider TM: A database
application for pre-processing, storage and comparison of mass
spectra derived from patients and controls. BMC Bioinformatics.
7:4032006. View Article : Google Scholar : PubMed/NCBI
|
|
8
|
Jemal A, Murray T, Samuels A, Ghafoor A,
Ward E and Thun MJ: Cancer statistics, 2003. CA Cancer J Clin.
53:5–26. 2003. View Article : Google Scholar
|
|
9
|
Engwegen JY, Gast MC, Schellens JH and
Beijnen JH: Clinical proteomics: searching for better tumour
markers with SELDI-TOF mass spectrometry. Trends Pharmacol Sci.
27:251–259. 2006. View Article : Google Scholar : PubMed/NCBI
|
|
10
|
Mosley K, Tam FW, Edwards RJ, Crozier J,
Pusey CD and Lightstone L: Urinary proteomic profiles distinguish
between active and inactive lupus nephritis. Rheumatology.
45:1497–1504. 2006. View Article : Google Scholar : PubMed/NCBI
|
|
11
|
Tomosugi N, Kitagama K, Takahashi N, Sugai
S and Ishikawa I: Diagnostic potential of tear proteome patterns in
Sjögren’s syndrome. J Proteome Res. 4:820–825. 2005.
|
|
12
|
Yu Y, Chen S, Wang LS, et al: Prediction
of pancreatic cancer by serum biomarkers using surface-enhanced
laser desorption/ionization-based decision tree classification.
Oncology. 68:79–86. 2005. View Article : Google Scholar
|
|
13
|
Koopmann J, Zhang Z, White N, et al: Serum
diagnosis of pancreatic adenocarcinoma using surface-enhanced laser
desorption and ionization mass spectrometry. Clin Cancer Res.
10:860–868. 2004. View Article : Google Scholar : PubMed/NCBI
|
|
14
|
Merchant M and Weinberger SR: Recent
advancements in surface enhanced Iaser desorption ionization-time
of fIight-mass spectrometry. Electrophoresis. 21:1164–1177. 2000.
View Article : Google Scholar : PubMed/NCBI
|
|
15
|
World Health Organization. WHO handbook
for reporting results of cancer treatment. World Health
Organization; Geneva: WHO Offset Publication No 48. 1979
|
|
16
|
Japan Lung Cancer Society. Classification
of lung cancer. 1st edition. Kanehara & Co., Ltd; Tokyo: pp.
49–52. 2000
|
|
17
|
Li J, Zhang Z, Rosenzweig J, Wang YY and
Chan DW: Proteomics and bioinformatics approaches for
identification of serum biomarkers to detect breast cancer. Clin
Chem. 48:1296–1304. 2002.PubMed/NCBI
|
|
18
|
Liu Y: Active learning with support vector
machine applied to gene expression data for cancer classification.
J Chem Inf Comput Sci. 44:1936–1941. 2004. View Article : Google Scholar : PubMed/NCBI
|
|
19
|
Lin HH, Han LY, Cai CZ, Ji ZL and Chen YZ:
Prediction of transporter family from protein sequence by support
vector machine approach. Proteins. 62:218–231. 2006. View Article : Google Scholar : PubMed/NCBI
|
|
20
|
UniProt Consortium. The universial protein
resource (Uniprot) in 2010. Nucleic Acids Res. 38:D142–D148.
2010.PubMed/NCBI
|
|
21
|
Lee JH and Chang JH: Diagnostic utility of
serum and pleural fluid carcinoembryonic antigen, neuron specific
enolase and cytokeratin 19 fragments in patients with effusion from
primary lung cancer. Chest. 128:2298–2303. 2005. View Article : Google Scholar
|
|
22
|
Seibert V, Wiesner A, Buschmann T and
Meuer J: Surface-enhanced l aserdesorption ionization
time-of-flight mass spectrometry (SELDI TOF-MS) and ProteinChip
technology in proteomics research. Pathol Res Pract. 200:83–94.
2004. View Article : Google Scholar : PubMed/NCBI
|
|
23
|
Kawai H, Minamiya Y and Takahashi N:
Prognostic impact of S100A9 overexpression in non-small cell lung
cancer. Tumor Biol. 32:641–646. 2011. View Article : Google Scholar : PubMed/NCBI
|
|
24
|
Yang WS, Moon HG, Kim HS, Choi EJ, Yu MH,
Noh DY and Lee C: Proteomic approach reveals FKBP4 and S100A9 as
potential prediction markers of therapeutic response to neoadjuvant
chemotherapy in patients with breast cancer. J Proteome Res.
11:1078–1088. 2012. View Article : Google Scholar
|
|
25
|
Petricoin EF and Liotta LA:
SELDI-TOF-based serum proteomic pattern diagnostics for early
detection of cancer. Curr Opin Biotechnol. 5:24–30. 2004.
View Article : Google Scholar : PubMed/NCBI
|
|
26
|
Somorjai RL, Dolenko B and Baumgartner R:
Class prediction and discovery using gene microarray and proteomics
mass spectroscopy data: curses, caveats, cautions. Bioinformatics.
19:1481–1491. 2003. View Article : Google Scholar : PubMed/NCBI
|
|
27
|
Furey TS, Cristianini N, Duffy N,
Bednarski DW, Schummer M and Haussler D: Support vector machine
classification and validation of cancer tissue samples using
microarray expression data. Bioinformatics. 16:906–914. 2000.
View Article : Google Scholar : PubMed/NCBI
|
|
28
|
Byvatov E and Schneider G: Support vector
machine applications in bioinformatics. Appl Bioinformatics.
2:67–77. 2003.
|
|
29
|
Jorissen RN and Gilson MK: Virtual
screening of molecular databases using a support vector machine. J
Chem Inf Model. 45:549–561. 2005. View Article : Google Scholar : PubMed/NCBI
|
|
30
|
Wiesner A: Detection of tumor markers with
proteinChip technology. Curr Pharm Biotechnol. 15:45–67. 2004.
View Article : Google Scholar : PubMed/NCBI
|