Introduction
Due to the increasing incidence of malignant tumors
year after year, identification of potential antitumor drugs from
natural products has become more important. Marine environments,
especially the deep sea surroundings, have their unique features,
such as darkness, high salt, high pressure, low temperature and
rare nutrition (1). Microorganisms
living under those circumstances may develop unique metabolic
pathways or defense mechanisms, which may relate to novel compounds
with new structures and diverse bioactivity. Considering the
incremental rediscovery of known compounds from terrestrial
resources (2), more and more
researchers have turned their attention to the marine environment
for developing antitumor compounds (3). Gautschi et al (4) identified three compounds (anserinones
A, B and (+)-formylanserinone B) from Penicillium
corylophilum isolated from 1335 m deep sea sediments and those
three compounds showed a good cytotoxic effect on the tumor cell
line MDA-MB-435 (respective IC50 2.2, 3.6 and 2.9
μg/ml). Li et al (5)
separated three antitumor compounds (oxosorbiquinol,
dihydrooxosorbiquinol and trisorbicillinone A) from
Phialocephala sp. FL30r isolated from 5059 m deep sea
sediments. Du et al (6)
characterized two new meleagrin analogs (meleagrin D and E) which
showed weak cytotoxicity against A549 cell line from a deep ocean
sediment derived fungus Penicillium sp.
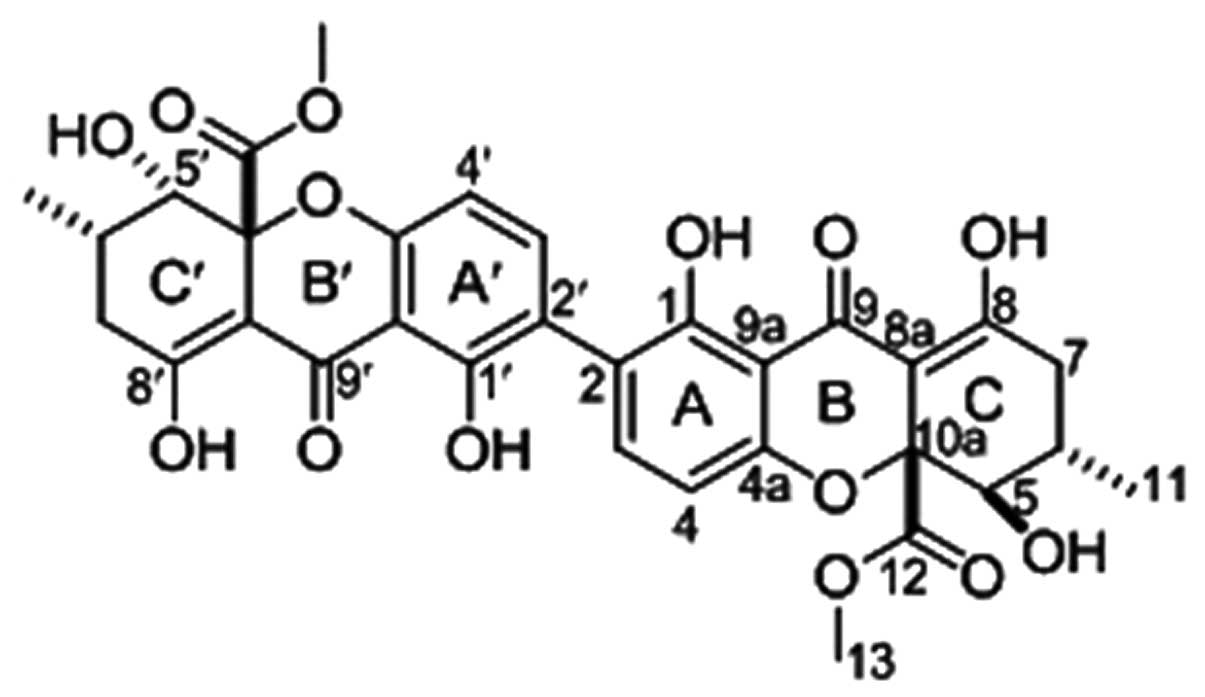
Recently, we separated secalonic acid F (SAF)
(Fig. 1) and two new compounds
penicillone A and penicillactam from fungus Penicillium sp.
F11 isolated from deep sea sediments at the depth of 1744 m in the
Southwest Pacific (7). Unlike
secalonic acid D (SAD), the isomeric compound of SAF, the cytotoxic
activity and related mechanism of which have been studied (8–11),
there is little information on the cytotoxic mechanism of SAF. In
this study, cytotoxic effect evaluation and differential proteomic
analysis of HL60 cells treated with SAF were conducted in order to
preliminarily elucidate the mechanism of its cytotoxicity in HL60
cells.
Materials and methods
Chemicals and reagents
SAF was separated from the deep sea originated
fungus Penicillium sp. F11. The HL60 cell line was purchased
from the China Center for Type Culture Collection (CCTCC). The Cell
Counting Kit-8 (CCK-8) was purchased from Dojindo Molecular
Technologies (Japan). The Annexin V-FLUOS/PI staining kit was
purchased from Roche Diagnostics GmbH (Germany). Anti-mouse RhoGDI
2 (3E6), anti-mouse RhoGDI 2 (2D7), anti-mouse β-actin (C4),
peroxidase-conjugated secondary antibodies were purchased from
Santa Cruz Biotechnology (USA). Anti-mouse caspase 3 antibody and
the caspase 3 inhibitor Ac-DEVD-CHO were purchased from Beyotime
Biotechnology (China).
CCK-8 assay
The cytotoxicity assay was carried out according to
the instructions of the CCK-8 kit. Briefly, SAF at concentrations
of 1.56, 3.12, 6.25, 12.5 or 25 μg/ml were added into the
culture medium containing 105/ml HL60 cells and
incubated for 24, 48 and 72 h. Then, 10 μl of CCK-8 solution
was added into each well of the 96-well plate, followed by
incubation for 2 h and measurement of the absorbance at 450 nm
using a microplate reader (Bio-Rad, USA). The inhibition rate was
(A control - A treated)/A control × 100. The
IC50 was taken as the concentration at which it caused
50% inhibition of cell proliferation (50% reduction in the
absorbance value in the treated cells, in respect to the
control).
Annexin V-FLUOS/PI assay
The apoptosis rate was quantified by detecting the
surface exposure of phosphatidyl-serine in apoptotic cells using
the Annexin V-FLUOS/PI staining kit according to the manufacturer’s
instructions. Briefly, after being treated with 4 μg/ml SAF
for 24 and 48 h, HL60 cells were collected and washed twice with
cold PBS. Cells (106) were resuspended with 100
μl Annexin V-FLUOS labeling solution and incubated for 15
min at 25°C in the dark. The number of viable, apoptotic and
necrotic cells were quantified by a flow cytometer
(Becton-Dickinson, USA) and analysis by the CellQuest software.
Around 105 cells were analyzed for each sample. The
apoptosis rate (%) was calculated as (the number of apoptotic
cells/the number of total cells observed) × 100%.
Sample preparation for 2-DE
HL60 cells treated with 4 μg/ml SAF or DMSO
as a control were harvested and washed three times with cold PBS.
The washed cells were centrifuged at 1000 rpm for 5 min, then the
pellet was treated with lysis buffer [9 mol/l urea, 2 mol/l
thiourea, 4% (w/v) CHAPS, 50 mM DTT, 5 mM PMSF, 2% ampholytes (pH
3–10)] and incubated at 37°C for 1 h. After centrifugation at 50000
g for 30 min, the supernatant was harvested and the protein
concentration was determined by 2-D Quant Kit (Amersham
Biosciences, USA). The protein lysate was stored at −80°C until
usage.
2-DE and image analysis
Protein samples (200 μg) were mixed with
rehydration buffer [7 mol/l urea, 2 mol/l thiourea, 4% (w/v) CHAPS,
0.2% ampholytes (pH 3–10), 50 mM/l DTT, and a trace of bromophenol
blue]. IEF was carried out with 24 cm immobilized pH gradient
strips (pH 3–10, non-linear gradient; Amersham Biosciences) in the
IPGphor (Amersham Biosciences) for 58000 Volt-h. After focusing,
strips were equilibrated in buffer A [50 mM/l Tris-HCl (pH 8.8), 6
mol/l urea, 30% (v/v) glycerol, 2% (wt/v) SDS, 10 mg/ml DTT] for 15
min, and then in buffer B [50 mM/l Tris-HCl (pH 8.8), 6 mol/l urea,
30% (v/v) glycerol, 2% (w/v) SDS, 25 mg/ml iodoacetamide] for 15
min. The second-dimension electrophoresis was carried out at a
constant current of 15 mA/gel for about 9 h using the Ettan™
DALTsix Electrophoresis Unit (Amersham Biosciences) and a MultiTemp
III Thermostatic Circulator (Amersham Biosciences) at 25°C using
the 12% polyacrylamide separation gel. Gels were then stained with
a protein silver stain kit (Bio-Rad) according to the protocol. Gel
image densitometric analysis was performed using the software
PDQuest 8 (Bio-Rad). The intensity of each spot was normalized by
total valid spot volume and reported as relative value (in ppm).
Protein spots were detected automatically and then modified by
manual operation. Only 2-fold differentially expressed spots with
statistically significant differences (P<0.05) were chosen for
further mass spectrometric analysis.
In-gel digestion and MALDI-TOF MS
analysis
In-gel digestion and peptide extraction were
performed as previously described (12). Protein spots were excised manually
and destained at 50°C using 200 μl destaining solution
(0.016 g/ml sodium thiosulfate, 0.01 g/ml potassium ferricyanide)
and washed with water for three times. The gel pieces were
dehydrated in 100% acetonitrile and dried in a vacuum centrifuge,
then swollen in 3 μl trypsin solution (3 ng/μl) and
incubated at 50°C for 2 h. The mass spectrum was performed on the
MALDI-TOF-TOF 5800 mass spectrometer (Applied Biosystems). Protein
database searching was performed with the MASCOT search engine
(http://www.matrix-science.com) using
mono-isotopic peaks against the NCBI non-redundant protein database
(12). Mass tolerance was allowed
within 0.05%. Proteins with the protein score CI >95% were
considered as credible results.
Western blot analysis
The basic methods of western blotting followed that
of Towbin et al (13).
Briefly, proteins were separated by electrophoresis on 12%
polyacrylamide gels, transferred to PVDF membranes (Millipore, USA)
and incubated with anti-mouse caspase 3, anti-mouse RhoGDI 2 (3E6),
anti-mouse RhoGDI 2 (2D7) and anti-mouse β-actin (C4). After the
antibodies reacted with the peroxidase-conjugated secondary
antibody, results were visualized on Kodak films by using ECL plus
reagents (Millipore).
Caspase 3 inhibitor assay
HL60 cells (105/well) were incubated in
96-well plates overnight. The caspase 3 inhibitor Ac-DEVD-CHO (20
μM) was added 30 min before SAF (4 μg/ml) in a final
volume of 100 μl and incubated for different times (12, 24,
36, 48 and 72 h). HL60 cells treated with SAF (4 μg/ml) only
were used as control. Then the proliferation inhibition effects of
HL60 cells were measured by the CCK-8 assay.
Statistical analysis
Statistical analysis was performed using the
SigmaPlot version 10.0 for Windows (Systat Software) and
statistical differences were determined using the Student’s t-test.
P-values <0.05 was considered as statistically significant. Data
were presented as the mean ± SD of at least triplicate
determinations.
Results
SAF inhibited HL60 cell
proliferation
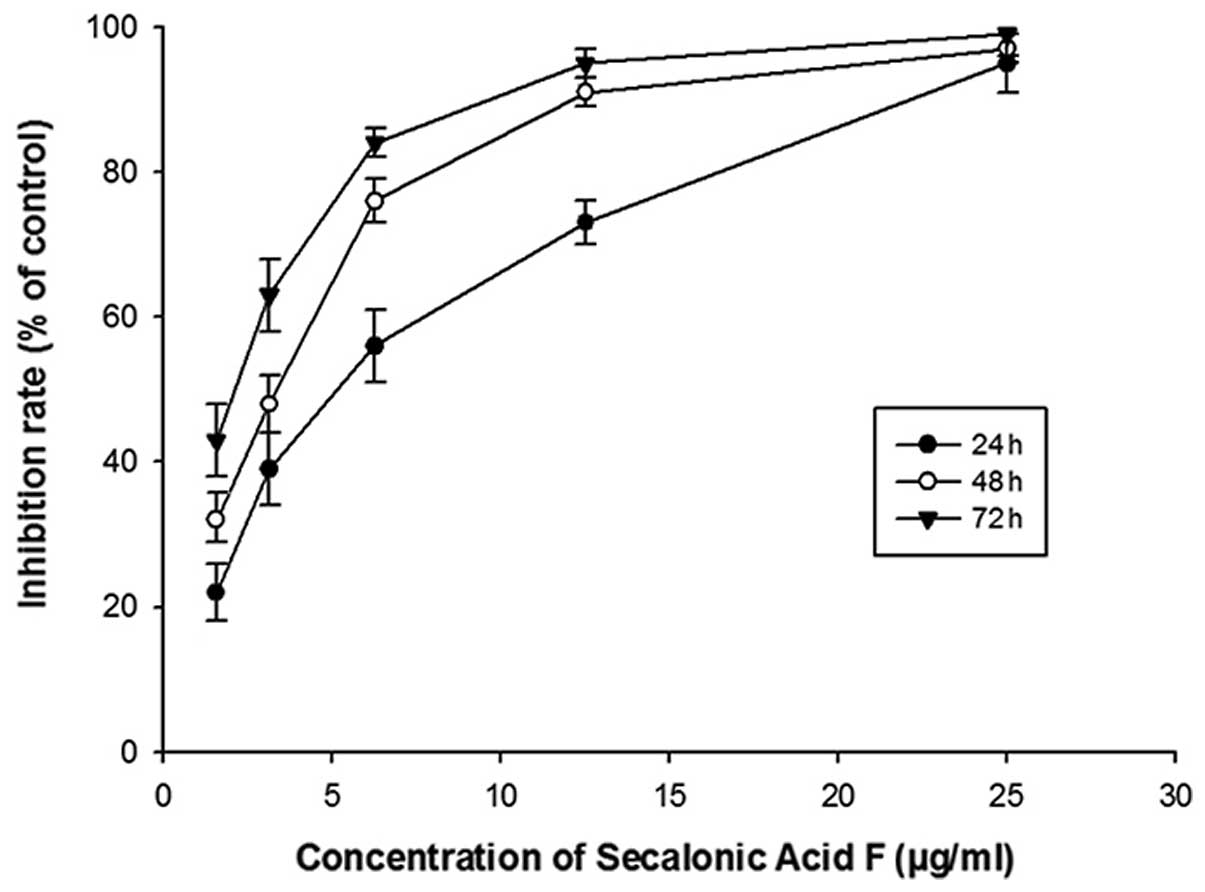
The dose and time effects of SAF on HL60 cell
proliferation were tested by the CCK-8 methods. The results
indicated that along with the SAF concentration increasing, the
inhibition rate gradually increased. Meanwhile, the inhibition rate
of SAF in HL60 cells increased progressively with the incubation
period extension at the same concentration (Fig. 2). The inhibitory effect of SAF (5
μg/ml) was apparent and achieved the ~50% inhibition rate
after 24-h treatment. SAF (5 μg/ml) incubation for 48 and 72
h resulted in inhibition rates of ~70% and ~90%, respectively. The
50% inhibition concentration (IC50) of SAF in HL60 cells
was 4.1±0.16 μg/ml after incubation for 48 h. Thus, 4
μg/ml SAF was chosen for subsequent experiments.
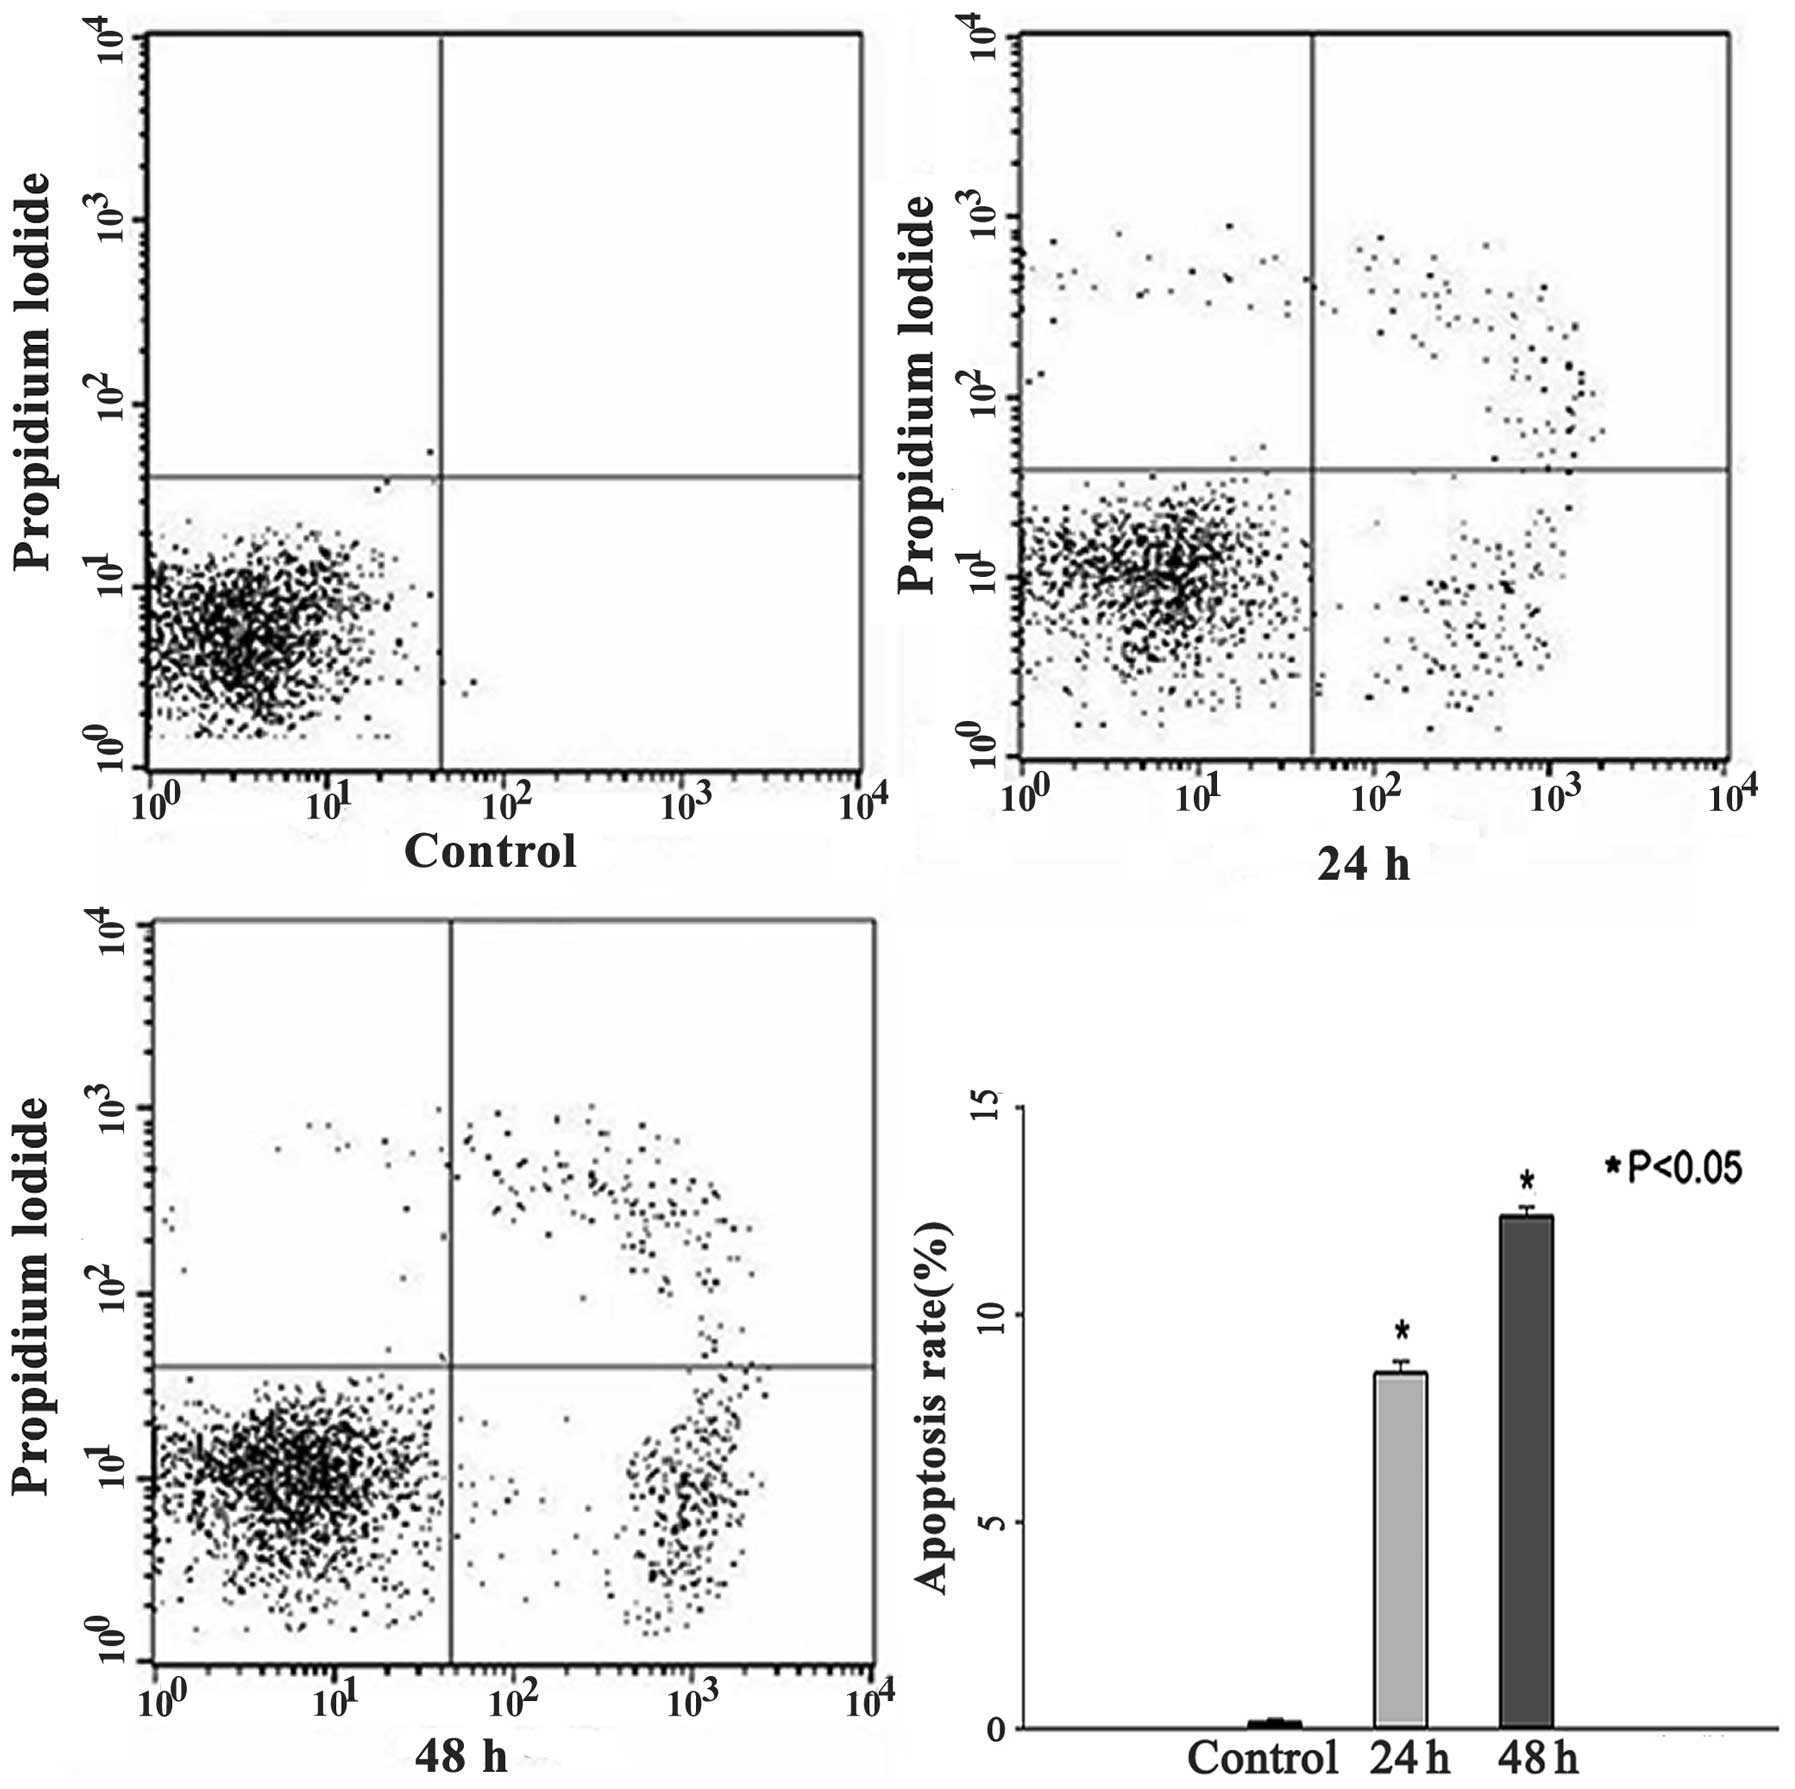
SAF induced HL60 cell apoptosis
To clarify whether SAF induces cell apoptosis in
HL60 cells, the cells were exposed to Annexin V-FLUOS and propidium
iodide double staining and flow cytometry assay after treating with
4 μg/ml SAF for 0, 24 and 48 h. The results showed that
apoptosis rates were 0.15±0.08%, 8.58±0.29% and 12.37±0.22%,
respectively. (Fig. 3). The
apoptosis rate was significantly increased in the 24 and 48 h
groups (P<0.05).
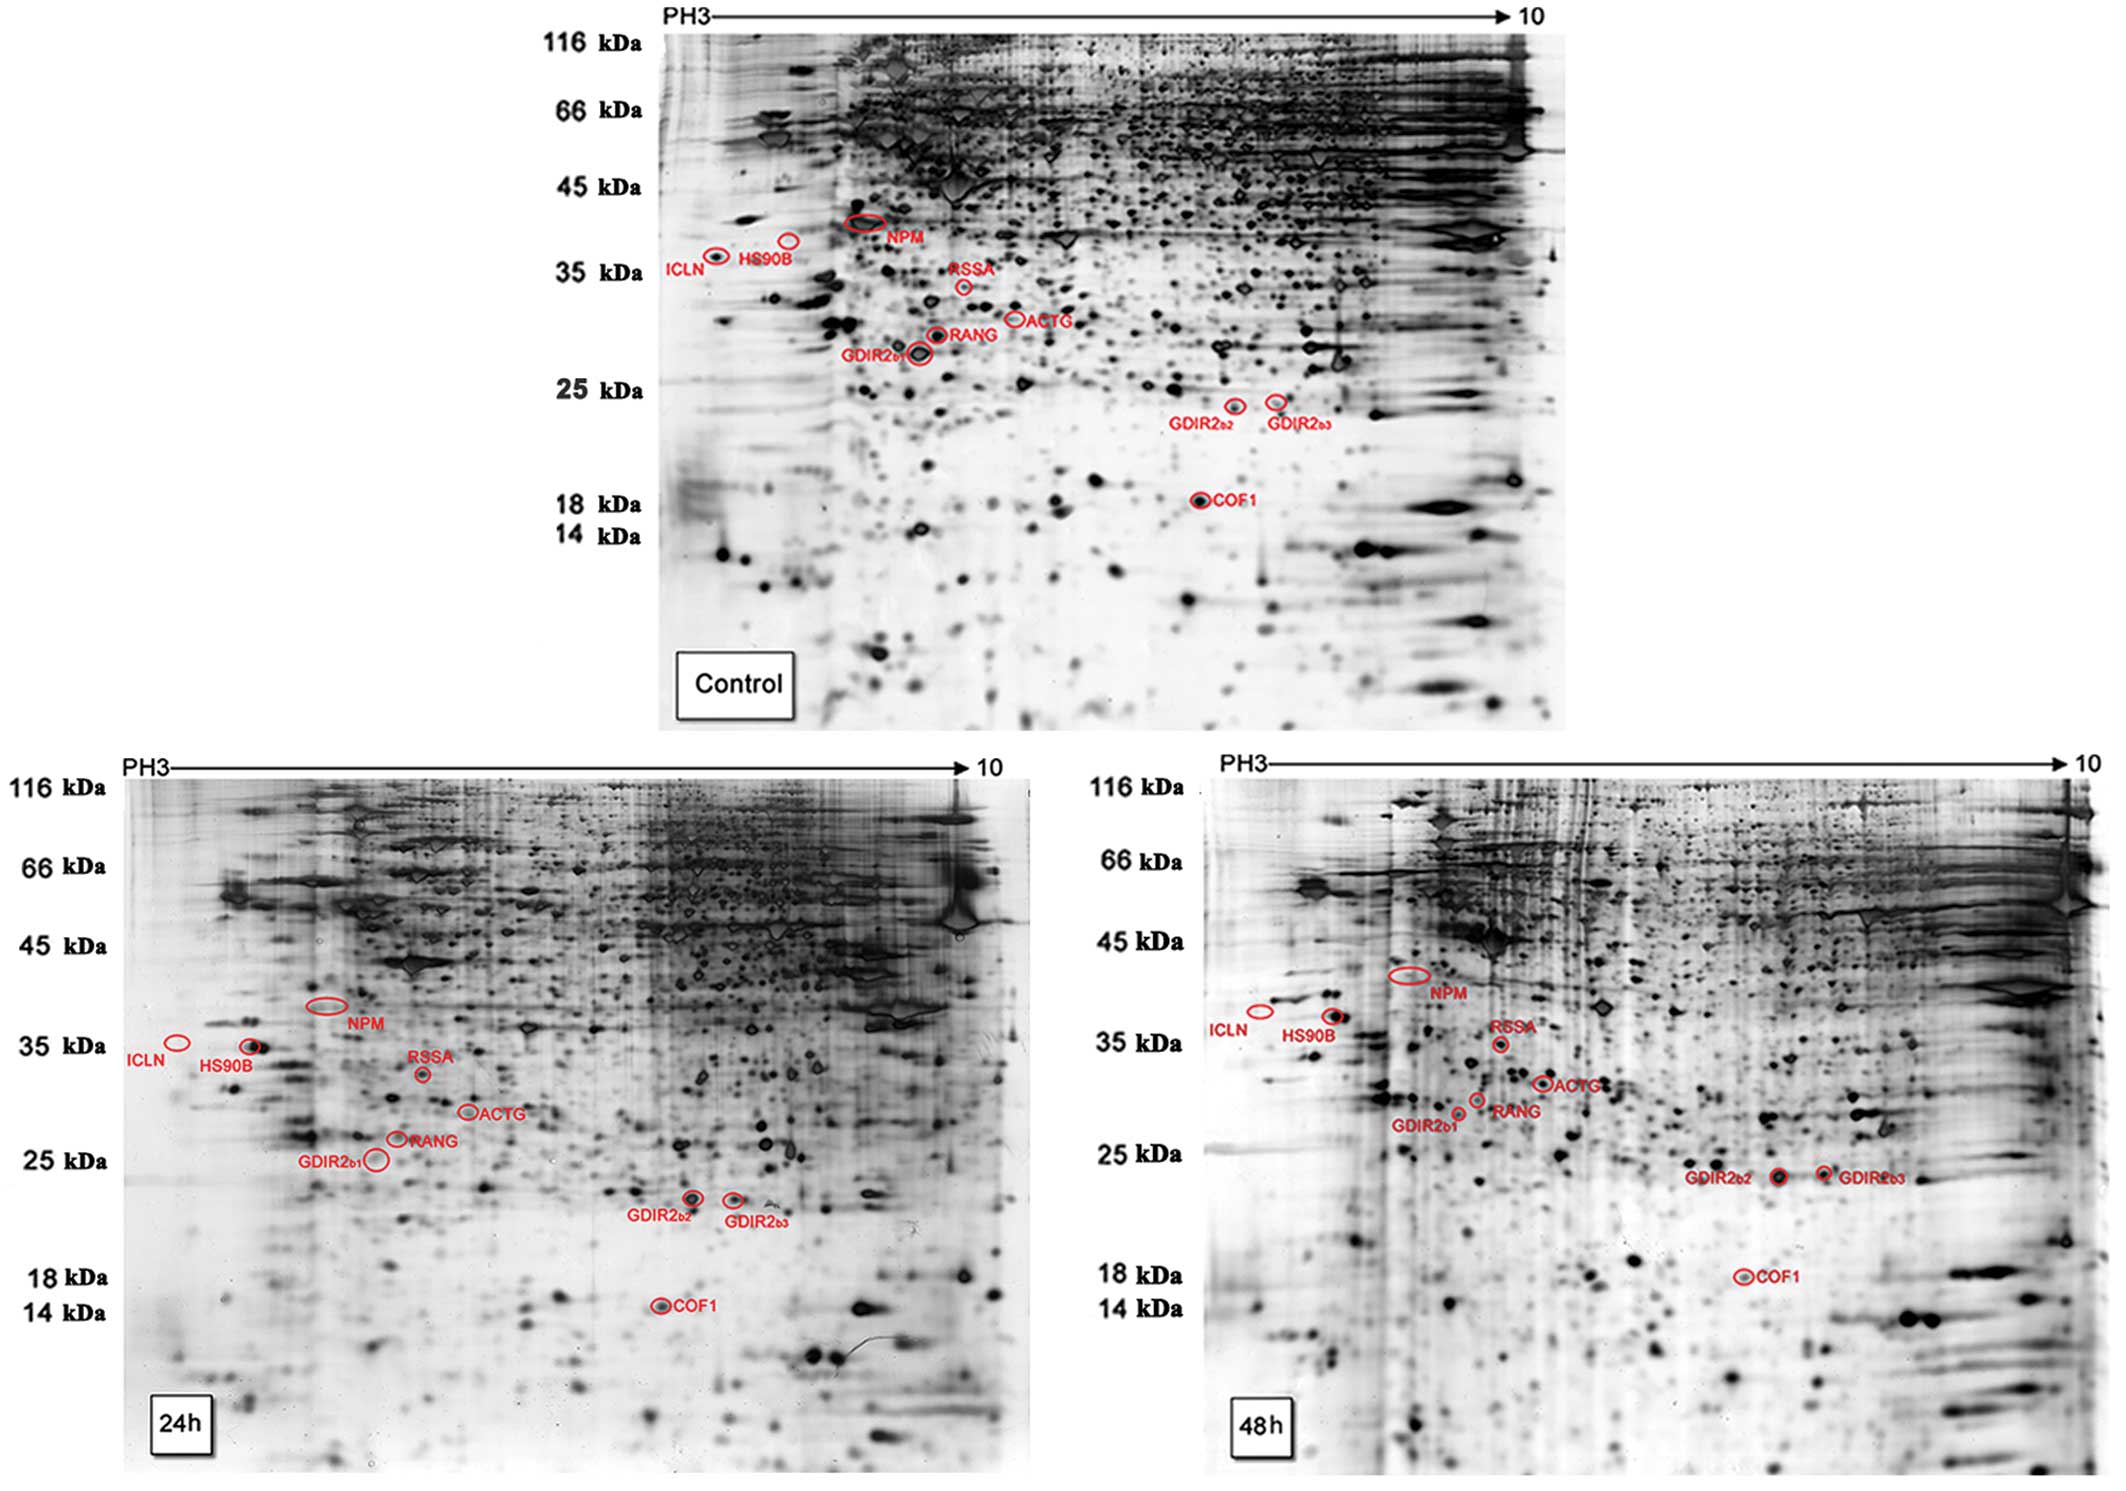
SAF induced RhoGDI 2 differential
expression by 2-DE and MS
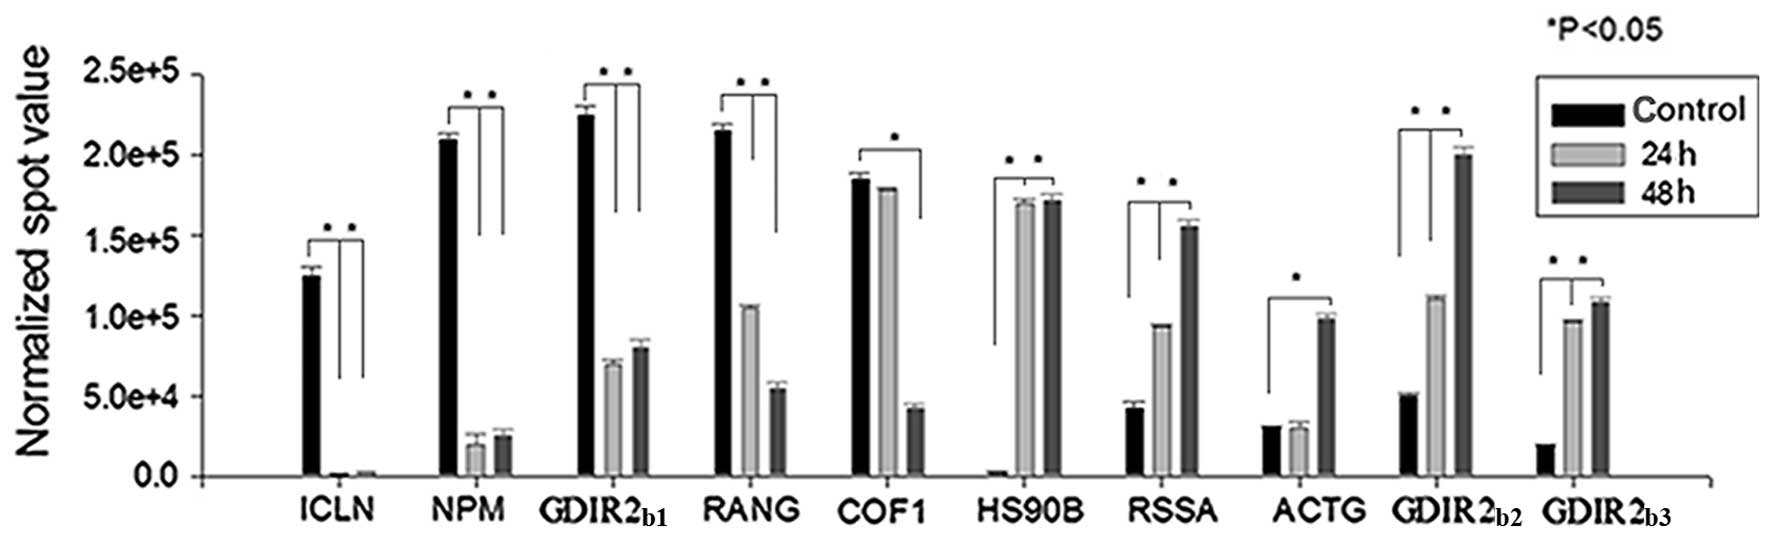
The two-dimensional gels (Fig. 4) showed the separation of the about
1000 protein spots from HL60 cells. The 2-DE experiments were
conducted in triplicate for the control (DMSO) and test groups by
adding 4 μg/ml SAF into HL60 cells for 24 and 48 h. Through
statistical analysis, the expression of 10 protein spots were found
to be significantly changed (Fig.
5) and were identified by MALDI-TOF MS (Table I). The 5 downregulated spots were
methylosome subunit (ICLN), nucleophosmin (NPM), RhoGDI 2
(GDIR2b1), Ran-specific GTPase-activating protein (RANG)
and cofilin-1 (COF1). The 5 upregulated spots were Hsp90 β (HS90B),
40s ribosomal protein SA (RSSA), actin cytoplasmic 2 (ACTG) and 2
RhoGDI 2 (GDIR2b2, GDIR2b3).
 | Table IDetails of the 10 differentially
expressed proteins by MALDI-TOF MS. |
Table I
Details of the 10 differentially
expressed proteins by MALDI-TOF MS.
| | | | | Change |
|---|
| | | | |
|
|---|
| Protein | Abbreviation | Protein score | Accession no. | Mw (kDa)/PI | 24 h | 48 h |
|---|
| Actin cytoplasmic
2 | ACTG | 218 | P63261 | 41.76/5.31 | Unchanged | Up |
| 40s ribosomal
protein SA | RSSA | 366 | P08865 | 32.83/4.79 | Up | Up |
| Hsp90-β | HS90B | 352 | P08238 | 83.21/4.97 | Up | Up |
| Rho
GDP-dissociation inhibitor 2 |
GDIR2b2 | 223 | P52566 | 22.97/5.1 | Up | Up |
| Rho
GDP-dissociation inhibitor 2 |
GDIR2b3 | 145 | P52566 | 22.97/5.1 | Up | Up |
| Methylosome subunit
plcln | ICLN | 70 | P54105 | 26.19/3.97 | Down | Down |
| Rho
GDP-dissociation inhibitor 22 |
GDIR2b1 | 408 | P52566 | 22.97/5.1 | Down | Down |
| Ran-specific
GTPase-activating protein | RANG | 105 | P43487 | 23.29/5.19 | Down | Down |
| Cofilin-1 | COF1 | 59 | P23528 | 18.49/8.22 | Down | Down |
| Nucleophosmin
B23 | NPM | 244 | P06748 | 32.55/4.64 | Down | Down |
SAF induced caspase 3 activation and
RhoGDI 2 cleavage by western blot analysis
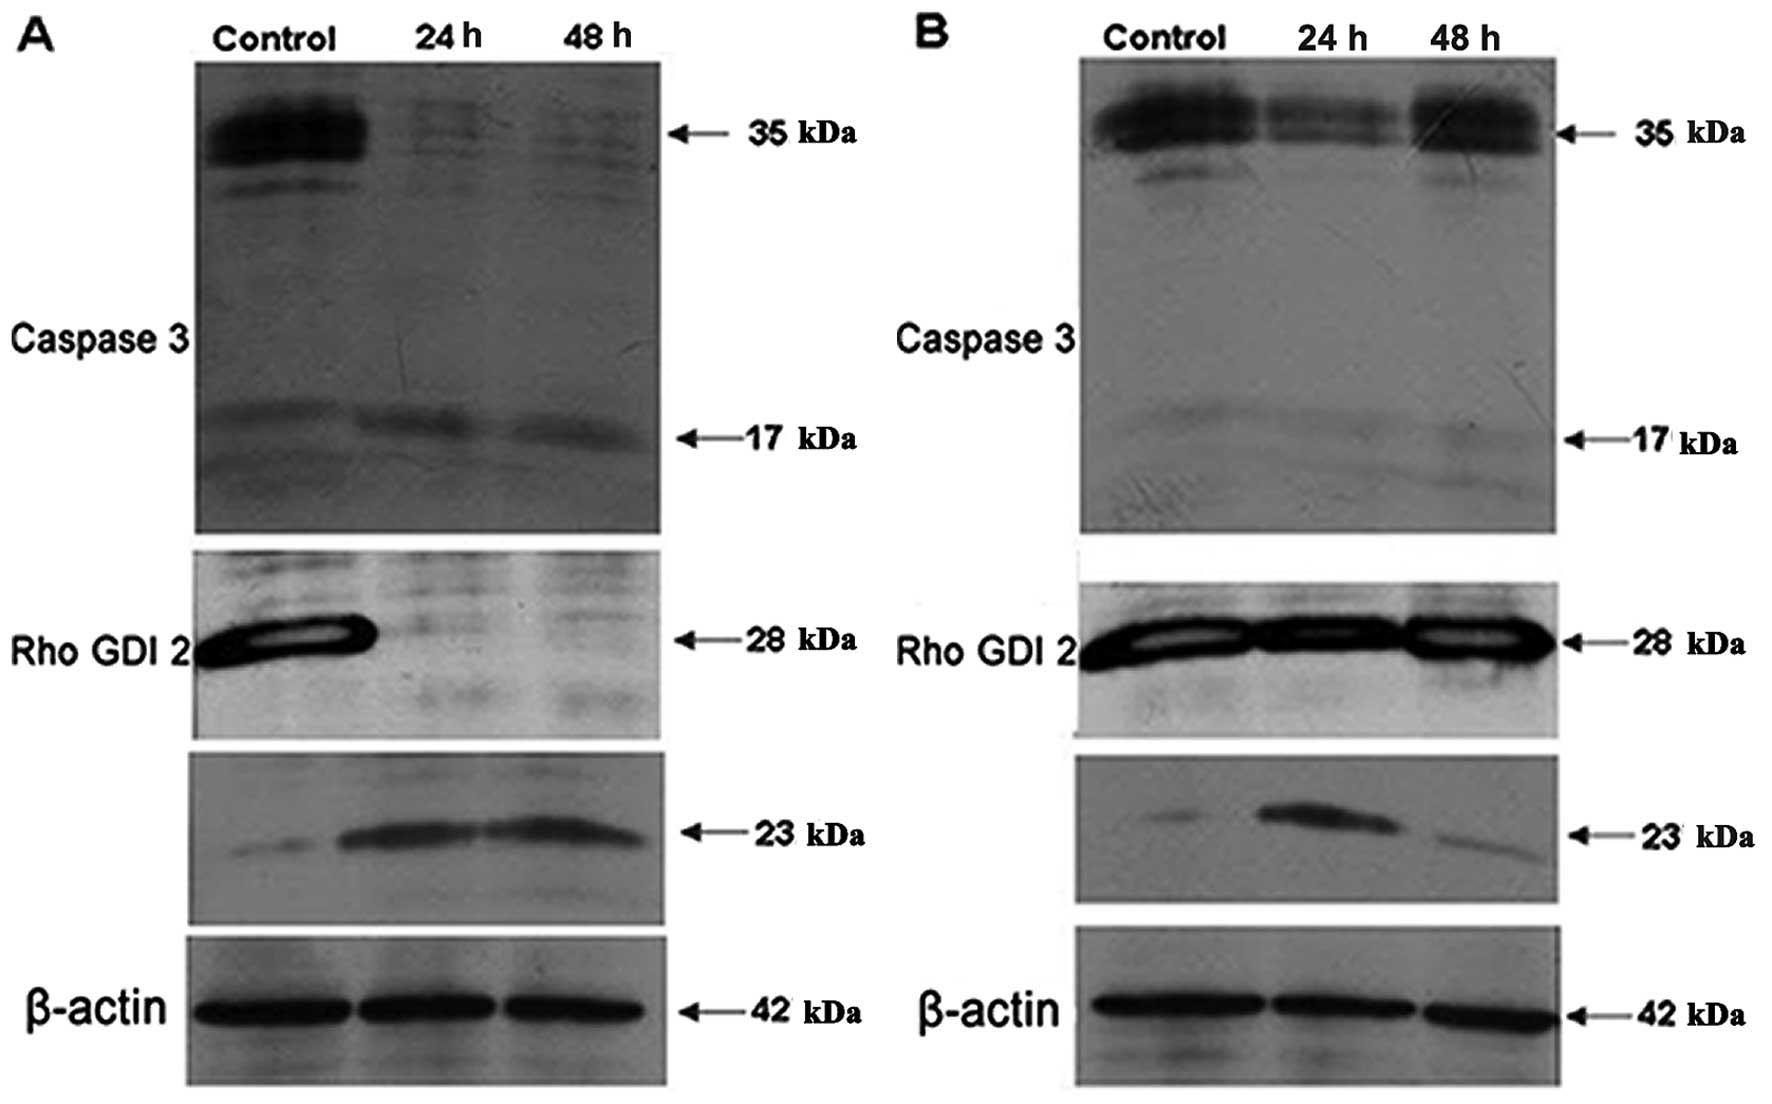
Three spots were identified as RhoGDI 2 but only the
spot (GDIR2b1) that displayed decreased abundance had a
pI and apparent molecular weight consistent with the theoretical
values for the native protein. The other two spots
(GDIR2b2, GDIR2b3) that displayed increased
abundance had higher pI values and lower molecular weights. To
further characterize these three protein spots, western blotting
was carried out using two different antibodies against RhoGDI 2,
anti-mouse RhoGDI 2 (2D7) that recognizes full length RhoGDI 2 and
anti-mouse RhoGDI 2 (3E6) that specifically recognizes the caspase
3 cleavage product of RhoGDI 2. The results (Fig. 6A) showed that a band around 28 kDa
standing for the full length RhoGDI 2 downregulated while a band
about 23 kDa representing the caspase 3 cleaved products of RhoGDI
2 upregulated obviously after treating HL60 cells with 4
μg/ml SAF for 24 and 48 h. Caspase 3 was also activated
during these processes.
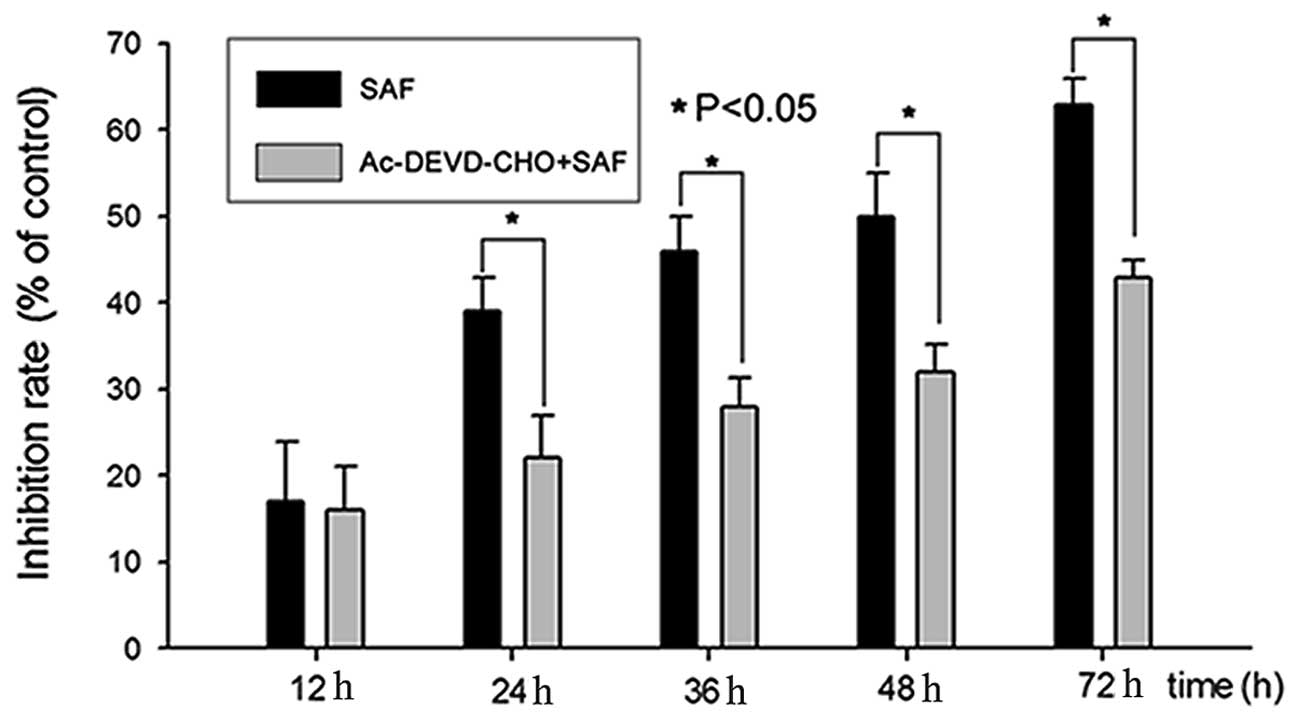
Caspase 3 inhibitor Ac-DEVD-CHO reduced
the proliferation inhibition effect induced by SAF
After the caspase 3 inhibitor Ac-DEVD-CHO (20
μM) was added, the altered expression profile of caspase 3
and RhoGDI 2 was abolished (Fig.
6B). Also the caspase 3 inhibitor assay results showed that
Ac-DEVD-CHO can significantly reduce SAF-induced HL60 cell
proliferation inhibition at 24–72 h (Fig. 7).
Discussion
Malignant tumors are an increasing public health
problem and are the number one cause of death in humans (14). Developing novel antitumor drugs is
of great significance for tumor therapy. We found that SAF
separated from the secondary metabolites of the deep sea originated
fungus Penicillium sp. F11 showed potent antitumor activity.
In this study, we conducted further investigations to elucidate the
cytotoxic activity of SAF in HL60 cells and the possible mechanisms
involved.
Our experimental data showed that SAF potently
inhibited the proliferation of HL60 cells in a dose- and
time-dependent manner and the half inhibitory concentration was
calculated as 4.1±0.16 μg/ml. Whether the cytotoxic activity
is through apoptosis or necrosis was further tested by Annexin
V-FLUOS/PI assay and the results showed that SAF could induce HL60
cell apoptosis. Western blotting also indicated the activation of
caspase 3, an important apoptosis-related protein after SAF
treatment. To better understand the cytotoxicity related mechanism
at the proteomic level, the 2-DE method was utilized and results
revealed that caspase 3 induced cleavage of RhoGDI 2 in SAF-treated
HL60 cells.
RhoGDI 2 (also named D4-GDI or Ly-GDI), belongs to
the family of GDP dissociation inhibitors (GDIs) that include
RhoGDI 1, RhoGDI 2 and RhoGDI 3. GDIs are cellular regulatory
proteins which control the cellular distribution and activity of
RhoGTPases (15–17). RhoGDI 2 is expressed preferentially
in hematopoietic tissues and B- and T-lymphocyte cell lines
(18) while RhoGDI 1 is expressed
ubiquitously and RhoGDI 3 is expressed in the brain, lung, kidney,
testis and pancreas (19). However,
accumulating evidence indicates that RhoGDI 2 is aberrantly
expressed in several human cancers and can function as a positive
or negative regulator of cancer progression (20). Interruption of the RhoGDI 2-mediated
cancer cell invasion and metastasis by an interfacial inhibitor may
be a powerful therapeutic approach to cancer.
The N-terminus of RhoGDI 2 contains a cleavage site
for caspase 3 (DELD19S) and caspase 1
(LLGD55G) (21).
Cleavage of RhoGDI 2 as a consequence of caspase 3 activation
during apoptosis induced by drugs, like mycophenolic acid (22), daunorubicin (23), taxol and epirubicin (24) has been previously observed. In our
research, three spots (1 downregulated and 2 upregulated) were also
identified as RhoGDI 2 through 2-DE and western blotting verified
that the full length RhoGDI 2 decreased in abundance and that the
caspase 3 cleaved product of RhoGDI 2 decreased in abundance. The
apparent shift in the isoelectric points of GDIR2b1
(pI=5.01) and its cleavage product GDIR2b2 (pI=6.78) is
consistent with the loss of 9 acidic-amino acids from the
N-terminus. Different degrees of phosphorylation of the two
cleavage products GDIR2b2 and GDIR2b3 could
provide a possible explanation for the slight differences in
mobility (25).
RhoGDI 2 was cleaved in the cytoplasm and
subsequently translocated to the nucleus (26). It has been reported (25) that overexpression of caspase 3
cleaved product of RhoGDI 2 in K562 cells could not affect cell
proliferation but increased the sensitivity to apoptosis induction
by PSI or staurosporine treatment. Nuclear export of the caspase 3
cleaved product of RhoGDI 2 abolished this apoptosis promoting
property. We also blocked RhoGDI 2 cleavage through caspase 3
inhibitor assay, and the results indicated that SAF induced cell
proliferation inhibition was significantly impaired. These
experiments nevertheless suggested that the caspase 3 cleaved
product of RhoGDI 2 could accelerate drug-induced apoptosis.
A previous study has shown that SAD (10), the isomeric compound of SAF, could
induce apoptosis in HL60 cells by cell cycle arrest of the G1 phase
related to downregulation of c-Myc which was demonstrated to be the
result of the activation of GSK-3β followed by degradation of
β-catenin. RhoGDI 2 was also expressed in HL60 cells treated with
SAD (1.2 μM) and the results of western blotting showed the
same altered profile with SAF (data not shown). Based on our data,
it is inferred that SAF and SAD could also promote the apoptosis
procession through caspase 3 cleavage of RhoGDI 2.
In conclusion, SAF showed potent cytotoxicity and
induced apoptosis in HL60 cells. Caspase 3-dependent RhoGDI 2
cleavage was also verified during SAF treatment. Although further
studies are needed, our data shed some light on the activities and
the cytotoxic mechanisms of SAF.
Acknowledgements
This study was supported by a Science and Technology
project of Xiamen (3502Z20111051), the R&D Special Fund for
Public Welfare Industry (Oceanography) (201005022-1, 201005032-1)
and the National Natural Science Foundation of China (81072549). We
thank Professor Q.Q. Gu from Ocean University of China for
providing secalonic acid D.
References
|
1
|
Yayanos AA: Microbiology to 10,500 meters
in the deep sea. Annu Rev Microbiol. 49:777–805. 1995. View Article : Google Scholar : PubMed/NCBI
|
|
2
|
Zähner H and Fiedler HP: The need for new
antibiotics: possible ways forward. Fifty Years of Antimicrobials:
Past Perspectives and Future Trends. Hunter PA, Darby GK and
Russell NJ: Cambridge University Press; Cambridge: pp. 67–85.
1995
|
|
3
|
Zhang L, An R, Wang J, et al: Exploring
novel bioactive compounds from marine microbes. Curr Opin
Microbiol. 8:276–281. 2005. View Article : Google Scholar : PubMed/NCBI
|
|
4
|
Gautschi JT, Amagata T, Amagata A,
Valeriote FA, Mooberry SL and Crews P: Expanding the strategies in
natural product studies of marine-derived fungi: a chemical
investigation of Penicillium obtained from deep water
sediment. J Nat Prod. 67:362–367. 2004. View Article : Google Scholar : PubMed/NCBI
|
|
5
|
Li D, Wang F, Cai S, et al: Two new
bisorbicillinoids isolated from a deep-sea fungus,
Phialocephala sp FL30r. J Antibiot (Tokyo). 60:317–320.
2007. View Article : Google Scholar : PubMed/NCBI
|
|
6
|
Du L, Feng T, Zhao B, et al: Alkaloids
from a deep ocean sediment-derived fungus Penicillium sp and
their antitumor activities. J Antibiot (Tokyo). 63:165–170. 2010.
View Article : Google Scholar : PubMed/NCBI
|
|
7
|
Zhuang P, Tang XX, Yi ZW, Qiu YK and Wu Z:
Two new compounds from marine-derived fungus Penicillium sp
F11. J Asian Nat Prod Res. 14:197–203. 2012. View Article : Google Scholar : PubMed/NCBI
|
|
8
|
Hong R: Secalonic acid D as a novel DNA
topoisomerase I inhibitor from marine lichen-derived fungus
Gliocladium sp T31. Pharm Biol. 49:796–799. 2011. View Article : Google Scholar : PubMed/NCBI
|
|
9
|
Liao G, Zhou J, Wang H, et al: The cell
toxicity effect of secalonic acid D on GH3 cells and the related
mechanisms. Oncol Rep. 23:387–395. 2010.PubMed/NCBI
|
|
10
|
Zhang JY, Tao LY, Liang YJ, et al:
Secalonic acid D induced leukemia cell apoptosis and cell cycle
arrest of G(1) with involvement of GSK-3β/β-catenin/c-Myc pathway.
Cell Cycle. 8:2444–2450. 2009.PubMed/NCBI
|
|
11
|
Dhulipala VC, Maddali KK, Welshons WV and
Reddy CS: Secalonic acid D blocks embryonic palatal mesenchymal
cell-cycle by altering the activity of CDK2 and the expression of
p21 and cyclin E. Birth Defects Res B Dev Reprod Toxicol.
74:233–242. 2005. View Article : Google Scholar : PubMed/NCBI
|
|
12
|
Asif AR, Armstrong VW, Voland A, Wieland
E, Oellerich M and Shipkova M: Proteins identified as targets of
the acyl glucuronide metabolite of mycophenolic acid in kidney
tissue from mycophenolate mofetil treated rats. Biochimie.
89:393–402. 2007. View Article : Google Scholar : PubMed/NCBI
|
|
13
|
Towbin H, Staehelin T and Gordon J:
Electrophoretic transfer of proteins from polyacrylamide gels to
nitrocellulose sheets: procedure and some applications. Proc Natl
Acad Sci USA. 76:4350–4354. 1979. View Article : Google Scholar : PubMed/NCBI
|
|
14
|
Jemal A, Bray F, Center MM, Ferlay J, Ward
E and Forman D: Global cancer statistics. CA Cancer J Clin.
61:69–90. 2011. View Article : Google Scholar
|
|
15
|
Dovas A and Couchman JR: RhoGDI: multiple
functions in the regulation of Rho family GTPase activities.
Biochem J. 390:1–9. 2005. View Article : Google Scholar : PubMed/NCBI
|
|
16
|
DerMardirossian C and Bokoch GM: GDIs:
central regulatory molecules in Rho GTPase activation. Trends Cell
Biol. 15:356–363. 2005. View Article : Google Scholar : PubMed/NCBI
|
|
17
|
Dransart E, Olofsson B and Cherfils J:
RhoGDIs revisited: novel roles in Rho regulation. Traffic.
6:957–966. 2005. View Article : Google Scholar : PubMed/NCBI
|
|
18
|
Scherle P, Behrens T and Staudt LM:
Ly-GDI, a GDP-dissociation inhibitor of the RhoA GTP-binding
protein, is expressed preferentially in lymphocytes. Proc Natl Acad
Sci USA. 90:7568–7572. 1993. View Article : Google Scholar : PubMed/NCBI
|
|
19
|
Sasaki T and Takai Y: The Rho small G
protein family-Rho GDI system as a temporal and spatial determinant
for cytoskeletal control. Biochem Biophys Res Commun. 245:641–645.
1998. View Article : Google Scholar : PubMed/NCBI
|
|
20
|
Cho HJ, Baek KE and Yoo J: RhoGDI2 as a
therapeutic target in cancer. Expert Opin Ther Targets. 14:67–75.
2010. View Article : Google Scholar : PubMed/NCBI
|
|
21
|
Na S, Chuang TH, Cunningham A, et al:
D4-GDI, a substrate of CPP32, is proteolyzed during Fas-induced
apoptosis. J Biol Chem. 271:11209–11213. 1996. View Article : Google Scholar : PubMed/NCBI
|
|
22
|
Heller T, Asif AR, Petrova DT, et al:
Differential proteomic analysis of lymphocytes treated with
mycophenolic acid reveals caspase 3-induced cleavage of rho GDP
dissociation inhibitor 2. Ther Drug Monit. 31:211–217. 2009.
View Article : Google Scholar : PubMed/NCBI
|
|
23
|
Kwon KB, Park EK, Ryu DG and Park BH:
D4-GDI is cleaved by caspase-3 during daunorubicin-induced
apoptosis in HL-60 cells. Exp Mol Med. 34:32–37. 2002. View Article : Google Scholar : PubMed/NCBI
|
|
24
|
Essmann F, Wieder T, Otto A, Muller EC,
Dorken B and Daniel PT: GDP dissociation inhibitor D4-GDI (Rho-GDI
2), but not the homologous rho-GDI 1, is cleaved by caspase-3
during drug-induced apoptosis. Biochem J. 346(Pt 3): 777–783. 2000.
View Article : Google Scholar : PubMed/NCBI
|
|
25
|
Choi MR, Groot M and Drexler HC:
Functional implications of caspase-mediated RhoGDI2 processing
during apoptosis of HL60 and K562 leukemia cells. Apoptosis.
12:2025–2035. 2007. View Article : Google Scholar : PubMed/NCBI
|
|
26
|
Krieser RJ and Eastman A: Cleavage and
nuclear translocation of the caspase 3 substrate Rho
GDP-dissociation inhibitor, D4-GDI, during apoptosis. Cell Death
Differ. 6:412–419. 1999. View Article : Google Scholar : PubMed/NCBI
|