Introduction
18F-fluorodeoxyglucose (18F-FDG) is the
most common radiotracer and it has been primarily recognized
valuable for the diagnosis and staging of lung cancer (1–3).
Although 18F-FDG PET/CT imaging has shown better
sensitivity in the diagnosis of lung cancer, the specificity of
this method is not optimal because of the non-specific uptake of
18F-FDG in inflammatory cells and granulation tissues
such as tuberculosis, especially for acute inflammatory and active
tuberculosis in which the uptake level of 18F-FDG may
even exceed the level in cancer (4,5). In
addition, the conspicuous 18F-FDG uptake of normal
myocardium usually interferes with the observation of mediastinal
lymph nodes. In order to improve the specificity of PET/CT for
malignancies, finding a new radiotracer has become a focus for
additional research. Although literature relating to this topic
remains limited, the diagnostic effect of 11C-choline
PET/CT for pulmonary disease has attracted attention from scholars.
(6,7). Moreover, the mechanism of
18F-FDG uptake by tumor cells is been well known, while
the mechanism of CH uptake has not been thoroughly clarified. By
comparing 11C-choline PET/CT with contrast-enhanced CT,
our research aimed to investigate the efficacy of
11C-choline PET/CT imaging in diagnosing and staging
lung cancer, and to discuss the correlation between choline
metabolism and proliferation of lung cancer cells.
Materials and methods
Fifty-three patients histologically diagnosed or
suspected of having lung cancer were referred for surgery during
March 2008–June 2010. They underwent standard preoperative staging
procedures. The patients were in stage I, II and selected IIIA. An
allergic reaction to iodinated contrast agents was considered an
exclusion criteria. Patients who received chemotherapy or
radiotherapy prior to surgery were also excluded. The enrolled
patients underwent integrated PET/CT and contrast-enhanced CT scans
of the chest followed by surgical resection and nodal staging. The
PET/CT, contrast-enhanced CT and surgery were performed within 2
weeks. Patients included 30 men and 23 women with a median age of
61 years (36–76). Pathologic findings in locoregional lymph nodes
were performed as gold standard. The patients whose preoperative
diagnoses were unclear initially received a partial resection or
pulmonary lobectomy and were then further treated with
pneumonectomy and lymph node dissection according to the criterion
if the rapid pathological diagnosis of lung cancer was confirmed.
Part of the lesion tissue was used for RT-PCR and
immunohistochemistry, the other was used for pathological analysis.
Selected normal tissue >5 cm around each lesions were collected
as the controls. Part of the specimen was stored in liquid nitrogen
for RT-PCR, another part was fixed by neutral formalin for
immunohistochemistry. The study protocol was approved by the
Institutional Review Board of the Provincial Hospital Affliated to
Shandong University (Shandong, China). Informed consent was
obtained from each patient.
PET/CT scanning
A hybrid PET-CT system (GE Discovery LS; GE Medical
Systems, Milwaukee, WI, USA) was employed for four-slice, helical
CT acquisition, followed by a full-ring dedicated PET scan of the
same axial range. The CT component was operated with an X-ray tube
voltage peak of 140 keV, 80 mA, 6:1 pitch and slice thickness of
4.25 mm, with a rotational speed of 0.8 sec per rotation. PET was
performed for 5 min/field of view, each covering 14.5 cm, at an
axial sampling of 4.25 mm/slice. Both PET and CT were performed
with normal tidal breathing. PET images were reconstructed using
the ordered subset expectation maximization (OSEM) software, using
CT-derived attenuation correction.
The attenuation-corrected PET images, the CT images
and the fused PET/CT images were available for review in axial,
coronal and sagittal planes, as was a cine display of maximum
intensity projections (MIP) of the PET data, using the
manufacturer's review station (eNTegra & Xeleris, GE Medical
Systems).
11C-choline (half-life, 20 min) was
prepared using a cyclotron and automated synthetic apparatuses that
we constructed. PET scanning was performed in the morning after the
patients had fasted overnight. After the transmission scan was
completed, a bolus of 11C-choline (370 mBP) was injected
intravenously (i.v.), followed by an infusion of a large volume of
saline solution using the same i.v. line. The emission scan started
5 min after the injection of 11C-choline.
Two experienced nuclear medicine physicians, who
were masked to the results of computed tomography, read the PET
images. Standardized uptake values (SUVs) were calculated as the
ratio of the regional radioactivity concentration divided by the
injected amount of radioactivity normalized to the body weight. CT
criteria used to define malignant involvement of mediastinal lymph
nodes was a short-axis lymph node diameter of ≥1 cm on a transverse
CT scan.
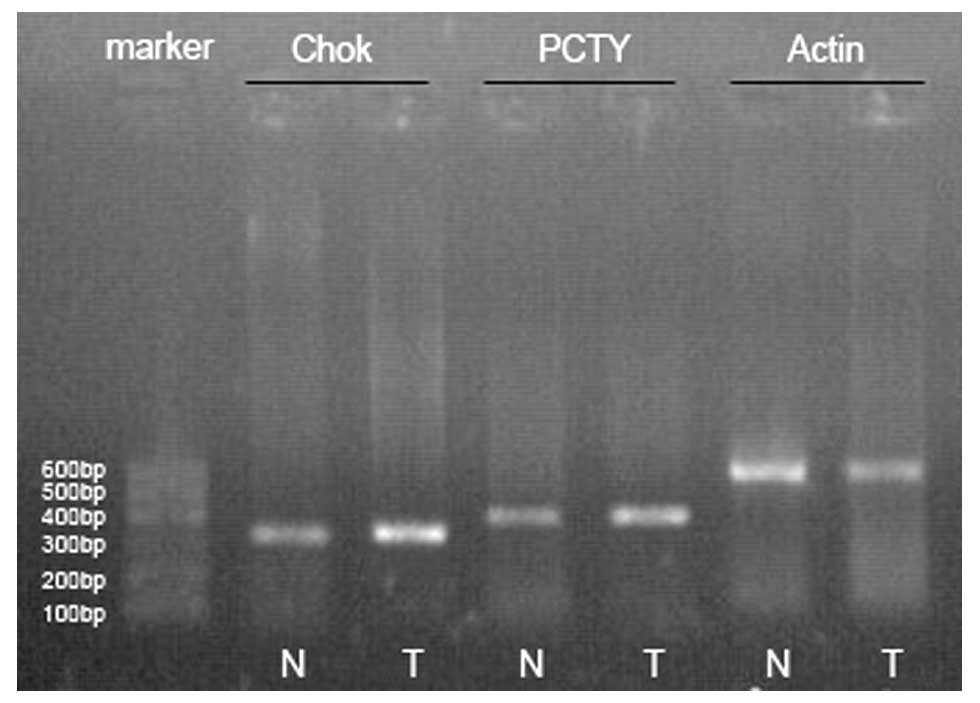
Expression of choline kinase (ChoK) and
phosphorylcholine-cytidyl transferase (PCYT)
(RT-PCR) was used to investigate the expression of
ChoK and PCYT genes in the lung tumor tissue and the control
tissue. Total RNA was extracted from the specimens with TRIzol
reagent (Invitrogen, USA) following the maufacturer's instructions
and the expression of ChoK and PCYT mRNA was determined by RT-PCR
with reverse transcriptase (MBI Fermentas, USA). PCR primers used
for ChoK and PCYT are shown in Table
I. PCR conditions consisted of a denaturation at 95°C for 5
min, followed by 40 cycles at 94°C for 40 sec, 55°C for 30 sec and
72°C for 40 sec. β-actin mRNA was amplified and used to normalize
the amount of the ChoK and PCYT mRNA in RT-PCR. Amplification
products of PCR were analyzed using agarose gel electrophoresis.
The gel images were acquired using Amersham Imagemaster VDS-CL to
perform the comparative analysis with Bandleader 3.0 software.
According to the densitometry of bands under the CCD imaging
system, we calculated the densitometry ratio of ChoK or PCYT to
β-actin to obtain the relative expression intensity. The average
relative expression intensity of the control tissue was at a
standard level. When the relative expression intensity was >2
times the average relative expression, there was an overexpression;
<1/2 was considered low expression; and between 1/2 and 2 times
was a normal expression.
 | Table IChoK, PCYT and β-actin PCR
primers. |
Table I
ChoK, PCYT and β-actin PCR
primers.
| Gene | Primer sequence | Product size
(bp) |
|---|
| ChoK | F:
5′-CAGAAACGAGATCGGGAAGC-3′ | 354 |
| R:
5′-ATGGGACCAAGAGGGTAAAG-3′ | |
| PCYT | F:
5′-ACTCCTTGTGAGCGACCTGTG-3′ | 414 |
| R:
5′-TCGGGTGATGATGTCTGATGT-3′ | |
| β-actin | F:
5′-CTGGGACGACATGGAGAAAA-3′ | 564 |
| R:
5′-AAGGAAGGCTGGAAGAGTGC-3′ | |
Immunohistochemical staining with
Ki-67
Staining was performed on 4-mm sections of
formalin-fixed paraffin-embedded specimens.
The H&E staining and streptavidin-biotin
immunoperoxidase were applied to the specimens respectively after
deparaffinization and microwave antigen retrieval. The antibody for
Ki-67 (monoclonal mouse antibody MIB-1, 1:100 Dilution) (Zhongshan
Golden Bridge Biotechnology Co., China) was used for measurement of
the Ki-67 index: the labeling index of Ki-67 was calculated by
determining the percentage of cells with positive nuclei in
>1,000 tumor cells in >4 fields.
Statistical analysis
Statistical analyses were performed using the SPSS
statistical software program (version 16.0 for Windows). The
results of CT and PET/CT were compared with a reference standard
provided by the pathological examination. Sensitivity, specificity
and accuracy for detecting the lesion and lymph node were
calculated and the statistical significance was determined with the
McNemar's test and the Fisher's exact test. Statistical
significance of a positive predicted value and a negative predict
value for the detection of lymph node was determined with the
Chi-square test. Statistical significance of the expression of ChoK
and PCYT was determined with the Wilcoxon test. A P-value of
<0.05 was considered to indicate a statistically significant
difference. Both the correlation between the expression of ChoK,
PCYT and SUVmean, and the correlation between the Ki-67 index and
the SUVmean were determined with the Pearson's correlation
analysis. Correlation was assumed for P-value <0.05; when
r-value <0.3 there was no correlation. Correlation was assumed
low with an r-value between 0.3 and 0.5; a medium correlation when
r-value was between 0.5 and 0.8 and there was a high correlation at
r-value >0.8.
Results
Pathological findings
Pathological analysis revealed lung cancer in 42
patients (including adenocarcinoma in 15 patients, squamous cell
carcinoma in 18, adenosquamous carcinoma in 2, small cell lung
cancer in 3, carcinoid in 3 and large-cell neuroendocrine cancer in
1), benign lesion in 11 patients (including tuberculoma in 4,
inflammatory pseudotumor in 4, harmatoma in 2, sclerosing
hemangioma in 1). A total of 271 lymph nodal groups were evaluated
for pathological analysis. From these 49 nodal groups, 42 patients
proved to be positive for malignancy.
CH-PET/CT and CT findings
Thirty-five patients were diagnosed with lung cancer
using CH-PET. There were 3 patients with false-positive (FP)
results (including tuberculoma in 2, inflammatory pseudotumor in
1), 7 patients with false-negative (FN) results [including
adenocarcinoma in 3 (alveolar carcinoma in 2), squamous cell
carcinoma in 2, adenosquamous carcinoma in 1, carcinoid in 1].
The overall mean SUV (SUVmean) for lung cancer
patients was 3.57±1.88 (0.52–7.84) and the SUVmax of these patients
was 4.12± 2.05 (0.52–8.46).
Thirty-one patients were diagnosed with lung cancer
using CT. There were 4 patients with FP results (including
tuberculoma in 2, inflammatory pseudotumor in 2), 11 patients with
FN results (including adenocarcinoma in 5, squamous cell carcinoma
in 3, carcinoid in 2, adenosquamous carcinoma in 1).
Three patients obtained FN results using both PET/CT
and CT; 4/7 FN interpretations on PET/CT were corrected using CT;
8/11 FN interpretations on CT were corrected using PET/CT (Table II).
| Table IISensitivity, specificity and accuracy
of PET/CT and CT scans for lung cancer. |
Table II
Sensitivity, specificity and accuracy
of PET/CT and CT scans for lung cancer.
| Parameter | TP | FN | FP | TN | Accuracy | Sensitivity | Specificity |
|---|
| PET/CT | 35 | 7 | 3 | 8 | 81.13% (43/53) | 83.33% (35/42) | 72.73% (8/11) |
| CT | 31 | 11 | 4 | 7 | 71.70% (38/53) | 73.81% (31/42) | 63.64% (7/11) |
| P-value | | | | | 0.61 | 0.39 | 1.0 |
Preoperative nodal staging was compared with
postoperative histopathological staging; 83.33% (35/42) of patients
were correctly staged, 9.52% (4/42) of patients were overstaged and
07.14% (3/42) were understaged by PET/CT, with CT values of 52.38%
(22/42), 28.57% (12/42) and 19.05% (8/42), respectively (Table III).
| Table IIISensitivity, specificity accuracy, PPV
and NPV of PET/CT and CT scans for lymph node staging. |
Table III
Sensitivity, specificity accuracy, PPV
and NPV of PET/CT and CT scans for lymph node staging.
| Parameter | TP | FN | FP | TN | Accuracy | Sensitivity | Specificity | PPV | NPV |
|---|
| PET/CT | 42 | 7 | 37 | 18 | 83.76% | 85.71% | 83.33% | 53.16% | 96.35% |
| | | | 5 | (227/271) | (42/49) | (185/222) | (42/79) | (185/192) |
| CT | 30 | 19 | 71 | 15 | 66.79% | 61.22% | 68.02% | 29.70% | 88.82% |
| | | | 1 | (181/271) | (30/49) | (151/222) | (30/101) | (151/170) |
| P-value | | | | | 0.04 | 0.02 | 0.000268 | 0.005 | 0.001 |
Expression of ChoK and PCYT in the lesion
and control tissue
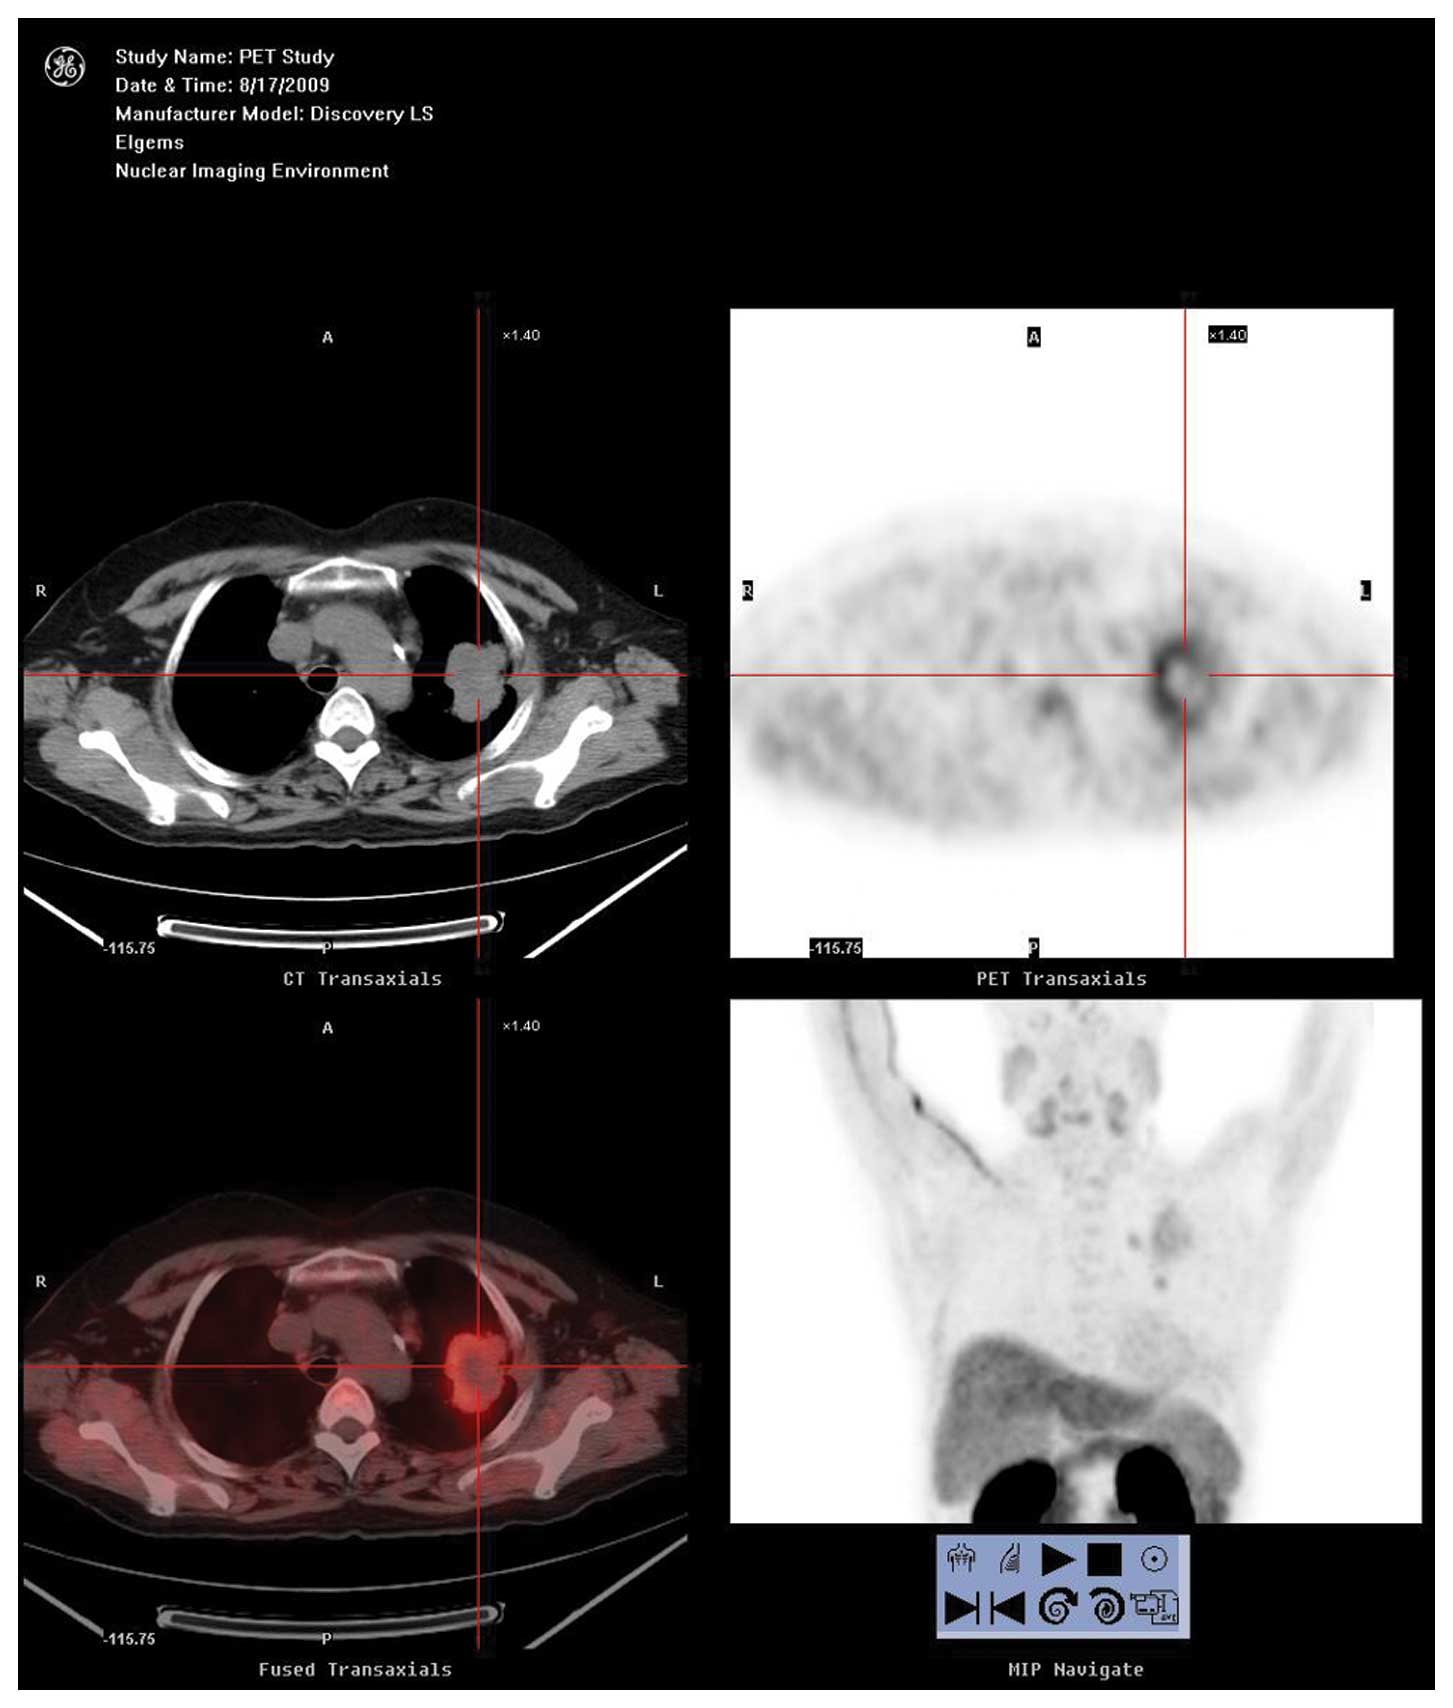
According to the result of RT-PCR, in the 35
positive PET patients, the relative expression intensification of
ChoK in malignant tissue was 0.69±0.16 (0.31–0.97) and 0.33±0.08
(0.15–0.52) in the control tissue. The difference between them was
statistically significant (Z=−5.16, P=0.000000245); the relative
expression intensification of PCYT in malignant tissue was
0.43±0.15 (0.15–0.67) and 0.23±0.08 (0.12–0.42) in the control
tissue. The difference between them was also statistically
significant (Z=−4.92, P=0.000000887). There were 29 (82.86%)
patients with ChoK overexpression and 26 (74.29%)patients with PCYT
overexpression (Figs. 1–3).
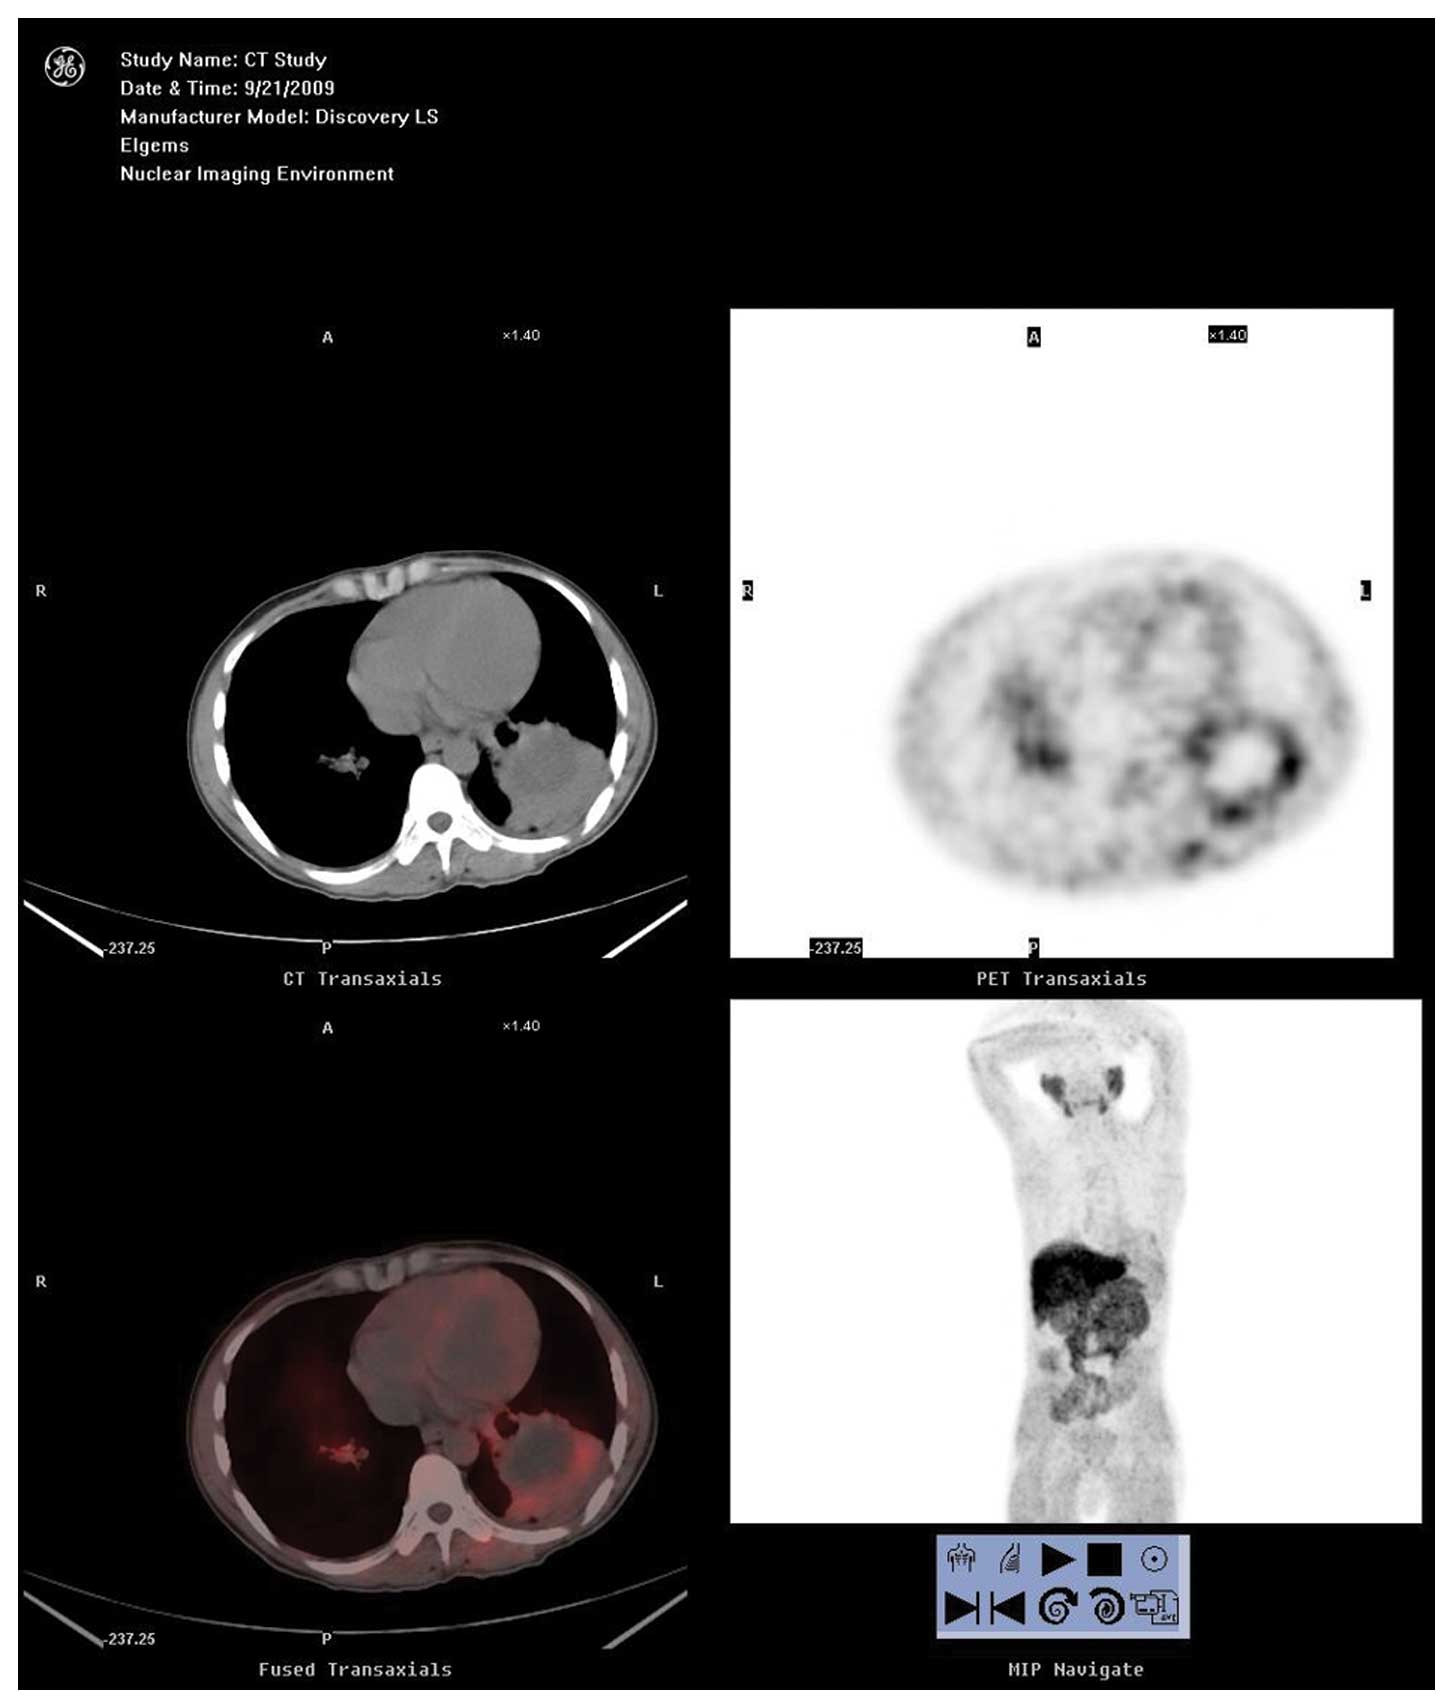
In the 7 negative PET patients, the relative
expression intensification of ChoK in malignant tissue was
0.44±0.08 (0.37–0.60) (Fig. 4) and
0.36±0.12 (0.19–0.52) in the control tissue. The difference between
them had no statistical significance (Z=−1.69, P=0.09). The
relative expression intensification of PCYT in malignant tissue was
0.36±0.15 (0.18–0.52) and 0.34±0.14 (0.15–0.52) in the control
tissue. The difference between them also had no statistical
significance (Z=−1.36, P=0.17). ChoK or PCYT were not overexpressed
in these 7 patients.
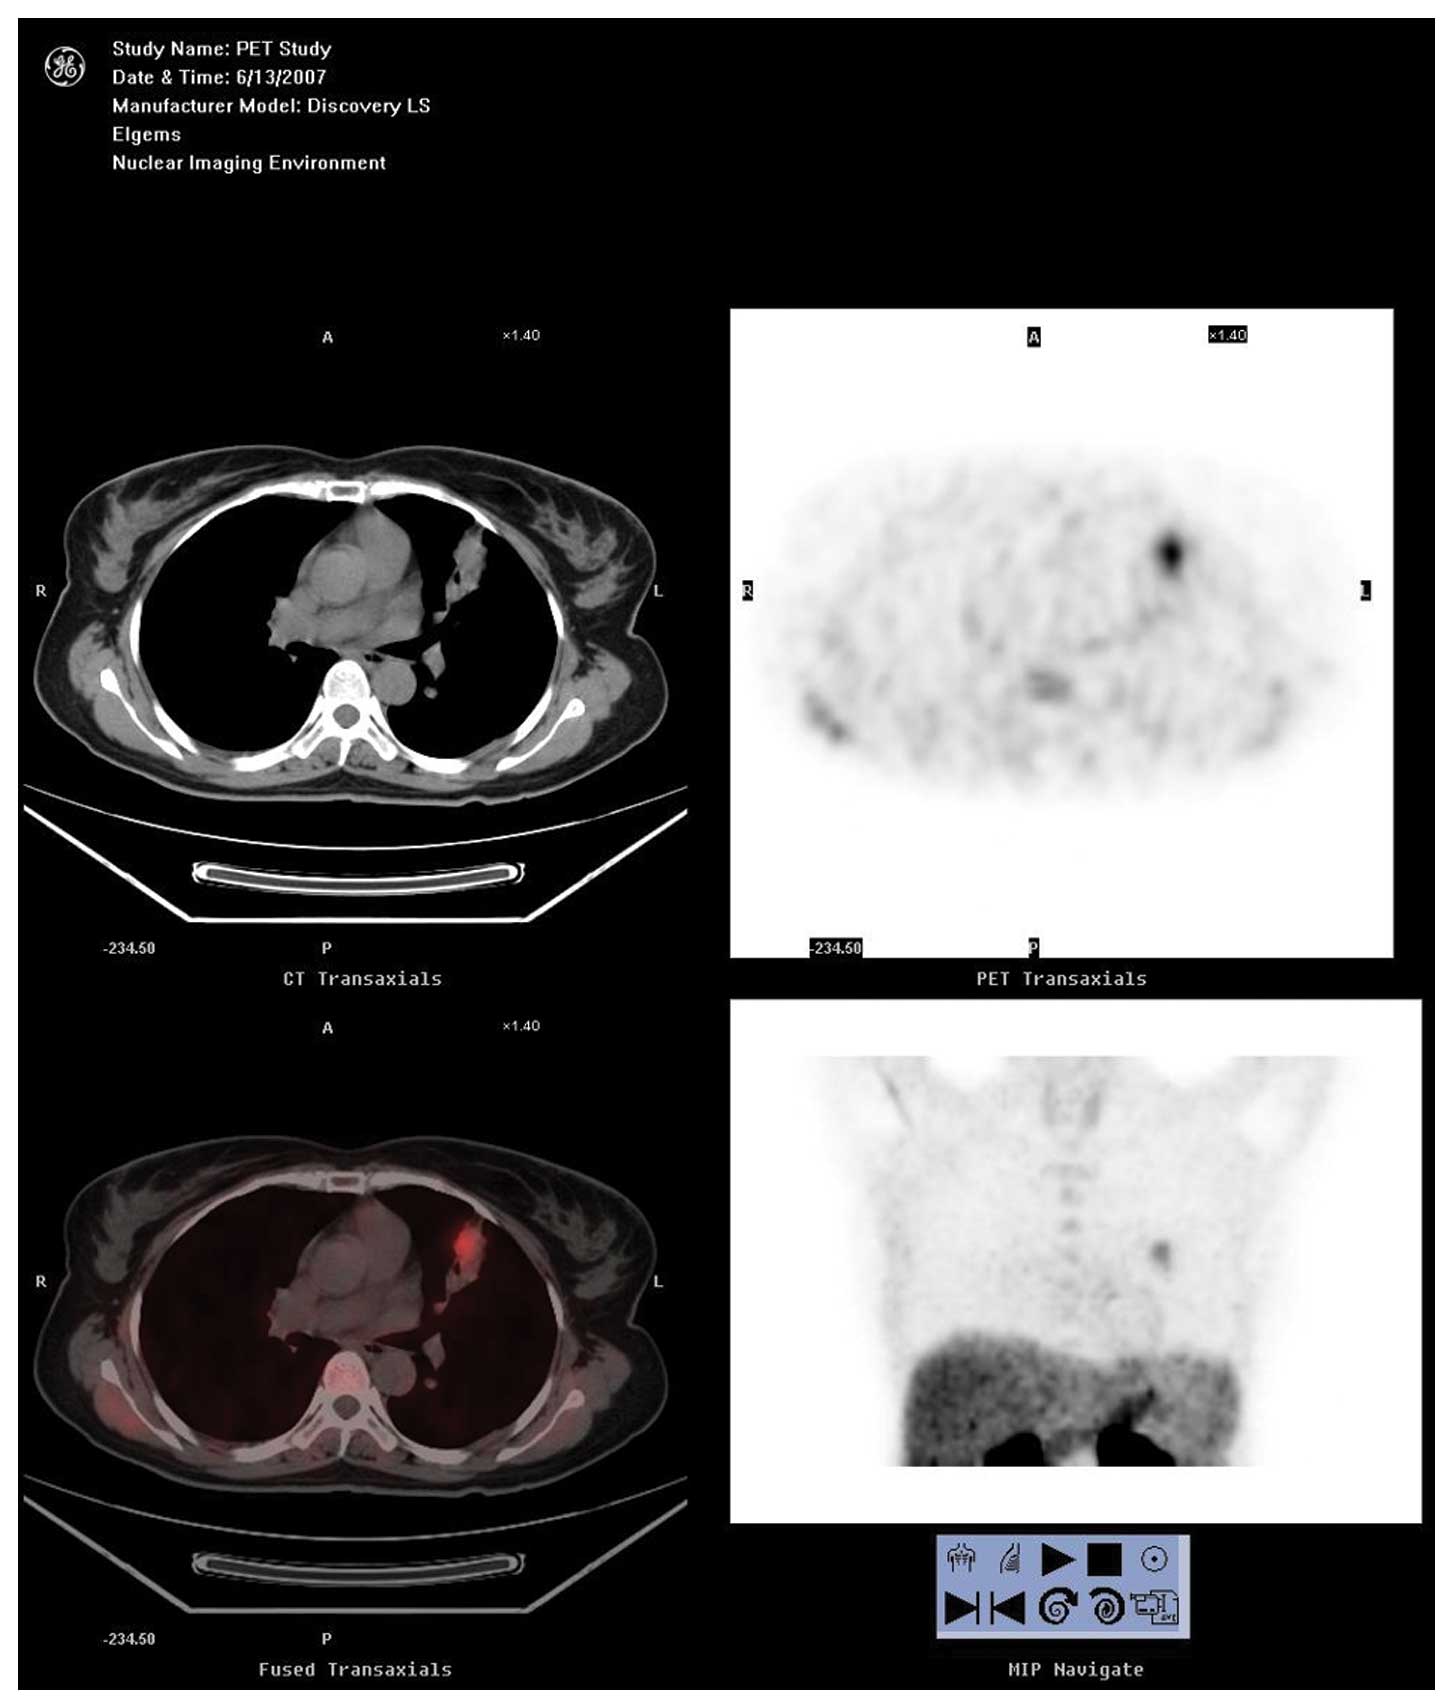
In the 11 patients with benign disease, the relative
expression intensification of ChoK in malignant tissue was
0.38±0.14 (0.18–0.57) (Fig. 5) and
0.31±0.10 (0.17–0.48) in the control tissue. The difference between
them was not statistically significant (Z=−1.43, P=0.15) the
relative expression intensification of PCYT in malignant tissue was
0.33±0.10 (0.19–0.52) and 0.28±0.08 (0.17–0.41) in the control
tissue. The difference between them was not statistically
significant (Z=−1.65, P=0.10). The patients with ChoK
overexpression accounted for 27.27% (2 tuberculosis with positive
PET result, 1 inflammatory pseudotumor with positive PET result)
and the patients with PCYT overexpression accounted for 18.18% (1
tuberculosis with positive PET result, 1 inflammatory pseudotumor
with positive PET result).
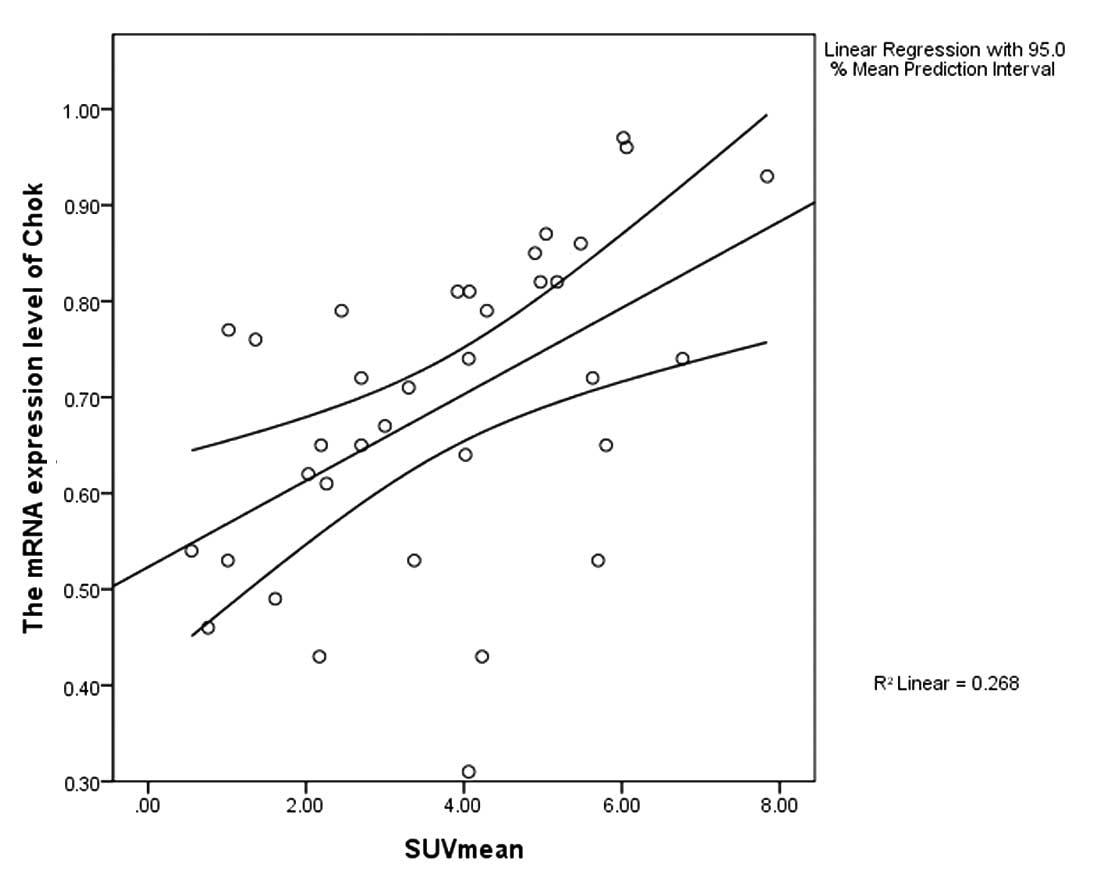
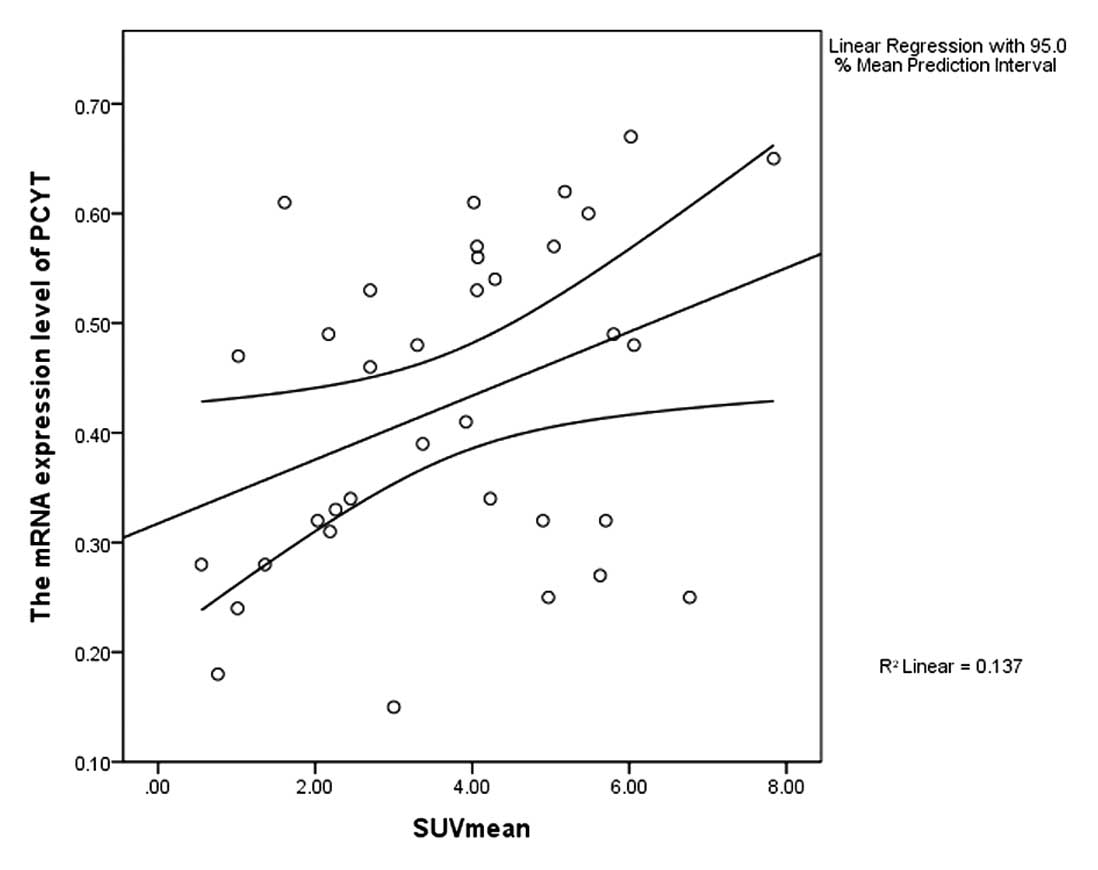
Correlation between the expression of
ChoK, PCYT and SUVmean
According to the Pearson's correlation analysis, in
the 35 patients with positive PET results, both the expression
levels of ChoK and PCYT were positively correlated with the SUVmean
(r=0.518, P=0.001, r=0.37, P=0.029) (Figs. 6 and 7).
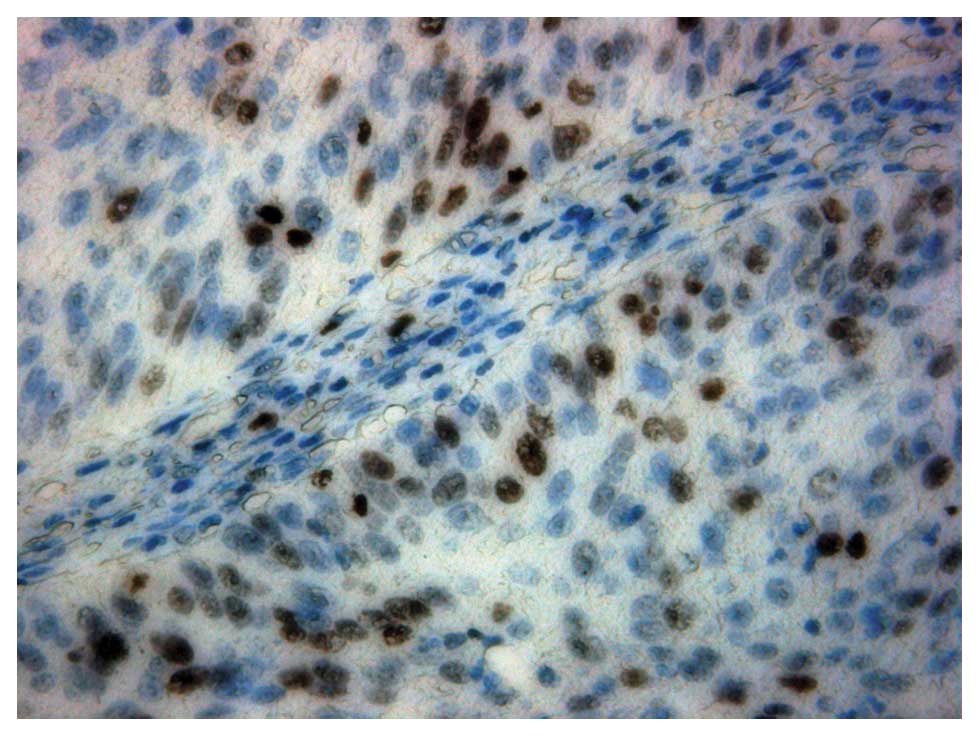
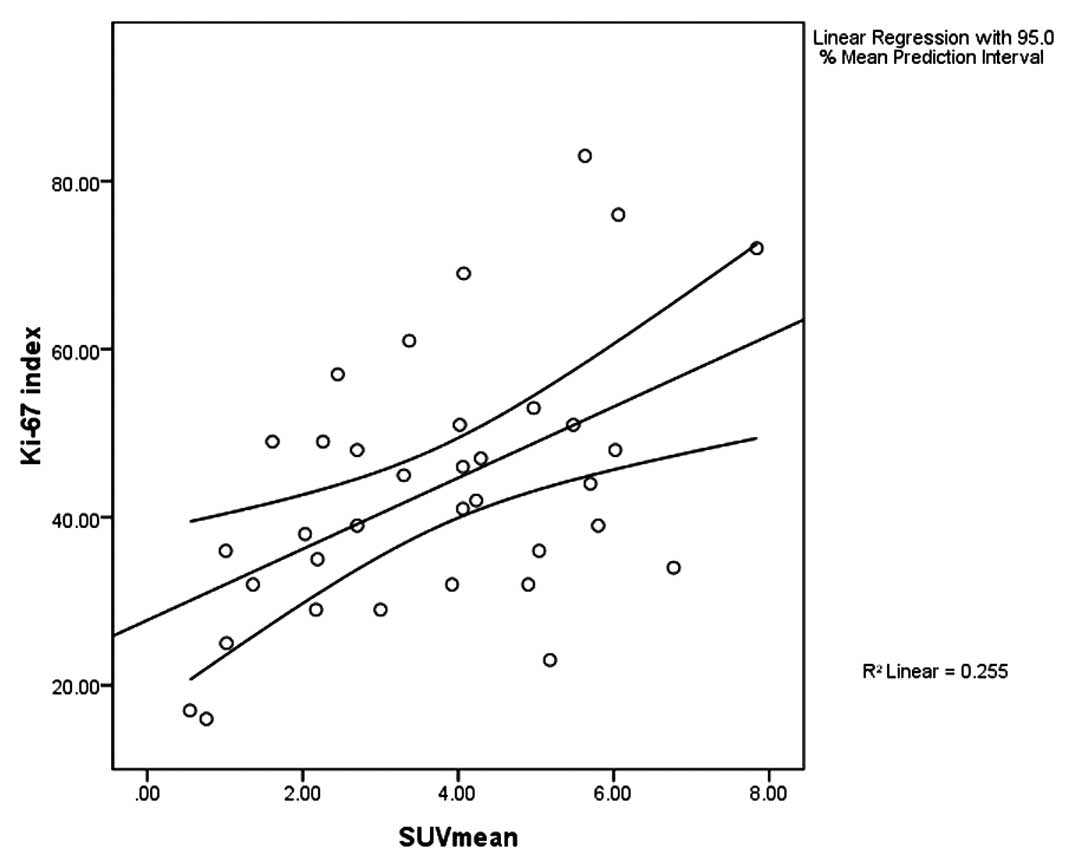
Correlation between Ki-67 index and
SUVmean
The Ki-67 index of 35 malignant patients with
positive PET results are 41.29±15.59% (16%–83%) (Fig. 8). According to the Pearson's
correlation analysis, the Ki-67 index is positively correlated with
the SUVmean (r=0.505, P=0.002) (Fig.
9).
Discussion
CH-PET/CT and CT for detection of
non-small lung cancer (NSCLC)
CT provides precise anatomic details with high
spatial resolution, while PET reflects the rate of the tumor cell
duplication or activity of cell metabolism. PET/CT, combined
together is more useful for diagnosing a disease than either CT or
PET alone. 11C-choline PET has several advantages over
FDG PET. i) Patients do not have to fast before examination; ii)
radiation exposure from 11C-CH is less than that from
18F-FDG because the half life is much shorter (20 vs.
120 min); and ii) less time is required for the examination (20 min
for CH-PET vs. 90 min for FDG PET). However, Choline is still not a
specific tracer for cancer cells. 11C-choline PET also
has the defect of FP and FN results (6,7).
Granuloma cells undergo active proliferation and therefore need
plenty of choline for cell membrane synthesis. In this study, two
of the three FP lesions were tuberculoma and one was an
inflammatory pseudotumor. The metabolism of choline in tumor cells
with high differentiation or low malignant degree is slow. These
types of cancers, such as alveolar cancer, usually appear as FN. In
this study, 2 of the 3 alveolar cancer appeared as FN. As a result
of the high SUV of inflammatory pseudotumors, the low SUV of high
differentiated malignancies and the precise anatomic details
provided by CT and thin-layer CT, the results of our study revealed
that CH-PET is not superior to CT for diagnosing lung cancer.
Diagnosis of metastatic lymph nodes demonstrates the
advantage of using PET-CT (3,8). The
morphological difference between benign and malignant lymph nodes
is not obvious. Standard diagnostic CT depends on the length of the
short diameter of the lymph nodes, that negates a spatial
resolution advantage over CT. The benign lymph nodes are commonly
caused by chronic inflammation and are seldom caused by granuloma
with exuberant metabolism. Thereby PET-CT may distinguish benign
and malignant lymph nodes through radiotracer accumulation.
According to Hara et al(9),
CH-PET may be superior to FDG-PET in diagnosing lymph node
metastasis; however, choline is not a specific cancer tracer.
Especially for granulomatous lymph nodes, owing to the exuberant
metabolism of macrophage, uptake of choline is increased and the
accumulation of the radiotracer in granulomatous lymph nodes
becomes more obvious. This leads to the FP result of choline PET-CT
in the diagnosis of lymph node metastasis. In addition, for small
lymph nodes, especially <0.5 cm in diameter, uptake of the
radiotracer is low, representing a FN result. When comparing a CT
diagnosis of a malignant lymph node when the diameter is <1 cm,
PET-CT possesses a low FN rate and a high NPV. In this study, when
comparing the preoperative N to the pathological N staging, the
accuracy of CH-PET was 83.33% (35/42); 9.52% (4/42) were overstaged
and 7.14% (3/42) were understaged. While the accuracy of CT was
52.38% (22/42), 28.57% (12/42) were overstaged and 19.05% (8/42)
were understaged.
Correlation between CH uptake and the
expression levels of ChoK and PCYT
Choline metabolizes in vivo through three
pathways (10). The first is
phosphorylation. ChoK catalyses the phosphorylation of choline to
produce phosphorylcholine, which is transformed into cytidine
diphosphate choline in the presence of PCYT and cytidine
triphosphate. Finally cytidine diphosphate choline is converted to
phosphatidylcholine (lecithin). ChoK and PCYT are two key enzymes
of choline phosphorylation. The upregulation of both the activity
and expression of these two enzymes promotes lecithin synthesis
which is indispensable for tumor proliferation. The second pathway
is acetylation. Choline acetyltransferase catalyses the reaction of
acetyl coenzyme A with choline to produce acetylcholine. The third
pathway is oxidation. Choline is oxidized to form betaine.
Continuous cell division undergoes phases G1→S→G2→M in order to
complete a proliferation cycle. Lecithin is a necessary component
of the cell membrane. Similar to DNA replication, it takes double
the amount of time to accumulate in order to meet the needs of the
synthesis of cell membrane proliferation (11). The active membrane synthesis of
tumor cells leads to a great amount of choline transformed into
phosphatidylcholine, thus the activity and expression of ChoK are
upregulated correspondingly. The upregulation of ChoK activity
results in the increase of its substrate (choline). These two
factors cause increases in the utilization rate of choline
simultaneously (12). Combined with
choline, 11C accumulates more rapidly in tumor cells
than in normal cells. Therefore, we may distinguish a malignant
from a benign disease through measuring the uptake level of
11C-choline. PCYT is another key enzyme in the
biosynthesis of lecithin and its activity also affects cell
proliferation (13).
In this study, the expression levels of ChoK in 35
lung cancer tissues with positive PET results were upregulated
compared with the normal tissue. This suggests that phosphorylation
of choline in lung cancer tissue with positive PET results is
enhanced. Phosphorylation of choline may be the foundation of
11C-choline PET imaging. Moreover, the expression of
PCYT in lung cancer tissue is also upregulated; thus, illuminating
the enhanced choline phosphorylation.
In the 35 lung cancer tissue with positive PET
results, the expression of ChoK positively correlated with the
SUVmean and PCYT. This suggests that the uptake of choline is
correlated with the metabolism of choline. The acceleration of cell
membrane biosynthesis results in an exuberant metabolism of
choline. Marked with 11C, choline which accumulates in
increased amounts in cancer cells, will be displayed in the PET
images.
In the three benign tissue with positive PET results
(2 tuberculoma and 1 inflammatory pseudotumor), ChoK was
overexpressed. Two (1 tuberculoma and 1 inflammatory pseudotumor)
also displayed an overexpression of PCYT. This may indicate that
choline in the granuloma is at a high metabolic state; thus,
resulting in a FP PET result.
In the seven lung cancer tissues with negative PET
results, there was no overexpression of ChoK or PCYT. The
expression levels of ChoK and PCYT had no significant differences
between 11 benign and the normal tissues. This suggests that the
synthesis of the benign tumor cell membrane is slow and the choline
metabolism is at a low state. A small accumulation of choline in
the cells leads to a FN PET result.
Correlation between CH uptake and Ki-67
expression in lung cancer
Uncontrolled cell proliferation is the primary
hallmark of cancer. The rate of cell division is an important
prognostic characteristic of malignancies, and a number of
important anticancer treatments are aimed specifically at
inhibiting tumor cell growth. A number of studies have demonstrated
that the proliferative activity as determined by the expression
levels of Ki-67 (14,15) are important prognostic factors in
NSCLC, and have found significant correlations between the SUV of
FDG or FLT and Ki-67 proliferation scores (16–18).
It has been reported that FDG uptake is more valuable than Ki-67
expression for predicting the prognosis of patients with resected
NSCLC (19). These differences in
Ki-67 scores are nearly identical, implying that differences in
NSCLC tumor cell proliferation may give rise to commensurate
differences in tumor glucose metabolism (20). Therefore, exploring the correlation
between the proliferative activity of cancer cells through Ki-67
staining and proliferation imaging using CH-PET may be helpful to
further elucidate the mechanism and significance of CH-PET
imaging.
Thirty-five malignancies with positive PET results
displayed a Ki-67 positive expression. The Ki-67 index was
41.29±15.59% (16–83%) Pearson's correlation analysis showed a
positive correlation between Ki-67 and SUVmax (r=0.505, P=0.002).
Our results showed that the elevated uptake of CH in lung cancers,
as assessed by the SUVmean in PET, is correlated with expression of
a cell cycle-related molecular biomarker, Ki-67. Measuring SUV is a
simple and non-invasive method to determine the cancer cell
proliferation potential, which reflects the malignant grade of the
tumor, and the determination of the SUVmean in a primary lesion may
be useful for selecting patients qualified for organ-sparing
limited surgery or radiotherapy for a number of lung cancers.
In conclusion, CH-PET/CT is not superior to CT in
diagnosing pulmonary nodules. For lymph node diagnosis, CH-PET/CT
is superior to CT, offering more accurate staging and assisting in
therapy. There were significant correlations between the SUV of CH
and Ki-67 proliferation scores. A correlation exists between the
mechanism of CH-PET imaging and the expression of Chok and PCTY in
tumor cells.
Acknowledgements
This study was supported by the Science and
Technology Progress Project of Shandong Province (2007GG20002020),
and by the National Natural Science Funds of China (30670581).
References
|
1
|
Detterbeck FC, Falen S, Rivera MP, Halle
JS, Socinski MA, et al: Seeking a home for a PET, part 2: Defining
the appropriate place for positron emission tomography imaging in
the staging of patients with suspected lung cancer. Chest.
125:2300–2308. 2004. View Article : Google Scholar
|
|
2
|
Silvestri GA, Tanoue LT, Margolis ML,
Barker J and Detterbeck F: The noninvasive staging of non-small
cell lung cancer: the guidelines. Chest. 123:S147–S156. 2003.
View Article : Google Scholar : PubMed/NCBI
|
|
3
|
Spaggiari L, Sverzellati N, Versari A,
Paci M, Ferrari G, Nicoli F, et al: Evaluation of N parameter in
the staging of non-small cell lung cancer: role of CT and PET.
Radiol Med. 109:449–459. 2005.PubMed/NCBI
|
|
4
|
Aeker MR and Burrell SC: Utility of
18F-FDG PET in evaluating cancers of lung. J Nucl Med
Technol. 33:69–74. 2005.
|
|
5
|
Shiraki N, Hara M, Ogino H, Shibamoto Y,
Iida A, Tamaki T, Murase T and Eimoto T: False-positive and
true-negative hilar and mediastinal lymph nodes on FDG-PET -
radiological-pathological correlation. Ann Nucl Med. 18:23–28.
2004. View Article : Google Scholar : PubMed/NCBI
|
|
6
|
Hara T, Kosaka N, Suzuki T, Kudo K and
Niino H: Uptake rates of 18F-fluorodeoxyglucose and
11C-choline in lung cancer and pulmonary tuberculosis: a
positron emission tomography study. Chest. 124:893–901. 2003.
|
|
7
|
Tian M, Zhang H, Oriuchi N, et al:
Comparison of 11C-choline PET and FDG PET for the
differential diagnosis of malignant tumors. Eur J Nucl Med Mol
Imaging. 31:1064–1072. 2004.
|
|
8
|
Konishi J, Yamazaki K, Tsukamoto E, Tamaki
N, Onodera Y, Otake T, Morikawa T, Kinoshita I, Dosaka-Akita H and
Nishimura M: Mediastinal lymph node staging by FDG-PET in patients
with non-small cell lung cancer: analysis of false-positive FDG-PET
findings. Respiration. 70:500–506. 2003. View Article : Google Scholar : PubMed/NCBI
|
|
9
|
Hara T, Inagaki K, Kosaka N and Morita T:
Sensitive detection of mediastinal lymph node metastasis of lung
cancer with 11C-choline PET. J Nucl Med. 41:1507–1513.
2000.PubMed/NCBI
|
|
10
|
Roivainen A, Forsback S, Gronroos T, et
al: Blood metabolism of [methyl-11C]choline;
implications for in vivo imaging with positron emission tomography.
Eur J Nucl Med. 27:25–32. 2000.
|
|
11
|
Golfman LS, Bakovic M and Vance E:
Transcription of the CTP: phosphocholine cytidylyltransferase alpha
gene is enhanced during the S phase of the cell cycle. J Biol Chem.
276:43688–43692. 2001. View Article : Google Scholar : PubMed/NCBI
|
|
12
|
Janardhan S, Srivani P and Sastry GN:
Choline kinase: an important target for cancer. Curr Med Chem.
13:1169–1186. 2006. View Article : Google Scholar : PubMed/NCBI
|
|
13
|
Agassandian M, Zhou J, Tephly LA, et al:
Oxysterols inhibit phosphatidylcholine synthesis via ERKdocking and
phosphorylation of CTP:phosphocholine cytidylyltransferase. J Biol
Chem. 280:21577–21587. 2005. View Article : Google Scholar
|
|
14
|
Martin B, Paesmans M, Mascaux C, et al:
Ki-67 expression and patients survival in lung cancer: systematic
review of the literature with meta-analysis. Br J Cancer.
91:2018–2025. 2004. View Article : Google Scholar : PubMed/NCBI
|
|
15
|
Nakamura H, Hirata T, Kitamura H and
Nishikawa J: Correlation of the standardized uptake value in
FDG-PET with the expression level of cell-cycle-related molecular
biomarkers in resected non-small cell lung cancers. Ann Thorac
Cardiovasc Surg. 15:304–310. 2009.PubMed/NCBI
|
|
16
|
Yamamoto Y, Nishiyama Y, Ishikawa S,
Nakano J, Chang SS, Bandoh S, Kanaji N, Haba R, Kushida Y and
Ohkawa M: Correlation of 18F-FLT and 18F-FDG
uptake on PET with Ki-67 immunohistochemistry in non-small cell
lung cancer. Eur J Nucl Med Mol Imaging. 34:1610–1616. 2007.
|
|
17
|
Takenaka T, Yano T, Ito K, Morodomi Y,
Miura N, Kawano D, Shoji F, Abe K, Honda H and Maehara Y:
Biological significance of the maximum standardized uptake values
on positron emission tomography in non-small cell lung cancer. J
Surg Oncol. 100:688–692. 2009. View Article : Google Scholar : PubMed/NCBI
|
|
18
|
Han B, Lin S, Yu LJ, Wang RZ and Wang YY:
Correlation of 18F-FDG PET activity with expressions of
survivin, Ki67, and CD34 in non-small-cell lung cancer. Nucl Med
Commun. 30:214–219. 2009.
|
|
19
|
Nguyen XC, Lee WW, Chung JH, Park SY, Sung
SW, Kim YK, So Y, Lee DS, Chung JK, Lee MC and Kim SE: FDG uptake,
glucose transporter type 1, and Ki-67 expressions in non-small-cell
lung cancer: correlations and prognostic values. Eur J Radiol.
62:214–219. 2007. View Article : Google Scholar : PubMed/NCBI
|
|
20
|
Vesselle H, Salskov A, Turcotte E, Wiens
L, Schmidt R, Jordan CD, Vallières E and Wood DE: Relationship
between non-small cell lung cancer FDG uptake at PET, tumor
histology, and Ki-67 proliferation index. J Thorac Oncol.
3:971–978. 2008. View Article : Google Scholar : PubMed/NCBI
|