Introduction
Esophageal squamous cell carcinoma (ESCC) is one of
the most common types of cancer worldwide. In China, ESCC remains
one of the leading causes of cancer-related mortality in some
high-risk areas. According to the data from the disease control and
prevention center of Jiangsu Province, cancer was the leading cause
of mortality for Jiangsu inhabitants in 2007, and esophageal cancer
ranked the first cause of cancer-related mortality (1). Moreover, the disease is very often
diagnosed at advanced stages, resulting in poor prognosis. Despite
significant investment and advances in the treatment of the
disease, the overall survival for advanced and metastatic cancer
remains dismal, with a 5-year survival rate of less than 30%
(2). To improve the situation,
there is an urgent need for novel and reliable biomarkers for ESCC.
Huaian in China is an area with high ESCC morbidity and mortality
rates. The specific genes of the population in this area and
geographical environment may bring some distinguishing features of
ESCC.
In recent years, several studies have confirmed that
aberrant expression of miRNAs may be involved in the initiation and
progression of human cancer (3).
microRNAs (miRNAs) are a class of small (18–22 nt) non-coding RNA
molecules which can regulate gene expression at the
post-transcriptional level by targeting mRNAs, and inhibit the
translation and/or degrade the mRNAs (4). Accumulating evidence indicates that
the dysregulation of miRNAs may be a key event in human cancer
(5–8). miRNA expression profiles could be used
for the prediction of cancer risk, as well as for the early
diagnosis, histologic classification and prognosis prediction,
mainly because miRNAs are highly conservative and tissue-specific
(9). There have already been some
studies on miRNA expression profiles in Barrett’s esophagus and
esophageal adenocarcinoma (10,11).
However, there is little information on miRNA profiles in ESCC. In
the present study, differential expression profiles of miRNAs in
ESCC in the Huaian population were determined with tumor tissues
and adjacent non-tumor tissues from 138 newly diagnosed
patients.
Materials and methods
Specimen collection and ethics
statement
Three male patients aged 61, 71 and 62 were
recruited for miRNA microarray analysis, and 138 patients,
including 95 males and 43 females aged between 40–83 years, were
recruited for quantitative RT-PCR analysis from the First People’s
Hospital of Huaian between 2009 and 2010, with their consent and
agreement. During the recruitment, each patient was interviewed
using a structured questionnaire, including demographic data and
epidemiological behavior such as dietary habits, smoking status and
alcohol consumption. All patients were confirmed by pathology or
endoscopy as ESCC without preoperative radiotherapy or
chemotherapy. Esophageal cancer tissues and adjacent non-tumor
tissues were obtained from surgical specimens immediately after
resection from patients. The adjacent non-tumor esophageal
epithelium was located at least 5 cm away from tumor edge. Tissue
samples (0.5 cm3) were immersed in RNA locker (Tiandz,
China) at 4°C overnight and stored at −20°C until use. This study
was approved by the institutional review board ‘IRB of Southeast
University Affiliated Zhongda Hospital’ in Nanjing, China. The
design of the esophageal cancer study, including the tissue sample
collection, was approved by the IRB.
RNA isolation
Total-RNA was extracted from both the esophageal
cancer tissues and adjacent non-tumor esophageal epithelium using
TRIzol reagent (Invitrogen, USA) according to the instructions.
Concentration and integrity of extracted RNA was assessed using a
NanoDrop 1000 spectrophotometer (NanoDrop Technologies, USA).
Finally, the total-RNA integrity was checked by denaturing agarose
gel electrophoresis.
miRNA microarray
Three pairs of esophageal cancer samples were
collected for microarray analysis. Agilent human miRNA microarray
(V12.0, Agilent, USA) was used in this study. Samples of miRNA from
6 esophageal specimens were labeled and hybridized with the miRNA
Complete Labeling and Hybridization kit (Agilent) according to the
manufacturer’s protocol. Signals were normalized using the median
center tool for genes. Statistical analysis of ANOVA was used to
compare the differentially expressed miRNAs.
Quantitative reverse transcription
PCR
In this study, U6 was chosen as the endogenous
standard. Reverse transcription reactions were conducted in two
steps. First, the mixture containing 0.5 μg of RNA samples, 1 μl
miRNA-specific stem-loop RT primers (RiboBio, China) and RNase-free
water (Tiangen, China) was incubated in a 96-well plate for 10 min
at 70°C and held at 4°C. Then, the 12.5 μl mixture which comprised
5.5 μl RT product (obtained from the front), 2.5 μl 5× RT buffer
(Promega, USA), 1 μl dNTPs (2.5 mM) (Tiangen, China), 0.25 μl MMLV
reverse transcriptase (200 U/μl) (Promega, USA), 0.25 μl
ribonuclease inhibitor (40 U/μl) (Fermentas, Canada), and 3 μl
ddH2O was incubated in a 96-well plate for 1 h at 42°C,
for 10 min at 70°C and subsequently held at 4°C.
Real-time PCR was carried out to detect the
expression levels of candidate miRNAs with the ABI 7300 Real-Time
PCR System (Applied Biosystems, USA). qRT-PCR was then performed
using SYBR® Green Real-time PCR Master Mix-Plus (Toyobo,
Japan) according to the manufacturer’s protocol. The PCR reaction
components were 1 μl of cDNA, 4.5 μl of SYBR-Green PCR Master mix,
5 mmol/l PCR primers (RiboBio, China) and RNase-free water. The
reaction was performed at 95°C for 5 min, followed by 40 cycles of
95°C for 15 sec, 60°C for 30 sec and 72°C for 30 sec. Dissociation
curve was analyzed from 60 to 99°C.
Data analysis
Data analyses were performed using the SPSS, version
18.0. P<0.05 was considered to indicate statistically
significant differences. We applied the paired t-test and
conditional logistic regression analysis to determine the
statistical differences between tumor tissues and adjacent
non-tumor tissues. miRNA expression was calculated using the
2-ΔΔCt method (12),
where ΔCt = (CtmiRNA - Ctu6) and ΔΔCt =
ΔCttumor tissues - ΔCtadjacent non-tumor
tissues. The threshold cycle (12) indicates the fractional cycle number
at which the amount of amplified target reaches a fixed threshold
and the Ct value is negatively correlated with copy numbers
(12). Thus, in the final
calculation, the Ct values are multiplied with −1 for logistic
regression analysis. Student’s t-test analysis and analysis of
variance (ANOVA) were applied to determine the differences of miRNA
expression in different environmental factors.
Results
Screening of candidate miRNAs by miRNA
microarray
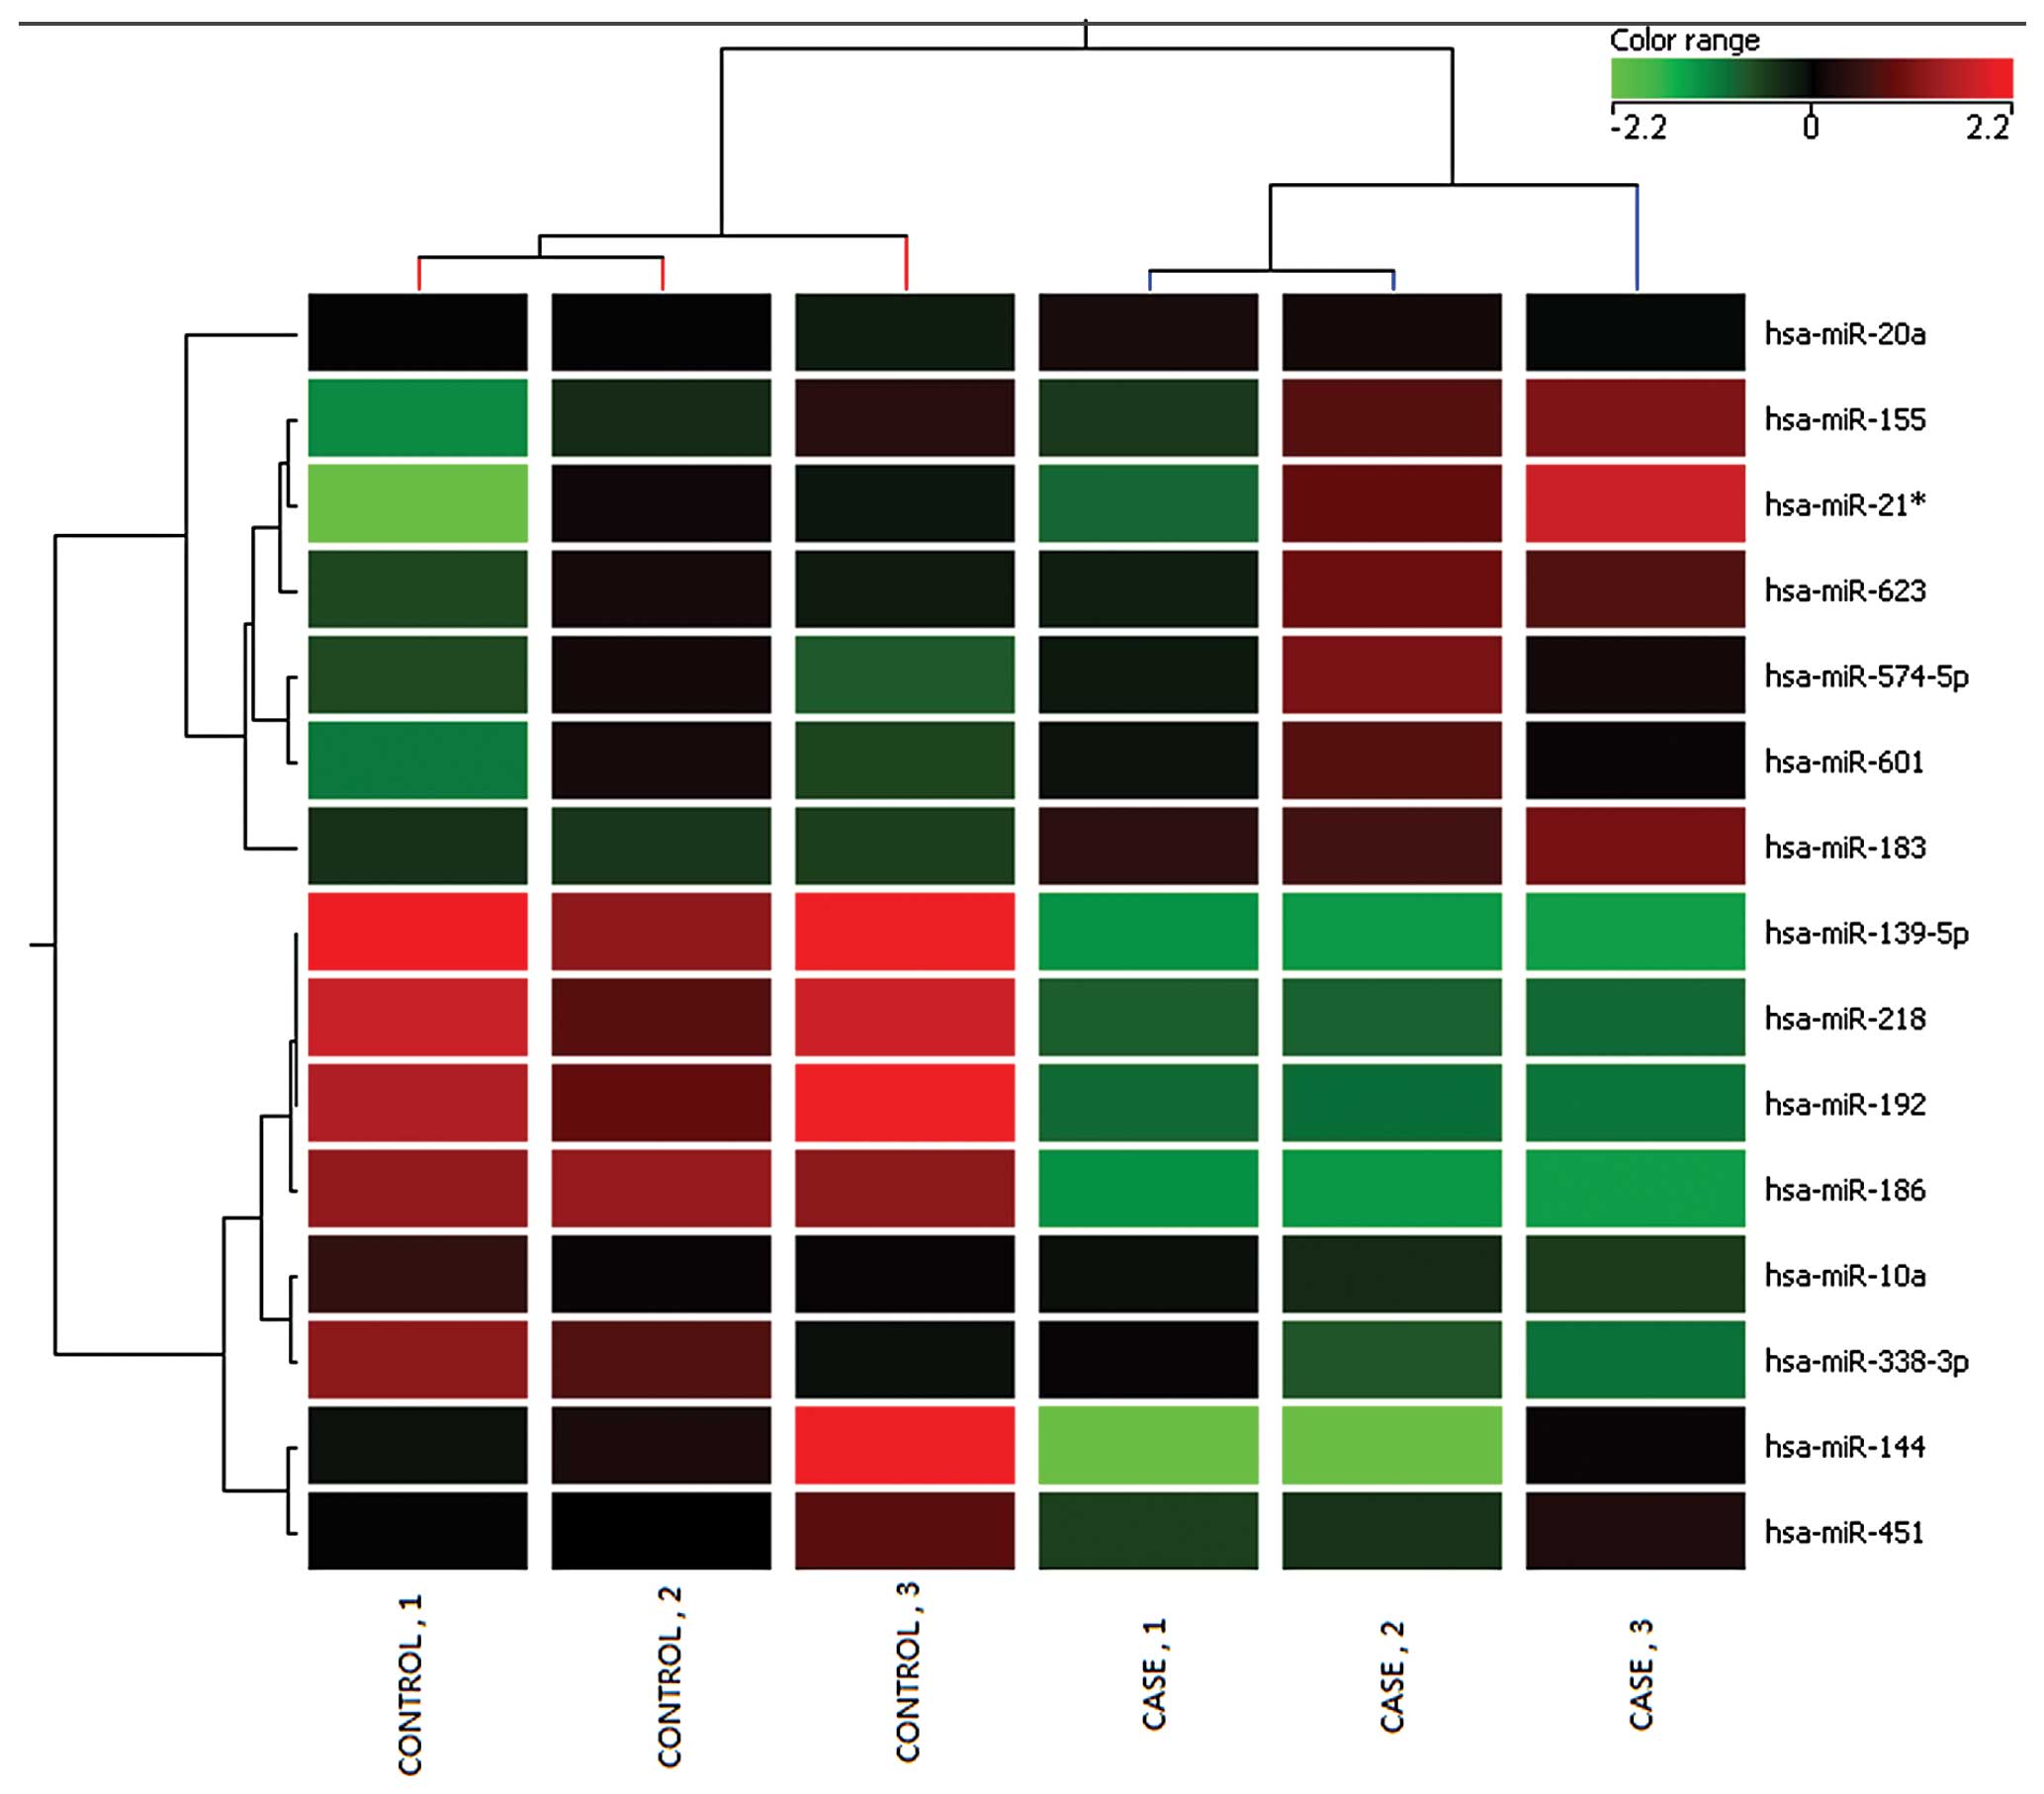
Microarray analysis identified 15 miRNAs that could
distinguish the malignant esophageal cancer lesions from the
adjacent non-tumor tissues. A total of 7 miRNAs were found
overexpressed in tumor tissues (hsa-miR-20a, hsa-miR-155,
hsa-miR-574-5p, hsa-miR-21*, hsa-miR-183, hsa-miR-601 and
hsa-miR-623). Whereas, hsa-miR-186, hsa-miR-l0a, hsa-miR-144,
hsa-miR-338-3p, hsa-miR-192, hsa-miR-218, hsa-miR-451,
hsa-miR-139-5p were found downregulated (Table I). Cluster analysis, based on the
differentially expressed miRNAs, successfully separated the tumor
tissues from the adjacent non-tumor tissues (Fig. 1). The analysis showed the chips in
each case were consistent.
 | Table IDifferential expression of miRNAs in
ESCC tumor tissues vs. non-tumor tissues by microarray. |
Table I
Differential expression of miRNAs in
ESCC tumor tissues vs. non-tumor tissues by microarray.
| Systematic
name | P-value | Fold-change | Regulation |
|---|
| hsa-miR-20a | 0.008602 | 1.123039 | Up |
| hsa-miR-155 | 0.02269 | 1.829959 | Up |
| hsa-miR-574-5p | 0.036782 | 1.716395 | Up |
| hsa-miR-21* | 0.049597 | 2.597901 | Up |
| hsa-miR-183 | 0.035308 | 2.250472 | Up |
| hsa-miR-601 | 0.020643 | 1.673934 | Up |
| hsa-miR-623 | 0.045492 | 1.635291 | Up |
| hsa-miR-139-5p | 0.01244 | 9.728012 | Down |
| hsa-miR-10a | 0.00732 | 1.424195 | Down |
| hsa-miR-144 | 0.039268 | 13.40895 | Down |
| hsa-miR-338-3p | 0.019786 | 2.29184 | Down |
| hsa-miR-192 | 0.02489 | 5.695984 | Down |
| hsa-miR-218 | 0.021029 | 4.956112 | Down |
| hsa-miR-451 | 0.004967 | 1.425921 | Down |
| hsa-miR-186 | 9.79E-05 | 6.050884 | Down |
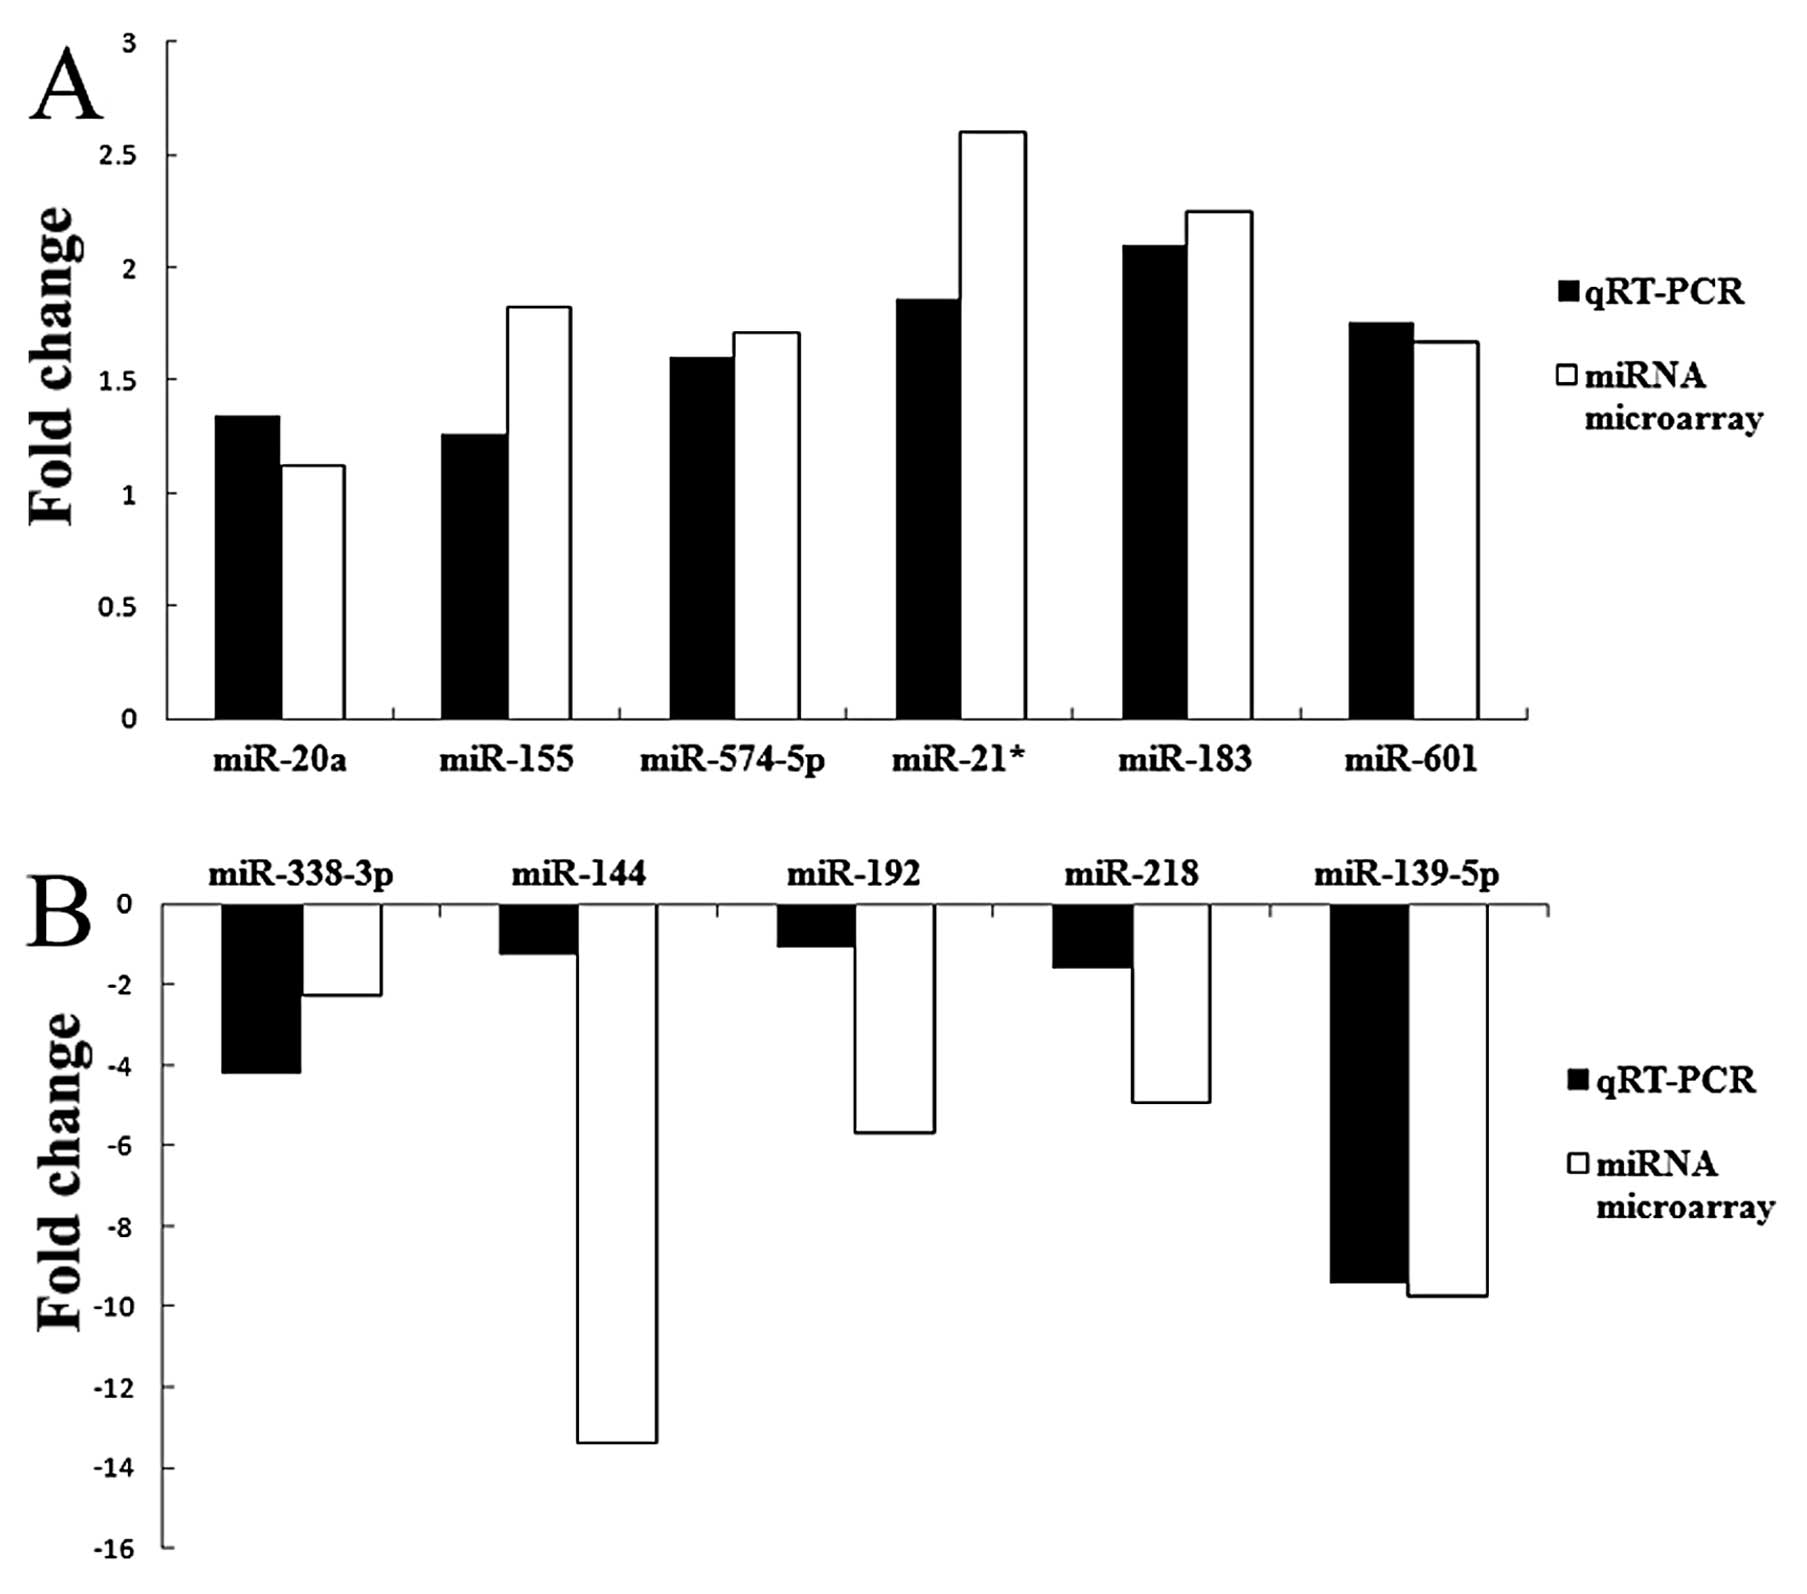
Validation of microarray data by
quantitative RT-PCR analysis
To confirm the microarray results, we performed
quantitative RT-PCR analysis on larger samples. The expression data
obtained by quantitative RT-PCR analysis were comparable to the
results observed in the microarray analysis. The results of
hsa-miR-338-3p, hsa-miR-144, hsa-miR-192, hsa-miR-218 and
hsa-miR-139-5p showed the consistency of the downregulation
compared with microarray, while hsa-miR-20a, hsa-miR-155,
hsa-miR-574-5p, hsa-miR-183, hsa-miR-21* and hsa-miR-601 showed the
consistency of upregulation. The histogram (Fig. 2) is shown with the fold-changes of
real-time RT-PCR (2−ΔΔCt) and miRNA microarray. The
consistency of microarray and real-time RT-PCR confirmed the
reliability of the results.
Differential expression of miRNAs between
the tumor tissues and the adjacent non-tumor tissues
We applied the paired t-test to assess the
differences between the tumor tissues and the adjacent non-tumor
tissues shown in Table II. The
results showed that hsa-miR-139-5p, hsa-miR-218 and hsa-miR-338-3p
(fold-change = 0.106, 0.623, 0.239, respectively) were
downregulated in tumor tissues when compared with adjacent
non-tumor tissues, while hsa-miR-21*, hsa-miR-574-5p, hsa-miR-183
and hsa-miR-601 (fold-change = 1.863, 1.603, 2.096, 1.763,
respectively) were upregulated in tumor tissues.
| Table IIRelative expression of miRNAs in
esophageal cancer and non-tumor tissues. |
Table II
Relative expression of miRNAs in
esophageal cancer and non-tumor tissues.
| miRNA | Group | N | Mean ± SD of
ΔCt | ΔΔCta (mean ± SD) |
2−ΔΔCt | P-value | t-value |
|---|
| hsa-miR-21* | Tumor tissues | 138 | 10.185±2.935 | −0.890±3.878 | 1.863 | 0.008 | −2.697 |
| Adjacent non-tumor
tissues | 138 | 11.076±2.808 | | | | |
| hsa-miR-139-5p | Tumor tissues | 137 | 8.320±3.676 | 3.239±4.073 | 0.106 | <0.01b | 9.308 |
| Adjacent non-tumor
tissues | 137 | 5.080±3.139 | | | | |
| hsa-miR-155 | Tumor tissues | 127 | 4.313±3.374 | −0.337±4.086 | 1.263 | 0.354 | 0.931 |
| Adjacent non-tumor
tissues | 127 | 4.650±3.254 | | | | |
| hsa-miR-218 | Tumor tissues | 128 | 9.422±2.839 | 0.683±3.869 | 0.623 | 0.048b | 1.996 |
| Adjacent non-tumor
tissues | 128 | 8.739±3.061 | | | | |
| hsa-miR-574-5p | Tumor tissues | 137 | 3.791±3.580 | −0.681±3.613 | 1.603 | 0.029b | 2.205 |
| Adjacent non-tumor
tissues | 137 | 4.471±2.675 | | | | |
| hsa-miR-192 | Tumor tissues | 130 | 5.931±3.132 | 0.113±3.664 | 0.925 | 0.726 | 0.351 |
| Adjacent non-tumor
tissues | 130 | 5.818±2.258 | | | | |
| hsa-miR-338-3p | Tumor tissues | 138 | 7.983±3.249 | 2.066±3.625 | 0.239 | <0.01b | 6.694 |
| Adjacent non-tumor
tissues | 138 | 5.918±2.443 | | | | |
| hsa-miR-144 | Tmor tissues | 138 | 13.876±3.967 | 0.326±4.185 | 0.798 | 0.362 | 0.914 |
| Adjacent non-tumor
tissues | 138 | 13.550±2.831 | | | | |
| hsa-miR-183 | Tumor tissues | 138 | 11.483±2.959 | −1.068±4.000 | 2.096 | 0.002b | 3.136 |
| Adjacent non-tumor
tissues | 138 | 12.551±3.218 | | | | |
| hsa-miR-601 | Tumor tissues | 131 | 1.882±3.263 | −0.817±2.721 | 1.763 | 0.001b | 3.441 |
| Adjacent non-tumor
tissues | 131 | 2.670±2.481 | | | | |
| hsa-miR-623 | Tumor tissues | 120 | 3.272±3.726 | 0.252±2.643 | 0.840 | 0.299 | 1.043 |
| Adjacent non-tumor
tissues | 120 | 2.829±3.833 | | | | |
| hsa-miR-186 | Tumor tissues | 134 | 0.732±2.762 | −0.532±3.256 | 1.446 | 0.061 | 1.891 |
| Adjacent non-tumor
tissues | 134 | 1.264±2.831 | | | | |
| hsa-miR-20a | Tumor tissues | 122 | 4.656±3.156 | −0.423±3.937 | 1.341 | 0.237 | 1.187 |
| Adjacent non-tumor
tissues | 122 | 5.079±3.094 | | | | |
Association between candidate miRNAs and
the risk of ESCC
Conditional logistic regression analysis was used to
evaluate the association between differentially expressed miRNAs
and the risk of esophageal cancer. As shown in Table III, significantly increased risk
for esophageal cancer was associated with reduced expression of
hsa-miR-139-5p and hsa-miR-338-3p (OR=0.599, 0.720, respectively)
and increased expression of hsa-miR-21*, hsa-miR-574-5p,
hsa-miR-183, hsa-miR-601 (OR=1.135, 1.113, 1.142, 1.492,
respectively). This suggested that hsa-miR-21*, hsa-miR-574-5p,
hsa-miR-183, hsa-miR-601 may function as oncogenes, while
hsa-miR-139-5p and hsa-miR-338-3p might act as tumor
suppressors.
| Table IIIAberrant expression of miRNAs
associated with a high risk of ESCC by conditional logistic
regression analysis. |
Table III
Aberrant expression of miRNAs
associated with a high risk of ESCC by conditional logistic
regression analysis.
| miRNA | Group | β | SE | Wald | P-value | OR | 95% CI |
|---|
| hsa-miR-21* | Tumor tissues | 0.126 | 0.049 | 6.643 | 0.010a | 1.135 | 1.031–1.249 |
| Adjacent non-tumor
tissues | 1.000 | | | | | |
| hsa-miR-139-5p | Tumor tissues | −0.512 | 0.084 | 37.006 | 0.000a | 0.599 | 0.508–0.707 |
| Adjacent non-tumor
tissues | 1.000 | | | | | |
| hsa-miR-155 | Tumor tissues | 0.041 | 0.045 | 0.850 | 0.357 | 1.042 | 0.955–1.137 |
| Adjacent non-tumor
tissues | 1.000 | | | | | |
| hsa-miR-218 | Tumor tissues | −0.094 | 0.048 | 3.732 | 0.053 | 0.911 | 0.828–1.001 |
| Adjacent non-tumor
tissues | 1.000 | | | | | |
| hsa-miR-574-5p | Tumor tissues | 0.107 | 0.050 | 4.510 | 0.034a | 1.113 | 1.008–1.228 |
| Adjacent non-tumor
tissues | 1.000 | | | | | |
| hsa-miR-192 | Tumor tissues | −0.017 | 0.048 | 0.125 | 0.724 | 0.983 | 0.894–1.081 |
| Adjacent non-tumor
tissues | 1.000 | | | | | |
| hsa-miR-338-3p | Tumor tissues | −0.329 | 0.065 | 25.987 | 0.000a | 0.720 | 0.634–0.817 |
| Adjacent non-tumor
tissues | 1.000 | | | | | |
| hsa-miR-144 | Tumor tissues | −0.038 | 0.041 | 0.834 | 0.361 | 0.963 | 0.889–1.044 |
| Adjacent non-tumor
tissues | 1.000 | | | | | |
| hsa-miR-183 | Tumor tissues | 0.133 | 0.045 | 8.737 | 0.003a | 1.142 | 1.046–1.247 |
| Adjacent non-tumor
tissues | 1.000 | | | | | |
| hsa-miR-601 | Tumor tissues | 0.400 | 0.110 | 13.221 | 0.000a | 1.492 | 1.203–1.852 |
| Adjacent non-tumor
tissues | 1.000 | | | | | |
| hsa-miR-623 | Tumor tissues | −1.010 | 0.080 | 1.593 | 0.207 | 0.904 | 0.773–1.058 |
| Adjacent non-tumor
tissues | 1.000 | | | | | |
| hsa-miR-186 | Tumor tissues | 0.102 | 0.055 | 3.394 | 0.065 | 1.107 | 0.994–1.234 |
| Adjacent non-tumor
tissues | 1.000 | | | | | |
| hsa-miR-20a | Tumor tissues | 0.055 | 0.047 | 1.379 | 0.240 | 1.057 | 0.964–1.159 |
| Adjacent non-tumor
tissues | 1.000 | | | | | |
Multiple regression analysis was used to determine
the association between the differentially expressed miRNAs
(hsa-miR-139-5p, hsa-miR-338-3p, hsa-miR-21*, hsa-miR-574-5p,
hsa-miR-183 and hsa-miR-601) which showed significance in logistic
regression analysis and the risk of esophageal cancer. The results
revealed that hsa-miR-601 and hsa-miR-574-5p were positively
associated with increased risk of ESCC (OR=1.191, 2.079,
respectively), whereas hsa-miR-338-3p and hsa-miR-139-5p were
negatively associated with increased risk of ESCC (OR=0.455, 0.499,
respectively) (Table IV).
| Table IVAberrant expression of miRNAs
associated with a high risk of ESCC by multiple regression
analysis. |
Table IV
Aberrant expression of miRNAs
associated with a high risk of ESCC by multiple regression
analysis.
| Variables | β | SE | Wald | P-value | OR | 95% CI |
|---|
| hsa-miR-338-3p | −0.788 | 0.171 | 21.180 | 0.000 | 0.455 | 0.325–0.636 |
| hsa-miR-139-5p | −0.695 | 0.183 | 14.352 | 0.000 | 0.499 | 0.349–0.715 |
| hsa-miR-574-5p | 0.732 | 0.165 | 19.627 | 0.000 | 2.079 | 1.504–2.873 |
| hsa-miR-601 | 0.174 | 0.086 | 4.108 | 0.043 | 1.191 | 1.006–1.409 |
Environmental factors and miRNA
expression
We then analyzed the association between miRNA
expression and environmental factors of ESCC patients including
tobacco smoking, alcohol consumption and drinking water source. As
shown in Table V, the results
revealed that hsa-miR-21*was associated with alcohol consumption.
High expression of hsa-miR-21* was prone to be observed in heavy
drinking patients compared with non-drinkers or occasional drinkers
(P=0.046).
| Table VCorrelation between the expression of
miRNAs and environmental factors in ESCC patients. |
Table V
Correlation between the expression of
miRNAs and environmental factors in ESCC patients.
| Smoking index (mean
± SD) | Alcohol consumption
(mean ± SD) | Water (mean ±
SD) |
|---|
|
|
|
|
|---|
| miRNA | <400 | ≥400 | P-value | None | Occasional | Often | P-value | Running water | Other types | P-value |
|---|
| hsa-miR-623 | 0.383±2.07 | −0.268±2.40 | 0.152 | 0.351±2.09 | −1.18±4.90 | 0.823±3.99 | 0.218 | 0.0155±0.344 | 0.552±3.74 | 0.524 |
| hsa-miR-601 | −0.612±3.51 | −0.849±1.50 | 0.673 | −0.637±3.65 | −1.38±1.79 | −0.795±1.36 | 0.679 | −0.882±1.45 | −0.762±3.06 | 0.859 |
| hsa-miR-574-5p | −0.653±3.67 | −0.479±3.79 | 0.805 | 0.0143±3.50 | −2.19±3.64 | −1.10±3.67 | 0.062 | −1.17±3.13 | −0.448±3.75 | 0.381 |
| hsa-miR-218 | 1.12±3.97 | 0.29±3.16 | 0.252 | 0.881±4.20 | 0.075±3.09 | 0.676±3.70 | 0.792 | 0.854±4.052 | 0.676±3.86 | 0.844 |
| hsa-miR-192 | 0.0896±3.97 | 0.355±3.31 | 0.716 | 0.299±3.92 | −1.11±2.05 | 0.229±3.67 | 0.441 | 0.643±3.25 | 0.0861±3.81 | 0.526 |
| hsa-miR-186 | −1.018±4.205 | −1.26±3.46 | 0.747 | −0.455±4.11 | −2.27±3.77 | 1.56±3.62 | 0.147 | −1.35±3.25 | −0.968±4.10 | 0.668 |
| hsa-miR-183 | −1.57±4.07 | −0.402±3.77 | 0.123 | −0.772±4.05 | −3.28±4.00 | −1.15±3.60 | 0.093 | −1.14±3.85 | −1.07±4.04 | 0.939 |
| hsa-miR-155 | 0.076±4.40 | −0.696±3.38 | 0.327 | 0.185±4.62 | −1.84±3.05 | −0.601±3.59 | 0.232 | 0.491±2.64 | −0.53±4.47 | 0.295 |
| hsa-miR-144 | 0.396±4.42 | 0.725±3.51 | 0.670 | 0.799±4.16 | −1.00±3.98 | 0.137±4.30 | 0.330 | 0.107±4.11 | 0.417±4.23 | 0.745 |
| hsa−miR-139-5p | 3.40±4.02 | 3.06±4.45 | 0.670 | 3.93±4.45 | 3.34±4.08 | 2.33±3.50 | 0.098 | 1.89±4.62 | 3.52±3.99 | 0.089 |
| hsa-miR-21* | −0.388±4.12 | −1.61±3.68 | 0.102 | −0.0745±4.05 | −2.01±3.63 | −1.60±3.40 | 0.046 | −0.119±3.95 | −1.04±3.79 | 0.286 |
| hsa-miR-20a | −0.263±5.02 | −1.22±4.10 | 0.309 | −0.0325±4.70 | −1.68±5.10 | −1.06±4.17 | 0.339 | 0.619±3.78 | −0.804±4.72 | 0.207 |
| hsa-miR-338-3p | 2.37±3.67 | 1.87±3.67 | 0.470 | 2.42±3.62 | 0.56±3.77 | 2.12±3.57 | 0.221 | 2.77±3.45 | 1.93±3.71 | 0.316 |
Discussion
miRNAs have been studied extensively in recent years
for their involvement in tumorigenesis and their potential as
biomarkers in the diagnosis, prognosis and treatment of cancer
(13). Chen et al(14) analyzed the expression profile of
serum miRNAs in 400 non-small cell lung cancer (NSCLC) cases and
220 controls and identified 10 miRNAs as potential markers for
early diagnosis of NSCLC. Hu et al(15) assayed the expression of 10 miRNAs in
10 esophageal cancer cell lines and 158 tissue specimens and found
that miR-30e and miR-16–2 were associated with overall and
disease-free survival. Wiggins et al(16) evaluated miRNA replacement therapy of
miR-34a in lung tumors in mice. These studies provide sound
evidence that altered miRNAs could be reliable biomarkers for the
early detection and prognosis prediction of cancer.
To date, there have already been published data on
miRNA profiles in esophageal cancer. In a previous study, Guo et
al(17) revealed that 46 miRNAs
expressed differently in 31 pairs of cryopreserved ESCC tissues and
non-tumor tissues using miRNA microarray techniques and 7 of them
could distinguish tumor tissues from non-tumor tissues. Ogawa et
al(18) analyzed the expression
of 73 miRNAs in 30 pairs of ESCC tumor and adjacent non-tumor
tissues by RT-PCR, and they found that the high expression of
miR-129 was associated with shorter postoperative survival. Feber
et al(19) reported that in
35 frozen specimens (10 adenocarcinoma, 10 squamous cell carcinoma,
9 normal epithelium, 5 Barrett esophagus, and 1 high-grade
dysplasia) several differentially expressed miRNAs could
distinguish different esophageal histologic types and also
discriminate tumor from normal esophageal tissues in both
adenocarcinoma and squamous cell carcinoma. These studies indicate
that specific miRNA profiles of ESCC may bring breakthroughs to the
diagnosis and treatment of ESCC.
We analyzed the expression of 13 miRNAs in 138 pairs
of tumor tissues and adjacent non-tumor tissues by using
quantitative RT-PCR. Among them, hsa-miR-338-3p, hsa-miR-218 and
hsa-miR-139-5p were downregulated in tumor tissues vs. adjacent
non-tumor tissues, whereas hsa-miR-183, hsa-miR-574-5p, hsa-miR-21*
and hsa-miR-601 were upregulated in tumor tissues.
hsa-miR-139-5p, hsa-miR-218 and hsa-miR-338-3p
downregulated in the present study were found as tumor suppressors
in several studies. hsa-miR-139-5p has previously been described as
downregulated in many types of cancer, including gastric cancer,
renal tumors and endometrial serous adenocarcinomas and bladder
cancer (20–23). It has been proposed that
hsa-miR-139-5p may have various functions in different types of
cancer. Hiroki et al(22)
showed the lower expression of hsa-miR-139-5p was significantly
correlated with poor overall survival in endometrial serous
adenocarcinoma. Miles et al(24) suggested a direct causal
dysregulation of TOP2A by hsa-miR-139-5p, and TOP2A may be a drug
target in ovarian cancer. In addition, the tumor suppressor
function of hsa-miR-139-5p being epigenetically silenced by
enhancer of zeste homolog 2 (EZH2) may lead to liver cancer
metastasis (25). hsa-miR-218 is
also found to be a tumor suppressor in cervical, bladder and
gastric cancer (26–28). hsa-miR-338-3p was considered to
suppress cell invasion by targeting the smoothened gene in liver
cancer (29). hsa-miR-338-3p was
also found aberrantly expressed in pancreatic neoplasias (30).
A miRNA upregulated in cancer may act as an
oncogene. hsa-miR-183, hsa-miR-574-5p, hsa-miR-21* and hsa-miR-601
were upregulated in tumor tissues compared with adjacent non-tumor
tissues in the present study. hsa-miR-574-5p was found increased in
lung cancer tissues compared with controls (31) which is consistent with our findings.
Yao et al(32) showed that
hsa-miR-601 was highly expressed in gastric cancer compared to
normal gastric tissues. hsa-miR-601 negatively regulated the
Fas-induced apoptosis pathway (33), which may be one of the reasons for
its oncogene-like functions. The overexpression of hsa-miR-183
inhibited the migration of breast cancer cells (34). The upregulation trend was also
observed in prostate carcinoma, hepatocellular carcinoma and
colorectal cancer (35–37). hsa-miR-183 has been reported to
promote tumor cell migration by targeting EGR1, a tumor suppressor
gene (38). Li et
al(39) confirmed hsa-miR-183
targeted integrin β1 (ITGB1). ITGB1 is known to play a major role
in the development of several tissues and organs (40,41).
These studies suggest that hsa-miR-183 is an oncogene that plays
different roles in different types of cancer.
miRNA microarray revealed upregulation of
hsa-miR-20a and hsa-miR-155, whereas, hsa-miR-192 and hsa-miR-144
were downregulated. However, they did not show statistical
differences in quantitative RT-PCR. Since tumor tissues in this
study were matched with adjacent non-tumor tissues instead of
normal tissues, some early lesions might be confounded into normal
tissues, which brought slight differences of miRNA expression
levels between the tumor and the non-tumor tissue group. Although
these miRNAs were not identified in our study, they may still play
important roles in cancer, according to numerous other studies.
hsa-miR-20a has been reported to act as a tumor suppressor by
targeting and reducing E2F1 levels, and the E2F family of
transcription factors is essential in the regulation of the cell
cycle and apoptosis (42).
hsa-miR-155 is overexpressed in various tumors, including breast,
lung and pancreatic cancer (43–45).
Moreover, high expression of hsa-miR-155 is considered to predict a
poor prognosis of lung cancer and pancreatic tumor (44,45).
hsa-miR-155 may be a potential target in breast therapy (46); hsa-miR-192 and hsa-miR-144 were
found decreased in many tumors, including bladder, colorectal
cancer, and follicular thyroid carcinoma (47–49).
The differentially expressed miRNAs found in the present study are
slightly different from previous studies. Since ESCC is a result of
interplays between different exposures and host susceptibilities,
the Huaian population may have distinctive characteristics leading
to a specific miRNA profile.
Furthermore, we found the expression of hsa-miR-21*
was different in patients with alcohol consumption. Wang et
al(50) found 14 miRNAs
differentially expressed in fetal mouse brains with and without
prenatal ethanol exposure. Soares et al(51) exposed zebra fish embryos to ethanol
and altered expressions of miRNAs were observed. These studies
indicate that ethanol can regulate miRNA expression. Although there
are few published studies on the function of hsa-miR-21*, we found
ethanol exposure can trigger alteration in hsa-miR-21* expression
levels. It has been documented that ethanol alters the activities
of various signal transduction pathways, including the MAPK
pathway, which regulate the activities of transcription factors
and, thus alter gene expression (52). MAP3K1, part of some signal
transduction cascades in the MAPK/ERK pathway, is one of the
targets predicted by computational analysis for
hsa-miR-21*(miRanda). Thereby, we speculated hsa-miR-21* may be
involved in pathways of tumorigenesis induced by ethanol.
In conclusion, our study suggests a differential
expression profile of miRNAs (hsa-miR-139-5p, hsa-miR-574-5p,
hsa-miR-338-3p, hsa-miR-218, hsa-miR-183, hsa-miR-21* and
hsa-miR-601) in ESCC. The overexpression of hsa-miR-21* was
associated with alcohol consumption. These results suggest that
these differentially expressed miRNAs may be potential biomarkers
for the early diagnosis and prognosis of ESCC.
Acknowledgements
This study was supported by the National Natural
Science Foundation of China (nos. 81172747, 81072259, 30800891,
81111140396), the Research Fund for the Doctoral Program of Higher
Education of China (no. 200802861045), the Natural Science
Foundation of Jiangsu province, China (no. BK2010407) and the
Research and Teaching Fund for the Excellent Youth Scholars of
Southeast University (2009).
References
|
1
|
Jinyi Z, Quanyong X, Ran T, Jie Y, Ping L
and Ming W: Analysis on surveillance of cause death in Jiangsu
province during 2007. Jiangsu J Prev Med 2008. 19:74–75. 2008.
|
|
2
|
Rice TW, Rusch VW, Apperson-Hansen C, et
al: Worldwide esophageal cancer collaboration. Dis Esophagus.
22:1–8. 2009. View Article : Google Scholar
|
|
3
|
Calin GA and Croce CM: MicroRNA signatures
in human cancers. Nat Rev Cancer. 6:857–866. 2006. View Article : Google Scholar : PubMed/NCBI
|
|
4
|
Ambros V: The functions of animal
microRNAs. Nature. 431:350–355. 2004. View Article : Google Scholar : PubMed/NCBI
|
|
5
|
Lu J, Getz G, Miska EA, et al: MicroRNA
expression profiles classify human cancers. Nature. 435:834–838.
2005. View Article : Google Scholar : PubMed/NCBI
|
|
6
|
Manikandan J, Aarthi JJ, Kumar SD and
Pushparaj PN: Oncomirs: the potential role of non-coding microRNAs
in understanding cancer. Bioinformation. 2:330–334. 2008.
View Article : Google Scholar : PubMed/NCBI
|
|
7
|
Schetter AJ, Heegaard NHH and Harris CC:
Inflammation and cancer: interweaving microRNA, free radical,
cytokine and p53 pathways. Carcinogenesis. 31:37–49. 2010.
View Article : Google Scholar : PubMed/NCBI
|
|
8
|
Kwak PB, Iwasaki S and Tomari Y: The
microRNA pathway and cancer. Cancer Sci. 101:2309–2315. 2010.
View Article : Google Scholar : PubMed/NCBI
|
|
9
|
Ahmed FE: Role of miRNA in carcinogenesis
and biomarker selection: a methodological view. Expert Rev Mol
Diagn. 7:569–603. 2007. View Article : Google Scholar : PubMed/NCBI
|
|
10
|
Kan T and Meltzer SJ: MicroRNAs in
Barrett’s esophagus and esophageal adenocarcinoma. Curr Opin
Pharmacol. 9:727–732. 2009.
|
|
11
|
Yang HS, Gu J, Wang KK, et al: MicroRNA
expression signatures in Barrett’s esophagus and esophageal
adenocarcinoma. Clin Cancer Res. 15:5744–5752. 2009.
|
|
12
|
Livak KJ and Schmittgen TD: Analysis of
relative gene expression data using real-time quantitative PCR and
the 2(T)(-Delta Delta C) method. Methods. 25:402–408. 2001.
View Article : Google Scholar : PubMed/NCBI
|
|
13
|
Esquela-Kerscher A and Slack FJ: Oncomirs
- microRNAs with a role in cancer. Nat Rev Cancer. 6:259–269. 2006.
View Article : Google Scholar
|
|
14
|
Chen X, Hu ZB, Wang WJ, et al:
Identification of ten serum microRNAs from a genome-wide serum
microRNA expression profile as novel noninvasive biomarkers for
nonsmall cell lung cancer diagnosis. Int J Cancer. 130:1620–1628.
2012. View Article : Google Scholar : PubMed/NCBI
|
|
15
|
Hu YX, Correa AM, Hoque A, et al:
Prognostic significance of differentially expressed miRNAs in
esophageal cancer. Int J Cancer. 128:132–143. 2011. View Article : Google Scholar : PubMed/NCBI
|
|
16
|
Wiggins JF, Ruffino L, Kelnar K, et al:
Development of a lung cancer therapeutic based on the tumor
suppressor microRNA-34. Cancer Res. 70:5923–5930. 2010. View Article : Google Scholar : PubMed/NCBI
|
|
17
|
Guo Y, Chen Z, Zhang L, et al: Distinctive
microRNA profiles relating to patient survival in esophageal
squamous cell carcinoma. Cancer Res. 68:26–33. 2008. View Article : Google Scholar : PubMed/NCBI
|
|
18
|
Ogawa R, Ishiguro H, Kuwabara Y, et al:
Expression profiling of micro-RNAs in human esophageal squamous
cell carcinoma using RT-PCR. Med Mol Morphol. 42:102–109. 2009.
View Article : Google Scholar : PubMed/NCBI
|
|
19
|
Feber A, Xi L, Luketich JD, et al:
MicroRNA expression profiles of esophageal cancer. J Thorac
Cardiovasc Surg. 135:255–260. 2008. View Article : Google Scholar
|
|
20
|
Guo J, Miao Y, Xiao B, et al: Differential
expression of microRNA species in human gastric cancer versus
non-tumorous tissues. J Gastroenterol Hepatol. 24:652–657. 2009.
View Article : Google Scholar : PubMed/NCBI
|
|
21
|
Fridman E, Dotan Z, Barshack I, et al:
Accurate molecular classification of renal tumors using microRNA
expression. J Mol Diagn. 12:687–696. 2010. View Article : Google Scholar : PubMed/NCBI
|
|
22
|
Hiroki E, Akahira J, Suzuki F, et al:
Changes in microRNA expression levels correlate with
clinicopathological features and prognoses in endometrial serous
adenocarcinomas. Cancer Sci. 101:241–249. 2010. View Article : Google Scholar : PubMed/NCBI
|
|
23
|
Yoshino H, Chiyomaru T, Enokida H, et al:
The tumour-suppressive function of miR-1 and miR-133a targeting
TAGLN2 in bladder cancer. Br J Cancer. 104:808–818. 2011.
View Article : Google Scholar : PubMed/NCBI
|
|
24
|
Miles GD, Seiler M, Rodriguez L, Rajagopal
G and Bhanot G: Identifying microRNA/mRNA dysregulations in ovarian
cancer. BMC Res Notes. 5:1642012. View Article : Google Scholar : PubMed/NCBI
|
|
25
|
Au SL, Wong CC, Lee JM, et al: Enhancer of
zeste homolog 2 epigenetically silences multiple tumor suppressor
microRNAs to promote liver cancer metastasis. Hepatology.
56:622–631. 2012. View Article : Google Scholar : PubMed/NCBI
|
|
26
|
Yu JJ, Wang Y, Dong RF, Huang XY, Ding SN
and Qiu HF: Circulating microRNA-218 was reduced in cervical cancer
and correlated with tumor invasion. J Cancer Res Clin Oncol.
138:671–674. 2012. View Article : Google Scholar : PubMed/NCBI
|
|
27
|
Tatarano S, Chiyomaru T, Kawakami K, et
al: miR-218 on the genomic loss region of chromosome 4p15.31
functions as a tumor suppressor in bladder cancer. Int J Oncol.
39:13–21. 2011.PubMed/NCBI
|
|
28
|
Gao CP, Zhang ZY, Liu WZ, Xiao SD, Gu WQ
and Lu H: Reduced microRNA-218 expression is associated with high
nuclear factor kappa B activation in gastric cancer. Cancer.
116:41–49. 2010.PubMed/NCBI
|
|
29
|
Huang XH, Chen JS, Wang Q, et al:
miR-338-3p suppresses invasion of liver cancer cell by targeting
smoothened. J Pathol. 225:463–472. 2011. View Article : Google Scholar : PubMed/NCBI
|
|
30
|
Yu J, Li A, Hong SM, Hruban RH and Goggins
M: MicroRNA alterations of pancreatic intraepithelial neoplasias.
Clin Cancer Res. 18:981–992. 2012. View Article : Google Scholar : PubMed/NCBI
|
|
31
|
Foss KM, Sima C, Ugolini D, Neri M, Allen
KE and Weiss GJ: miR-1254 and miR-574-5p: serum-based microRNA
biomarkers for early-stage non-small cell lung cancer. J Thorac
Oncol. 6:482–488. 2011. View Article : Google Scholar : PubMed/NCBI
|
|
32
|
Yao Y, Suo AL, Li ZF, et al: MicroRNA
profiling of human gastric cancer. Mol Med Rep. 2:963–970.
2009.PubMed/NCBI
|
|
33
|
Ohdaira H, Nakagawa H and Yoshida K:
Profiling of molecular pathways regulated by microRNA 601. Comput
Biol Chem. 33:429–433. 2009. View Article : Google Scholar : PubMed/NCBI
|
|
34
|
Lowery AJ, Miller N, Dwyer RM and Kerin
MJ: Dysregulated miR-183 inhibits migration in breast cancer cells.
BMC Cancer. 10:5022010. View Article : Google Scholar : PubMed/NCBI
|
|
35
|
Schaefer A, Jung M, Mollenkopf HJ, et al:
Diagnostic and prognostic implications of microRNA profiling in
prostate carcinoma. Int J Cancer. 126:1166–1176. 2010.PubMed/NCBI
|
|
36
|
Li J, Fu H, Xu C, et al: miR-183 inhibits
TGF-beta1-induced apoptosis by downregulation of PDCD4 expression
in human hepatocellular carcinoma cells. BMC Cancer. 10:3542010.
View Article : Google Scholar : PubMed/NCBI
|
|
37
|
Bandres E, Cubedo E, Agirre X, et al:
Identification by real-time PCR of 13 mature microRNAs
differentially expressed in colorectal cancer and non-tumoral
tissues. Mol Cancer. 5:292006. View Article : Google Scholar : PubMed/NCBI
|
|
38
|
Sarver AL, Li LH and Subramanian S:
MicroRNA miR-183 functions as an oncogene by targeting the
transcription factor EGR1 and promoting tumor cell migration.
Cancer Res. 70:9570–9580. 2010. View Article : Google Scholar : PubMed/NCBI
|
|
39
|
Li GR, Luna C, Qiu JM, Epstein DL and
Gonzalez P: Targeting of integrin beta1 and kinesin 2alpha by
microRNA 183. J Biol Chem. 285:5461–5471. 2010. View Article : Google Scholar : PubMed/NCBI
|
|
40
|
Kanasaki K, Kanda Y, Palmsten K, et al:
Integrin beta1-mediated matrix assembly and signaling are critical
for the normal development and function of the kidney glomerulus.
Dev Biol. 313:584–593. 2008. View Article : Google Scholar : PubMed/NCBI
|
|
41
|
Wederell ED and de Iongh RU: Extracellular
matrix and integrin signaling in lens development and cataract.
Semin Cell Dev Biol. 17:759–776. 2006. View Article : Google Scholar : PubMed/NCBI
|
|
42
|
O’Donnell KA, Wentzel EA, Zeller KI, Dang
CV and Mendell JT: c-Myc-regulated microRNAs modulate E2F1
expression. Nature. 435:839–843. 2005.PubMed/NCBI
|
|
43
|
Iorio MV, Ferracin M, Liu CG, et al:
MicroRNA gene expression deregulation in human breast cancer.
Cancer Res. 65:7065–7070. 2005. View Article : Google Scholar : PubMed/NCBI
|
|
44
|
Yanaihara N, Caplen N, Bowman E, et al:
Unique microRNA molecular profiles in lung cancer diagnosis and
prognosis. Cancer Cell. 9:189–198. 2006. View Article : Google Scholar : PubMed/NCBI
|
|
45
|
Greither T, Grochola LF, Udelnow A,
Lautenschlager C, Wurl P and Taubert H: Elevated expression of
microRNAs 155, 203, 210 and 222 in pancreatic tumors is associated
with poorer survival. Int J Cancer. 126:73–80. 2010. View Article : Google Scholar : PubMed/NCBI
|
|
46
|
Jiang SA, Zhang HW, Lu MH, et al:
MicroRNA-155 functions as an OncomiR in breast cancer by targeting
the suppressor of cytokine signaling 1 gene. Cancer Res.
70:3119–3127. 2010. View Article : Google Scholar : PubMed/NCBI
|
|
47
|
Wang G, Chan ES, Kwan BC, et al:
Expression of microRNAs in the urine of patients with bladder
cancer. Clin Genitourin Cancer. 10:106–113. 2012. View Article : Google Scholar : PubMed/NCBI
|
|
48
|
Chiang YP, Song YX, Wang ZN, et al:
microRNA-192,-194 and-215 are frequently downregulated in
colorectal cancer. Exp Ther Med. 3:560–566. 2012.PubMed/NCBI
|
|
49
|
Rossing M, Borup R, Henao R, et al:
Down-regulation of microRNAs controlling tumourigenic factors in
follicular thyroid carcinoma. J Mol Endocrinol. 48:11–23. 2012.
View Article : Google Scholar : PubMed/NCBI
|
|
50
|
Wang LL, Zhang ZF, Li Q, et al: Ethanol
exposure induces differential microRNA and target gene expression
and teratogenic effects which can be suppressed by folic acid
supplementation. Hum Reprod. 24:562–579. 2009. View Article : Google Scholar : PubMed/NCBI
|
|
51
|
Soares AR, Pereira PM, Ferreira V, et al:
Ethanol exposure induces upregulation of specific microRNAs in
zebrafish embryos. Toxicol Sci. 127:18–28. 2012. View Article : Google Scholar : PubMed/NCBI
|
|
52
|
Miranda RC, Pietrzykowski AZ, Tang Y, et
al: MicroRNAs: master regulators of ethanol abuse and toxicity?
Alcohol Clin Exp Res. 34:575–587. 2010. View Article : Google Scholar : PubMed/NCBI
|