Introduction
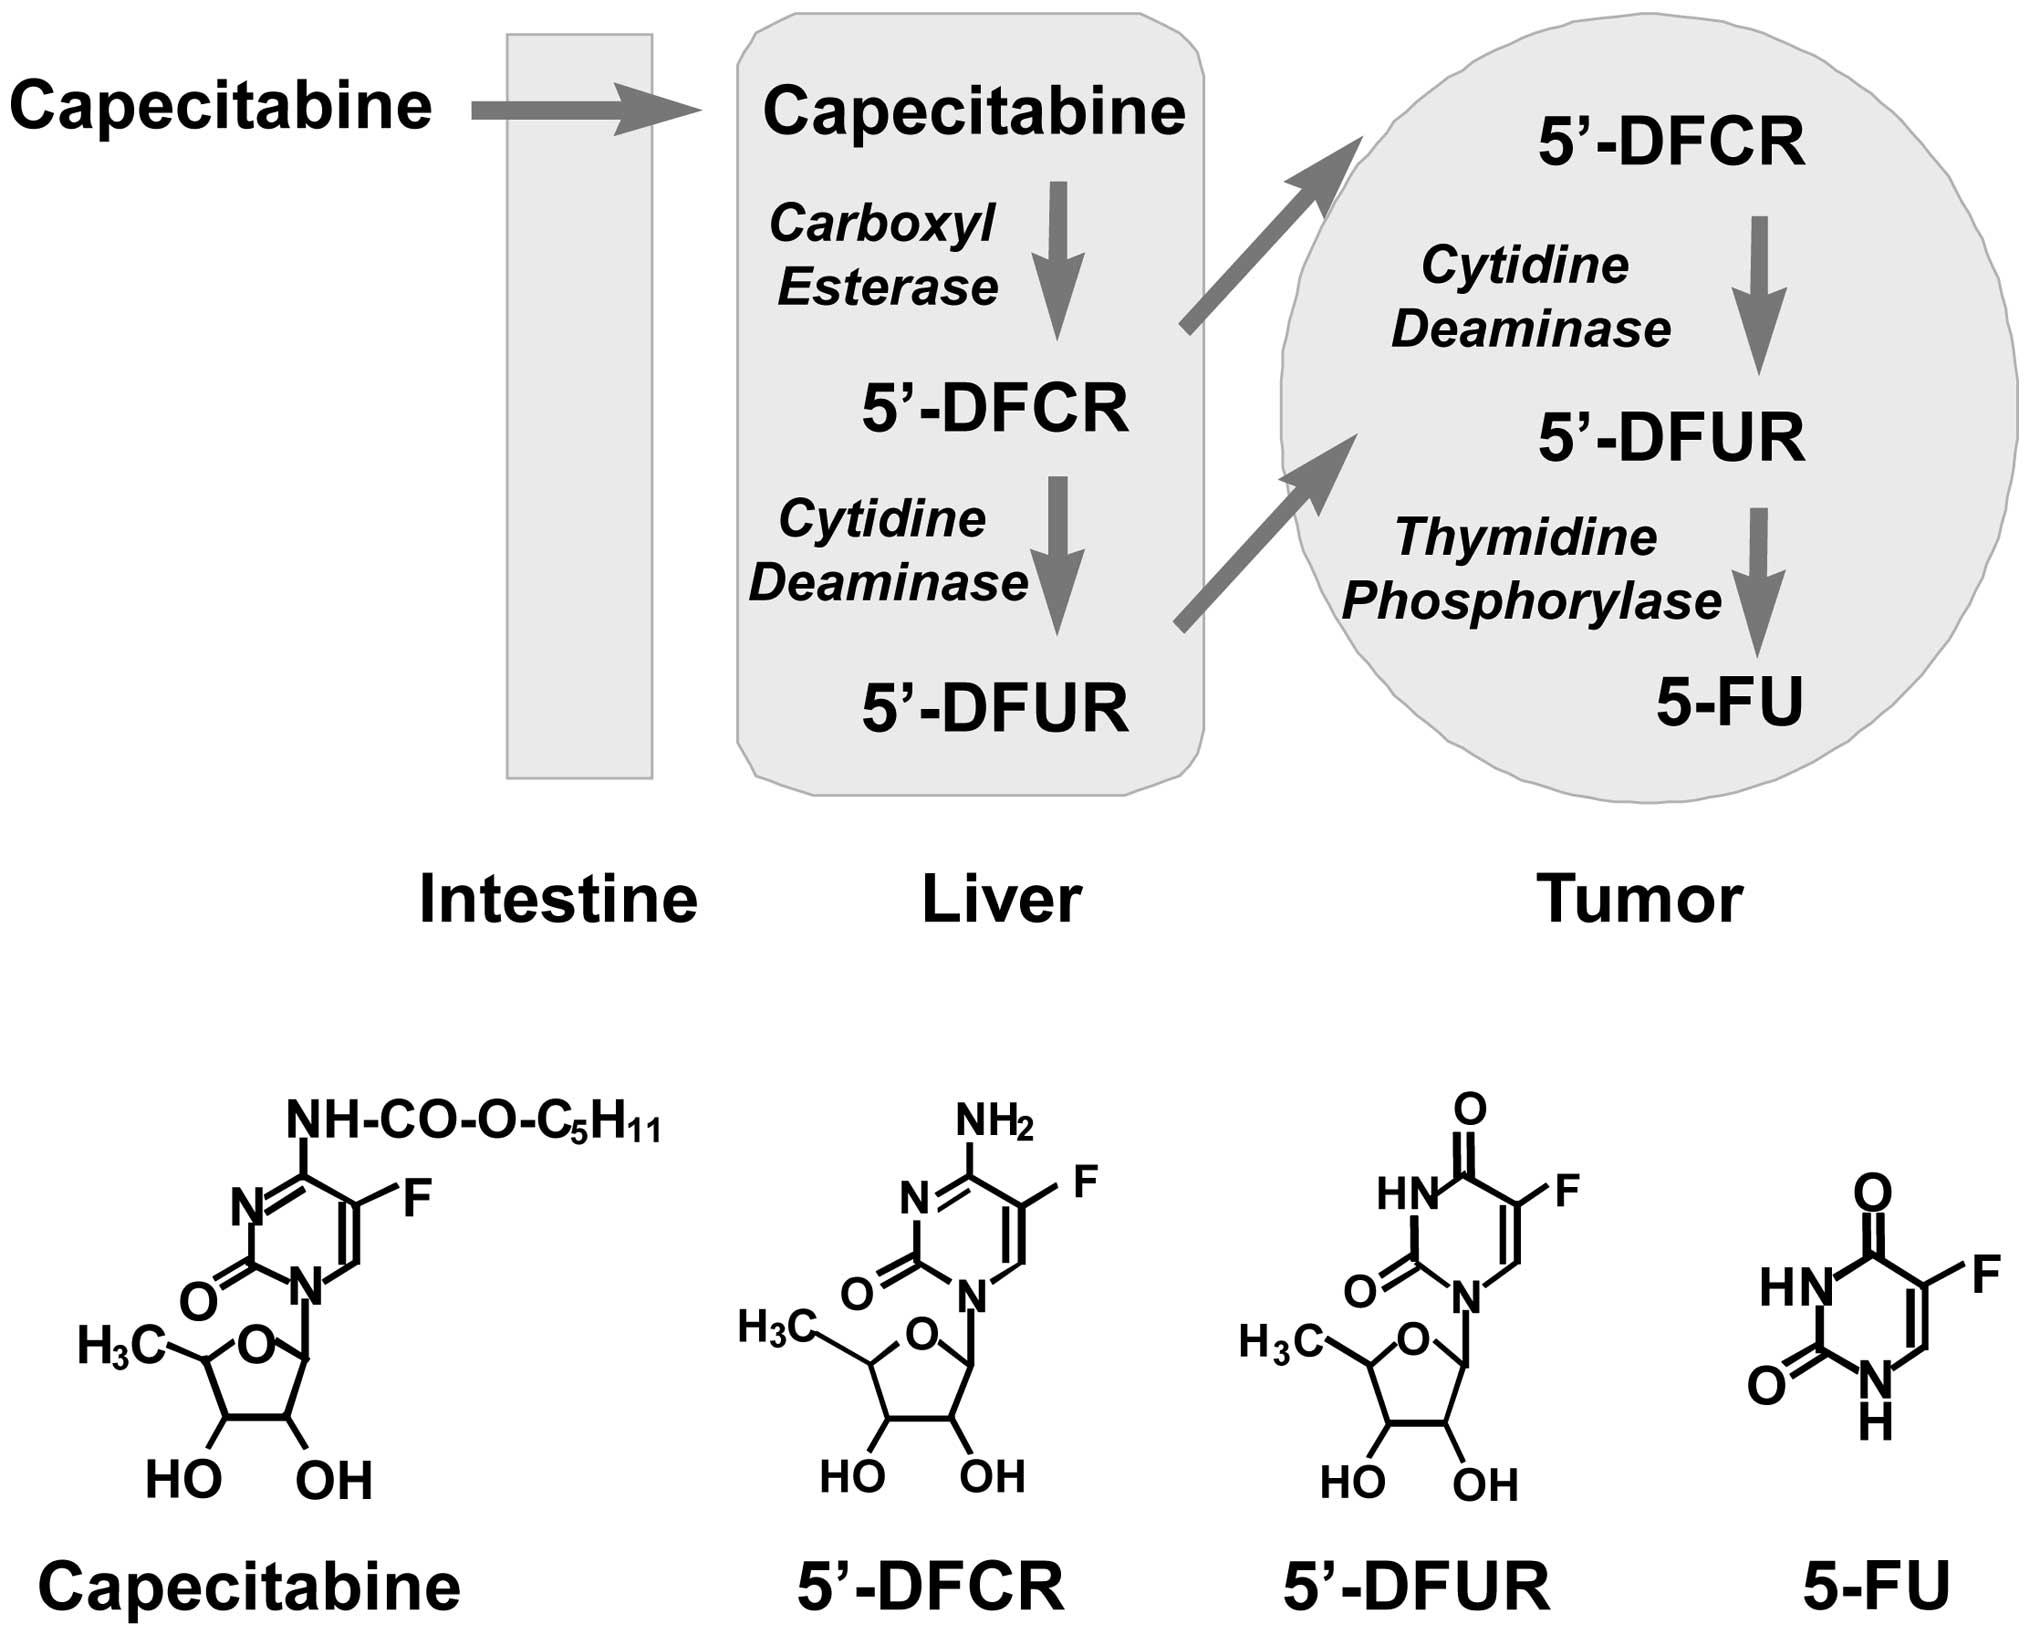
The oral fluoropyrimidine capecitabine
(Xeloda®) is sequentially activated by three enzymes
(Fig. 1), carboxylesterase,
cytidine deaminase (CD) and thymidine phosphorylase (TP), and
generates 5-FU selectively within tumor tissues (1–4).
5′-Deoxy-5-fluorouridine (5′-DFUR, doxifluridine,
Furtulon®) is an anticancer drug mainly used for
patients with breast, colorectal and gastric cancers in Japan and
the rest of East Asia, and is an intermediate of the capecitabine
activation pathway, which is generated from 5′-DFUR by CD in the
liver and in tumors (Fig. 1). 5-FU
that has been delivered to the tumor tissues is inactivated by an
enzyme, dihydropyrimidine dehydrogenase (DPD), which is expressed
in the tumor tissues. We previously demonstrated that the
sensitivity of human tumor xenografts to capecitabine and 5′-DFUR
correlated significantly with the expression ratio of TP to DPD in
tumor tissues (5). On the other
hand, thymidylate synthase (TS) and other pyrimidine
nucleoside-metabolizing enzymes are also reported as predictive
factors for 5-FU sensitivity (6–8). In
the present study, therefore, we investigated the relationship
between the expression levels of 12 enzymes associated with
pyrimidine nucleoside metabolisms (including TP, DPD, and TS) in
tumor tissues and the sensitivity of the tumors to capecitabine and
5′-DFUR as compared with that to 5-FU in xenograft models.
Analyzing the factors that predict sensitivity to
anticancer drugs is important and useful not only for selecting
potential responders but also for developing new combinations. By
selecting patients who will potentially respond to the therapy, it
is possible to avoid the unnecessary treatment of patients who
would not respond, thus sparing them the possible adverse effects.
Furthermore, predictive factors render scientific rationales for
new combination therapies, by which the sensitivity factor could be
upregulated or the resistance factor be downregulated. In the
present study, it was revealed that, of the pyrimidine
nucleoside-metabolizing enzymes, only TP and DPD predicted a
response to capecitabine and 5′-DFUR. Therefore, quantifying the
expression levels of TP and DPD in tumor tissues makes it possible
to select responders to capecitabine and 5′-DFUR. Moreover,
investigating how combination partners regulate their expression
during therapy would optimize combination therapies. Furthermore,
capecitabine and 5′-DFUR may also be effective in 5-FU failure
patients, even though these agents are 5-FU derivatives.
Materials and methods
Xenograft models
We used 80 xenograft models as listed in Table I. We determined the expression
levels of mRNA in the tumor tissues from 80 xenograft models.
 | Table IList of xenograft models
investigated. |
Table I
List of xenograft models
investigated.
| Tumor type (no.) | Cell lines |
|---|
| Bladder (4) | 5637, RT-4, Scaber,
T-24 |
| Breast (8) | BT474, KPL-4,
MAXF401, MAXF449, MCF-7, MDA-MB-231, MDA-MB-468, MX-1 |
| Cervical (6) | C-33A, CAC-1, HT-3,
ME-180, SIHA, Yumoto |
| Colorectal (16) | COLO201, COLO205,
COLO320DM, CX-1, CXF280, DLD-1, HCT116, HCT15, HT-29, LoVo, LS174T,
LS411N, LS513, SW480, SW620, WiDr |
| Uterine (1) | HEC-59 |
| Gastric (6) | GXF97, MKN28, MKN45,
NCI-N87, SNU-1, SNU-5 |
| Hepatoma (4) | HLF, Huh-1, Huh-7,
PLC/PRF/5 |
| Lung (12) | A549, Calu-1, Calu-3,
Calu-6, LX-1, LXFL529, NCI-H292, NCI-H441, NCI-H569, PC10, PC13,
QG56 |
| Melanoma (2) | A431, SEKI |
| Ovarian (3) | Nakajima, PA-1,
SK-OV-3 |
| Pancreatic (7) | AsPC-1, BxPC-3,
Capan-1, Hs766T, MIAPaCa-2, Panc-1, SU86.86 |
| Pediatric (4) | G-401, SK-ES-1,
SK-N-AS, SK-PN-DW |
| Prostate (3) | DU145, LNCaP-FGC,
PC-3 |
| Renal (2) | ACHN, SN-12C |
Quantification of mRNA levels in the
tumor tissues from xenograft models
Fig. 2 illustrates
how the pathway of capecitabine, 5′-DFUR, and 5-FU exerts its
antitumor activity through pyrimidine nucleoside-metabolizing
enzymes. We determined the mRNA expression levels of the pyrimidine
nucleoside-metabolizing enzymes listed in Table II by a real-time RT-PCR method.
Each mRNA level is expressed as the copy ratio to 103
copies of GAPDH. Primers and hybridization-probes specific to each
mRNA are listed in Table III. RNR
consists of a heterodimer of M1 and M2 subunits.
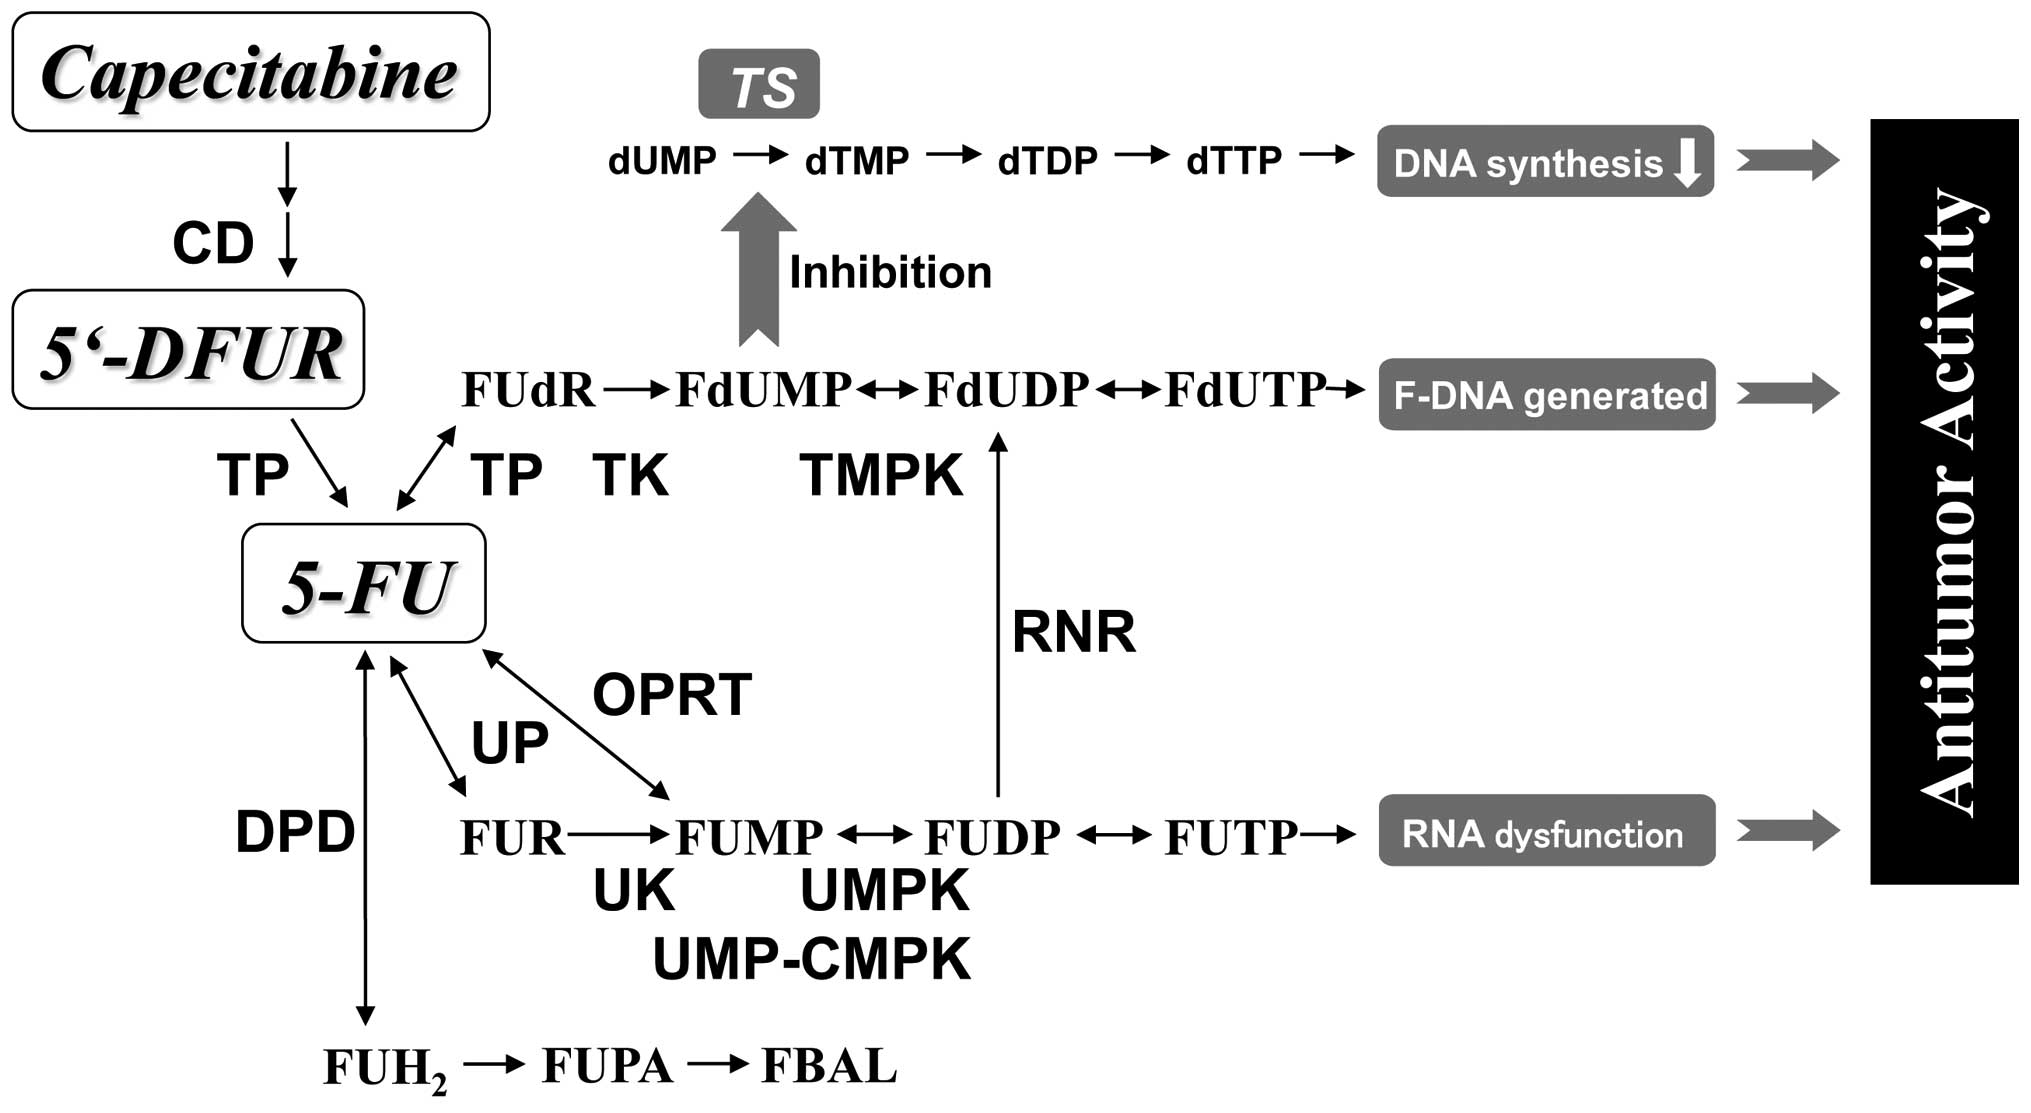 | Figure 2Metabolizing enzymes of capecitabine,
5′-DFUR and 5-FU. CD, cytidine deaminase; TP, thymidine
phosphorylase; DPD, dihydropyrimidine dehydrogenase; UP, uridine
phosphorylase; UK, uridine kinase; OPRT, orotate phosphoribosyl
transferase; UMPK, UMP kinase; RNR, ribonucleotide reductase; TK,
thymidine kinase; TMPK, TMP kinase; TS, thymidylate synthase. |
| Table IIList of pyrimidine
nucleotide-metabolizing enzymes investigated. |
Table II
List of pyrimidine
nucleotide-metabolizing enzymes investigated.
| mRNA | Enzyme name | Synonyms | EC |
|---|
| TP | Thymidine
phosphorylase | ECGF-1, PD-ECGF | 2.4.2.4 |
| DPD | Dihydropyrimidine
dehydrogenase | | 1.3.1.2 |
| CD | Cytidine
deaminase | | 3.5.4.5 |
| UP | Uridine
phosphorylase | | 2.4.2.3 |
| TS | Thymidylate
synthase | | 2.1.1.45 |
| TK1 | Thymidine kinase
1 | | 2.7.1.21 |
| UK | Uridine kinase | UCK2 | 2.7.1.48 |
| OPRT | Orotate
phosphorybosyl transferase | UMP synthetase | 4.1.1.23
(2.4.2.10) |
| TMPK | TMP kinase | Thymidylate
kinase | 2.7.4.9 |
| UMPK | UMP kinase | UCK1 | 2.7.4.4 |
| UMP-CMPK | UMP kinase | UMP-CMP kinase | 2.7.4.14 |
| RNR M1 | Ribonucleotide
reductase | | 1.17.4.1 |
| RNR M2 | Ribonucleotide
reductase | | 1.17.4.1 |
| Table IIIList of sequences of primers and
hybridization-probes used. |
Table III
List of sequences of primers and
hybridization-probes used.
| mRNA | NCBI accession
no. | Primer Sequence | Hybridization-probe
sequence |
|---|
| TP | NM_001953 | Same sequences as
primers in a commercial kita | Same sequences as
probes in a commercial kita |
| DPD | NM_000110 | Same sequences as
primers in a commercial kita | Same sequences as
probes in a commercial kita |
| CD | NM_001785 |
5′-CAGGAGGGGAGAATCTTCAAA |
5′-ATCTGTGCTGAACGGACCGC-FITC |
| |
5′-AGGCCCCACATGGAGAGATA |
5′-p-ATCCAGAAGGCCGTCTGAGAAGG-LCRed640 |
| UP | NM_003364 |
5′-TTTGTCGCCGGTGTCG | SYBR Green
method |
| |
5′-CGCGAGTCACCTCACCAA | |
| TS | NM_001071 |
5′-GATCCCGAGACTTTTTGGACAGCC |
5′-GAATCATCATGTGCGCTTGGAATC-FITC |
| |
5′-CCATGTCTCCCGATCTCTGGTACA |
5′-p-AAGAGATCTTCCTCTGATGGCGCT-LCRed640 |
| TK1 | NM_003258 |
5′-TGCACACATGACCGGAACAC | SYBR Green
method |
| |
5′-GGCCTCGCAGAACTCCATG | |
| UK | NM_031432 |
5′-GAGTTCTGCCTGCCGACAA |
5′-TGATCATCCCTAGAGGTGCAGATAATC-FITC |
| |
5′-TGGTCCCCTGGCTCAGAA |
5′-p-GGTGGCCATCAACCTCATCG-LCRed640 |
| OPRT | NM_000373 |
5′-GGGGGTGCCTCCTTATTG | SYBR Green
method |
| |
5′-TTGTGGGCTATTGTACTGTTGG | |
| TMPK | NM_012145 |
5′-GCTGGGAACAAGTGCCGTT |
5′-CGGTGAAGGCCACACCAGAA-FITC |
| |
5′-GCCCACGTCTGGCTGTTTAC |
5′-p-ATGCGTATCTGTCCACGACGAGG-LCRed640 |
| UMPK | NM_012474 |
5′-GGAATTCTGCTTGCCAACAA |
5′-TGCAAATGGCACCGAGGAGG-FITC |
| |
5′-GCTGGGGTCCGATGGAG |
5′-p-TCCAATGGGCGGAGCTACAA-LCRed640 |
| UMP-CMPK | NM_016308 |
5′-GATTCTCCTCTGCTCTCCACG | SYBR Green
method |
| |
5′-TTGTCTGATCCATTTCCCTCTTT | |
| RNR M1 | NM_001033 |
5′-TGGATGAGGTTTGGGGAGAG | SYBR Green
method |
| |
5′-GCATTTGATGGTTCCCAGGT | |
| RNR M2 | NM_001034 |
5′-CACGGAGCCGAAAACTAAAG | SYBR Green
method |
| |
5′-ATTTGGAAGCCATAGAAACAGC | |
Total RNA was extracted from tumor tissues, which
were stored in liquid nitrogen immediately after resection from
nude mice, using Sepazol reagent (Nacalai Tesque, Inc., Kyoto,
Japan) according to the manufacturer’s recommendations. RNA quality
was verified by electrophoresis through agarose gel and
visualization with SYBR Green II (Molecular Probes, OR, USA). After
treatment of RNA with DNase I (Invitrogen, Carlsbad, CA, USA), cDNA
was synthesized from total RNA by using Superscript II RNase H-free
reverse transcriptase (Invitrogen) and T7-poly dT (Qiagen, Tokyo,
Japan).
The copy number of mRNA was determined using cDNA as
a template in LightCycler™ (http://www.roche-applied-science.com/lightcycler-online/).
PCR was performed in LightCycler using specific primers (Table III). Specific signals from the PCR
product were detected in LightCycler by two methods. One included
the SYBR-Green method (LightCycler FastStart Master SYBR-Green,
Roche Diagnostics, Mannheim, Germany) applied to UP, TK1, OPRT,
UMP-CMPK, RNRM1, and RNRM2. The other method was the hybridization
probe method (LightCycler FastStart DNA hybridization probes, Roche
Diagnostics) applied to TP, DPD, CD, TS, UK, TMPK and UMPK.
Specific hybridization probes are listed in Table III. GAPDH mRNA was also quantified
by SYBR-Green method as an internal standard. Primer sequences for
GAPDH were 5′-ACAGTCAGCCGCATCTTCTTTTG-3′ (forward) and
5′-CCCACTTGATTTTGGAGGGATCT-3′ (reverse). All primers and
hybridization probes were synthesized by Qiagen and Nippon Gene
Research (Sendai, Japan), respectively.
For a standard curve to quantify the copy number of
the PCR signal template, we constructed plasmids containing each
PCR product and determined the copy number in the plasmid
preparation by w/v concentration of plasmid. The mRNA expression
levels of DPD were below the detection limit in 2 xenografts (DLD-1
and LS513). All other species of mRNA were able to be quantified in
all xenografts.
Evaluation of the sensitivity of
xenografts and treatment schedule
We determined the sensitivity of xenografts to
capecitabine, 5′-DFUR and 5-FU in 24 models. To evaluate their
sensitivity to the treatment, we calculated tumor growth inhibition
(TGI) by using the following equation: TGI% = 100 × (1 -
ΔTVt/ΔTVc), where ΔTVt is the tumor volume change after treatment
with a drug and ΔTVc is the tumor volume change after treatment
with vehicle. The number of mice was 5–10 in the drug- and
vehicle-treated groups for every xenograft model. Tumor volume (TV)
was estimated by using the following equation: TV =
ab2/2, where a is the tumor length and b is the
width.
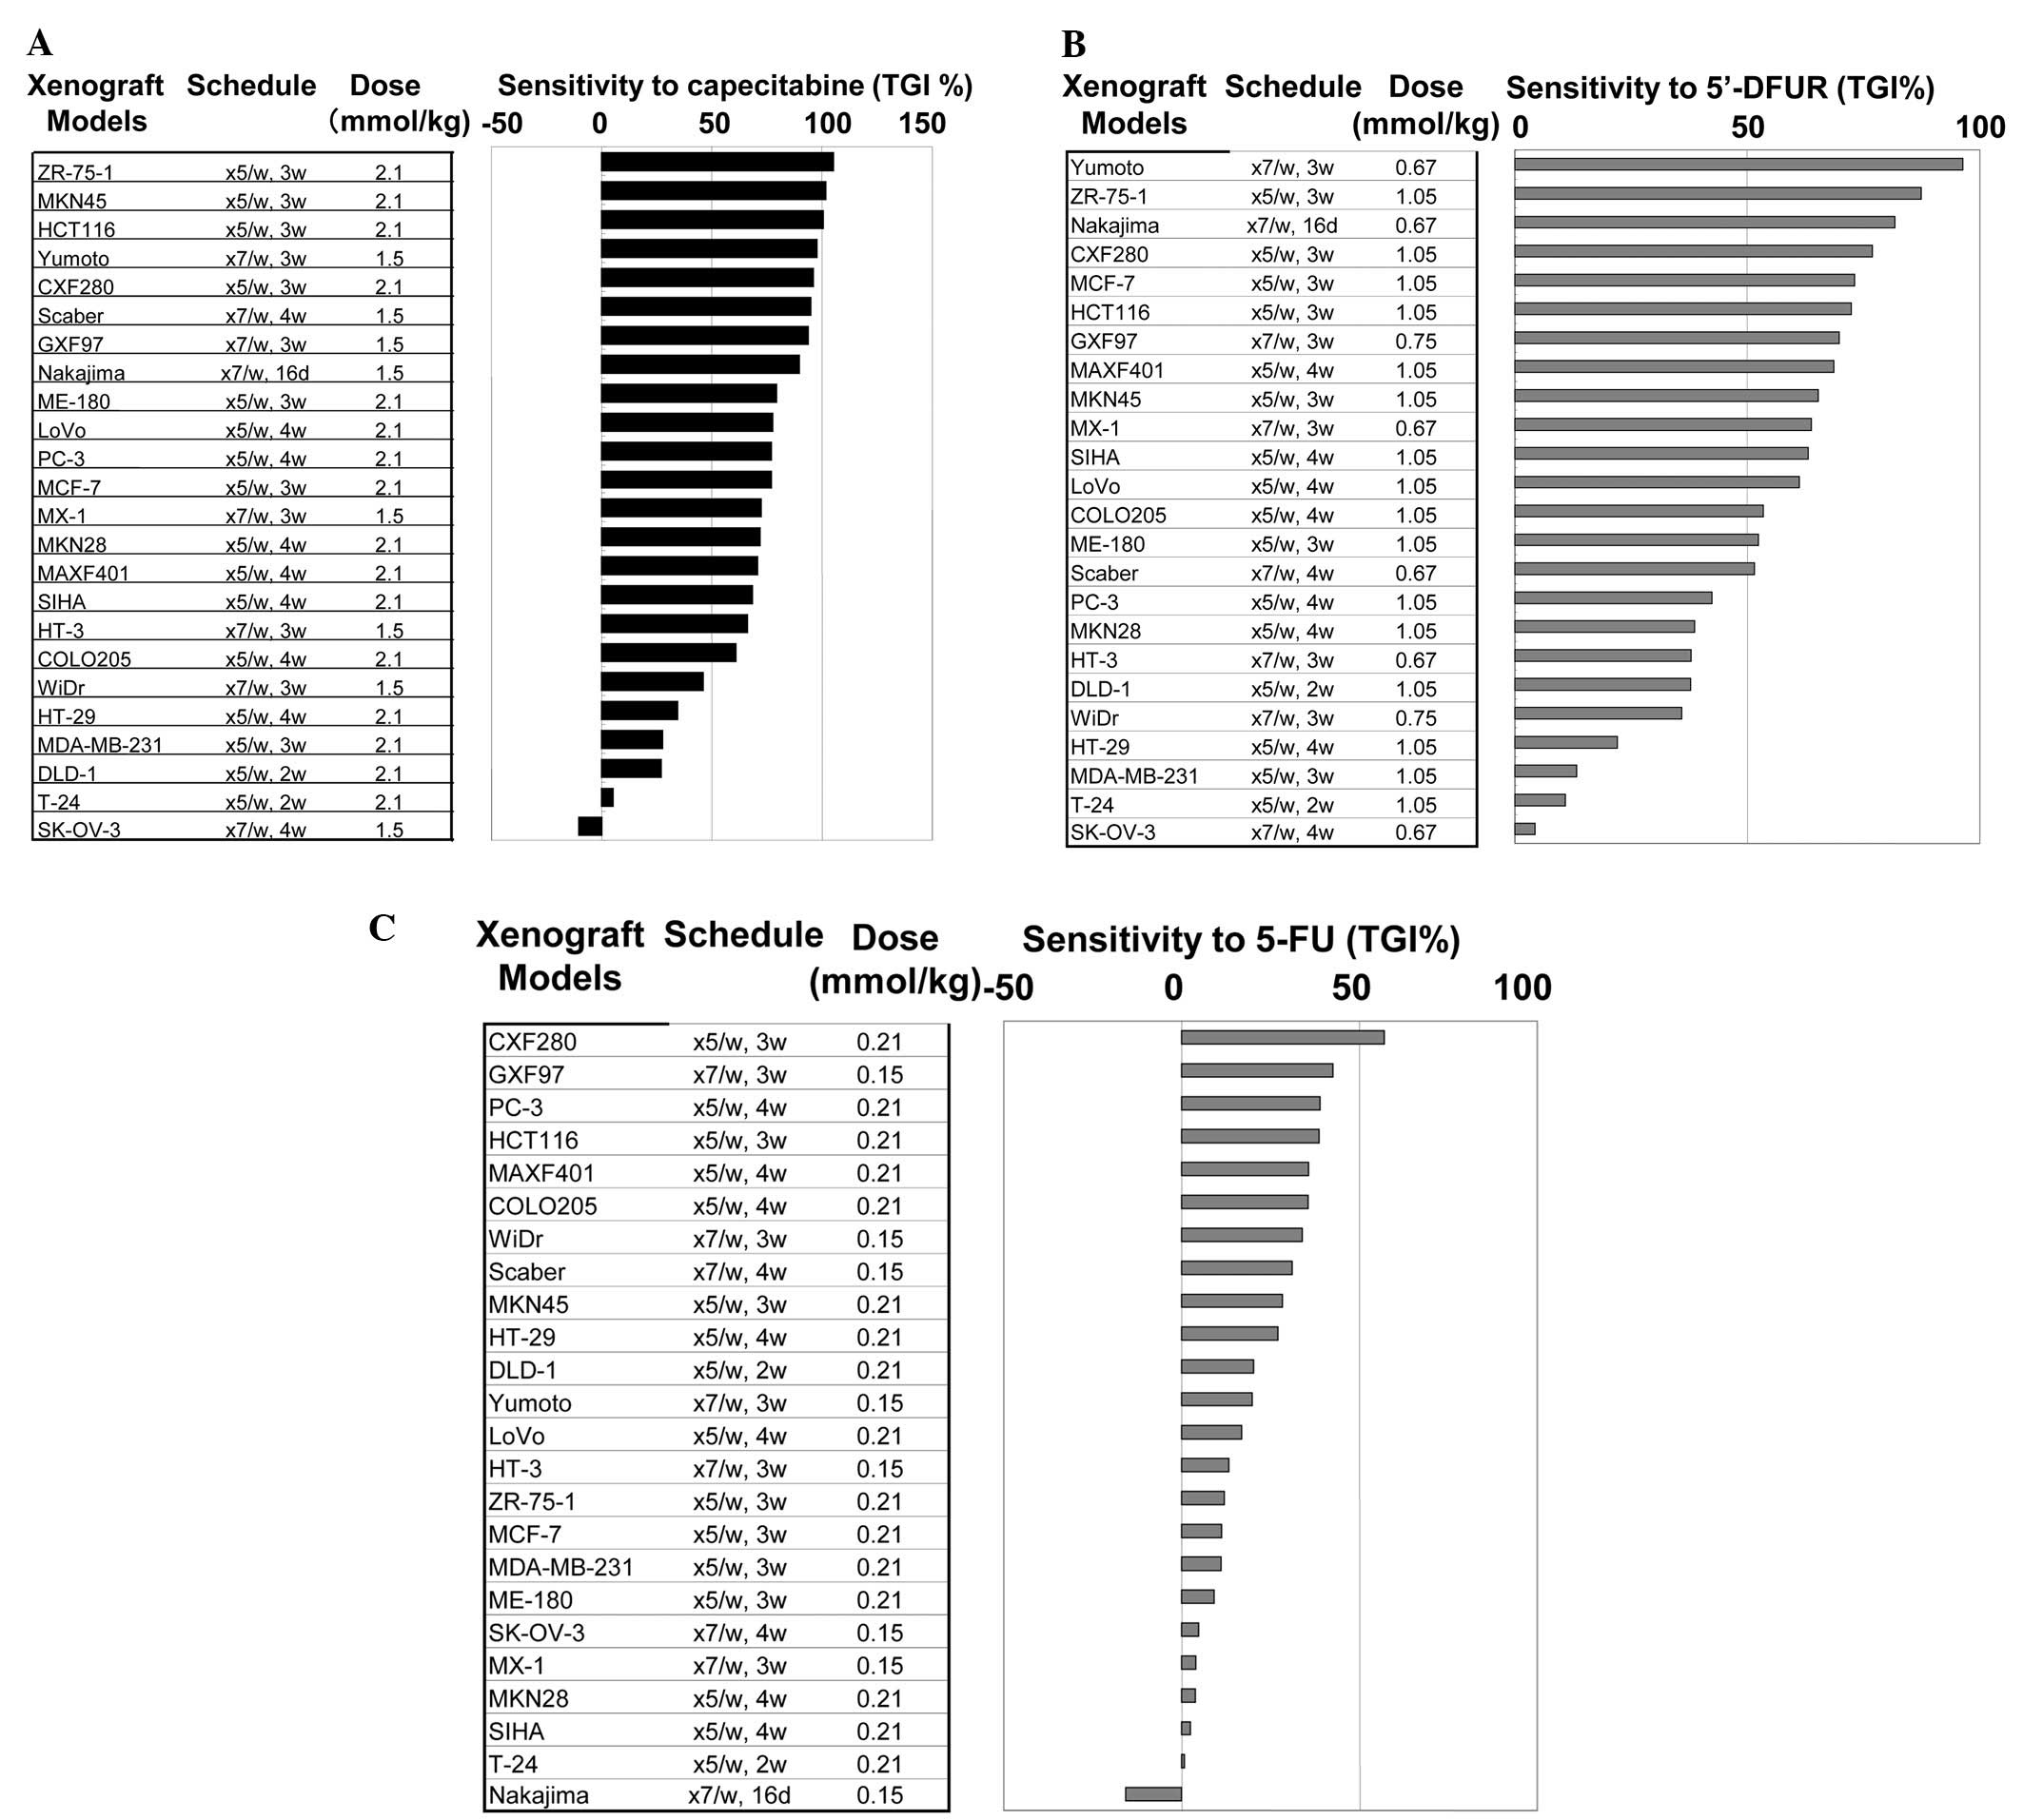
The treatment schedule for each xenograft model is
listed in Fig. 3A–C. A typical
regimen is as follows: q7d or q5d for 3 weeks at the maximum
tolerated dose (MTD). Treatment period and MTD were slightly
different in some models because of the different susceptibility to
toxicity of the treatment. The sensitivity to capecitabine,
5′-DFUR, and 5-FU is summarized in Fig.
3A, B and C, respectively.
Statistics
The mRNA levels in the tumor tissue were converted
to logarithms before calculating the statistics. Correlation
coefficient (r) and significance of correlation (p) were calculated
by a statistics software, StatView. Stepwise regression analysis, a
type of multivariate analysis, was also performed by StatView.
Clustering analysis was performed by Eisen Gene Cluster using
single linkage clustering method with similarity metric for
uncentered correlation.
Results
mRNA expression levels of pyrimidine
nucleoside-metabolizing enzymes
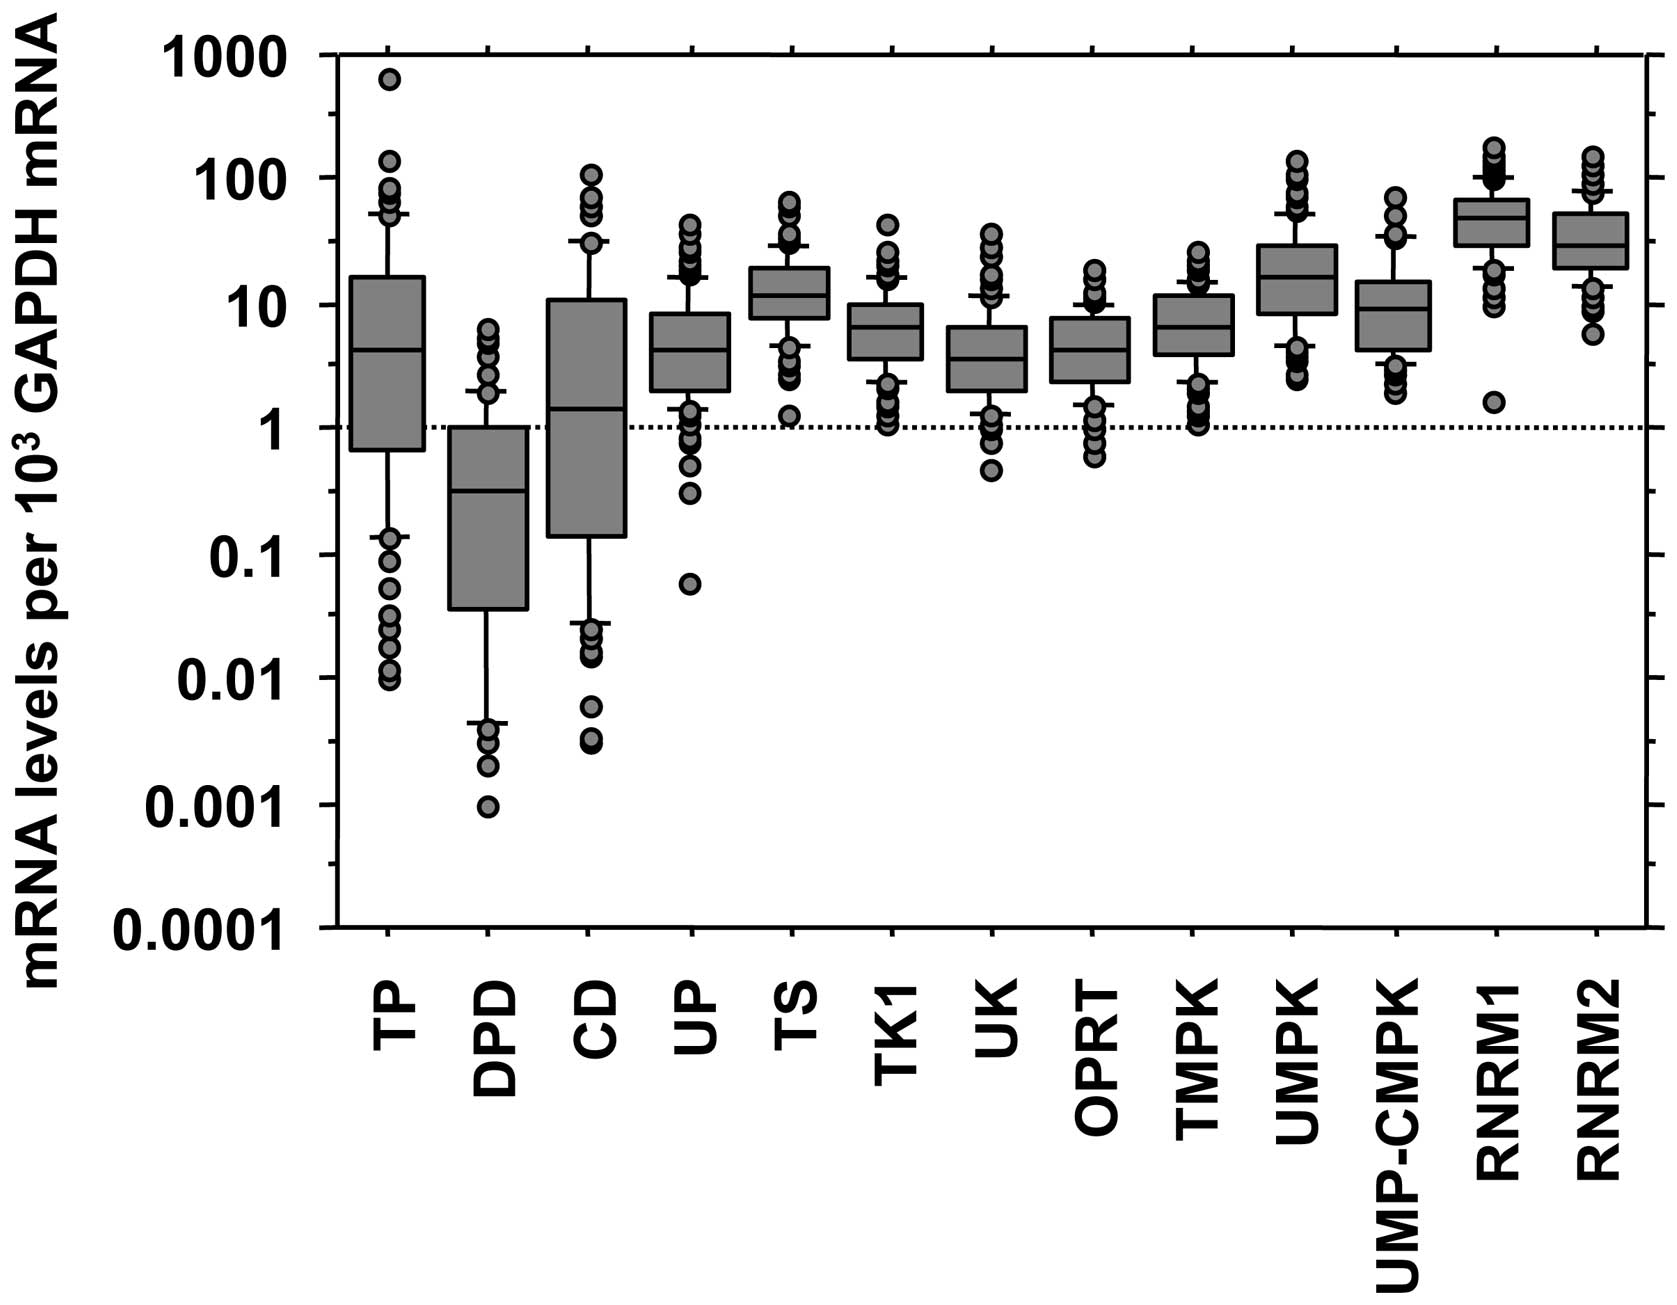
In the 80 models, the range of mRNA expression
levels of TP, DPD, CD and UP was wider than that of TS, TK1, UK,
OPRT, TMPK, UMPK, UMP-CMPK, RNRM1 and RNRM2 (Fig. 4). In the correlation analysis of
these mRNA levels, the 12 types of enzymes were found to be divided
into 2 groups. The first group included TS, TK1, UK, OPRT, TMPK,
UMPK, UMP-CMPK, RNRM1 and RNRM2, and the expression levels of these
mRNA were well correlated with each other. The second group
included TP, DPD, UP, and CD, and their mRNA levels were also
somewhat correlated with each other (Fig. 5). However, there were only weak
correlations between the expression levels of the first group and
those of the second group (Fig. 5).
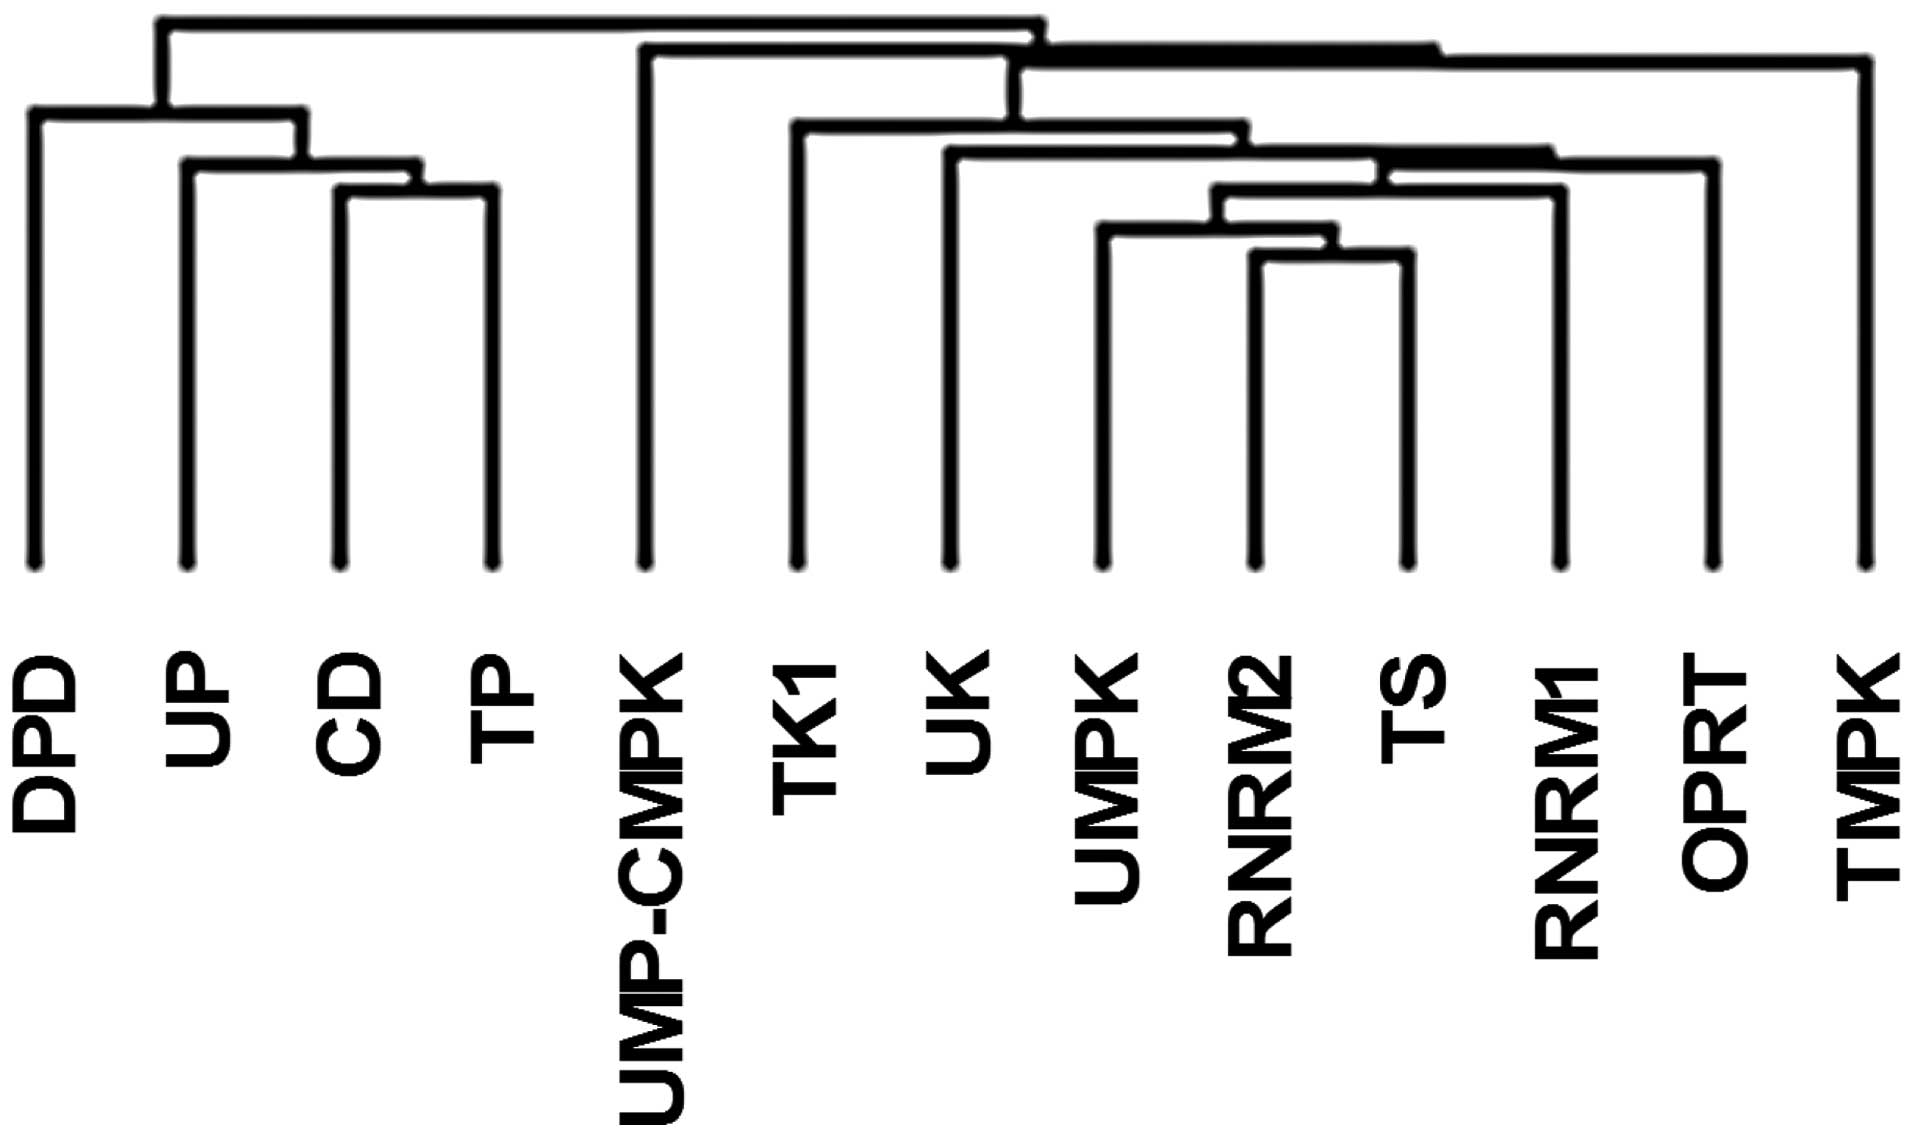
The clustering analysis for the mRNA expression in tumors also
revealed that the 12 types of pyrimidine nucleoside-metabolizing
enzyme could be divided into 2 clusters (Fig. 6), one including TP, DPD, CD, and UP
and the other including TS, TK1, UK, OPRT, TMPK, UMPK, UMP-CMPK,
RNRM1 and RNRM2.
Correlation between mRNA levels and
sensitivity to fluoropyrimidines in xenografts
Fig. 3 summarizes
the sensitivity (TGI%) of 24 xenografts to capecitabine, 5′-DFUR
and 5-FU (Fig. 3A, B and C,
respectively). Table IV shows the
correlation between mRNA levels in tumor tissues and sensitivity to
capecitabine, 5′-DFUR and 5-FU in xenograft models. In univariate
analysis, it was demonstrated that the sensitivity to capecitabine
correlated significantly with the mRNA level of TP positively, and
with that of TS negatively. Similarly, the expression levels of TP
were correlated positively, and those of DPD negatively, with the
sensitivity to 5′-DFUR. The expression ratio of TP to DPD showed
significant correlation with the sensitivity to capecitabine and
5′-DFUR (r=0.746 and r=0.798, respectively). On the other hand, the
sensitivity to 5-FU showed a significant positive correlation with
CD, OPRT, TMPK, UMPK and UMP-CMPK but not with mRNA levels of TP,
DPD and TS, and the TP/DPD ratio did not show significant
correlation with the sensitivity to 5-FU. As there was a
significant correlation among several of the expression levels of
mRNAs, we next analyzed the independent explanatory variable for
the drug sensitivity by a stepwise regression method, a type of
multivariate analysis. In the results, the mRNA levels of TP and
DPD emerged as independent explanatory variables for the
sensitivity to capecitabine. The same was equally true of 5′-DFUR.
On the other hand, the independent explanatory variable for that of
5-FU was the expression level of UMPK.
| Table IVCorrelation between mRNA levels and
sensitivity to fluoropyrimidines. |
Table IV
Correlation between mRNA levels and
sensitivity to fluoropyrimidines.
| Correlation with
sensitivity to |
|---|
|
|
|---|
| mRNA | Capecitabine | 5′-DFUR | 5-FU |
|---|
| TP | 0.587 | 0.463 | 0.187 |
| 0.0021 | 0.0216 | 0.3848 |
| DPD | −0.513 | −0.613 | −0.221 |
| 0.0113 | 0.0014 | 0.3142 |
| CD | 0.016 | −0.227 | 0.470 |
| 0.9403 | 0.2907 | 0.0196 |
| UP | −0.080 | −0.162 | 0.290 |
| 0.7131 | 0.4527 | 0.1712 |
| TS | −0.260 | −0.295 | 0.303 |
| 0.2228 | 0.1640 | 0.1513 |
| TK1 | −0.014 | −0.115 | 0.381 |
| 0.9498 | 0.5957 | 0.0659 |
| UK | −0.028 | −0.019 | 0.144 |
| 0.8968 | 0.9298 | 0.5067 |
| OPRT | −0.077 | −0.170 | 0.434 |
| 0.7240 | 0.4327 | 0.0338 |
| TMPK | −0.273 | −0.281 | 0.431 |
| 0.1996 | 0.1850 | 0.0348 |
| UMPK | −0.032 | 0.011 | 0.554 |
| 0.8830 | 0.9586 | 0.0042 |
| UMP-CMPK | −0.138 | −0.234 | 0.458 |
| 0.5235 | 0.2756 | 0.0235 |
| RNRM1 | −0.163 | −0.128 | 0.286 |
| 0.4496 | 0.5560 | 0.1775 |
| RNRM2 | −0.052 | 0.008 | 0.343 |
| 0.8108 | 0.9720 | 0.1014 |
|
| TP/DPD | 0.746 | 0.798 | 0.324 |
|
<0.0001 |
<0.0001 | 0.1328 |
Discussion
De novo versus salvage
In 80 xenograft models listed in Table I, we determined the mRNA levels in
the tumor tissues of pyrimidine nucleoside-metabolizing enzymes
listed in Table II. Fig. 4 summarizes the mRNA expression
levels of each enzyme in the tumor tissues: 13 species of mRNA of
12 types of enzymes (RNR consists of heterodimer of M1 and M2
subunits). These data demonstrate that the deviation of mRNA
expression levels of TP, DPD, CD, and UP was larger than that of
the other pyrimidine nucleoside-metabolizing enzymes: TS, TK1, UK,
OPRT, TMPK, UMPK, UMP-CMPK, RNRM1, and RNRM2. The former set of
enzymes can be classified into the salvage/degradation pathway of
pyrimidine nucleotide metabolism, and the latter set into the de
novo synthesis pathway. The de novo pathway enzymes
would be essential for cell proliferation, whereas the salvage
enzymes may not necessarily be required. Therefore, it is probable
that the expression of the de novo enzymes is tightly
regulated within appropriate levels, whereas that of salvage
enzymes is not. Indeed, the expression levels of the de novo
enzymes, TS, TK1, UK, OPRT, TMPK, UMPK, UMP-CMPK, RNRM1, and RNRM2,
correlated with each other significantly, whereas those of the
salvage enzymes, TP, DPD, CD, and UP, were found to correlate to a
lesser extent. Furthermore, the salvage enzymes and the de
novo enzymes were respectively categorized in 2 clusters by a
clustering analysis of the mRNA expression (Fig. 6). These clusters suggest that the
regulation of enzymes in the de novo pathway is independent
of that in the salvage.
TP and DPD as predictive factors for
capecitabine and 5′-DFUR
Tumor levels of TP and DPD have been found to
correlate with the sensitivity of xenografts to capecitabine and
5′-DFUR (5). Since both drugs exert
antitumor activity after being converted to 5-FU (Fig. 2), the other enzymes metabolizing
5-FU may influence the antitumor activities of these drugs.
Therefore, we analyzed the relationship between the sensitivity of
xenografts to the fluoropyrimidines (capecitabine, 5′-DFUR and
5-FU) and the tumor levels of mRNA of the pyrimidine
nucleoside-metabolizing enzymes, including TP and DPD. The
sensitivity of xenografts to capecitabine correlated significantly
with TP, CD, and TS, and that to 5′-DFUR correlated significantly
with TP and DPD. The expression ratio of TP to DPD correlated well
with capecitabine and 5′-DFUR. On the other hand, the expression
levels of OPRT, TMPK, UMPK, UMP-CMPK, and CD correlated
significantly with the sensitivity of xenografts to 5-FU, but those
of TP and DPD did not. As stated above, the expression levels of
these enzymes significantly correlated with each other in some
cases. Therefore, we analyzed the independent explanatory factors
for the sensitivity of xenografts by using a stepwise regression
method, a type of multivariate analysis. Consequently, it was
revealed that the independent explanatory factors for the
sensitivity to capecitabine and 5′-DFUR were the mRNA levels of TP
and DPD, whereas that to 5-FU was only UMPK. In the present study,
it was demonstrated that out of 12 types of pyrimidine
nucleoside-metabolizing enzymes, TP and DPD had the most influence
on the efficacy of capecitabine and 5′-DFUR. Therefore, it may be
possible to predict the response to capecitabine and 5′-DFUR by
quantifying only the expression levels of TP and DPD. On the other
hand, the predictive factor for 5-FU was different from
capecitabine and 5′-DFUR. Therefore, although they are categorized
as 5-FU derivatives, capecitabine and 5′-DFUR may be effective even
in 5-FU failure.
TP upregulation
In the present study, the tumors with low expression
levels of TP did not respond well to capecitabine and 5′-DFUR.
However, these tumors would respond to these chemotherapeutics if
TP expression could be upregulated in the tumor tissues. TP
expression in the tumor tissues of animal models was reported to be
upregulated after treatment with antitumor drugs (9,10) or
irradiation (11). In clinical
studies, it has also been reported that the TP levels in breast
carcinoma cells were augmented after docetaxel was administered as
a neoadjuvant chemotherapy in advanced breast cancer patients
(12). Toi and Ohni (13) reported that a marked increase in TP
expression was found in tumors from patients with operable breast
cancer who were treated with anthracycline and cyclophosphamide in
combination (AC and EC) or with docetaxel. Therefore, the
combination therapy of capecitabine/5′-DFUR with anticancer drugs
that induce TP in the tumor tissue would be a promising option for
cancer treatment. A phase III study demonstrated that combination
therapy of capecitabine with docetaxel is more effective than
single-agent docetaxel in patients with advanced breast cancer
(14).
Clinical investigation of predictive
factors TP and DPD for individualized therapy
In clinical studies, the tumor levels of TP and DPD
have been reported to correlate with the efficacy of capecitabine
and 5′-DFUR (15–17). TP and DPD may be predictive for the
response to these chemotherapeutics in many types of cancer.
Further study validating is needed to confirm the possibility that
tumors with a high TP or TP/DPD ratio would respond well to
capecitabine and 5′-DFUR. The expression levels of TP and DPD in
tumor tissues can be determined by measuring mRNA levels as shown
in the present study, and also by immunohistochemistry and ELISA
(18–21). Currently, various methods are
available to determine the expression levels of TP and DPD, as
circumstances demand.
In conclusion, the present study demonstrated that
of the major pyrimidine nucleoside-metabolizing enzymes, only TP
and DPD were predictive factors in tumor tissues for the
sensitivity to capecitabine and 5′-DFUR in xenograft models. This
suggests the possibility of selecting patients who would
potentially respond to capecitabine and 5′-DFUR by determining TP
and DPD levels in tumor tissues. In addition, our study
demonstrated that the predictive factor for capecitabine and
5′-DFUR was different from that for 5-FU in xenograft models. It
means that capecitabine and 5′-DFUR would be effective even in 5-FU
failure patients. The combination therapies of capecitabine with
various drugs are now being clinically evaluated in patients for
whom regimens including 5-FU have failed.
References
|
1
|
Miwa M, Ura M, Nishida M, Sawada N,
Ishikawa T, Mori K, Shimma N, Umeda I and Ishitsuka H: Design of a
novel oral fluoropyrimidine carbamate, capecitabine, which
generates 5-fluorouracil selectively in tumours by enzymes
concentrated in human liver and cancer tissue. Eur J Cancer.
34:1274–1281. 1998. View Article : Google Scholar
|
|
2
|
Ishikawa T, Utoh M, Sawada N, Nishida M,
Fukase Y, Sekiguchi F and Ishitsuka H: Tumor selective delivery of
5-fluorouracil by capecitabine, a new oral fluoropyrimidine
carbamate, in human cancer xenografts. Biochem Pharmacol.
55:1091–1097. 1998. View Article : Google Scholar : PubMed/NCBI
|
|
3
|
Schuller J, Cassidy J, Dumont E, Roos B,
Durston S, Banken L, Utoh M, Mori K, Weidekamm E and Reigner B:
Preferential activation of capecitabine in tumors following oral
administration to colorectal cancer patients. Cancer Chemother
Pharmacol. 45:291–297. 2000. View Article : Google Scholar : PubMed/NCBI
|
|
4
|
Pentheroudakis G and Twelves C: The
rational development of capecitabine from the laboratory to the
clinic. Anticancer Res. 22:3589–3596. 2002.PubMed/NCBI
|
|
5
|
Ishikawa T, Sekiguchi F, Fukase Y, Sawada
N and Ishitsuka H: Positive correlation between the efficacy of
capecitabine and doxifluridine and the ratio of thymidine
phosphorylase to dihydropyrimidine dehydrogenase activities in
tumors in human cancer xenografts. Cancer Res. 58:685–690.
1998.
|
|
6
|
Aschele C, Sobrero A, Faderan MA and
Bertino JR: Novel mechanism(s) of resistance to 5-fluorouracil in
human colon cancer (HCT-8) sublines following exposure to two
different clinically relevant dose schedules. Cancer Res.
52:1855–1864. 1992.
|
|
7
|
Aschele C, Lonardi S and Monfardini S:
Thymidylate synthase expression as a predictor of clinical response
to fluoropyrimidine-based chemotherapy in advanced colorectal
cancer. Cancer Treat Rev. 28:27–47. 2002. View Article : Google Scholar : PubMed/NCBI
|
|
8
|
Kubota T, Watanabe M, Otani Y, Kitajima M
and Fukushiuma M: Different pathways of 5-fluorouracil metabolism
after continuous venous or bolus injection in patients with colon
carcinoma: possible predictive value of thymidylate synthetase mRNA
and ribonucleotide reductase for 5-fluorouracil sensitivity.
Anticancer Res. 22:3537–3540. 2002.
|
|
9
|
Sawada N, Ishikawa T, Fukase Y, Nishida M,
Yoshikubo T and Ishitsuka H: Induction of thymidine phosphorylase
activity and enhancement of capecitabine efficacy by taxol/taxotere
in human cancer xenografts. Clin Cancer Res. 4:1013–1019.
1998.PubMed/NCBI
|
|
10
|
Endo M, Shinbori N, Fukase Y, Sawada N,
Ishikawa T, Ishitsuka H and Tanaka Y: Induction of thymidine
phosphorylase expression and enhancement of efficacy of
capecitabine or 5′-deoxy-5-fluorouridine by cyclophosphamide in
mammary tumor models. Int J Cancer. 83:127–134. 1999.
|
|
11
|
Sawada N, Ishikawa T, Sekiguchi F, Tanaka
Y and Ishitsuka H: X-ray irradiation induces thymidine
phosphorylase and enhances the efficacy of capecitabine (Xeloda) in
human cancer xenografts. Clin Cancer Res. 5:2948–2953.
1999.PubMed/NCBI
|
|
12
|
Kurosumi M, Tabei T, Suemasu K, Inoue K,
Kusawake T, Sugamata N and Higashi Y: Enhancement of
immunohistochemical reactivity for thymidine phosphorylase in
breast carcinoma cells after administration of docetaxel as a
neoadjuvant chemotherapy in advanced breast cancer patients. Oncol
Rep. 7:945–948. 2000.
|
|
13
|
Toi M and Ohno S: The role of thymidine
phosphorylase (TP) in choosing FU/capecitabine chemotherapy. Proc
Am Soc Clin Oncol. 22:1372003.
|
|
14
|
O’Shaughnessy J, Miles D, Vukelja S,
Moiseyenko V, Ayoub JP, Cervantes G, Fumoleau P, Jones S, Lui WY,
Mauriac L, et al: Superior survival with capecitabine plus
docetaxel combination therapy in anthracycline-pretreated patients
with advanced breast cancer: phase III trial results. J Clin Oncol.
20:2812–2823. 2002.PubMed/NCBI
|
|
15
|
Terashima M, Fujiwara H, Takagane A, Abe
K, Araya M, Irinoda T, Yonezawa H, Nakaya T, Oyama K, Takahashi M
and Saito K: Role of thymidine phosphorylase and dihydropyrimidine
dehydrogenase in tumour progression and sensitivity to
doxifluridine in gastric cancer patients. Eur J Cancer.
38:2375–2381. 2002. View Article : Google Scholar : PubMed/NCBI
|
|
16
|
Nishimura G, Terada I, Kobayashi T,
Ninomiya I, Kitagawa H, Fushida S, Fujimura T, Kayahara M, Shimizu
K, Ohta T and Miwa K: Thymidine phosphorylase and dihydropyrimidine
dehydrogenase levels in primary colorectal cancer show a
relationship to clinical effects of 5′-deoxy-5-fluorouridine as
adjuvant chemotherapy. Oncol Rep. 9:479–482. 2002.PubMed/NCBI
|
|
17
|
Ishii R, Takiguchi N, Oda K, Koda K and
Miyazaki M: Thymidine phosphorylase expression is useful in
selecting adjuvant chemotherapy for stage III gastric cancer. Int J
Oncol. 19:717–722. 2001.PubMed/NCBI
|
|
18
|
Nishida M, Hino A, Mori K, Matsumoto T,
Yoshikubo T and Ishitsuka H: Preparation of anti-human thymidine
phosphorylase monoclonal antibodies useful for detecting the enzyme
levels in tumor tissues. Biol Pharm Bull. 19:1407–1411. 1996.
View Article : Google Scholar : PubMed/NCBI
|
|
19
|
Kono T, Nishida M, Inagaki N, Tanaka Y,
Yoneda M and Kasai S: Development and characterization of 1C6-203,
a new monoclonal antibody specific to human thymidine
phosphorylase. J Histochem Cytochem. 49:131–138. 2001. View Article : Google Scholar : PubMed/NCBI
|
|
20
|
Komuro Y, Watanabe T, Tsuno N, Kitayama J,
Inagaki N, Nishida M and Nagawa H: The usefulness of
immunohistochemical evaluation of dihydropyrimidine dehydrogenase
for rectal cancer treated with preoperative radiotherapy.
Hepatogastroenterology. 50:906–911. 2003.
|
|
21
|
Mori K, Hasegawa M, Nishida M, Toma H,
Fukuda M, Kubota T, Nagasue N, Yamana H, Hirakawa YS, Chung K,
Ikeda T, et al: Expression levels of thymidine phosphorylase and
dihydropyrimidine dehydrogenase in various human tumor tissues. Int
J Oncol. 17:33–38. 2000.PubMed/NCBI
|