Introduction
[18F]Fluorothymidine
([18F]FLT) is a promising positron emission tomography
(PET) tracer for monitoring tumor size (1). As [18F]FLT uptake is
regulated by the salvage pathway for DNA synthesis involving
equilibrative nucleoside transporter 1 (ENT1) and thymidine kinase
1 (TK1), the decrease in cell proliferation by drugs eventually
reduces [18F]FLT uptake. Yet, recent studies have
reported that some cytotoxic agents induce an initial increase in
[18F]FLT uptake (known as [18F]FLT flare)
during cell death. These chemotherapy agents include
antimetabolites, such as gemcitabine, 5-fluorouracil (5-FU),
methotrexate and capecitabine (2–6). The
mechanism underlying chemotherapy-induced [18F]FLT flare
may differ based on treatment schedules. Acute exposure to 5-FU
induces the redistribution of ENT1 to the plasma membrane, whereas
prolonged treatment with 5-FU increases the activity of ENT1 and
TK1, along with S phase arrest (7,8).
However, not all cytotoxic agents targeting DNA or inducing S phase
arrest provoke [18F]FLT flare. For example, cisplatin
induces DNA damage by crosslinking, which does not increase FLT
uptake (2,9,10). To
date, no individualized evaluation of cytotoxic agents for
[18F]FLT flare has been undertaken.
ENT1 is the main nucleoside transporter responsible
for FLT uptake, as it is widely expressed in mammalian cells and
tissues (11). It bi-directionally
transports purine and pyrimidine nucleosides in a
sodium-independent manner (12).
ENT1 differs from ENT2 in that it is sensitive to the inhibitor
S-(p-nitrobenzyl)-6-thioinosine (NBTI) analogues. ENT1 activity is
increased at the transcriptional level during S phase (13). It is also rapidly regulated at the
post-transcriptional level via PKCδ/ɛ, which converts it to the
active and available form at the plasma membrane (14). Studies on the pharmacological
regulation of ENT1 have focused on the downregulation of ENT1
activity by cardioprotective agents, such as dilazep, draflazine
and dipyridamole, and by cytotoxic agents, including
immunosuppressive, anticancer, and antiviral compounds (15,16).
Screening with protein kinase inhibitors showed that inhibitors of
tyrosine kinases, protein kinase C, cyclin-dependent kinase, mTOR
and p38 MAPK selectively decrease ENT1 and inhibit cell
proliferation. The pharmacological mechanisms that increase ENT1
activity and lead to [18F]FLT flare have not yet been
examined.
Here, we aimed to identify pharmacologically active
agents that increase ENT1 activity, and to investigate their
effects on FLT uptake and cell proliferation. We screened 60
cytotoxic compounds from the LOPAC1280 library, which regulate
apoptosis, cell cycle progression, DNA intercalation and DNA
metabolism, and which may be involved in the regulation of cell
viability or FLT metabolism (Table
I). We also investigated the role of ENT1 activation for
cytotoxic agent-induced cell death through screening. The induction
of ENT1 activity and its role in cell death was confirmed in three
types of cell lines with etoposide which was identified in this
screening for the first time.
 | Table IThe cytotoxic agents and their
representative targets. |
Table I
The cytotoxic agents and their
representative targets.
| Agent | Target |
|---|
| Altretamine | Antineoplastic |
| 3-Aminobenzamide | Inhibits
poly(ADP-ribose) synthetase |
|
4-Amino-1,8-naphthalimide | Inhibits
poly(ADP-ribose) polymerase |
| Amsacrine | Inhibits
topoisomerase II |
| Ancitabine | Antineoplastic,
metabolized to cytarabine |
| Apigenin | G2/M phase
arrest |
| Aurintricarboxylic
acid | Inhibits
topoisomerase II |
| 5-Azacytidine | Inhibits DNA
methyltransferase |
| Azelaic acid | Inhibits
mitochondrial oxidoreductases |
| Bay 11-7085 | Inhibits NFκB |
| Benzamide | Inhibits
poly(ADP-ribose) synthetase |
|
O6-Benzylguanine | Inhibits
O6-alkylguanine-DNA alkyltransferase |
| β-Lapachone | Induces
apoptosis |
|
5-Bromo-2′-deoxyuridine | Incorporates into
DNA |
| Caffeic acid
phenethyl ester | Inhibits NFκB |
|
(S)-(+)-camptothecin | Inhibits
topoisomerase II |
| Carboplatin | Antineoplastic |
| Carmustine | Alkylates DNA;
causes interstrand crosslinks |
| CB 1954 | Antineoplastic |
| CCT007093 | PPM1D
inhibitor |
| Chlorambucil | Crosslinks DNA |
| Chloroquine | Binds strongly to
double-stranded DNA |
| CHM-1 hydrate | Binds tubulin and
inhibits tubulin polymerization |
| Cisplatin | Crosslinks DNA |
|
Cyclophosphamide | Crosslinks DNA |
|
Cytosine-1-β-D-arabinofuranoside | Inhibits DNA
synthesis |
| Daidzein | Inhibits
mitochondrial aldehyde dehydrogenase; G1-phase arrest |
| Ellipticine | Inhibits
topoisomerase II |
| Emetine | Inhibits
RNA-protein translation |
| Etoposide | Inhibits
topoisomerase II |
| 10058-F4 | Inhibits c-Myc-Max
interaction; prevents c-Myc target gene transactivation |
|
5-Fluoro-5′-deoxyuridine | Inhibits DNA
synthesis |
| 5-Fluorouracil | Inhibits
thymidylate synthetase; S phase arrest |
| Fusidic acid | Inhibits protein
synthesis |
| Ganciclovir | Pro-drug nucleoside
analogue |
| Gossypol | Inhibits PKC |
| Hydroxyurea | Inactivates
ribonucleoside reductase |
| Idarubicin | Inhibits
topoisomerase II |
|
1,5-Isoquinolinediol | Inhibits
poly(ADP-ribose) synthetase |
| L-Mimosine | Iron chelator that
inhibits DNA replication; G1-phase arrest |
| MDL 28170 | Inhibits calpain I
and II |
| Melphalan | Crosslinks DNA |
| Methotrexate | Folic acid
antagonist |
| Minocycline | Inhibits basement
membrane protease |
|
m-Iodobenzylguanidine | Inhibits ADP
ribosylation, mitochondrial membrane potential |
| Mitoxantrone | Inhibits DNA
synthesis |
| Mizoribine | Inhibits inosine
monophosphate dehydrogenase; G/S arrest |
| Nimustine | Alkylates DNA |
| PAC-1 | Activates
caspase-3 |
| p-Benzoquinone | Inhibits
topoisomerase II |
| Phosphonoacetic
acid | Inhibits DNA
polymerase |
| Pifithrin-μ | Inhibits p53
binding to mitochodria, Bcl-xL, and Bcl-2 |
| Pyrocatechol | Causes DNA strand
breakage |
| Retinoic acid | Induces
caspase-dependent apoptosis |
| Retinoic acid
p-hydroxyanilide | Vitamin A acid
analogue |
| Ribavirin | Inhibits of inosine
monophosphate dehydrogenase |
|
Se-(methyl)selenocysteine | Chemopreventive
agent |
| SU 9516 | Inhibits
cyclin-dependent kinase-2 |
| TG003 | Inhibits cdc2-like
kinase |
Materials and methods
Materials
HeLa, HT29 and MDA-MB-231 cells were obtained from
the American Type Culture Collection (Rockville, MD).
[3H]S-(p-Nitrobenzyl)-6-thioinosine
([3H]NBTI) (10 Ci/mmol) and
[methyl-3H]FLT (9.5 Ci/mmol) were obtained from
Moravek Biochemicals (Brea, CA).
[methyl-3H]thymidine (9.5 Ci/mmol) was from
Perkin-Elmer (Waltham, MA). The LOPAC1280 library and other
reagents were purchased from Sigma-Aldrich (St. Louis, MO) for
screening ENT1 activity. Etoposide (E1383) used in confirmatory
experiments of ENT1 activity was additionally purchased from
Sigma-Aldrich.
Cell culture, treatment and
preparation
Cells were maintained in RPMI-1640 containing 10%
fetal bovine serum, 10 U/ml penicillin and 10 μg/ml streptomycin at
37°C in a humidified atmosphere with 5% CO2. For
screening, all of the agents were used initially at a concentration
of 10 μM, but some agents that induced dramatic cell death within
24 h at 10 μM were used at a reduced concentration (1 μM for
β-lapachone, CHM-1 and mitoxantrone; 0.5 μM for idarubicin). Cell
lysates were prepared as described previously (7). Protein content was determined using
the Bradford assay (Bio-Rad, Hercules, CA).
ENT1 activity in the plasma membrane
The number of [3H]NBTI binding sites/cell
was determined according to Perumal et al(8). To determine the Kd and Bmax
values for each cell line, 1×10⁶ cells were incubated
with Hank’s buffered salt solution containing [3H]NBTI
at a concentration of 0.12, 0.2, 0.47, 0.94, 1.88, 3.75, 7.50 or 15
nM for 1 h under gentle agitation. In a parallel series of samples,
20 μM S-(4-nitrobenzyl)-6-thioguanosine (NBTG) was included for the
calculation of specific binding. After washing with
Na+-containing buffer, cells were resuspended in lysis
buffer. The radioactivity of the lysates was measured in a liquid
scintillation counter (Perkin-Elmer). Screening was performed with
[3H]NBTI at 4.6-fold higher than the Kd value of HeLa
cells (3.75 nM) to economize the amount of isotope. Confirmatory
studies were conducted for etoposide using 10 nM
[3H]NBTI, which is 6- to 15-fold higher than the Kd
value of all the cell lines. Screening was repeatedly performed in
five sets, with 10 agents/set (n≥4). In every set, the vehicle and
5-FU were included as internal controls (n=15).
Cell viability
Cells were plated at a density of 2×10³
cells/well in 96-well plates, incubated overnight, and exposed to
each drug for 72 h at the same concentration used for the screening
of ENT1 activity. Cell viability was examined using the
3-(4,5-dimethylthiazol-2-yl)-5-(3-carboxymethoxyphenyl)-2-(4-sulfophenyl)-2H-tetrazolium
(MTS) assay according to the manufacturer’s instructions (Promega,
Madison, WI). Three independent experiments were performed, each of
which was performed in triplicate.
[3H]FLT uptake assay
Twenty-four hours after seeding in 6-well plates at
3×10⁵ cells/well, exponentially growing cells were
exposed to agents for 24 h. The media were then removed and
replaced with 1 ml fresh medium containing [3H]FLT and
incubated for a further 2 h. The radioactivity in the cells and the
supernatants was measured in a liquid scintillation counter
(Perkin-Elmer). An aliquot of each cell fraction was used for cell
counting by trypan blue exclusion. [3H]FLT uptake was
calculated as 100 × CPMcells/(CPMcells +
CPMsupernatants/1×105 viable cells. All
experiments were independently repeated four times.
Flow cytometric analysis
Cells treated with vehicle or etoposide for 24 h
were trypsinized, fixed in 70% ethanol, stained with propidium
iodide, and subjected to flow cytometry (Becton Dickinson, San
Jose, CA). Data obtained from the Particle Analysis System were
processed with ModFit LT software (Verity Software House). All
experiments were independently repeated three times.
Measurement of TK1 activity
TK1 activity was measured as described previously
with slight modifications (7).
Briefly, phosphate-buffered saline-washed cells were trypsinized,
lysed, and differentially centrifuged to isolate the cytosolic
fractions. Samples were mixed with an equal volume of reaction
buffer containing [methyl-3H]thymidine followed
by incubation at 37°C with gentle stirring. The slope of the
time-activity curve was used to calculate the number of picomoles
of phosphorylated thymidine/min/μg protein (pmol/min/μg).
Immunoblot analysis
SDS-polyacrylamide gel electrophoresis and
immunoblot analysis were performed as described (7). Multiple analyses were performed with
different sets of samples. Changes in expression levels were
determined by scanning densitometry using Universal Hood II
(Bio-Rad) and Quantity One software and normalized relative to the
level of β-actin expression.
Statistical analysis
Data are expressed as the means ± SD. The Wilcoxon’s
signed-rank test and repeated measured ANOVA were used to compare
treatments, and the Spearman’s correlation coefficient was used to
analyze ENT1 activity and [3H]FLT uptake data using the
software package SPSS 12.0 (r≥0.70, strong correlation;
0.5≤r<0.7, moderately strong correlation; 0.3≤r<0.5,
weak-to-moderate correlation; and 0.1≤r<0.3, weak correlation)
(17). Statistical significance was
set at P<0.05 or P<0.01 as indicated in the Results section.
Prism software (version 4.03; GraphPad, San Diego, CA) was used for
calculation of the Bmax and Kd by curve fitting
according to the equation: Y = Bmax × X/(Kd + X), where
Y and X are the specific binding and [3H]NBTI
concentration in nmol/l, respectively.
Results
Screening of 60 cytotoxic agents for ENT1
activity
Screening of 60 cytotoxic agents known to induce
apoptosis, inhibit cell cycle progression, increase DNA
intercalation, or inhibit DNA metabolism for ENT1 activity was
performed using HeLa cells (Table
I). As HeLa cells predominantly express the ENT1 rather than
other nucleoside transporter isotypes (14), ENT1 activity is expected to reflect
nucleoside dynamics. In general, it is recommended that
[18F]FLT-PET not be performed immediately after
treatment to avoid off-target effects. Thus, the equilibrative
response to agents was evaluated after 24 h of treatment. Most of
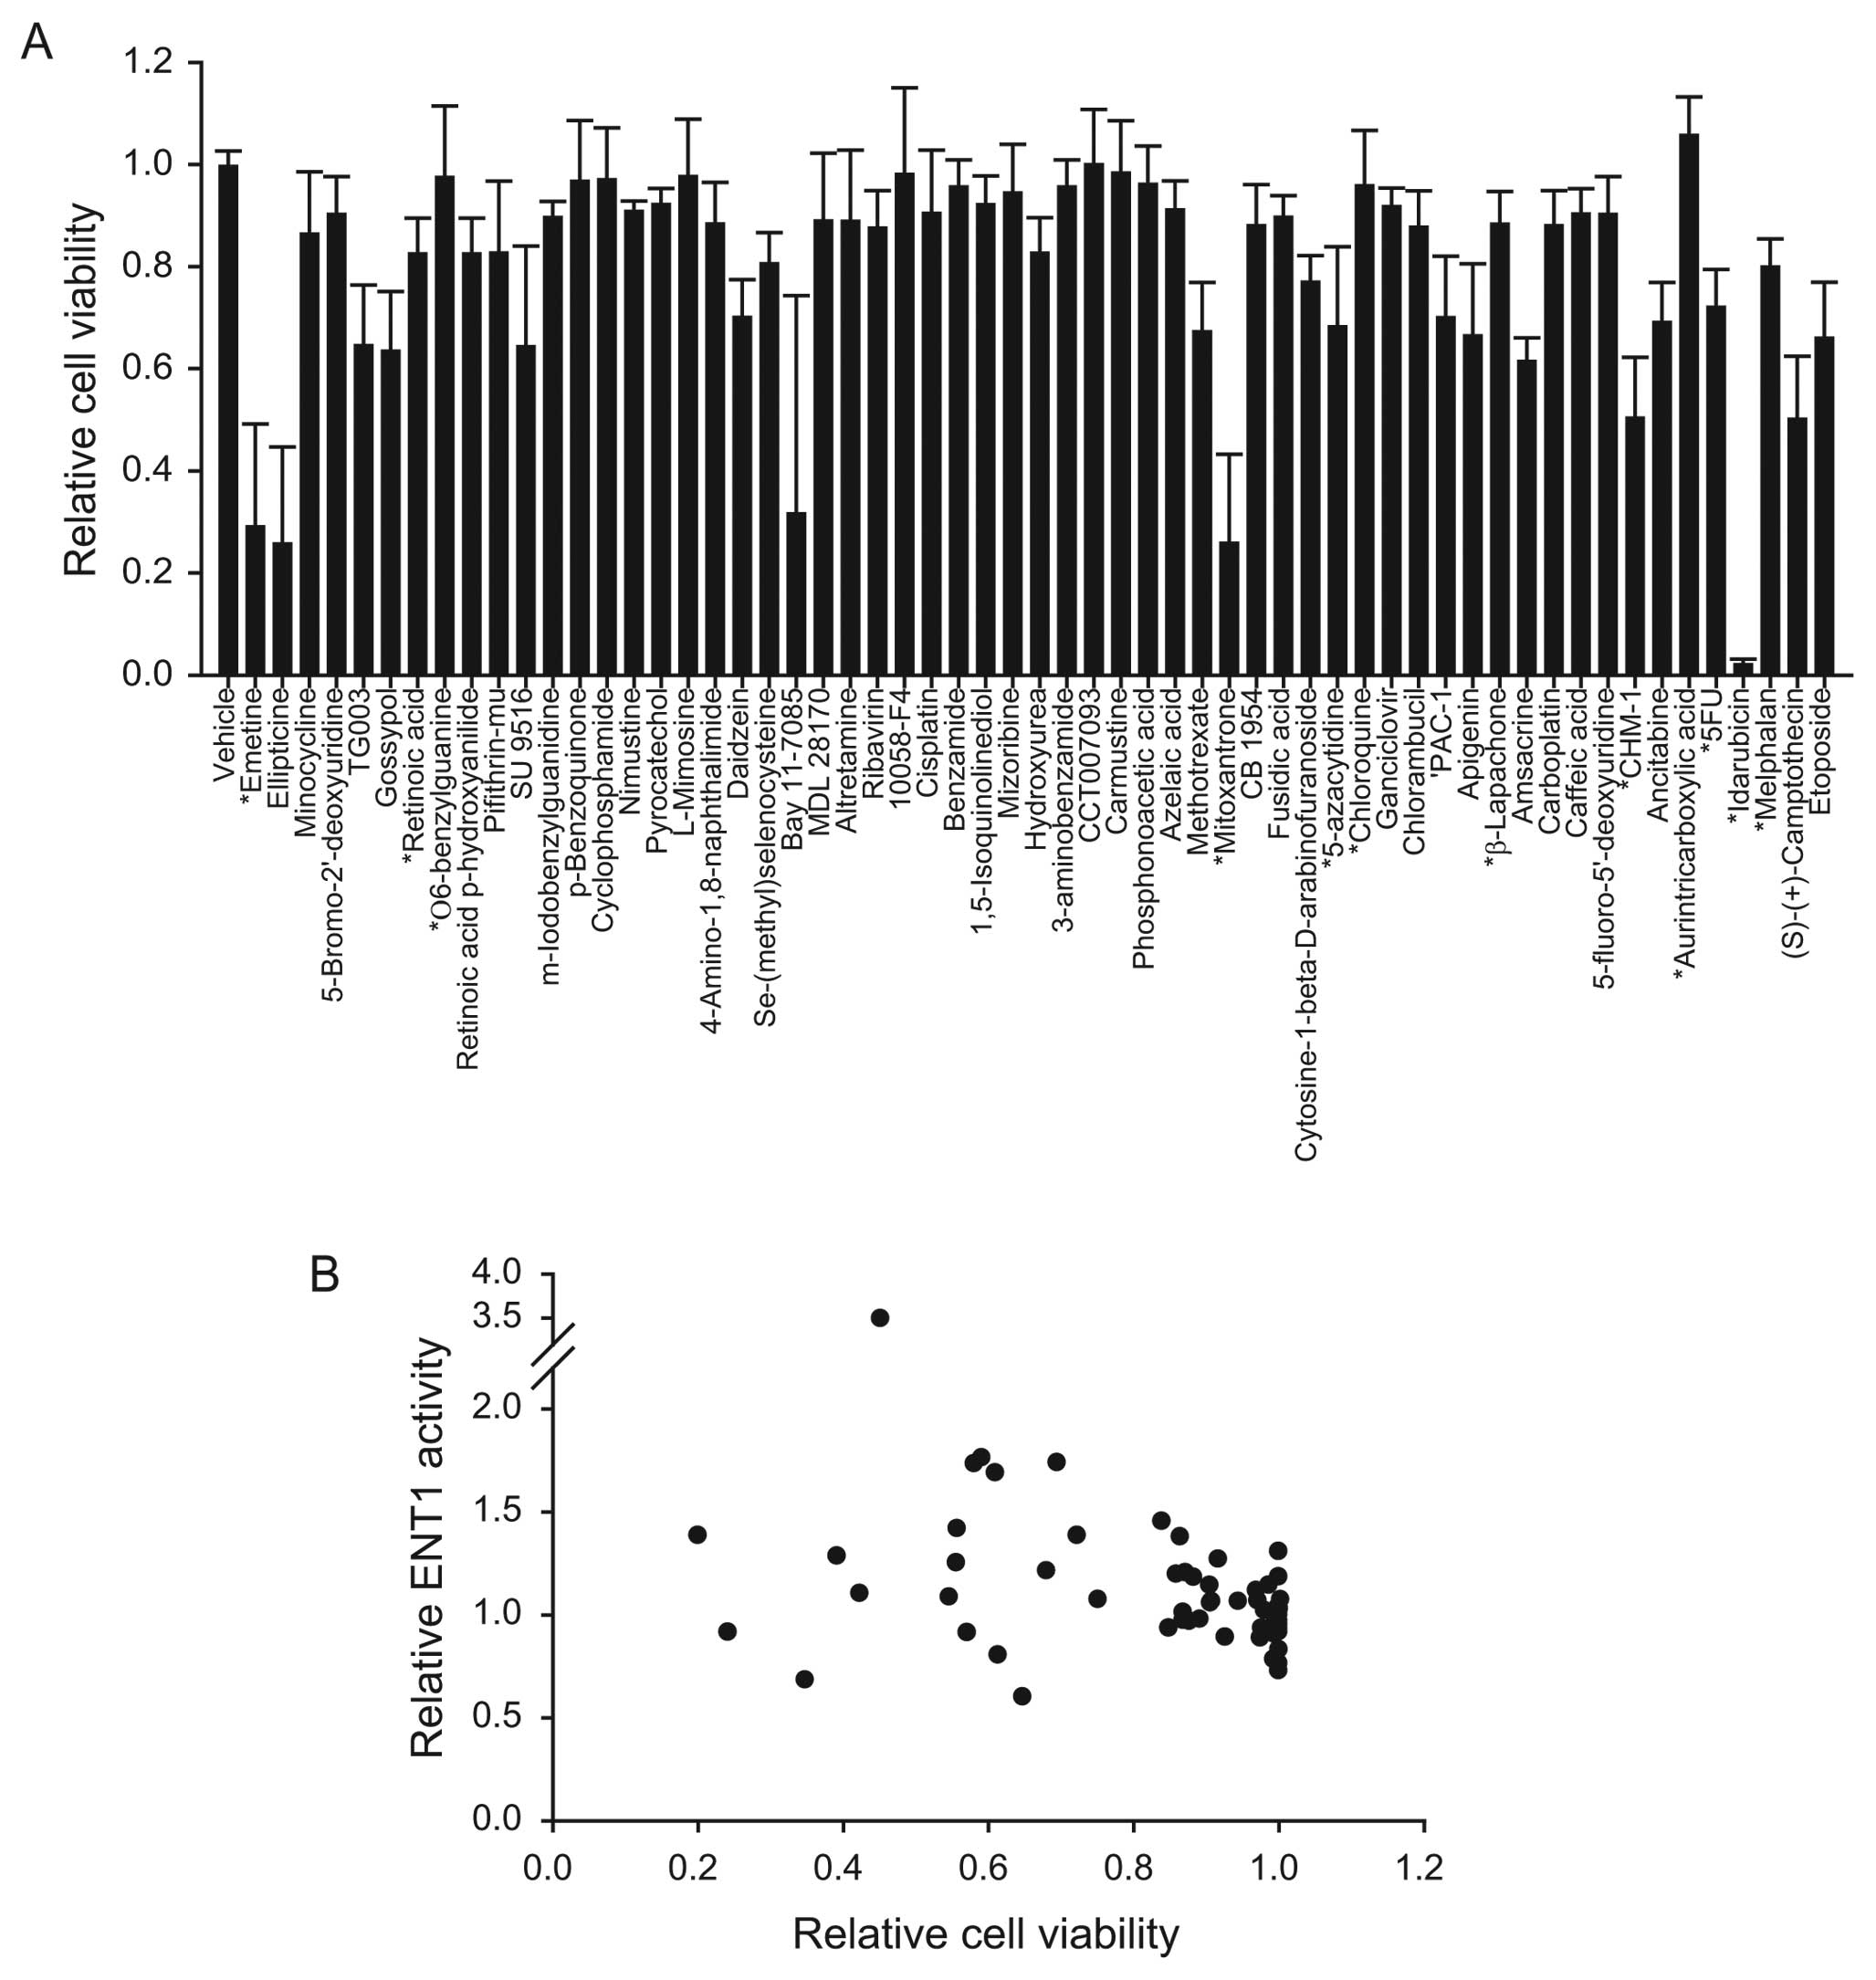
the agents studied had a minimal effect on ENT1 activity (Fig. 1). Emetine, ellipticine, and
minocycline decreased ENT1 activity by 40%. The agents that
increased ENT1 activity by >2 standard deviations were 5-FU (DNA
metabolism inhibition), melphalan (DNA alkylation), camptothecin
(topoisomerase I inhibition), idarubicin (topoisomerase II
inhibition), and etoposide (topoisomerase II inhibition).
Changes in the cell viability induced by
the 60 cytotoxic agents
Cell viability changes in HeLa cells in response to
the screened agents were measured to determine whether the changes
in ENT1 activity correlated with cell death. All of the agents were
used at the same concentrations as indicated in Fig. 1, and were incubated with the cells
for 72 h. Of the compounds tested, 12% reduced the relative cell
viability by >60%, 24% reduced the relative viability by between
20 and 60%, and 64% reduced relative viability by <20% (Fig. 2A). Plotting the relative cell
viability vs. ENT1 activity revealed that the two parameters showed
no correlation (Fig. 2B).
Changes in [3H]FLT uptake
correlate with ENT1 activity
Uptake changes for [3H]FLT were examined
to investigate whether the changes in ENT1 activity by
pharmacologically active agents influence [18F]FLT-PET.
We randomly selected 14 agents and measured [3H]FLT
uptake after 24 h of exposure (Fig.
3A). Drug treatment changed [3H]FLT uptake from −16
to 111% compared with vehicle treatment. [3H]FLT uptake
was highly correlated with the relative changes in ENT1 activity
(Spearman’s correlation coefficient, r=0.66; P<0.01) (Fig. 3B).
Confirmation of etoposide-induced ENT1
activity and uptake of [3H]FLT in HeLa, HT29 and
MDA-MB-231 cells
As etoposide effectively increased ENT1 activity in
the screening (Fig. 1), we
confirmed the effect of etoposide in HT29 cells (a ENT1-low
expressing cell line) and MDA-MB-231 cells (a ENT1-high expressing
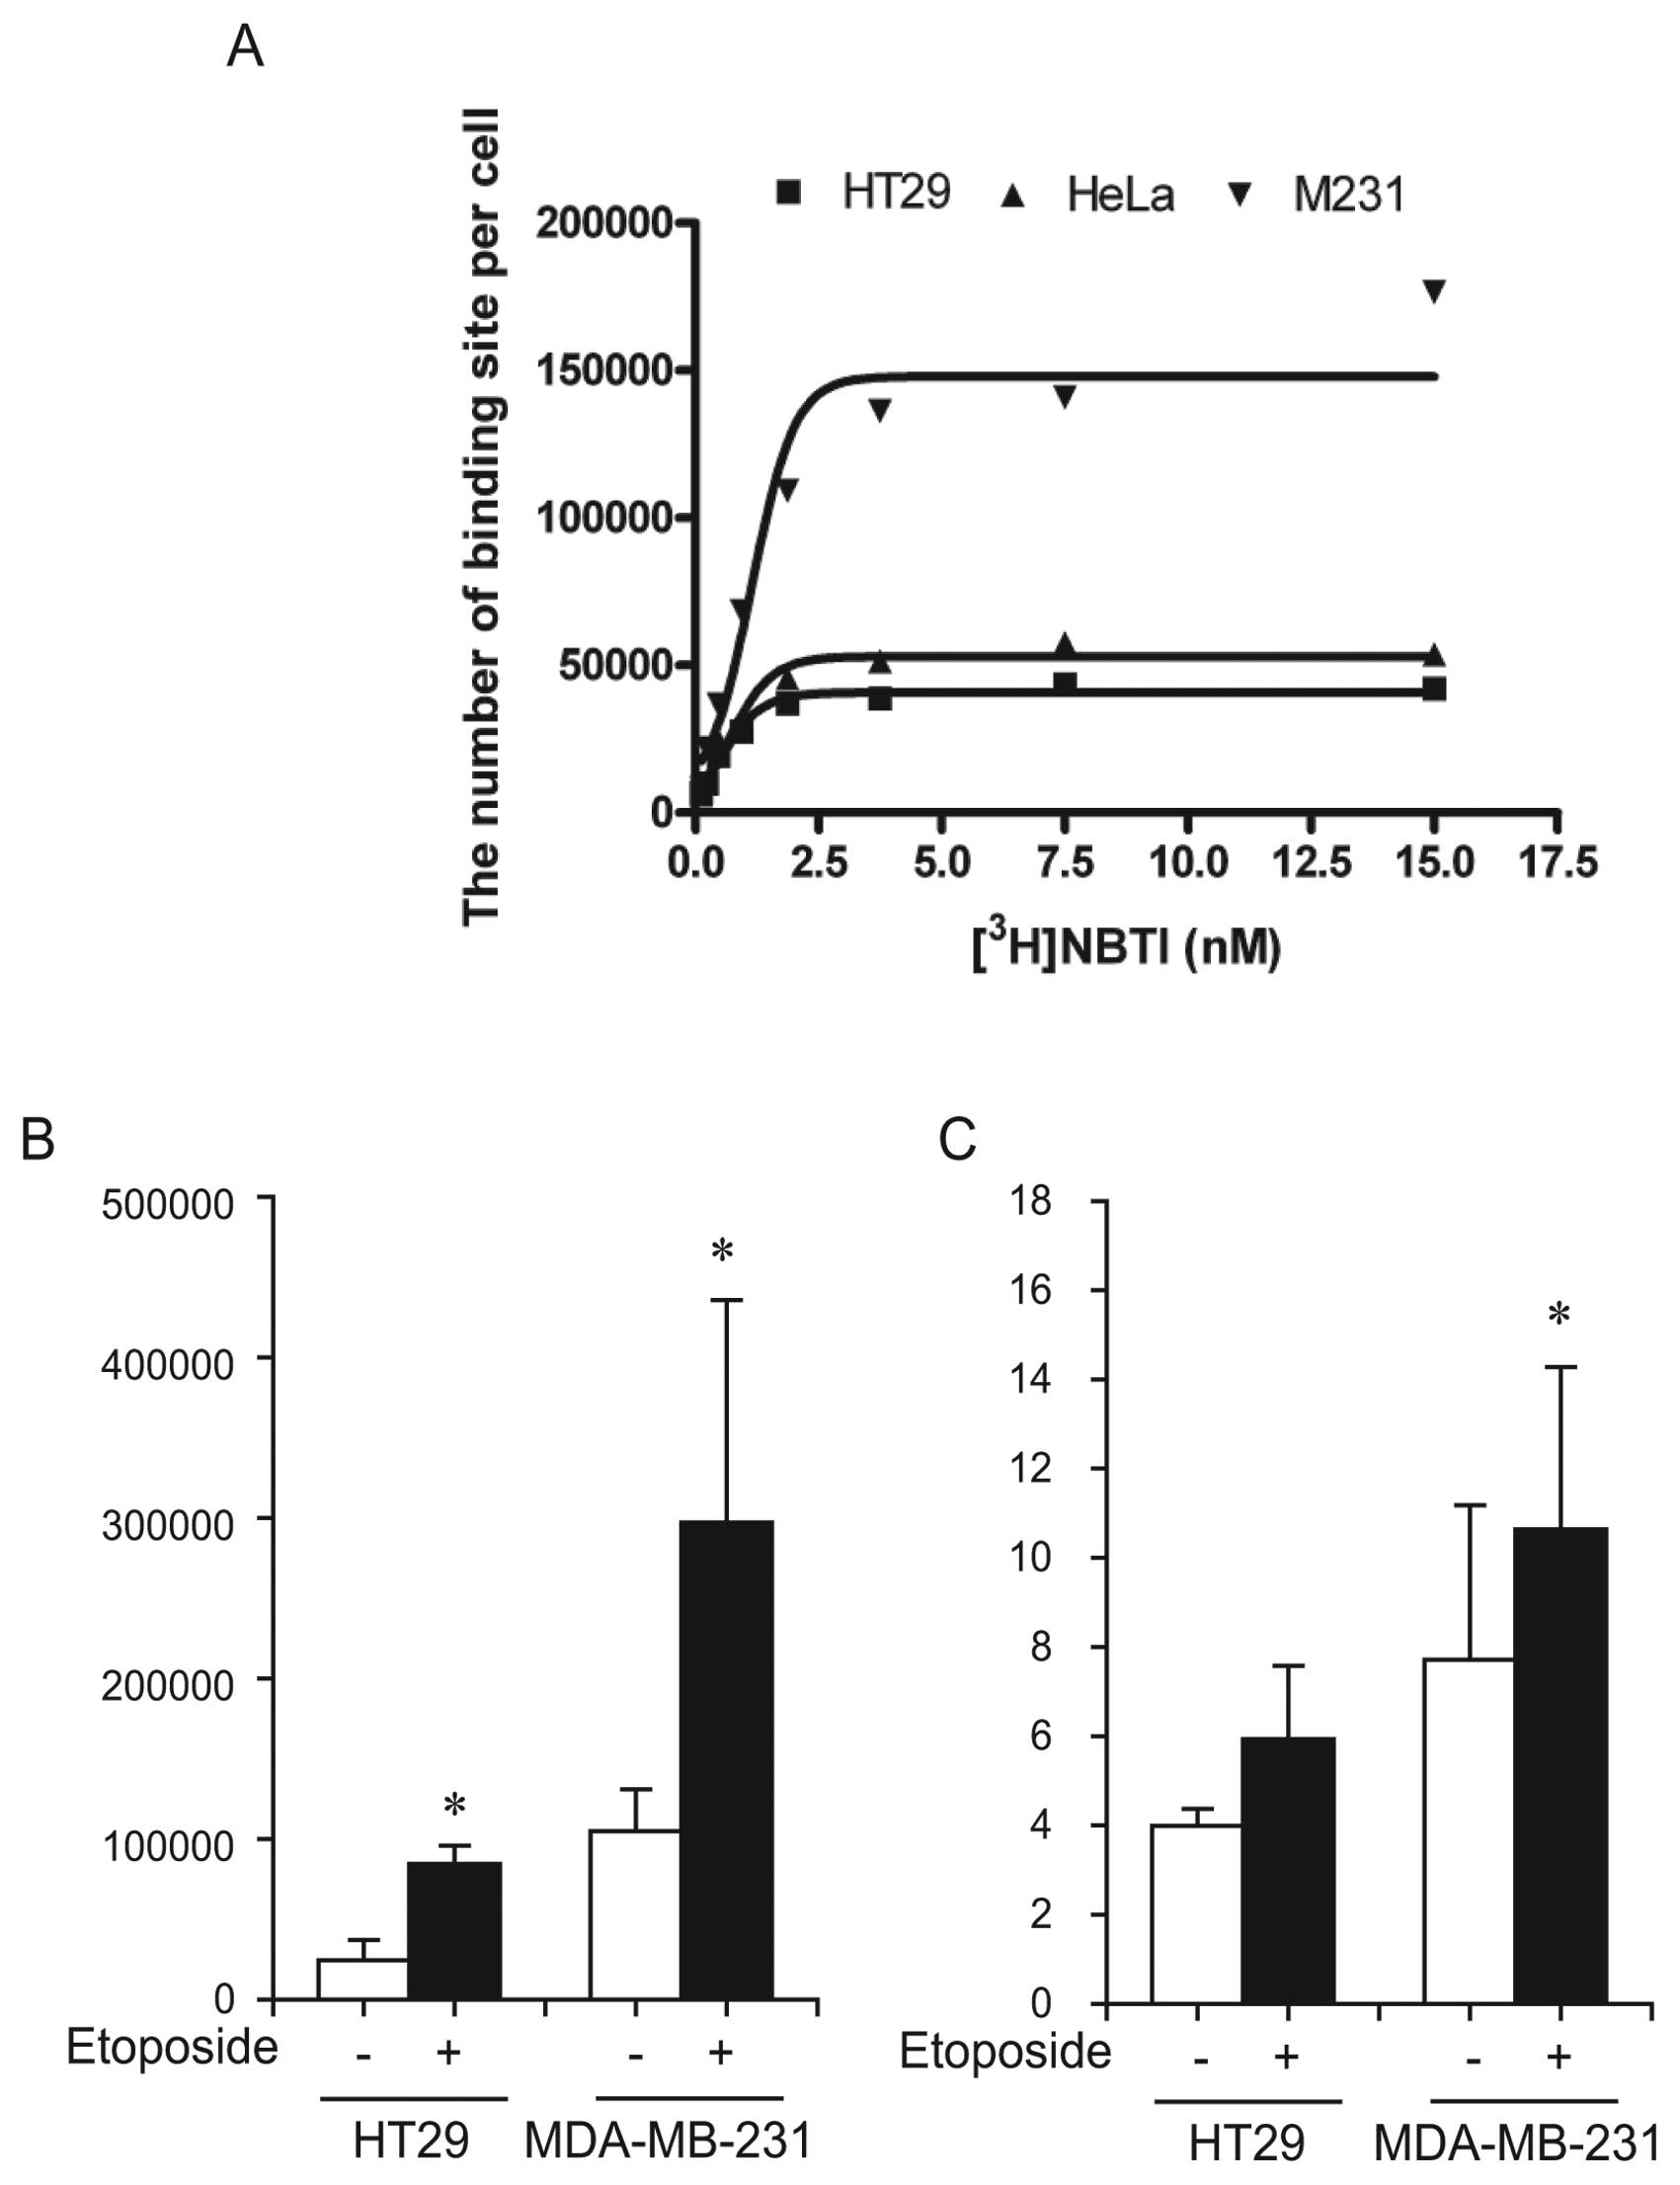
cell line) (18). We confirmed the
concentration of ligand required to reach half maximal binding (Kd,
affinity) and the maximal binding (Bmax, the number of
transporters) in our systems and calculated these values as 1.626
and 188,587 for MDA-MB-231 cells, 0.808 and 60,996 for HeLa cells,
and 0.643 and 46,111 for HT29 cells, respectively (Fig. 4A). The number of [3H]NBTI
binding sites/cell increased 3.45 and 2.83 times after etoposide
treatment in HT29 and MDA-MB-231 cells, respectively (Fig. 4B) (P<0.05). In parallel, the
basal level (vehicle-treated) of [3H]FLT uptake was
higher in MDA-MB-231 cells than in HT29 cells. Treatment with
etoposide for 24 h induced the increase in [3H]FLT
uptake by 49% in HT29 cells and 38% in MDA-MB-231 cells (Fig. 4C) (P<0.05), which was correlated
with a change in ENT1 activity.
Etoposide-induced cell cycle changes in
HeLa, HT29 and MDA-MB-231 cells
In order to investigate the molecular mechanism for
the increase in ENT1 activity by etoposide, we measured the
etoposide-induced effect on the cell cycle. Etoposide significantly
increased the fraction of HeLa, HT29 and MDA-MB-231 cells in the S
and G2M phases by ~2-fold after 24 h of treatment (Fig. 5A) accompanied by an increase in TK1
activity (Fig. 5B) (P<0.05 for
HT29 cells; P<0.01 for MDA-MB-231 cells). Time-dependent
analysis showed that TK1 expression significantly increased at 24 h
in HeLa and HT29 cells, and remained elevated until 48 h
post-stimulation (Fig. 5C). The
expression of cyclin A was slightly increased by etoposide in HeLa
cells, whereas it was significantly increased in HT29 cells.
Combination effect of ENT1 inhibitors on
etoposide-induced cytotoxicity in HeLa, HT29 and MDA-MB-231
cells
In order to apply ENT1-mediated [18F]FLT
flare to monitor therapeutic response, the mechanism for ENT1
activation should be related with the cell death pathway. We
hypothesized that the inhibition of ENT1 activity may affect
etoposide-induced cytotoxicity when the increase in ENT1 activity
by etoposide contributes to the increase in salvage capacity and
resistance mechanism. We monitored the etoposide-induced cell
viability with dipyridamol or NBTI, inhibitors for the nucleoside
transporter, after a 72-h treatment (Fig. 6). Etoposide dose-dependently
decreased cell viability in three cell lines (P<0.05). The
maximum cytotoxic effect was highest in HT29 cells with 41.3%. The
HeLa cells treated with dipyridamol or NBTI alone showed a slight
decrease in viability. The HeLa cells that were co-treated with
dipyridamol or NBTI did not show a dose-dependent cytotoxic effect
for etoposide, suggesting the possibility that the inhibitors
repress the dose-dependent cytotoxic effect of etoposide or that
the cytotoxic effect of the inhibitor is dominant over that of
etoposide. However, dipyridamol or NBTI did not exhibit any changes
in etoposide-induced cell death in the HT29 and MDA-MB-231 cells.
These results indicate that the role of ENT1 activation by
etoposide is cell type-dependent and could be downstream from the
pathway that is subordinate or irrelevant to cell death.
Discussion
A recent study showed that various cytotoxic drugs
induce [18F]FLT flare, which raises caution concerning
the schedule of dosing and imaging. ENT1 is a part of the salvage
pathway for DNA synthesis and is an indispensable mediator of FLT
transportation. However, extensive screening for the
pharmacological regulation of ENT1 activity in relation to
[18F]FLT flare has not yet been performed. In this
study, we identified ENT1 modulators by screening 60 cytotoxic
agents, and showed that pharmacological agent-induced changes in
ENT1 activity correlate with [3H]FLT uptake. We
specifically confirmed that etoposide-induced increases in ENT1
activity were due to cell cycle arrest in the proliferation
phase.
To date, no adequate assay system for evaluating
ENT1 activity on a large scale has been established, which has
limited the availability of information regarding the regulation of
ENT1. A previous study of ENT1 activity induced by 22 protein
kinase inhibitors conducted by the Graves group used a
[3H]uridine uptake assay (16). This assay has advantages in that it
is simple and only a small number of cells are required. However,
it was not suitable for our screening, as the incubation time for
[3H]uridine uptake assay is approximately 30 sec and a
large number of samples could provoke prolonged washout time
leading to [3H]uridine efflux into the media. In this
study, we adopted a [3H]NBTI binding assay as NBTI
inhibits selective [3H]NBTI binding to ENT1 in the
plasma membrane and we could stably analyze up to 10 agents at
once. In all sets, vehicle and 5-FU were included as internal
controls. However, the method still has some limitations in that
the standard deviation was relatively high. The values for vehicle-
and 5-FU-treated samples were 27,606.4±6,948.4 and
46,595.8±14,776.0, respectively. Given that the ideal assay for
screening has a Z factor >0.5 (19), the overlap between the positive and
the negative controls makes it difficult to identify agents that
induce ENT1 activity to a lesser extent than 5-FU. This may be due
to the fact that the [3H]NBTI binding assay requires
multiple steps for each individual sample. The development of a
more accurate assay system, such as a 96-well plate-based ligand
binding assay, would allow confirmation of the present
findings.
Our data demonstrated for the first time that
topoisomerase I/II inhibitors such as aurintricarboxylic acid,
idarubicin, camptothecin and etoposide potently increase ENT1
activity at a level comparable with, or higher than, 5-FU. The
increase in ENT1 activity mediated by etoposide was confirmed in
MDA-MB-231 and HT29 cells. Yet, not all of the topoisomerase
inhibitors altered ENT1 activity (amsacrine, ellipticine, and
p-benzoquinone). Similarly, some antimetabolites minimally changed
ENT1 activity within a 2 SD variation (ribavirin, methotrexate and
ganciclovir) in contrast to 5-FU. In addition, the inducers for
cell cycle at S phase such as hydroxyurea (21) and mizoribine (22) did not increase ENT1 activity in this
system. It is thought that the potency or duration of ENT1
activation by each agent would be different as we used a fixed
concentration for screening and obtained various ranges of
cytotoxicity (Fig. 2). When agents
are used at the isotoxic dose in each cell lines it is expected
that they produce a similar tendency for ENT1 activation.
The possibility has been raised that
[18F]FLT flare could be used for the treatment
monitoring of the thymidylate synthase inhibitor (3,20).
However it has never been examined whether [18F]FLT
flare reflects the degree of treatment response. Our results showed
that ENT1 activity did not correlate with cell viability measured
by MTS, but highly correlated with [3H]FLT uptake based
on the data from 14 randomly selected agents (Figs. 2 and 3). The increase in ENT1 activity may
contribute to the influx of thymidine into the cytoplasm, the
increase in salvage capacity, and eventually treatment failure. Our
study on etoposide revealed that etoposide-induced ENT1 activation
was cell-type dependent (Fig. 6).
In HeLa cells, the blocking of ENT1 activity repressed
etoposide-induced cell death in HeLa cells, indicating ENT1
activation contributes to an etoposide-induced mechanism for HeLa
cell death. In contrast, ENT1 inhibitors had no effect on
etoposide-induced cell death in HT29 and MDA-MB-231 cells,
suggesting that the pathway for ENT1 activation may be irrelevant
to cell death. If anticancer agents may affect ENT1 activity
independent of the cell death pathway, FLT uptake may not reflect
anticancer agent-induced changes in cell viability. Therefore, it
would be better to monitor the effect of anticancer agents after a
prolonged period of exposure to avoid the ENT1-mediated effect on
FLT uptake. Additionally, the kinetics of ENT1 activity induced by
anticancer agents should be carefully investigated.
Our studies found that the modulation of ENT1
activity by pharmacological agents is closely related to
[3H]FLT uptake. Furthermore, we demonstrated that
etoposide is a potent inducer of ENT1 activity, which is
accompanied by an increase in TK1 activity and [3H]FLT
flare. This study provides valuable information regarding the
possible application of FLT-PET for etoposide-based
chemotherapy.
Acknowledgements
This study was supported by a grant from the Korea
Healthcare Technology R&D Project of the Ministry for Health,
Welfare, and Family Affairs, Republic of Korea (A101187). The
authors thank H.J. Lee for her help with this study.
References
|
1
|
Shields AF, Grierson JR, Dohmen BM, et al:
Imaging proliferation in vivo with [F-18]FLT and positron emission
tomography. Nat Med. 4:1334–1336. 1998.
|
|
2
|
Dittmann H, Dohmen BM, Kehlbach R, et al:
Early changes in [18F]FLT uptake after chemotherapy: an
experimental study. Eur J Nucl Med Mol Imaging. 29:1462–1469.
2002.
|
|
3
|
Kenny LM, Contractor KB, Stebbing J, et
al: Altered tissue 3′-deoxy-3′-[18F]fluorothymidine
pharmacokinetics in human breast cancer following capecitabine
treatment detected by positron emission tomography. Clin Cancer
Res. 15:6649–6657. 2009.
|
|
4
|
Pillai RG, Forster M, Perumal M, et al:
Imaging pharmacodynamics of the alpha-folate receptor-targeted
thymidylate synthase inhibitor BGC 945. Cancer Res. 68:3827–3834.
2008. View Article : Google Scholar : PubMed/NCBI
|
|
5
|
Pressacco J, Wiley JS, Jamieson GP,
Erlichman C and Hedley DW: Modulation of the equilibrative
nucleoside transporter by inhibitors of DNA synthesis. Br J Cancer.
72:939–942. 1995. View Article : Google Scholar : PubMed/NCBI
|
|
6
|
Pressacco J, Mitrovski B, Erlichman C and
Hedley DW: Effects of thymidylate synthase inhibition on thymidine
kinase activity and nucleoside transporter expression. Cancer Res.
55:1505–1508. 1995.PubMed/NCBI
|
|
7
|
Lee SJ, Kim SY, Chung JH, Oh SJ, et al:
Induction of thymidine kinase 1 after 5-fluorouracil as a mechanism
for 3′-deoxy-3′-[18F]fluorothymidine flare. Biochem Pharmacol.
80:1528–1536. 2010.PubMed/NCBI
|
|
8
|
Perumal M, Pillai RG, Barthel H, et al:
Redistribution of nucleoside transporters to the cell membrane
provides a novel approach for imaging thymidylate synthase
inhibition by positron emission tomography. Cancer Res.
66:8558–8564. 2006. View Article : Google Scholar
|
|
9
|
Cruet-Hennequart S, Villalan S,
Kaczmarczyk A, O’Meara E, Sokol AM and Carty MP: Characterization
of the effects of cisplatin and carboplatin on cell cycle
progression and DNA damage response activation in DNA polymerase
eta-deficient human cells. Cell Cycle. 8:3039–3050. 2009.
View Article : Google Scholar : PubMed/NCBI
|
|
10
|
Yau K, Price P, Pillai RG and Aboagye E:
Elevation of radiolabelled thymidine uptake in RIF-1 fibrosarcoma
and HT29 colon adenocarcinoma cells after treatment with
thymidylate synthase inhibitors. Eur J Nucl Med Mol Imaging.
33:981–987. 2006. View Article : Google Scholar
|
|
11
|
Paproski RJ, Ng AM, Yao SY, Graham K,
Young JD and Cass CE: The role of human nucleoside transporters in
uptake of 3′-deoxy-3′-fluorothymidine. Mol Pharmacol. 74:1372–1380.
2008.
|
|
12
|
King AE, Ackley M, Cass CE, Young JD and
Baldwin SA: Nucleoside transporters: from scavengers to novel
therapeutic targets. Trends Pharmacol Sci. 27:416–425. 2006.
View Article : Google Scholar : PubMed/NCBI
|
|
13
|
Cass CE, Dahlig E, Lau EY, Lynch TP and
Paterson AR: Fluctuations in nucleoside uptake and binding of the
inhibitor of nucleoside transport, nitrobenzylthioinosine, during
the replication cycle of HeLa cells. Cancer Res. 39:1245–1252.
1979.PubMed/NCBI
|
|
14
|
Coe I, Zhang Y, McKenzie T and Naydenova
Z: PKC regulation of the human equilibrative nucleoside
transporter, hENT1. FEBS Lett. 517:201–205. 2002. View Article : Google Scholar : PubMed/NCBI
|
|
15
|
Huang M, Wang Y, Collins M, Gu JJ,
Mitchell BS and Graves LM: Inhibition of nucleoside transport by
p38 MAPK inhibitors. J Biol Chem. 277:28364–28367. 2002. View Article : Google Scholar : PubMed/NCBI
|
|
16
|
Huang M, Wang Y, Cogut SB, Mitchell BS and
Graves LM: Inhibition of nucleoside transport by protein kinase
inhibitors. J Pharmacol Exp Ther. 304:753–760. 2003. View Article : Google Scholar : PubMed/NCBI
|
|
17
|
Grem JL, Danenberg KD, Behan K, et al:
Thymidine kinase, thymidylate synthase, and dihydropyrimidine
dehydrogenase profiles of cell lines of the National Cancer
Institute’s Anticancer Drug Screen. Clin Cancer Res. 7:999–1009.
2001.PubMed/NCBI
|
|
18
|
Lu X, Gong S, Monks A, Zaharevitz D and
Moscow JA: Correlation of nucleoside and nucleobase transporter
gene expression with antimetabolite drug cytotoxicity. J Exp Ther
Oncol. 2:200–212. 2002. View Article : Google Scholar : PubMed/NCBI
|
|
19
|
Zhang JH, Chung TD and Oldenburg KR: A
simple statistical parameter for use in evaluation and validation
of high throughput screening assays. J Biomol Screen. 4:67–73.
1999. View Article : Google Scholar : PubMed/NCBI
|
|
20
|
Plotnik DA, McLaughlin LJ, Krohn KA and
Schwartz JL: The effects of 5-fluoruracil treatment on
3′-fluoro-3′-deoxythymidine (FLT) transport and metabolism in
proliferating and non-proliferating cultures of human tumor cells.
Nucl Med Biol. May 4–2012.(Epub ahead of print).
|
|
21
|
Liu L, Choi JH, Yim H, Choi JS, Park BD,
Cho SJ and Lee SK: ATR (AT mutated Rad3 related) activity
stabilizes Cdc6 and delays G2/M-phase entry during
hydroxyurea-induced S-phase arrest of HeLa cells. Int J Biochem
Cell Biol. 41:1410–1420. 2009. View Article : Google Scholar : PubMed/NCBI
|
|
22
|
Liu S, Xie Y, Lv Y, et al: A novel target
of mizoribine inhibiting mesangial cell proliferation: S phase
kinase-associated protein 2. Am J Nephrol. 32:447–455. 2010.
View Article : Google Scholar : PubMed/NCBI
|