Introduction
Breast cancer is one of the most common malignant
tumors in females, and hypoxia is observed during the development
of the disease. Hypoxia is closely associated with malignant tumor
progression, angiogenesis, invasion and the metastasis of tumor
cells, as well as with the tolerance to treatment (1). In response to hypoxia, tumors form
multiple vascular systems (angiogenesis) and improve the glycolytic
rate. Glycolysis is a compensatory process of energy metabolism
during hypoxia. As in most of the physiological activities in the
body, adenosine triphosphate (ATP) is involved in the growth and
proliferation of tumor cells and endothelial cells. In the context
of hypoxia, compensatory adaptation is mainly achieved through the
glycolytic process to obtain the necessary energy for life
activities. The activation of the glycolysis-related metabolic
enzyme enolase-1-mediated glycolytic pathway, improves the energy
imbalance of hypoxic cells, promotes the transcription,
proliferation and inhibits the apoptosis of the cellular oncogene,
leading to the promotion of angiogenesis and affecting the response
to hypoxia in tumor cells.
Enolase-1 is an oxidative stress protein derived
from endothelial cells, which plays an important role in the
conversion of 2-phosphoenolpyruvic acid in the glycolytic pathway.
The overexpression of enolase-1 and other enzymes in the glycolytic
process during hypoxia leads to the adaption of tumor cells to the
energy requirement, and consequently increases survival and
proliferation (2,3), as well as the invasive and metastatic
ability of the cells (4,5). Yoo and Regnier (6) revealed that enolase-1, along with heat
shock protein A and C were among the major oxidatively modified
proteins associated with oxidative stress, playing important roles
in response to hypoxia. It has been demonstrated that the
glycolysis of endothelial cells increases during hypoxia, which is
closely associated with angiogenic factors, such as tissue
inhibitors of metalloproteinases (TIMPs), and cytokines such as
tumor necrosis factor-α (TNF-α) and interleukin-β (IL-β).
Differential RT-PCR has indicated that the expression of enolase-1
and TIMPs in human microvascular endothelial cells increases during
hypoxia (7); enolase-1 and TIMPs
promoted angiogenesis together, and a positive correlation was
observed between them. Scharte et al(8) observed phenotypic changes and
increased glycolysis in rat intestine-derived epithelial cells
incubated in inflammatory medium [interferon-γ (IFN-γ), TNF-α and
IL-β)] under normoxic conditions, and increased hypoxia inducible
factor-1 (HIF-1) DNA binding and enolase-1 expression. By
high-throughput proteomic analysis, Somiari et al(9) demonstrated that the expression of
enolase in human breast infiltrating ductal carcinoma tissues was
higher than that in normal tissue. These findings suggest that
enolase may promote the angiogenesis of tumor cells in response to
hypoxia.
The expression of enolase-1 during hypoxia may be
related to the JNK signaling pathway. Choi et al(10) found that vitexin inhibited the
migration of rat pheochromocytoma (PC12) cells as well as their
invasion rates, and that it also inhibited tube formation by human
umbilical vein endothelial cells (HUVECs), acting in part, via the
JNK pathway. In response to hypoxia in tumor cells, the correlation
between hypoxia and enolase-1 and angiogenic factors, the role of
the possible signaling pathway, and its correlation with oncogenes
such as c-myc, p53, Bcl-2 and Bax should be further
investigated.
There is a subtle correlation between enolase-1 and
apoptotic factors. España et al(2) investigated the interaction of proteins
in breast cancer cells transfected with Bcl-x(L), and found that
the metastatic activity of the cells was associated with the
regulation of glycometabolism and amino acid metabolism. In
addition, the expression of both enolase and aminoacylase-1
significantly increased in the cytoplasm, and a higher correlation
was observed between them. It was speculated that the transfection
and expression of Bcl-x(L) coupled oxidative phosphorylation with
glycolysis to protect against apoptosis. The findings further
demonstrated that Bcl family, along with glycolytic metabolism,
inhibited the anoikis of cancer cells, and enabled the interaction
between the survived cells, which is in agreement with the study by
Kabbage et al(28). They
found that the expression of enolase-1 and antioxidant protein
(Mn-SOD) was significantly higher in breast cancer tissues compared
to normal tissues. HIF-1 exhibits an anti-apoptotic role, and the
mechanism involved may be associated with the activation of the
target gene, vascular endothelial growth factor (VEGF). Yu et
al(11) employed RNA
interference (RNAi) to effectively and specifically inhibit the
expression of HIF-1 in HUVECs. Following exposure to anoxia and
reoxygenation, it was observed that the percentage of apoptotic
HUVECs treated with RNAi was significantly greater than that of
HUVECs not treated with RNAi. In addition, HIF is considered as a
pro-apoptotic factor which downregulates Bcl-2 expression, and
hypoxia alters the microenvironment by inducing acidosis to
increase the p53 level and promote apoptosis (12). Enolase-1 is activated during hypoxia
and by HIF-1; therefore, the correlation between enolase-1 and
apoptosis and HIF-1 seems justified.
Use of specific RNAi to inhibit the expression of
enolase-1 in endothelial cells, may facilitate the understanding of
its role in promoting the proliferation of vascular endothelial
cells, inhibiting apoptosis, as well as promoting angiogenesis and
the active transformation of the upstream and downstream molecules
in the signaling pathway. The blockade of the pathway involved in
the adaption to hypoxia in endothelial cells, promotes the hypoxic
apoptosis of endothelial cells and inhibits angiogenesis, resulting
in the inhibition of tumor growth, invasion and metastasis; this
may provide references for increasing the sensitivity of
radiotherapy and improving efficacy.
Previous studies have demonstrated that the tumor
conditioned medium from the breast carcinoma cell line, MDA-MB-231,
cells led to the upregulated expression of enolase-1 in HUVECs, the
elevated reproductive and anti-apoptotic ability of endothelial
cells, increase in cell cycle progression and improved in
vitro angiogenesis (13,14). A
number of previous studies have proven the critical role of
enolase-1 in mediating transcription and proliferation (7). Based on previous studies, in the
present study, endothelial and breast cancer cells were co-cultured
and transfected with enolase-1 siRNA. HUVECs transfected or not
with enolase-1 siRNA were exposed to hypoxia. The critical proteins
in the enolase-1-mediated active proliferation of endothelial cells
and the active transformation of angiogenesis of breast cancer
cells responding to hypoxia were identified using cellular and
molecular biological and proteomics techniques. In addition,
enolase-1-transfected MDA-MB-231 cells were injected into nude mice
and radiotherapy was administered to observe the effect of
enolase-1 expression on the efficacy of radiotherapy.
Materials and methods
Cell culture and preparation of
conditioned medium
The culture of primary HUVECs was carried out as
previously described (14) with
some modifications. Umbilical cords were collected from newborn
healthy infants (informed consent was obtained and the study was
approved by the ethics review committee of our hospital). The
remaining blood in the umbilical vein was cleaned using sterile
cold phosphate-buffered saline (PBS) at 4°C in the laminar flow
hood and liquid leakage was checked. The umbilical vein was filled
with 0.1% collagenase, and then incubated in a water bath at 37°C
for 20 min. The digestive fluid was then transferred into 50-ml
centrifugal tubes, and centrifuged at 1,500 rpm for 15 min. The
supernatant was removed, and the complete M199 medium containing
100 μg/ml penicillin-streptomycin, 25 μg/ml endothelial cell growth
factor, 1% glutamine and 20% fetal bovine serum was added into the
tubes and the cells were cultured in Petri dishes. The HUVECs used
in the present study were from the second or third passage, and at
3–4 days in the log phase cell growth was determined using the
growth curve method. Under an inverted phase contrast microscope,
immunohistochemistry for factor VIII-related antigen in the
endothelial cells showed that the confluent monolayers of
endothelial cells appeared flagstone-like. The cell viability was
>95%, which was calculated using the trypan blue exclusion test,
and the cell growth curve was plotted. The endothelial cells were
synchronized by serum starvation and contact inhibition.
The MDA-MB-231 cell lines were cultured in M199
medium containing 10% fetal bovine serum, and the tumor cells were
synchronized by serum starvation (cultured without serum for 24 h).
When the tumor cell growth reached 85% confluence, the cells were
washed with PBS twice, and fresh M199 medium without serum was
added (4 ml), followed by culture at 37°C in an environment
containing 5% CO2 for 24 h. The supernatant was
collected, centrifuged at 100 × g to remove the cell debris, and
was then sifted from the filtration membrane with a mesh size of
0.22 μm and stored at −20°C for the subsequent experiment as
previously described (16).
Determination of cell proliferation
Cells were assigned to 4 groups according to the
treatment protocols: i) c-nor group, HUVECs cultured under normoxic
conditions; ii) s-nor group, HUVECs transfected with enolase-1
siRNA, and cultured under normoxic conditions; iii) c-1.0%
O2 group, HUVECs cultured in 1.0% O2 (hypoxic
conditions); iv) s-1.0% O2 group, HUVECs transfected
with enolase-1 siRNA, cultured in 1.0% O2 (hypoxic
conditions). The confluent monolayers of HUVECs were digested with
pancreatin (0.25% pancreatin + 0.1% EDTA), and then seeded onto
96-well plates at a concentration of 5×10³ cells per
well. After 24 h, the supernatant was removed and 200 μl of various
conditioned media were added and the different conditioned media
were diluted with endothelial cell culture fluid at a ratio of 1:1
for 60 h. After the supernatant was removed, the proliferation of
HUVECs was detected using 3-(4,5)-dimethylthiahiazo(-z-y1)-3,5-diphenytetrazoliumromide
(MTT) assay.
Determination of cell cycle using flow
cytometry (FCM)
The HUVECs in the c-nor, s-nor, c-1.0% O2
and s-1.0% O2 groups were digested with pancreatin
(0.25% pancreatin + 0.1% EDTA), and then seeded into culture flasks
at a concentration of 5×10³ cells per flask. After
culturing at 37°C in 5% CO2 overnight, 200 μl of various
conditioned media were added to the cells or the cells were treated
with different protocols for 60 h. Cells were then digested with
pancreatin, harvested and centrifuged at 1,500 rpm for 5 min,
washed with PBS, fixed in 70% ethanol, and stained with propidium
iodide. The cell cycle was detected using FCM.
Observation of morphology of
angiogenesis
The culture flasks containing endothelial cells with
50% of confluence were placed on the loading platform of a
thermostatic inverted biological microscope (Nikon, Tokyo, Japan),
and the temperature at the work region was sustained at 37°C. The
mitosis of endothelial cells was transmitted to the time-lapse
recorder (NV8085) via a low-light camera. The cassette speed of the
camera was set at 72 h. A fixed field of vision was selected and
continuous recording was performed, and the video was played back
at a normal speed to observe the dynamic process of the mitosis of
endothelial cells. The images were sampled using the
microcirculation digital imaging processor.
A total of 250 μl Matrigel matrix (20 g/l) was
sampled using a pre-cooled sterile pipet, and transferred to
pre-cooled 24-well plates, which were then placed at 37°C in a box
containing 5% CO2 to congeal the Matrigel matrix. The
endothelial cells were seeded onto the gels at a concentration of
5×10⁴ cells per well, and cultured at 37°C in an
incubator containing 5% CO2 for 24 h. The formation of
tube-like structures was recorded using time-lapse video
microscopy.
Detection of apoptosis
The endothelial cells, which were synchronized by
contact inhibition, were seeded at a concentration of
5×10⁴ cells per flask onto culture flasks coated with
gelatin. After 24 h when the cells were fully adhesive to the flask
walls, the cells were exposed to normoxic and hypoxic conditions
for 24 h. The detection of apoptosis was carried out following the
manufacturer’s instructions (Annexin V-FITC, Takara Bio). Cells
were washed in PBS, digested with pancreatin, and centrifugated at
1,000 rpm 3 times. The sediment was suspended using buffer
solution, and supplemented with 10 μl of Annexin V-FITC (20 mg/l)
and 5 μl of propidium iodide (50 mg/l), and finally, 300 μl of
buffer solution were added. Apoptosis was detected using FCM.
In addition, apoptosis was determined using the
terminal deoxynucleotidyl transferase-mediated dUTP-biotin nick
end-labeling (TUNEL) apoptosis assay kit (Roche), and TdT was
replaced by labeling solutions as the positive controls. The
nucleus stained in pale brown or brown was considered positive
(apoptotic cells). Each section was observed for at least 3
continuous fields of vision at high magnification, and the number
of apoptotic cells in 1,000 cells in each field was recorded.
Two-dimensional (2-D)
electrophoresis
The endothelial cells cultured under various
conditions for 24 h were harvested, washed in cold PBS 4 times, and
cell lysis solution was added for 30 min, followed by
centrifugation at 12,000 rpm in 4°C for 15 min. The supernatant was
collected, which was the total protein component. The protein
concentration was determined using the Bradford method, and then
stored at −80°C for the subsequent experiment.
1-D electrophoresis was performed using Bergman’s
method on an IPGphor isoelectric focusing system. At a pH of 3–10,
2 dry strips of 18 cm in length were placed in a trough of a strip
swelling tray after removal of the protective membrane. Protein
sample of 1 mg was added, and the rehydration of the IPG strips was
performed. Isoelectric focusing was performed automatically, and
the voltage and current displayed 3316 V and 50 μA at the end of
isoelectric focusing. After electrophoresis, 2 IPG strips were
placed in balanced solution (D1/D2), and then vibrated for 15 min
in a shaker. According to the volume of the IPG conversion kit, 12%
gels at a size of 200 mm × 200 mm × 1 mm were prepared. The
balanced IPG strips were transferred onto the gels, and blocked
using 0.5% agarose. At 20°C, electrophoresis at a constant current
of 15 mA for each strip was performed until the bromophenol blue
reached the lower edge of the glass plate.
Following 2-D electrophoresis, gels were placed in
stationary liquid (50% anhydrous ethanol and 10% ethanoic acid) for
3 h, washed with deionized water, stained with Coomassie brilliant
blue R250, vibrated for 1 min on a shaker, decolorized twice, for
30 min each time, and finally washed with distilled water. Images
were obtained by using an imaging scanner. The 2-D gels were
scanned and inputted into a computer, and the 2-D gel profile was
analyzed using PDQuest software (Bio-Rad). The profile was compared
3 times, and the standard profile was obtained. The standard
profiles of tissues treated with different media were matched, and
variations in protein expression caused by hypoxia were
analyzed.
The differentially expressed protein spots were cut
from the gels, and digested using Bergman’s method. The proteins
were identified using the matrix-assisted laser
desorption/ionization time-of-flight mass spectrometry
(MALDI-TOF-MS) on a mass spectrometer (Voyager-DE PRO). The peptide
mass fingerprint maps, molecular weight and isoelectric point of
the differentially expressed protein spots were input into a
computer, and the matched proteins were searched in the
Swiss-Prot/TrEMBL database using PeptIdent searching software, and
the functions of the proteins were inquired.
Western blot analysis
The endothelial cells cultured under various
conditions for 24 h were harvested, washed in cold PBS 4 times, and
cell lysis solution was added, followed by centrifugation at 12,000
rpm in 4°C for 15 min. The supernatant was collected, which was the
total protein component. The protein concentration was determined
by using Bradford method, and then stored at −80°C for the
subsequent experiment.
Total protein solution (30 μg) was sampled for
SDS-PAGE. The protein was transferred onto a PVDF membrane (40 min)
at a suction power of 70 mA/cm2 using the semi-dry
transfer method. The membrane was blocked with 5% non-fat milk
powder at room temperature for 1 h, and anti-cyclin D1/E (primary
antibody) was then added at 4°C overnight, followed by washing in
TBST 3 times, for 15 min each time. The membrane was then incubated
in HRP-labeling second antibody diluted at a ratio of 1:1,000 at
room temperature for 1 h, washed in TBST 3 times, for 15 min each
time, and finally stained using the ECL + western blotting
detection system.
Establishment of tumor nude mouse model
and radiotherapy
The well cultured MDA-MB-231 cells in the
exponential phase were digested with pancreatin, and then 100 μl of
cell suspension (containing about 2×10⁶ cells) were
subcutaneously injected into the left armpit of 3–4-week-old female
BALB/c nude mice. The mice were raised in a sterile environment,
and the general condition of nude mice and tumor growth were
observed and recorded each day. At approximately 1 month after the
injection, the tumor size had reached approximately 2
mm3. Nude mice were randomly assigned to 5 groups (10
animals in each group). Group 1 (c-nor), mice were injected with
MDA-MB-231 cells and received no treatment; group 2 (s-nor), mice
were injected with enolase-1 siRNA-transfected MDA-MB-231 cells and
received no treatment; group 3 (c + r), mice were injected with
MDA-MB-231 cells and received radiotherapy twice a week; group 4 (s
+ r), mice were injected with enolase-1 siRNA-transfected
MDA-MB-231 cells and received radiotherapy twice a week; and group
5, served as the controls. The physical state of the nude mice was
monitored each day, and body weight was measured twice a week. The
tumor size was measured using a vernier caliper twice a week. At 4
weeks after treatment, the animals were sacrificed. The entire
tumor was collected and weighed. Tumor inhibition was calculated
using the following formula: inhibition rate of tumor (%) = (tumor
weight in the control group - tumor weight in the treatment
group)/tumor weight in the control group ×100%.
The fresh tumor tissues were fixed in formaldehyde,
embedded with paraffin wax, and cut into sections. The sections
were dewaxed with xylene, and placed in 3%
H2O2 ethanol for 10 min to remove the
activity of endogenous peroxidase. Microwave antigen retrieval was
performed at 92–98°C with a power of 600 W for 10 min, the tissues
were then blocked with 5–10% normal goat serum (diluted with PBS)
for 10 min, and secondary antibody was added in the EnVision™
system at 37°C for 10 min.
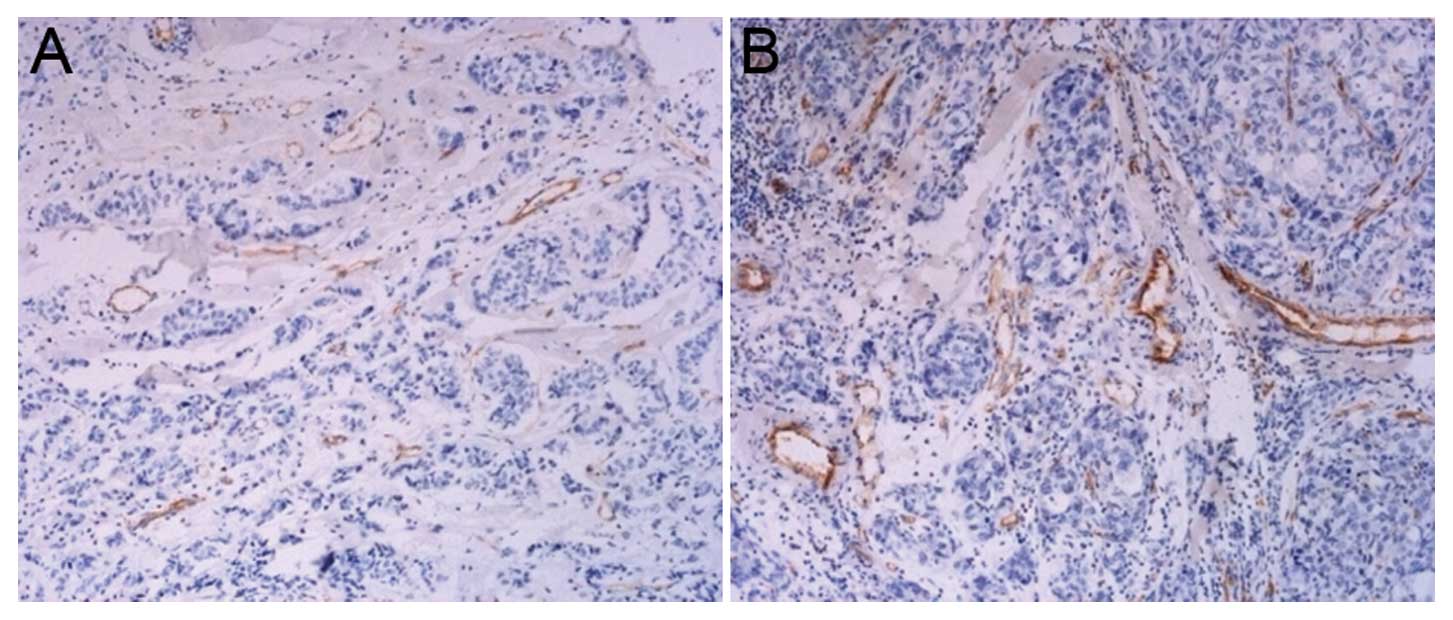
Sections were observed carefully under an optical
microscope at a low magnification (x10) to identify the hot spot in
the tumor microvessel. The pale brown capillary lumen which was
positive for CD31 staining and significantly distinct from the
tumor cells and connective tissues was calculated as a vessel.
According to the capillary lumen size and capillary wall thickness,
the artery and vein were excluded. The diameter of the selected
capillary lumen was ≤20 μm. The microvessel was calculated by 3
fields of vision in each section, and the mean value was described
as the microvessel density (MVD). The area density and number
density of the microvessel in the selected sites were estimated
using the CMIAS multi-function real color pathological imaging
analysis system. Area density, area of microvessel
(mm2)/area of section (mm2); number density,
number of microvessel/area of section (mm2).
Immunohistochemical staining to detect
hypoxic tumor microenvironment
At 1 h after sacrifice, the nude mice were
peritoneally injected with 60 mg/kg hypoxyprobe. The principle of
hypoxyprobe used for the detection of hypoxia is shown in Fig. 1. If the oxygen concentration is
<14 μM in tissues, the intracellular electron is transferred to
the hypoxyprobe via the electric transfer chain, producing an amino
negative ion. After 4 ions are transferred to the hypoxyprobe,
hydroxylamine derivatives are formed, which interact with the
peptides and proteins containing sulfhydryl groups in hypoxic
cells, resulting in the formation of stable adducts which can be
detected using immunohistochemistry. The hypoxic tumor
microenvironment was examined following the manufacturer’s
instructions (Hypoxyprobe™-1 Plus kit, Seebio Biotech, Inc.).
Statistical analysis
All experiments were repeated at least 3 times. All
data were expressed as the means ± standard deviation (SD), and all
statistical analyses were performed using the statistical software
SPSS version 10.0. The t-test was used to compare differences
between groups. A P-value <0.05 was considered to indicate a
statistically significant difference.
Results
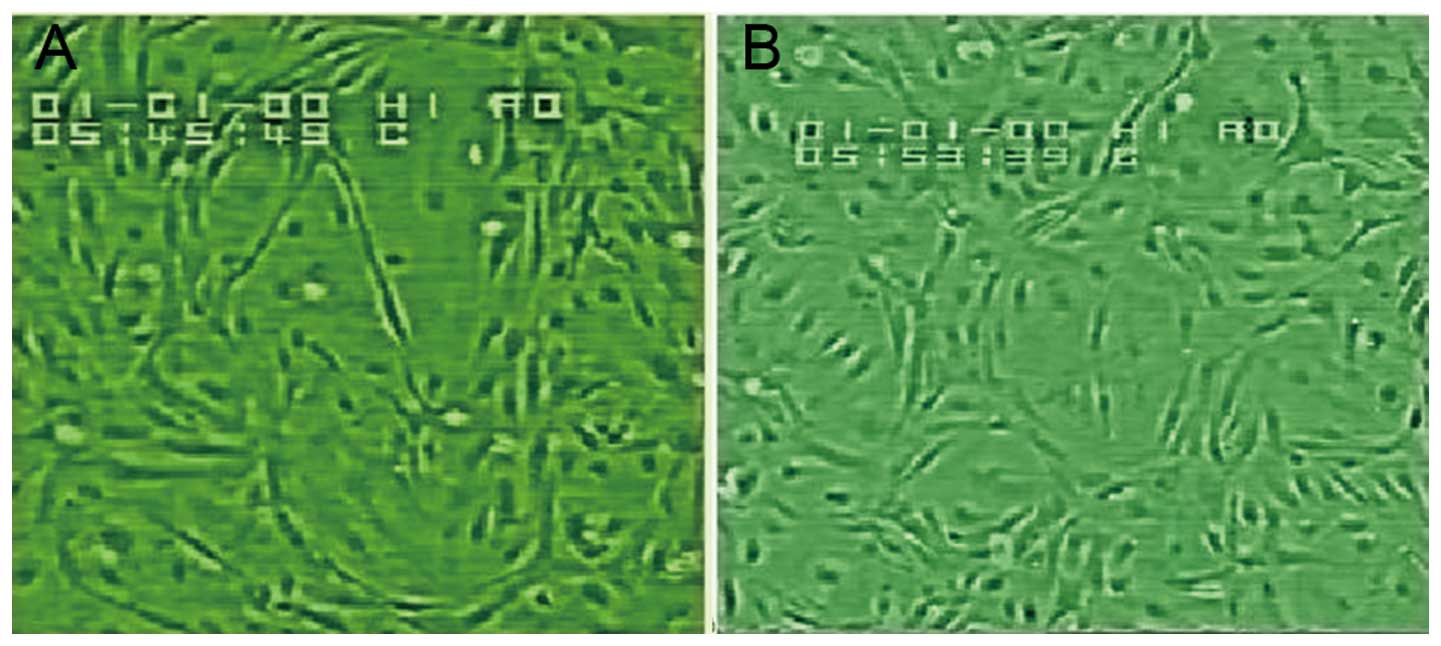
Morphology and growth of confluent HUVEC
monolayers
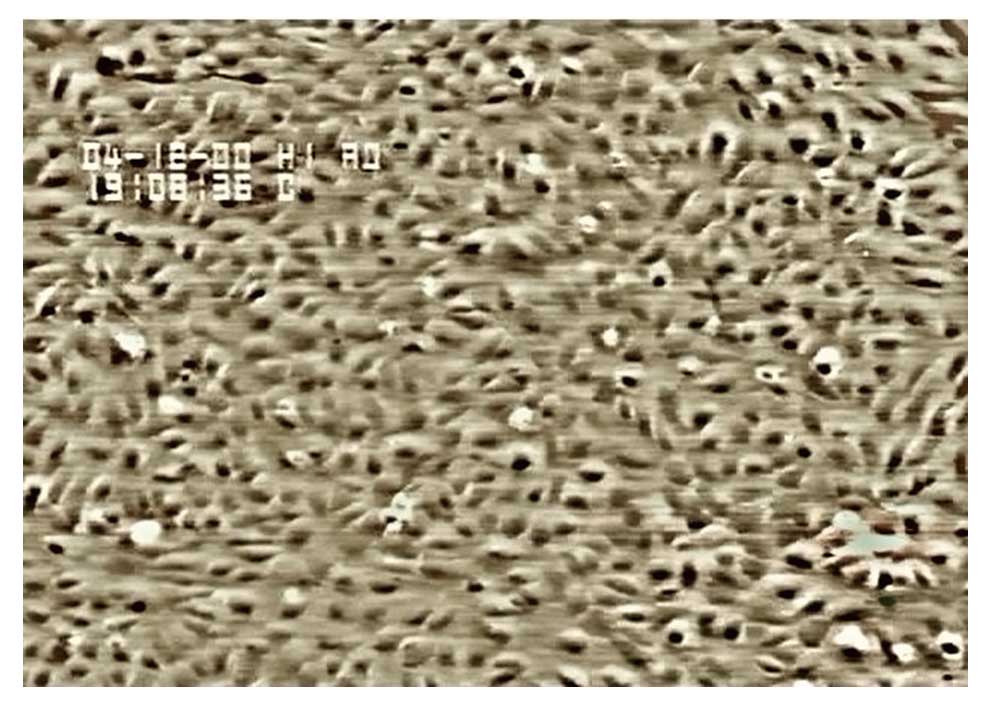
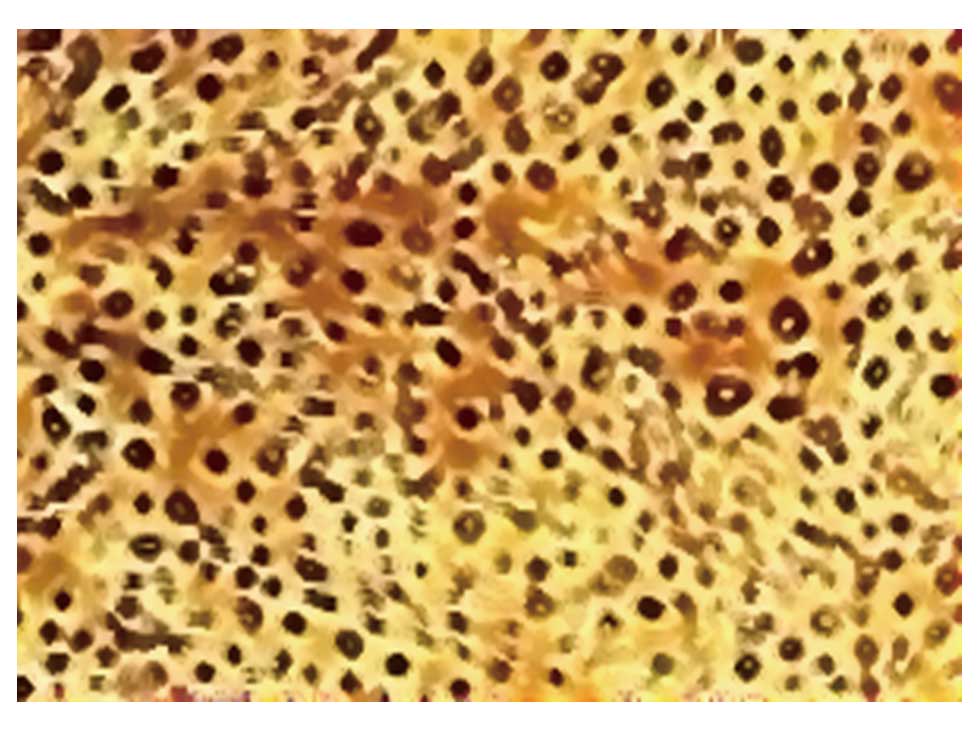
Under an inverted phase contrast microscope, we
observed flagstone-like confluent monolayers of cells (Fig. 2), which were identified as
endothelial cells using immunohistochemical staining for factor
VIII-related antigen (Fig. 3).
During the passage of HUVECs, the growth rate of cells at the third
passage was slightly slower than that of the cells at the second
passage, and the cell growth proceeded to the log phase after
culturing for 3–4 days.
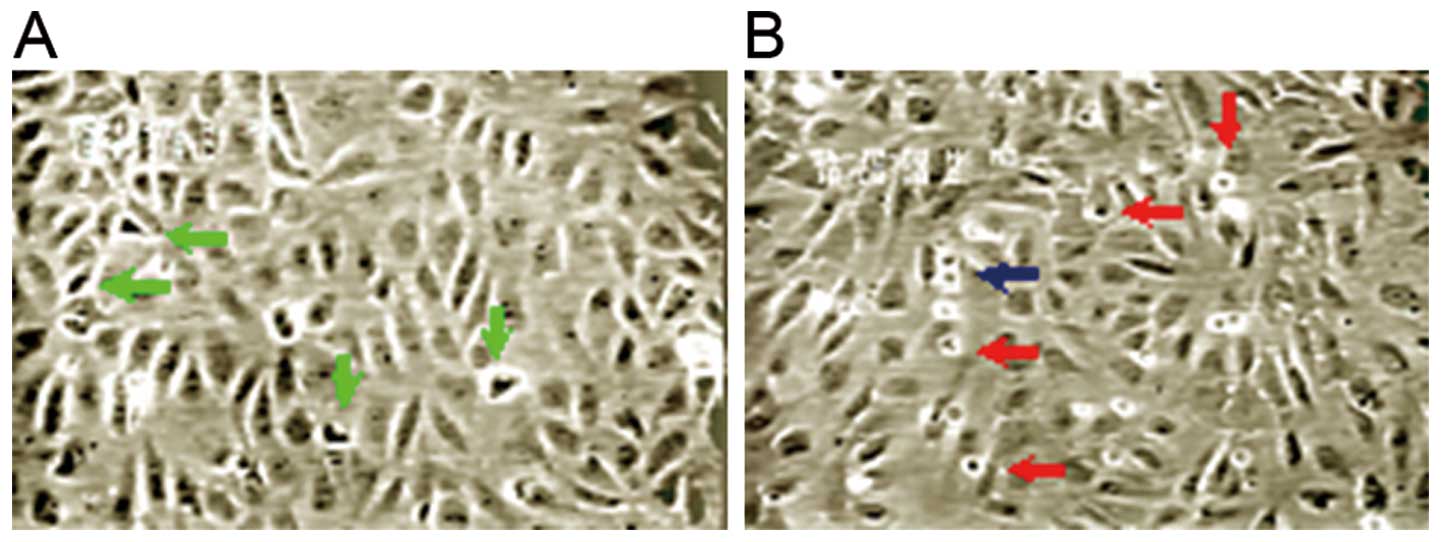
Under an inverted phase contrast microscope, it was
observed that the endothelial cells grew vigorously under normoxic
conditions, with many split phase cells. In the prophase of
mitosis, cells shrunk, cell adhension to the culture wall was
reduced, and condensed chromatin aggregates were observed.
Refraction halos were observed around the cells under an optical
microscope (Fig. 4). There were
also dumbbell-like cells observed in the anaphase. Following
transfection with enolase-1 siRNA under normoxic conditions, the
growth rate of the endothelial cells was slightly lower than that
of the controls, with a slight reduction in split phase cells and a
slightly slower rate of cytokinesis. Time-lapse video microscopy
showed that the cytoplasms of the daughter cells present in the
telophase formed extensions at a faster rate in the control group
(5–6 min) compared to the enolase-1 siRNA-transfected cells (12–13
min).
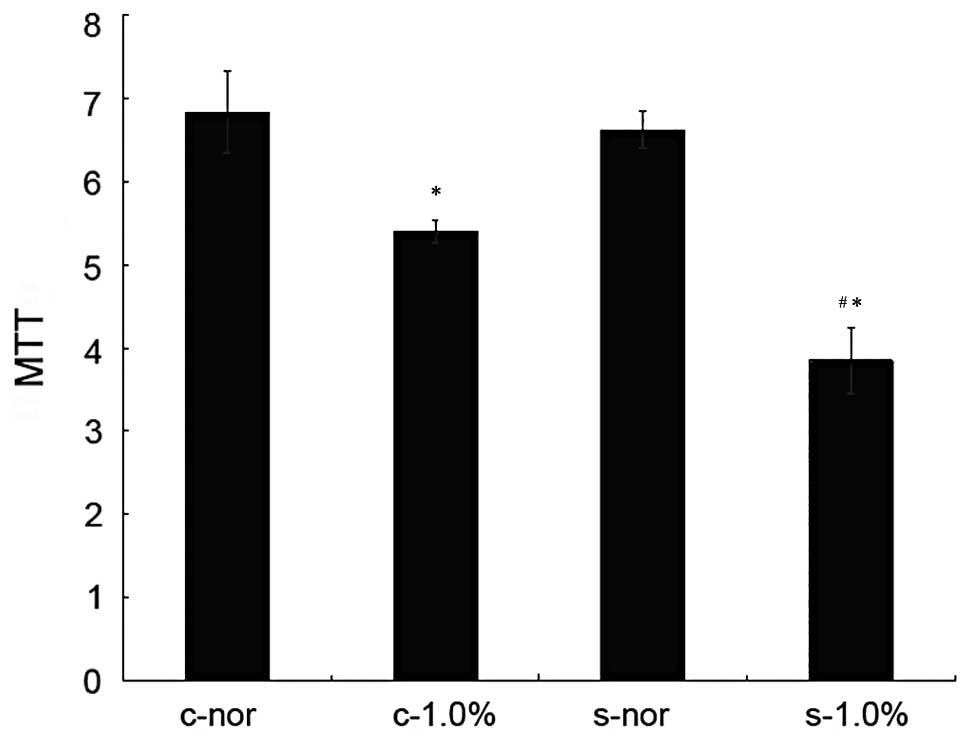
Effect of hypoxia (1.0% O2) on
proliferation and viability of endothelial cells before and after
transfection with enolase-1 siRNA
Before and after the transfection of HUVECs, no
significant difference in the proliferation and viability was
observed under normoxic conditions. Under hypoxic conditions, the
growth of the cells in both groups was reduced, and the
proliferative ability significantly decreased in the cells
transfected with enolase-1 siRNA (Fig.
1). Following transfection with enolase-1 siRNA, the cell
growth was reduced compared with that before transfection, and the
number of cells in the G1 phase increased while it was reduced in
the S phase (Table I).
 | Table IHUVEC counts and proportions in
different phases of the cell cycle in the c-nor and s-nor groups
(mean ± SD, n=3). |
Table I
HUVEC counts and proportions in
different phases of the cell cycle in the c-nor and s-nor groups
(mean ± SD, n=3).
| | Proportion of cells
in different phases of cell cycle (%) |
|---|
| |
|
|---|
| Group | Cell count
(x105) | G1 phase | S phase | G2/M phase |
|---|
| c-nor |
10.69±0.55a | 68.33±2.14 | 15.87±0.55 | 15.83±2.04 |
| s-nor | 9.65±0.16 | 71.50±1.76 | 13.76±1.31 | 14.03±0.39 |
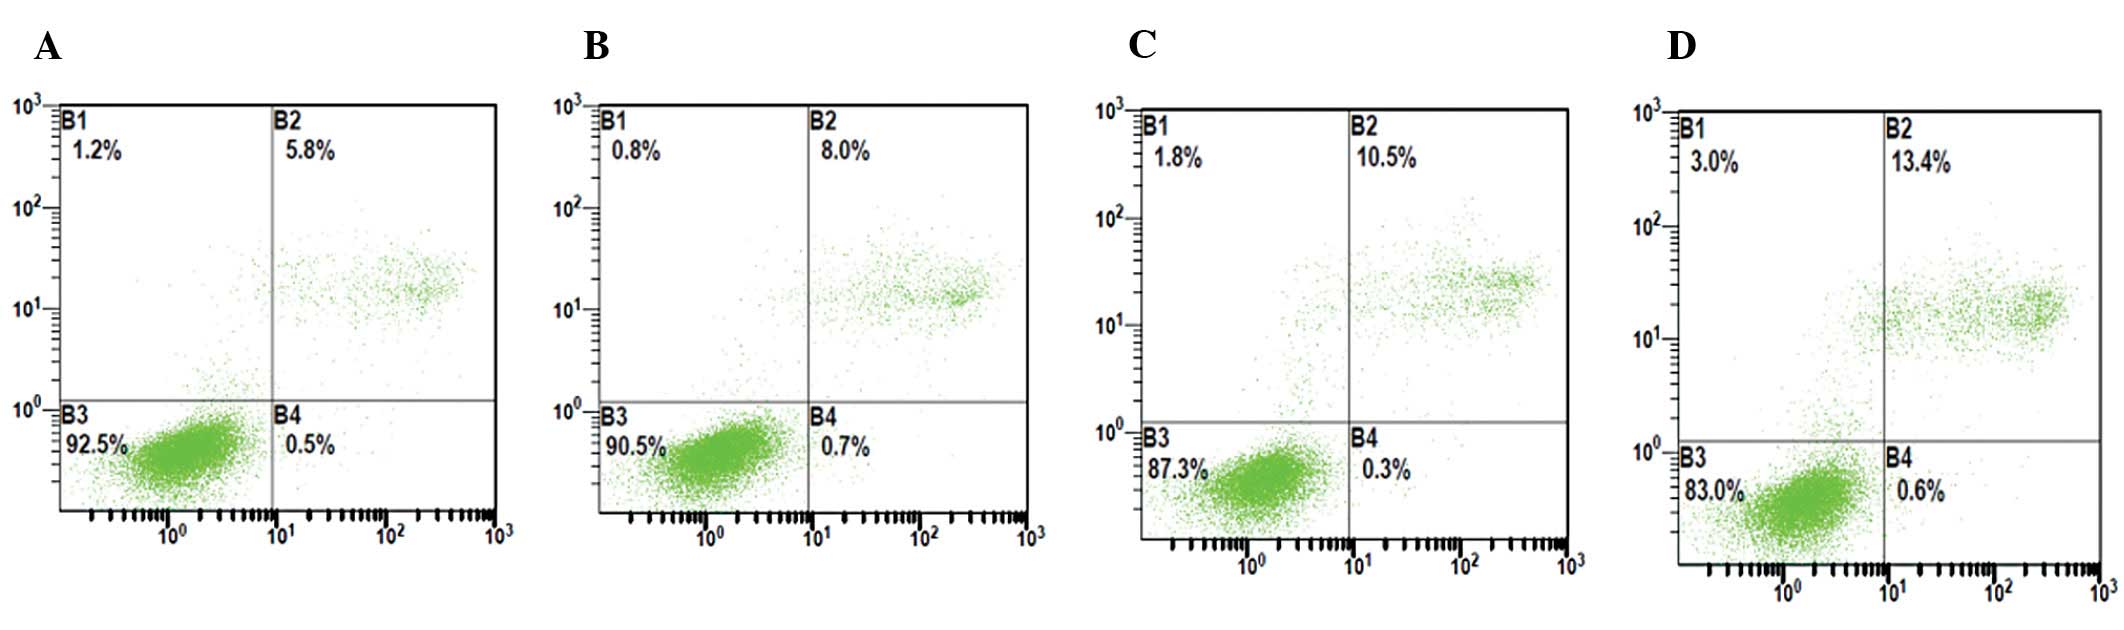
Effect of hypoxia on apoptosis of HUVECs
before and after transfection with enolase-1 siRNA
Following transfection with enolase-1 siRNA, the
number of apoptotic HUVECs slightly increased, and significantly
increased following exposure to hypoxia, which was characterized by
late apoptotic cells. The apoptotic rate of HUVECs increased from
5.8 to 10.9% in the c-nor group, whereas from 6.5 to 13.5% in the
s-nor group (Fig. 5).
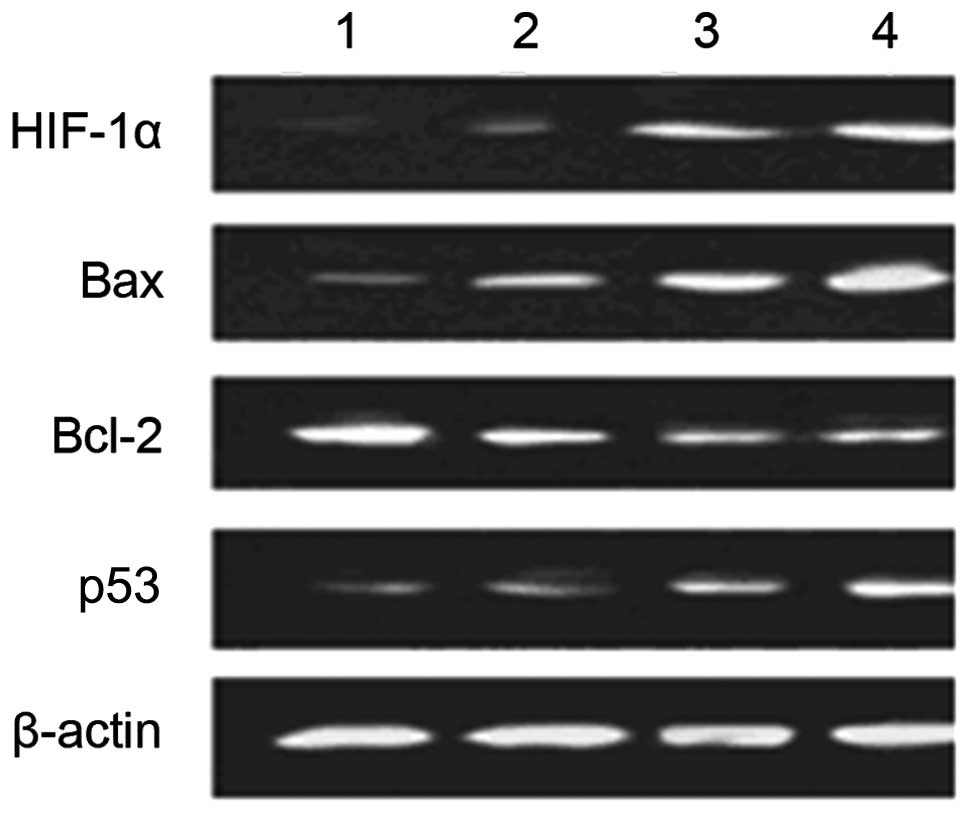
Effect of hypoxia on expression of
apoptosis-related factors of HUVECs before and after transfection
with enolase-1 siRNA
Western blot analysis revealed that transfection
with enolase-1 siRNA almost had no effect on the expression of
HIF-1α; HIF-1α is not affected by its downstream product,
enolase-1. No expression of HIF-1α was observed under normoxic
conditions; however, HIF-1α expression significantly increased
under hypoxic conditions. After transfection, the expression of Bax
and p53 notably increased following exposure to hypoxia. It is
indicated that enolase-1 may exert an effect on apoptosis by
altering the expression of certain apoptotic factors (Fig. 6).
Proteomics analysis
The whole-cell proteins of HUVECs exposed to hypoxia
for 10 h were separated by using 2-D electrophoresis, and following
staining with Coomassie Brilliant Blue solution, the 2-D gel map
was obtained. The experiments were repeated 3 times, and the
protein dots were 518±31 and 482±27 on the maps from cells in the 2
groups, revealed by PDQuest 6.2 software. Compared with the
non-transfected group, protein expression was significantly reduced
in the transfected group (P<0.05). The isoelectric points of the
proteins ranged from 5.0 to 9.0, and the molecular weight was
between 21 and 97 kDa. Matching analysis by PDQuest identified 8
differentially expressed proteins, including 5 downregulated and 3
upregulated.
The differentially expressed proteins were analyzed
using MALDI-TOF-MS, and the obtained peptide mass fingerprinting
(PMF) profiles were matched to the standard PMF in the Swiss-Prot
database. The PeptIdent software was used for inquery and
identification (Table II). The
matching results including the Swiss-Prot accession number,
proteins identified, matching rate and sequence coverage are shown
in Table III, and the searched
protein mass map and the matched peptides are listed. Phospholipid
transfer protein (PLTP), plays a role in promoting lipid transfer,
antioxidant activity and maintaining normal functions in cells.
HLP2, a DEAD-binding protein, promotes the transcription and
extension of the DNA strand. C2 esterase promotes the adhension of
leucocytes to endothelial cells and regulates matrix metabolism.
Pyruvate kinase, is a key enzyme for mediating glucose catabolism
and provides energy for cell life activities. 5′-TG-3′ interacting
factor (TGIF), a co-inhibitor of Smad, inhibits DNA transcription
induced by TGF-β. FR-β mediates folic acid metabolism and
negatively regulates cell proliferation. ATP-dependent DNA helicase
(DNA-repairing protein), sustains and promotes normal cell cycle.
Stomatin negatively mediates the membrane permeability of
monovalent positive ions and is involved in assembly and
organization of intracellular cytoskeletal protein actin.
| Table IISearch parameters of PeptIdent
software. |
Table II
Search parameters of PeptIdent
software.
| Parameter | Parameter
setting |
|---|
| Database
searched | Swiss-Prot |
| Species
searched | Homo sapiens
(human) |
| Digestive enzyme
used | Trypsin |
| Peptide mass
accuracy | ±1.5 Da |
| Methionine | Oxidized |
| Cysteine |
Carbamidomethylation |
| Peptide masses
are | Monoisotopic |
| Number of uncleaved
sites | 1–2 |
| Table IIIDifferentially expressed proteins
identified using PeptIdent software. |
Table III
Differentially expressed proteins
identified using PeptIdent software.
| Spot | Swiss-Prot
(Accession no.) | Matching rate
(%) | Sequence coverage
(%) | Protein
identified |
|---|
| Downregulated
protein | P55059 | 38 | 15 | Phospholipid
transfer protein precursor (PLTP precursor) |
| Q00571 | 53 | 21 | DEAD-box protein 3
(HLP2) |
| P89871 | 36 | 12 | C1 esterase |
| P14618 | 62 | 27 | Pyruvate
kinase |
| P13010 | 56 | 12 | ATP-dependent DNA
helicase II |
| Upregulated
protein | Q15583 | 29 | 18 | 5′-TG-3′
interacting factor (TGIF) |
| P14207 | 28 | 23 | FR-β |
| P27105 | 25 | 38 | Stomatin |
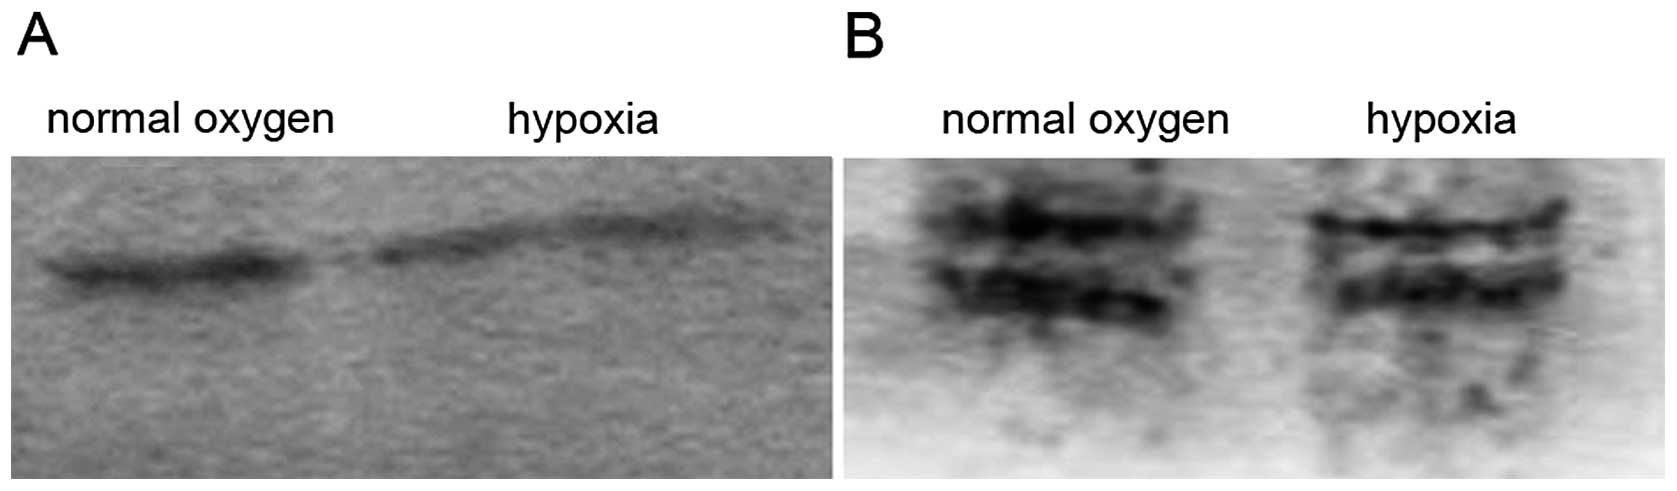
SDS-PAGE and western blot analysis of the total
proteins from the endothelial cells before and after exposure to
hypoxia for 24 h showed that the number of proteins under hypoxic
conditions, particularly the moderate- and low-molecule proteins,
was less than that under normoxic conditions (Fig. 7). The low expression of cyclin D1/E
was observed, notably under normoxic conditions. However, the
polyclonal antibodies used in the current study led to
cross-reactions or isomers.
Angiogenesis
In the 24-well plates coated with Matrigel matrix,
following overnight culture, the endothelial cells formed typical
tube-like structures, and no significant difference was observed
between the transfected and non-transfected cells. However, large
tube-like structures with low density were observed in the
non-transfected cells, while many cord-like structures of a small
volume were observed in the endothelial cells transfected with
enolase-1 siRNA. Under hypoxic conditions, there were no obvious
tube-like structures observed in the transfected and
non-transfected cells (Fig. 8).
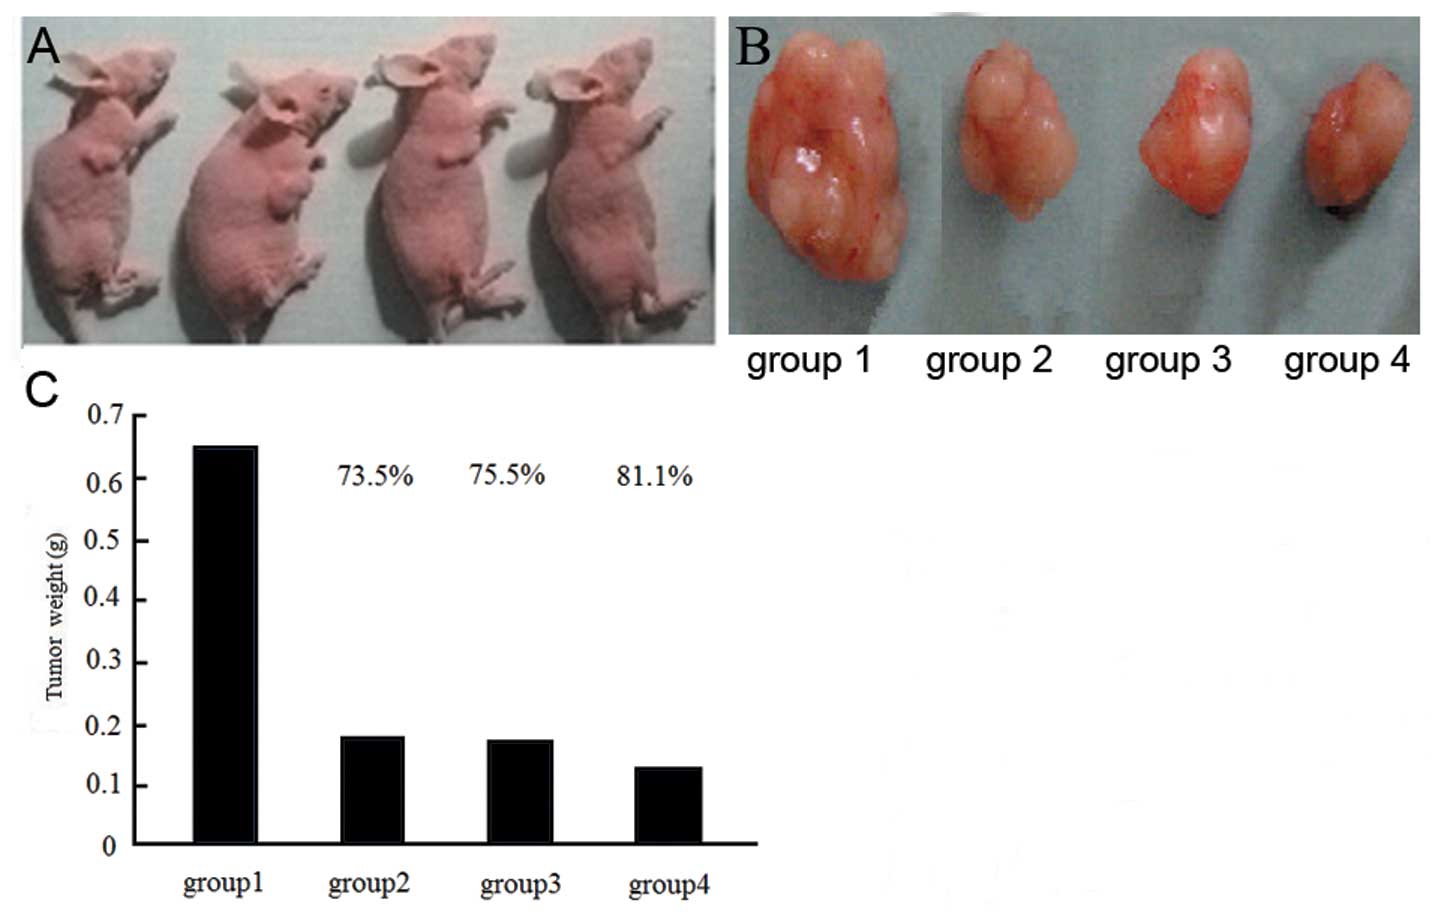
Tumor size
The largest tumor size was observed in the c-nor
group, while significant reduced tumor sizes were detected in the
s-nor and s + r groups. Following radiotherapy, the tumor sizes
were significantly reduced compared with the untreated groups and
the highest reduction was observed in the s + r group (Fig. 9).
MVD
After the tumor cells transfected with enolase-1
siRNA were injected into nude mice, the angiogenesis present in the
tumor tissues is shown in Fig. 10.
It was observed that less angiogenesis was detected in the nude
mice receiving an injection with transfected cancer cells in
comparison with the control group, which demonstrated the role of
enolase-1 in angiogenesis.
The tumor tissue sections were stained using
fluorescent TUNEL, and it was found that the number of apoptotic
cells reduced in the control group. The number of apoptotic cells
increased following radiotherapy. The number of apoptotic cells
transfected with enolase-1 siRNA also increased, and this was
further enchanced following radiotherapy (Fig. 11).
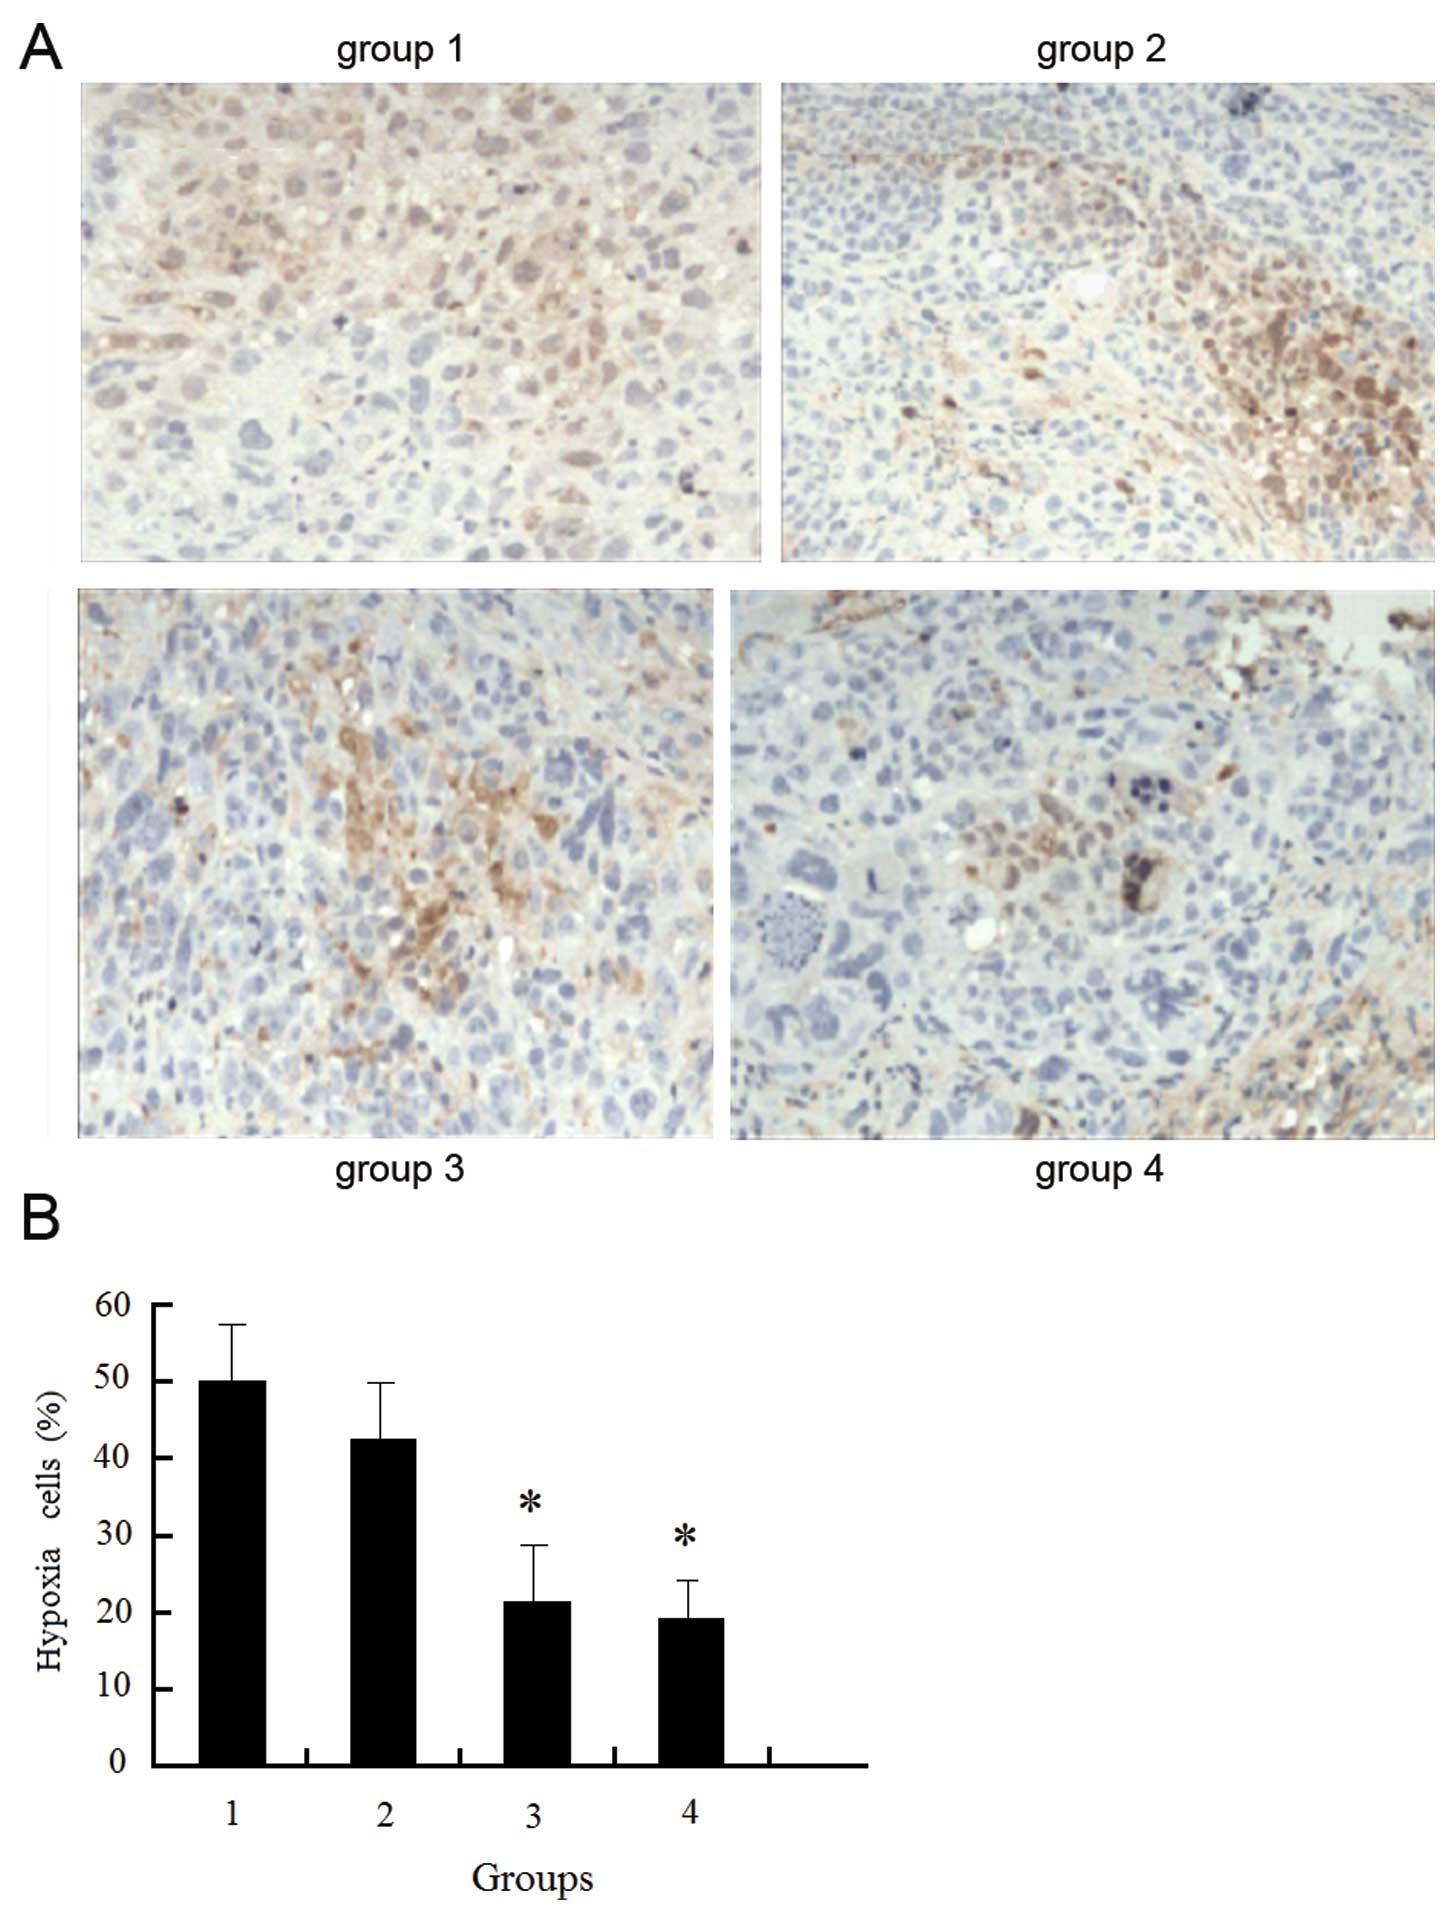
Low oxygen content and increased hypoxia were
detected within the tissues of the non-transfected cells, and the
hypoxic state was reduced but remained high following radiotherapy.
Following transfection with enolase-1 siRNA, the hypoxic state was
reduced, and further decreased following radiotherapy; however,
there was no significant difference before and after radiotherapy.
We hypothesized that a reduction in hypoxia is associated with a
reduction in cell proliferation and oxygen requirement following
transfection with enolase-1 (Fig.
12).
Discussion
Glycolysis is a compensatory process of energy
metabolism during hypoxia. The overexpression of a number of
enzymes during the process of glycolysis leads to the adaption of
tumor cells to the energy requirement, resulting in increased
survival and proliferation (2,3), as
well as an increased invasive and metastatic ability (4,5). For
example, hexokinase, lactate dehydrogenase and
glyceraldehyde-3-phosphate dehydrogenase present a regulatory
function of transcription; glucose-6-phosphateisomerase has a
function of mediating cell migration; glucokinase, hexokinase and
glyceraldehyde-3-phosphate dehydrogenase mediate apoptosis, which
demonstrates the correlation between metabolic enzymes and
transcription mediation and cell proliferation. It is critical that
the metabolic enzyme is targeted when investigating the
pathological and physiological process of angiogenesis induced by
hypoxia in breast cancer.
The correlation between the oncogene and adaptation
to hypoxia may be connected by HIF-1α and the metabolic enzyme,
enolase-1. The v-SRC oncogene increases the expression of
HIF-1, VEGF and enolase-1 under normoxic and hypoxic
conditions, which is associated with the increased transcription of
reporter genes containing cis-acting hypoxia-response elements from
the VEGF and enolase-1 genes (17). The correlation between the metabolic
sensor and transcription is connected directly or indirectly by
many metabolic enzymes, which not only exert metabolic effects, but
also regulate apoptosis and cell migration. The Myc
promoter-binding protein MBP-1 is an inhibitor of Myc
transcription, and shows 95% sequence homology to enolase-1.
Currently, it is regarded as a product of the selective translation
of enolase-1. In lung cancer, the downregulated expression of
enolase-1 is related to poor prognosis. It is thought that Myc
induces glycolysis through the negative feedback regulation of
enolase-1 (18). In this study, MTT
assay and cell cycle analysis revealed that under normoxic
conditions, the growth and division of the endothelial cells
transfected with enolase-1 siRNA were slightly weaker than those of
the non-transfected cells; however, no significant difference was
observed, which is consistent with the hypoxic induction of
enolase-1. In addition, the results indicated that enolase-1
promoted cell proliferation, although the effect was not evident
under normoxic conditions.
The cells in the 2 groups responded differently to
hypoxia; the number of hypoxic apoptotic cells in the control group
was significantly lower than that in the transfected group, which
further demonstrated the role of enolase-1 in adaptation to hypoxia
in cells. The effect of enolase-1 on cell proliferation may be
associated with the mediation of the expression of the oncogene and
cell cycle-related protein. Western blot analysis revealed a
variation in cyclin E1 expression, which was estimated to be
associated with the cell cycle progression. A significant
difference in the expression of Bax and p53 was observed under
hypoxic conditions. Further studies should be carried out to
investigate the signal transduction molecules. 2-D electrophoresis
and MALDI-TOF-MS revealed 3 upregulated proteins and 7
downregulated proteins. In addition, proteomics analysis showed
changes in the expression of 3 DNA transcription-related proteins
in the siRNA-transfected endothelial cells. ATP-dependent DNA
helicase, also termed DNA-repairing protein, maintains and promotes
the normal cell cycle. The increased expression of HLP2, a member
of the DEAD-binding protein family, promotes the transcription and
extension of DNA extension (19).
The expression of TGIF (20,21), a
homeobox protein, was reduced. TGIF, as a co-inhibitor of the
transcription factor Smad, inhibits the transcription induced by
TGF-β and steroid hormone. The mechanisms may be explained by the
following 2 aspects: i) TGIF activates histone deacetylase until
DNA transcription; ii) TGIF competitively binds DNA-binding sites,
such as CBP/p300 and p160/SRC with the growth factor-activated
nuclear receptor, leading to the inhibition of transcription. It is
suggested that during the process of growth and proliferation of
endothelial cells, the balance between DNA transcription factors
determines DNA transcription and plays a critical role in cell
growth. The protein distribution revealed by SDS-PAGE and 2-D
electrophoresis showed that following transfection with siRNA, the
dots of total protein and basic protein were significantly reduced
in the endothelial cells, which suggested high protein synthesis,
and reflected the reduction in the reproductive ability of the
endothelial cells. The expression of pyruvate kinase that mediates
sugar decomposition decreased (22,23),
and promoted the reduction in the expression of PLTP (24) conveyed by lipids, which cannot
provide the necessary materials and energy for cell metabolism.
FR-β (22) regulates folic acid
metabolism, and negatively mediates cell proliferation. The
upregulated expression of FR-β may be involved in promoting the
synthesis and metabolism of DNA and proteins, as well as cell
proliferation.
Endothelial cells migrate following proliferation,
and are rearranged under the attack of blood flow to form capillary
vessel-like structures. In addition, it has been demonstrated that
endothelial cells release bFGF during migration, which promotes the
proliferation of endothelial cells. To further assess the
pro-proliferation of enolase-1 in HUVECs, the mitosis and migration
of HUVECs were observed using time-lapse video microscopy (22). Analysis of the extension of
endothelial cell cytoplasm during mitosis showed that the number of
endothelial cells transfected with siRNA during mitosis was greater
than the non-transfected cells; however, the mobility was weaker.
In addition, in vitro study of angiogenesis revealed that
the endothelial cells extended slightly, which then formed
small-volume tube-like structure with high density. Proteomics
analysis revealed reduced C1 esterase (25,26).
C1 esterase, which was first identified in erythrocytes,
facilitates the adhesion of endothelial cells to leucocytes and
mediates the metabolism of the vascular matrix. The present study
showed that C1 esterase promoted the adhesion between endothelial
cells and the vascular matrix, the entension and adhesion to the
vascular wall of the endothelial cell cytoplasm, and the adhesion
and proliferation of the endothelial cells. In addition, reduced
stomatin expression was observed. Stomatin is an integral membrane
protein (26), which negatively
mediates the membrane permeability of monovalent positive ions and
is involved in the regulation of the assembly and organization of
intracellular cytoskeletal proteins such as actin, and is closely
associated with cell proliferation and migration.
Enolase-1 expression is closely related to tumor
progression. In many tumors, the increased expression of enolase is
a marker and treatment response marker. Jiang et al(27) demonstrated that IL-8, desmin and
enolase-1 acted as the central elements in colon cancer
susceptibility. Zhang et al(3) found that HER-2/neu signaling may
result, directly or indirectly, in the enhanced activation of
various metabolic, stress-responsive, antioxidative, and
detoxification processes within the breast tumor microenvironment
and hypothesized that the identified changes such as the increase
in enolase expression were likely to drive cell proliferation and
tissue invasion. In infiltrating ductal carcinomas of the breast,
enolase-1 is overexpressed in tumors when compared with normal
tissues (28). It has previously
reported that enolase-1 and apolipoprotein-A may be useful as
diagnostic markers of lung adenocarcinomas in clinical trials
(29).
Currently, the non-surgical treatment of tumors
mainly involves radiotherapy and chemotherapy, and radiotherapy and
chemotherapy should be performed in the majority of surgeries for
tumors. Insensitivity to radiotherapy and chemotherapy for tumors
may emerge during hypoxia (30,31).
Oxygen plays a critical role in the production of free radicals
following radiation. The oxygen-enriched cells are susceptible to
radiotherapy, and are killed easily by radioactive rays, while
hypoxic cells are tolerant to radiation, and are not killed. The
issue of insufficient blood supply and a high percentage of hypoxic
cells is often encountered in tumor tissue. Certain cancer cells
evade radiation injury and cannot be effectively killed, which
increases the risk of re-occurrence. MDA-MB-231 is a highly
invasive breast cancer cell line.
The present study showed that the growth of tumor
tissues and reduction in host body weight emerged rapidly after the
injection of the cells to nude mice. However, in mice injected with
the cancer cells transfected with enolase-1, a significant
reduction in tumor growth, tumor size and weight was observed, and
activity in the mice was not significantly affected. Following
treatment with radioactive rays, tumor size was significantly
reduced in both groups, although more notably in the transfected
group. The efficacy was remarkable, although there was no
significant difference observed compared with that prior to
treatment. The data indicate that the inhibition of enolase-1
expression increases tolerance to hypoxia in tumor cells, which
manifests slow cell growth, increased apoptosis and minor tumor
size. Moreover, hypoxia is relatively weak within tissues, leading
to fragile hypoxia-induced angiogenesis and low vascular density,
and the efficacy of radiotherapy is also enhanced.
Acknowledgements
This study was financially supported by Grant no.
Y2008C34 from the Natural Science Foundation of Shandong. We
appreciate the valuable comments from other members of our
laboratory.
References
|
1
|
Gordan JD and Simon MC: Hypoxia-inducible
factors: central regulators of the tumor phenotype. Curr Opin Genet
Dev. 17:71–77. 2007. View Article : Google Scholar : PubMed/NCBI
|
|
2
|
España L, Martín B, Aragüés R, et al:
Bcl-x(L)-mediated changes in metabolic pathways of breast cancer
cells: from survival in the blood stream to organ-specific
metastasis. Am J Pathol. 167:1125–1137. 2005.PubMed/NCBI
|
|
3
|
Zhang D, Tai LK, Wong LL, Chiu LL, Sethi
SK and Koay ES: Proteomic study reveals that proteins involved in
metabolic and detoxification pathways are highly expressed in
HER-2/neu-positive breast cancer. Mol Cell Proteomics. 4:1686–1696.
2005. View Article : Google Scholar : PubMed/NCBI
|
|
4
|
Wu F, Wang QM, Fan GC, Chen JZ and Chen
HP: Proteomic analysis of paclitaxel-induced apoptosis in MCF-7
human breast carcinoma cells. Zhonghua Zhong Liu Za Zhi.
28:418–421. 2006.(In Chinese).
|
|
5
|
Dowling P, Meleady P, Dowd A, Henry M,
Glynn S and Clynes M: Proteomic analysis of isolated membrane
fractions from superinvasive cancer cells. Biochim Biophys Acta.
1774:93–101. 2007. View Article : Google Scholar : PubMed/NCBI
|
|
6
|
Yoo BS and Regnier FE: Proteomic analysis
of carbonylated proteins in two-dimensional gel electrophoresis
using avidin-fluorescein affinity staining. Electrophoresis.
25:1334–1341. 2004. View Article : Google Scholar : PubMed/NCBI
|
|
7
|
Cavdar Z, Oktay G, Egrilmez MY, et al: In
vitro reoxygenation following hypoxia increases MMP-2 and TIMP-2
secretion by human umbilical vein endothelial cells. Acta Biochim
Pol. 57:69–73. 2010.PubMed/NCBI
|
|
8
|
Scharte M, Han X, Bertges DJ, Fink MP and
Delude RL: Cytokines induce HIF-1 DNA binding and the expression of
HIF-1-dependent genes in cultured rat enterocytes. Am J Physiol
Gastrointest Liver Physiol. 284:G373–G384. 2003. View Article : Google Scholar : PubMed/NCBI
|
|
9
|
Somiari RI, Sullivan A, Russell S, et al:
High-throughput proteomic analysis of human infiltrating ductal
carcinoma of the breast. Proteomics. 3:1863–1873. 2003. View Article : Google Scholar : PubMed/NCBI
|
|
10
|
Choi HJ, Eun JS, Kim BG, Kim SY, Jeon H
and Soh Y: Vitexin, an HIF-1alpha inhibitor, has anti-metastatic
potential in PC12 cells. Mol Cells. 22:291–299. 2006.PubMed/NCBI
|
|
11
|
Yu EZ, Li YY, Liu XH, et al: Antiapoptotic
action of hypoxia-inducible factor-1α in human endothelial cells.
Lab Invest. 84:553–561. 2004.
|
|
12
|
Roland I, Minet E, Ernest I, et al:
Identification of hypoxia-responsive messengers expressed in human
microvascular endothelial cells using differential display RT-PCR.
Eur J Biochem. 267:3567–3574. 2000. View Article : Google Scholar
|
|
13
|
Li A, Li H, Jin G and Xiu R: A proteomic
study on cell cycle progression of endothelium exposed to tumor
conditioned medium and the possible role of cyclin D1/E. Clin
Hemorheol Microcirc. 29:383–390. 2003.PubMed/NCBI
|
|
14
|
Li A, Li H, Zhang J, Jin G and Xiu R: The
mitogenic and anti-apoptotic activity of tumor conditioned medium
on endothelium. Clin Hemorheol Microcirc. 29:375–382.
2003.PubMed/NCBI
|
|
15
|
Jaffe EA, Nachman RL, Becker CG and Minick
CR: Culture of human endothelial cells derived from umbilical
veins. Identification by morphologic and immunologic criteria. J
Clin Invest. 52:2745–2756. 1973. View Article : Google Scholar : PubMed/NCBI
|
|
16
|
Hewett PW: Identification of
tumour-induced changes in endothelial cell surface protein
expression: an in vitro model. Int J Biochem Cell Biol. 33:325–335.
2001. View Article : Google Scholar : PubMed/NCBI
|
|
17
|
Jiang BH, Agani F, Passaniti A and Semenza
GL: V-SRC induces expression of hypoxia-inducible factor 1 (HIF-1)
and transcription of genes encoding vascular endothelial growth
factor and enolase 1: involvement of HIF-1 in tumor progression.
Cancer Res. 57:5328–5335. 1997.
|
|
18
|
Kim J and Dang CV: Multifaceted roles of
glycolytic enzymes. Trends Biochem Sci. 30:142–150. 2005.
View Article : Google Scholar : PubMed/NCBI
|
|
19
|
Kircher SG, Kim SH, Fountoulakis M and
Lubec G: Reduced levels of DEAD-box proteins DBP-RB and p72 in
fetal Down syndrome brains. Neurochem Res. 27:1141–1146. 2002.
View Article : Google Scholar : PubMed/NCBI
|
|
20
|
Wotton D, Knoepfler PS, Laherty CD,
Eisenman RN and Massagué J: The Smad transcriptional corepressor
TGIF recruits mSin3. Cell Growth Differ. 12:457–463.
2001.PubMed/NCBI
|
|
21
|
Melhuish TA, Gallo CM and Wotton D: TGIF2
interacts with histone deacetylase 1 and represses transcription. J
Biol Chem. 276:32109–32114. 2001. View Article : Google Scholar : PubMed/NCBI
|
|
22
|
Nadimpalli R, Yalpani N, Johal GS and
Simmons CR: Prohibitins, stomatins, and plant disease response
genes compose a protein superfamily that controls cell
proliferation, ion channel regulation, and death. J Biol Chem.
275:29579–29586. 2000. View Article : Google Scholar
|
|
23
|
Graven KK, Molvar C, Roncarati JS, Klahn
BD, Lowrey S and Farber HW: Identification of protein disulfide
isomerase as an endothelial hypoxic stress protein. Am J Physiol
Lung Cell Mol Physiol. 282:L996–L1003. 2002. View Article : Google Scholar : PubMed/NCBI
|
|
24
|
Nowak T and Suelter C: Pyruvate kinase:
activation by and catalytic role of the monovalent and divalent
cations. Mol Cell Biochem. 35:65–75. 1981. View Article : Google Scholar : PubMed/NCBI
|
|
25
|
Desrumaux C, Deckert V, Athias A, et al:
Plasma phospholipid transfer protein prevents vascular endothelium
dysfunction by delivering α-tocopherol to endothelial cells. FASEB
J. 13:883–892. 1999.PubMed/NCBI
|
|
26
|
Sun XL, Murphy BR, Li QJ, et al:
Transduction of folate receptor cDNA into cervical carcinoma cells
using recombinant adeno-associated virions delays cell
proliferation in vitro and in vivo. J Clin Invest. 96:1535–1547.
1995. View Article : Google Scholar
|
|
27
|
Jiang W, Li X, Rao S, et al: Constructing
disease-specific gene networks using pair-wise relevance metric:
application to colon cancer identifies interleukin 8, desmin and
enolase 1 as the central elements. BMC Syst Biol. 2:722008.
View Article : Google Scholar
|
|
28
|
Kabbage M, Chahed K, Hamrita B, et al:
Protein alterations in infiltrating ductal carcinomas of the breast
as detected by nonequilibrium pH gradient electrophoresis and mass
spectrometry. J Biomed Biotechnol. 2008:5641272008. View Article : Google Scholar : PubMed/NCBI
|
|
29
|
Rütters H, Zürbig P, Halter R and Borlak
J: Towards a lung adenocarcinoma proteome map: Studies with
SP-C/c-raf transgenic mice. Proteomics. 6:3127–3137.
2006.PubMed/NCBI
|
|
30
|
Sasabe E, Zhou X, Li D, Oku N, Yamamoto T
and Osaki T: The involvement of hypoxia-inducible factor-1alpha in
the susceptibility to gamma-rays and chemotherapeutic drugs of oral
squamous cell carcinoma cells. Int J Cancer. 120:268–277. 2007.
View Article : Google Scholar : PubMed/NCBI
|
|
31
|
Moulder JE and Rockwell S: Tumor hypoxia:
its impact on cancer therapy. Cancer Metastasis Rev. 5:313–341.
1987. View Article : Google Scholar : PubMed/NCBI
|