Introduction
N-Myc downstream-regulated gene 2 (NDRG2) is
generally expressed in the brain, heart and muscle (1). Increasing evidence indicates that
NDRG2 has specific functions in the regulation of cellular
differentiation and tumorigenesis. Indeed, NDRG2 was reported to
have a putative role in neural differentiation, synapse formation,
and axon survival in response to glucocorticoids, and to
participate in the differentiation of monocytes and leukemia cells
into dendritic cells (2,3). NDRG2 was discovered as a potential
tumor suppressor in meningioma, glioblastoma and melanoma cell
lines (4–6). In addition, NDRG2 mRNA and protein are
shown to be downregulated in human liver, pancreatic and colon
cancer tissues (7,8). Recently, NDRG2 was identified as a
potential suppressor of tumor metastasis in highly malignant tumor
cells (9,10). NDRG2 inhibited the invasion and
migration of highly invasive tumor cells both in vitro and
in vivo.
Aggressive cancer progression is initiated by the
breakdown of epithelial cell homeostasis which is correlated with
the loss of epithelial characteristics and the acquisition of a
migratory phenotype such as mesenchymal cells (11). This phenomenon, known as
epithelial-mesenchymal transition (EMT), is considered to be a
critical event during tumor cell malignancy (11–14).
Epithelial cells are connected to each other through specialized
structures known as adherens junctions, which are composed of
E-cadherin/α- and β-catenin complexes. The development of
metastatic carcinoma is accompanied by deregulation of adherens
junctions and the decrease of E-cadherin expression is an early
step during the initiation of these processes.
Loss of E-cadherin gene expression or
E-cadherin protein is frequently found during tumor progression in
most types of epithelial cancer. Mutation or inactivation (by DNA
methylation) of E-cadherin gene is responsible for such
changes. However, in several types of cancer, E-cadherin expression
is lost without genomic modifications (15) owing to transcriptional repression of
E-cadherin by those EMT-regulating factors (16–20).
An increasing number of transcription factors appear to activate
EMT in various settings, including Snail (16–18,20,21),
Twist (22), high mobility group A2
(HMGA2) (23), Slug (24,25),
SIP1 (19) and Ets-1 (26). A central role of these
transcriptional regulators is the suppression of the
E-cadherin gene. Downregulation of E-cadherin has several
important consequences that are of direct relevance to EMT.
Several signaling pathways implicated in the
progression of EMT, including the Wnt and phosphoinositide 3-kinase
pathways, use glycogen synthase kinase-3β (GSK-3β) to mediate their
responses (27,28). We previously discovered that NDRG2
expression correlates with tumor stages, and NDRG2 can control
tumor development by regulating GSK-3β activity to modulate
TCF/β-catenin signaling (8).
According to recent studies, the expression of Snail family
transcription factors and the following EMT process were shown to
be regulated by the Wnt/β-catenin pathway (29–31).
In the present study, we found the functional relevance of NDRG2 on
GSK-3β activity and the following EMT processes.
Materials and methods
Cell lines and transfection
All cell lines were purchased from the American Type
Culture Collection (ATCC, Rockville, MD, USA); KM12c, Colo205,
HCT116, HT29, SW480 and SW620. The cells were cultured in
Dulbecco’s Modified Eagle’s Medium (DMEM; Gibco-BRL, Invitrogen,
Carlsbad, CA, USA) supplemented with 2 mM glutamine, 1%
penicillin/streptomycin and 10% fetal bovine serum (FBS; HyClon,
Logan, UT, USA), and kept at 37°C in a humidified incubator which
was maintained with 5% CO2. Plasmid containing wild-type
NDRG2 coding region (32) was
transfected into the cell lines with Lipofectamine plus reagent
(Invitrogen) according to the manufacturer’s instructions. Small
interfering RNA directed against human NDRG2 (siGENOME SMARTpool,
catalog No. M-013858-00) was purchased from Dharmacon (Thermo
Fisher Scientific Inc., Waltham, MA, USA) with its control
non-targeting siRNA (catalog No. D-001210-01), and treated
according to the manufacturer’s instructions. As an example, 12
pmole of NDRG2 siRNA was mixed with 15 μl of Lipofectamine RNAiMAX
reagent (Invitrogen), following the instructions, incubated for 20
min at RT, and treated onto cell lines plated on a 60-mm dish with
50% confluence.
Antibodies and western blotting
Cells were washed with phosphate-buffered saline
(PBS), and lysed with cell lysis buffer [20 mM Tris-HCl, pH 7.5,
150 mM NaCl, 1 mM EGTA, 1 mM EDTA, 1% NP-40, 2.5 mM sodium
pyrophosphate, 1 mM Na3VO4, 1 mM NaF and
Complete Protease Inhibitor Cocktail (Roche, Indianapolis, IN,
USA)] on ice for 30 min. Thirty to fifty micrograms of the lysate
were resolved by SDS-PAGE on 10 or 12% gels and transferred to PVDF
membranes (Millipore, Billerica, MA, USA). The membranes were
incubated with primary antibodies followed by peroxidase-conjugated
anti-rabbit or anti-mouse immunoglobulin (IgG) antibodies
(Calbiochem, EMD Chemicals Inc., San Diego, CA, USA) and
SuperSignal® West Pico Chemiluminescent Substrate
(Pierce, Thermo Fisher Scientific, Rockford, IL, USA) for band
visualization. To verify equal loading and adequate transfer, the
membranes were probed with anti-α-tubulin or anti-GAPDH antibodies
(Santa Cruz Biotechnology, Santa Cruz, CA, USA). The primary
antibodies were anti-E-cadherin (BD Biosciences, San Jose, CA,
USA), anti-GSK-3β, anti-phospho-GSK-3β (Cell Signaling Technology,
Beverly, MA, USA) and anti-Snai1 (Santa Cruz Biotechnology).
Monoclonal anti-NDRG2 antibody (clone# 18c12) was previously
described (33).
Luciferase reporter assay
Cells at 40–50% confluence in 12-well plates were
transfected with a reporter luciferase plasmid containing
E-cadherin promoter region (GeneBank ID: L34545, −368~+51)
(34) in combination with
NDRG2-expressing plasmid using FuGENE 6 transfection reagent
(Roche) according to the manufacturer’s instructions. Total amount
of plasmid DNA per well was adjusted to be the same by adding
suitable amounts of empty vector. Cells were harvested 48 h after
transfection, and luciferase activity was measured by commercial
luciferase assay kit (Promega, Madison, WI, USA) on TD-20/20 Turner
luminometer (Turner Designs, Sunnyvale, CA, USA). Transfection
efficiency was normalized by co-transfection of β-galactosidase
with minimal promoter (pSV-β-galactosidase; Promega). All
experimental and control groups contained at least three wells, and
the results were reported as mean absorption ± standard error.
RT-PCR analysis
Two-step RT-PCR reaction was performed using reverse
transcriptase with oligo-dT primer and Taq polymerase
(Takara Bio, Shiga, Japan) with specific primer pairs. Total RNA
was isolated by a standard protocol (35), and cDNA was synthesized using
AccuScript High Fidelity first strand cDNA synthesis kit
(Stratagene, La Jolla, CA, USA) following the manufacturer’s
instructions. One microliter of the synthesized cDNA was used per
20 μl PCR reaction, which comprised of 0.2U ExTaq DNA
polymerase, 1X buffer and 1 mM dNTP mix (Takara) with specific
primer pair, and amplified as follows: 94°C for 5 min, then 25–40
cycles of 94°C for 45 sec, 56°C for 45 sec and 72°C for 1 min,
followed by a final extension of 7 min at 72°C using GeneAmp PCR
System 2700 (Applied Biosystems, Foster City, CA, USA). The PCR
primers were designed by the Primer3 program and purchased from
Bioneer Corp. (Daejeon, Korea). The PCR products were separated on
1.5% agarose gel, stained with ethidium bromide, visualized by Gel
Doc 2000 UV transilluminator (Bio-Rad Laboratories, Hercules, CA,
USA) and analyzed using Quantity One software (Bio-Rad
Laboratories). Each sample was tested more than three times and
representative data are shown. The used primer pairs were: NDRG2,
5′-GGACATCTTTTCAGCCAGGA-3′ (F) and 5′-CCCATGCCTTGCAGGAAGT-3′ (R);
GAPDH, 5′-CCATCACCATCTTCCAGGAG-3′ (F) and 5′-AC
AGTCTTCTGGGTGGCAGT-3′ (R); E-cadherin, 5′-TGAT TCTGCTGCTCTTGCTG-3′
(F) and 5′-CGAGTCCCCTAGTC GTCCT-3′ (R); Snai-1,
5′-CACTATGCCGCGCTCTTT-3′ (F) and 5′-GGCAGGTATGGAGAGGAAGA-3′
(R).
Patient samples and immunohistochemistry
(IHC)
Human colorectal carcinoma samples were obtained
from patients who underwent routine surgery for colorectal cancer
at the Department of Surgery, Eulji University Hospital, between
January 2002 and December 2005. For immunohistochemical study, 99
colorectal carcinoma tissues and paired normal mucosal tissues
obtained from a site distant from the tumor lesion were fixed in
10% neutralization-buffered formalin solution for 24 h and embedded
in paraffin wax. Serial sections 4-μm thick were cut and mounted on
charged glass slides (Superfrost Plus; Fisher Scientific,
Rochester, NY, USA). IHC conditions for NDRG2 and E-cadherin were
optimized and evaluated by two independent pathologists. In brief,
tissue sections were microwaved twice for 10 min in citrate buffer
(pH 6.0) for antigen retrieval. The sections were then treated with
3% hydrogen peroxide in methanol to quench the endogenous
peroxidase activity followed by incubation with 1% BSA. Mouse
monoclonal antibody against NDRG2 and E-cadherin (Clone 36B5:
Neomarkers, Fremont, CA, USA), was used at dilutions of 1:100 and
1:30, respectively. The avidin-biotin detection method was used and
the tissue section was immersed in 3-amino-9-ethyl carbazole (AEC)
as a substrate, and counterstained with 10% Mayer’s hematoxylin,
dehydrated and mounted by crystal mount. An irrelevant mouse IgG of
the same isotype or antibody dilution solution served as a negative
control.
Assessment of immunostaining and
statistical analysis
Each slide was evaluated for NDRG2 and E-cadherin
immunoreactivity using a semi-quantitative scoring system for both
the intensity of the stain and the percentage of positive
neoplastic cells. NDRG2 and E-cadherin immunoreactivity was
observed primarily in the cytosolic membrane in colorectal mucosal
and malignant cells. The intensity of membrane staining was coded
as: 0, lower than the adjacent normal-appearing mucosal epithelium;
1, similar to the adjacent mucosal epithelium; and 2, stronger than
the adjacent mucosal epithelium. The percentage of cells displaying
a stronger staining intensity than the adjacent mucosal epithelium
was scored as: 1 (0–24% tumor cells stained), 2 (25–49% tumor cells
stained), 3 (50–74% tumor cells stained), 4 (75–100% tumor cells
stained). For the purpose of statistical analysis, the median of
this series (25% of malignant cells showing a stronger intensity
than adjacent colonic epithelium) was used as a cut-off value to
distinguish tumors with a low (<25%) or high (>25%) level of
NDRG2 and E-cadherin expression. The relationship between the
results of the immunohistochemical study and the
clinicopathological parameters was determined using the SPSS
software package (version 14.0; SPSS Inc., Chicago, IL, USA). The
correlation between staining index scores and other categorical
factors was analyzed using the Pearson’s Chi-square test of
independence.
Prognostic parameter for overall
survival
Recurrence free survival was defined as the time
from the date of surgery to the first date of recurrence of cancer,
or mortality due to any cause. Overall survival was defined as the
time from the date of surgery to the date of last follow-up or
mortality due to any cause. The median follow-up period for all
patients was 53.3 months (inter-quartile range, 23.5–77.0).
Survival curve and median survival curve were estimated by the
Kaplan-Meier method. The log-rank test was used to evaluate the
statistical significance of differences in survival distribution.
Multivariate analysis was performed using the Cox proportional
hazards regression analysis. Results were considered to indicate a
statistically significant difference if P<0.05.
Confocal microscopy
Cells were cultured on coverslips, rinsed three
times in cold PBS, fixed with 4% paraformaldehyde at room
temperature for 20 min and permeabilized with 0.1% Triton X-100 in
PBS for 10 min. The cells were then blocked with 1% BSA in PBS for
30 min, and stained with anti-E-cadherin and anti-NDRG2 mAbs for 2
h. Finally, the cells were incubated with Alexa Fluor 488 or 594
conjugated rabbit anti-mouse IgG (Molecular Probes, Invitrogen) in
darkness for 1 h. The coverslips containing the cells were mounted
on glass slides with Vectashield mounting medium containing DAPI
(Vector Laboratories, Burlingame, CA, USA) and visualized using
Zeiss confocal microscope LSM 510 META (Carl Zeiss, Jena, Germany)
at ×40 magnification. The confocal images were captured by Zeiss
LSM Image Browser program.
Results
The relationship between NDRG2 and
E-cadherin expression
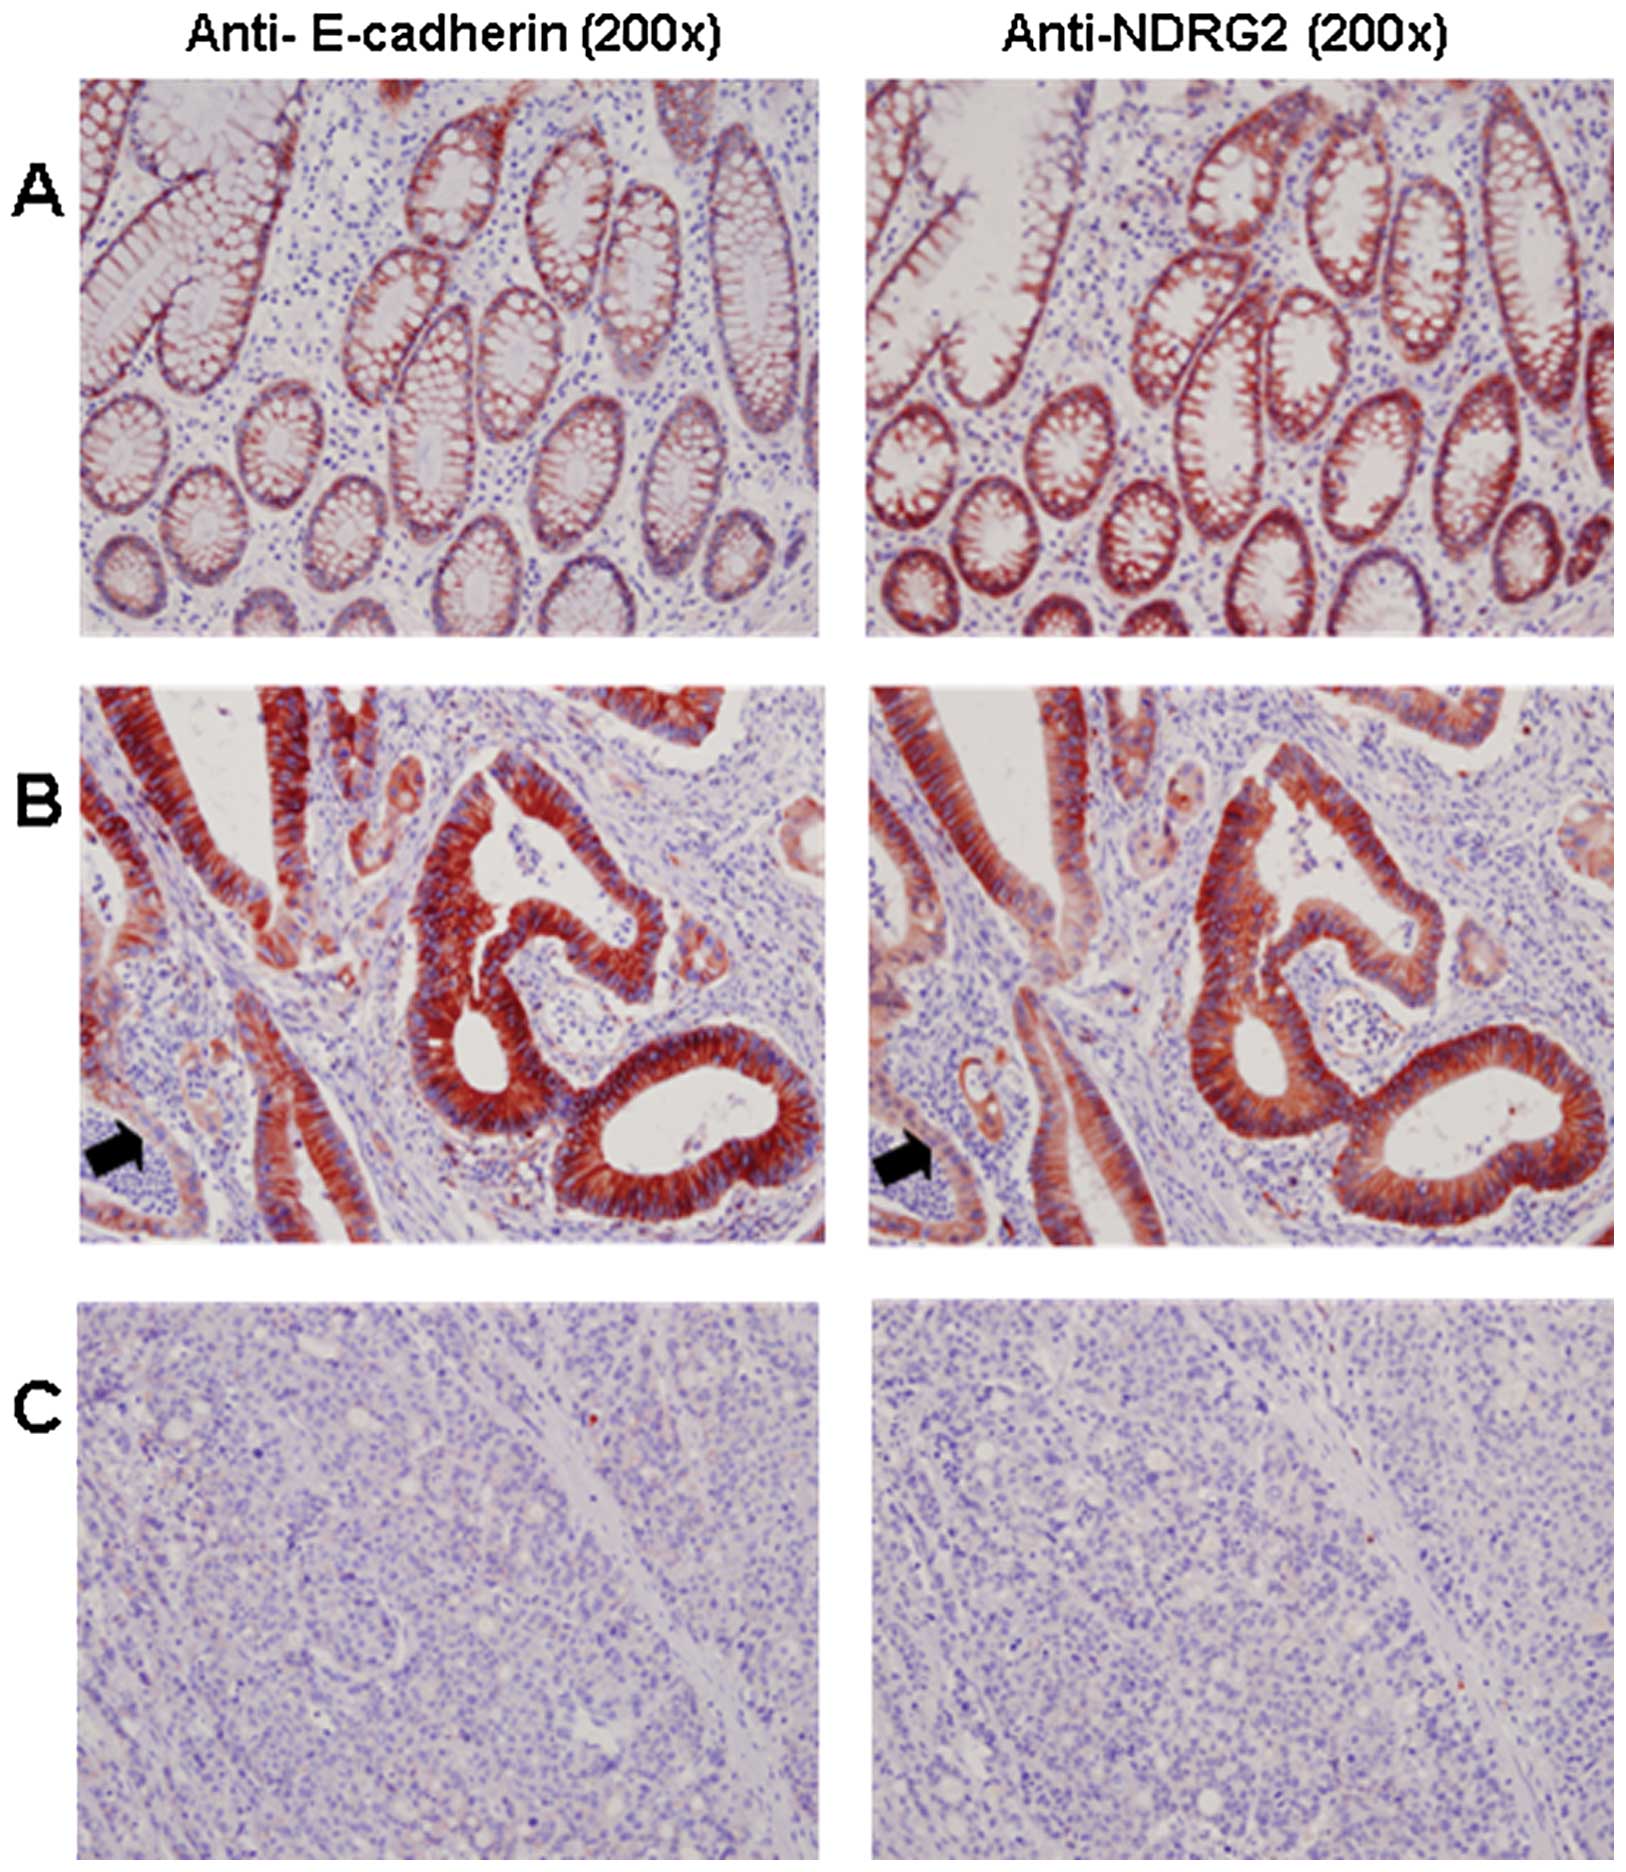
Expression levels and patterns of NDRG2 and
E-cadherin in human colorectal carcinomas were evaluated by
immunohistochemical analysis. Fig.
1A shows that both NDRG2 and E-cadherin were highly expressed
in a similar pattern in normal colonic mucosa from patients in
cytoplasmic membrane. In colorectal carcinoma, the variations of
staining intensity were dependent on tumor differentiation. It was
distinctively expressed in the well-differentiated colorectal
carcinomas (Fig. 1B) compared to
the less-differentiated tumor tissues (Fig. 1C). Notably, E-cadherin was more
strongly expressed in the well-differentiated area than in the less
differentiated area in the tumor tissue of each patient, similar to
the expression pattern of NDRG2 as in our previous report (8). Statistical analysis showed a positive
correlation between the expression status of NDRG2 and E-cadherin
(P<0.0001) (Table I).
 | Table ICorrelation between NDRG2 and
E-cadherin expression status. |
Table I
Correlation between NDRG2 and
E-cadherin expression status.
| | | E-cadherin
expression |
|---|
| | |
|
|---|
| Frequency | Total | Low/negative, n
(%) | High, n (%) |
|---|
| Membranous NDRG2
expression | Low, n (%) | 55 | 30 (54.5) | 25 (45.5) |
| High, n (%) | 44 | 2 (4.5) | 42 (95.5) |
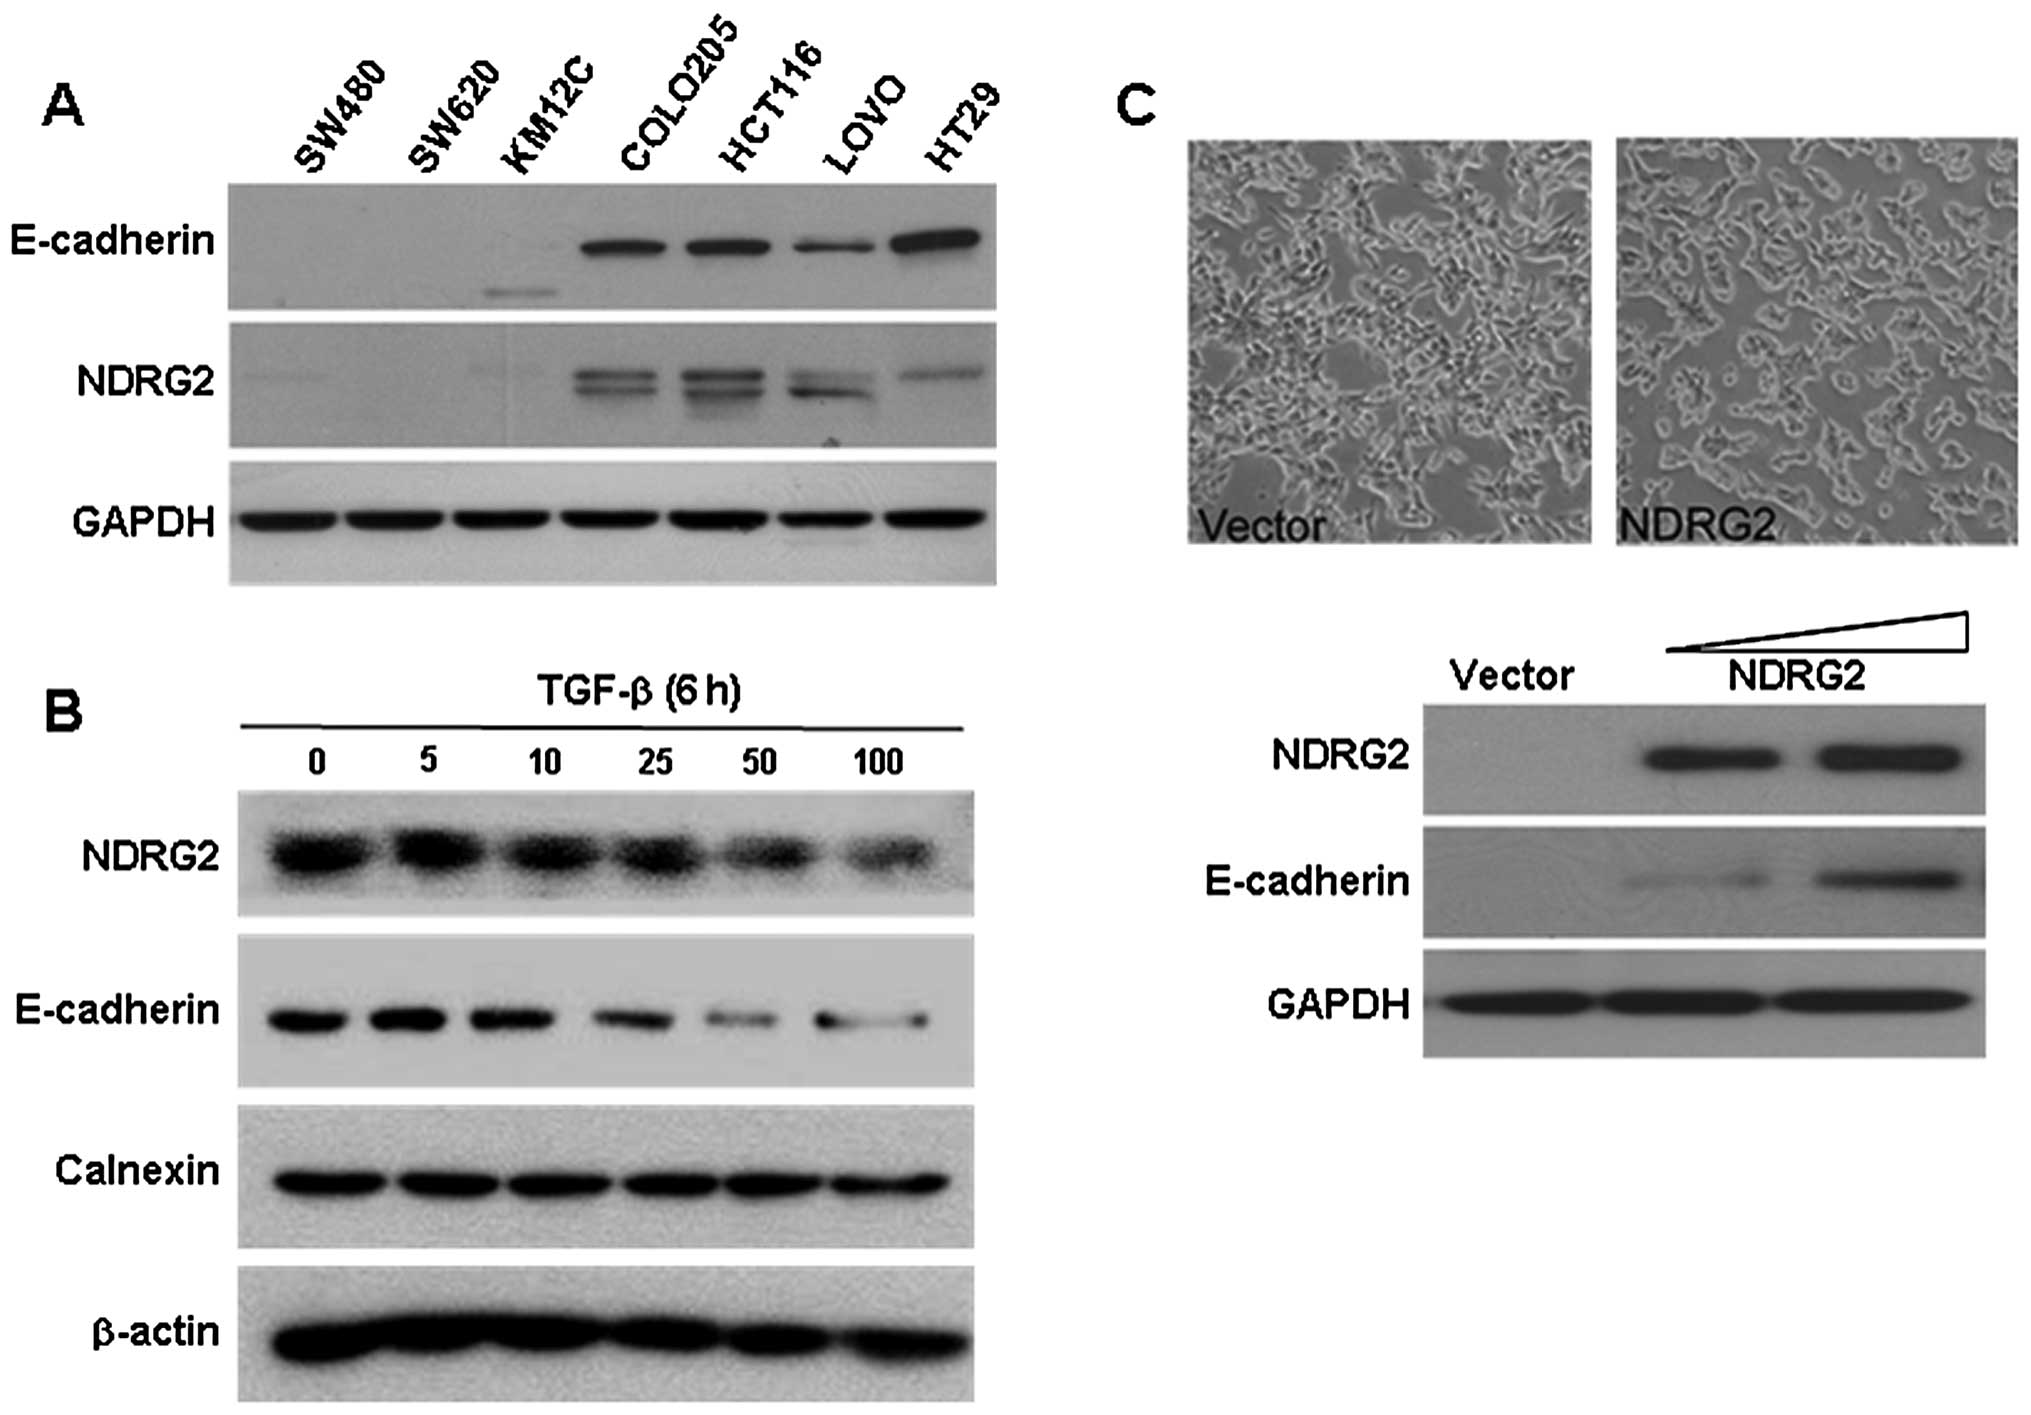
Expression analyses of NDRG2 and E-cadherin in
several colorectal cancer cell lines supported their positive
relationships (Fig. 2A). Very low
or no expression of NDRG2 and E-cadherin were detected in SW480,
SW620 and KM12c cell lines. On the contrary, both NDRG2 and
E-cadherin were expressed strongly in HCT116, Colo205, LoVo and
HT29 cell lines. Moreover, the expression of NDRG2 was notably
gradually decreased in the TGF-β-treated HCT116 cells in a
dose-dependent manner. In these NDRG2 modulating conditions, the
expression pattern of E-cadherin was similar to that of E-cadherin
(Fig. 2B). The directly NDRG2
introduced SW480 cells also induced the E-cadherin expression
(Fig. 2C).
NDRG2 regulates E-cadherin transcription
via GSK-3β activation
To explore the direct effect of NDRG2 on
E-cadherin transcription, a reporter plasmid containing
promoter region (−368~+51) of E-cadherin was used for
luciferase assay. When NDRG2-expressing plasmid was co-transfected
with the reporter plasmid, NDRG2 increased the E-cadherin
promoter activity in a concentration-dependent manner (Fig. 3A). Introduction of NDRG2 into cell
lines showing low level of NDRG2 expression induced the increase of
E-cadherin promoter activity. Additionally, in the cell
lines which express higher levels of NDRG2 and E-cadherin,
downregulation of NDRG2 by siRNA treatment induced a decrease of
E-cadherin promoter activity. Treatment of siNDRG2 decreased
the E-cadherin promoter activity in a
concentration-dependent manner in HCT116 and Colo205 cell lines
(Fig. 3B). RT-PCR analysis
confirmed that NDRG2 introduction into KM12 induced higher level of
E-cadherin expression compared with control in which empty
vector was transfected (Fig. 3C).
Similarly, siNDRG2 treatment in HCT116 induced downregulation of
E-cadherin transcription (Fig.
3D). Snail, a master regulator of EMT during embryonic
development, was previously reported to be regulated by GSK-3β
activity (29,30). In our previous study, we discovered
that overexpression of NDRG2 in colon cancer cells induced GSK-3β
activation (8). We have studied the
effect of NDRG2 on the regulation of Snai-1 (a human homologue of
Drosophila Snail) expression through GSK-3β activation.
LiCl, a GSK-3β inhibitor, and/or MG132, a proteasomal inhibitor,
blocked NDRG2-mediated upregulation of E-cadherin expression even
if there was a high expression level of NDRG2 (Fig. 3E). Transcription assay using
reporter plasmid provided further evidence that E-cadherin
regulation by NDRG2 may be mediated by GSK-3β. Downregulation of
NDRG2 by siRNA treatment in HCT116 cells caused upregulation of
Snai-1 expression and the decrease of E-cadherin (Fig. 3F).
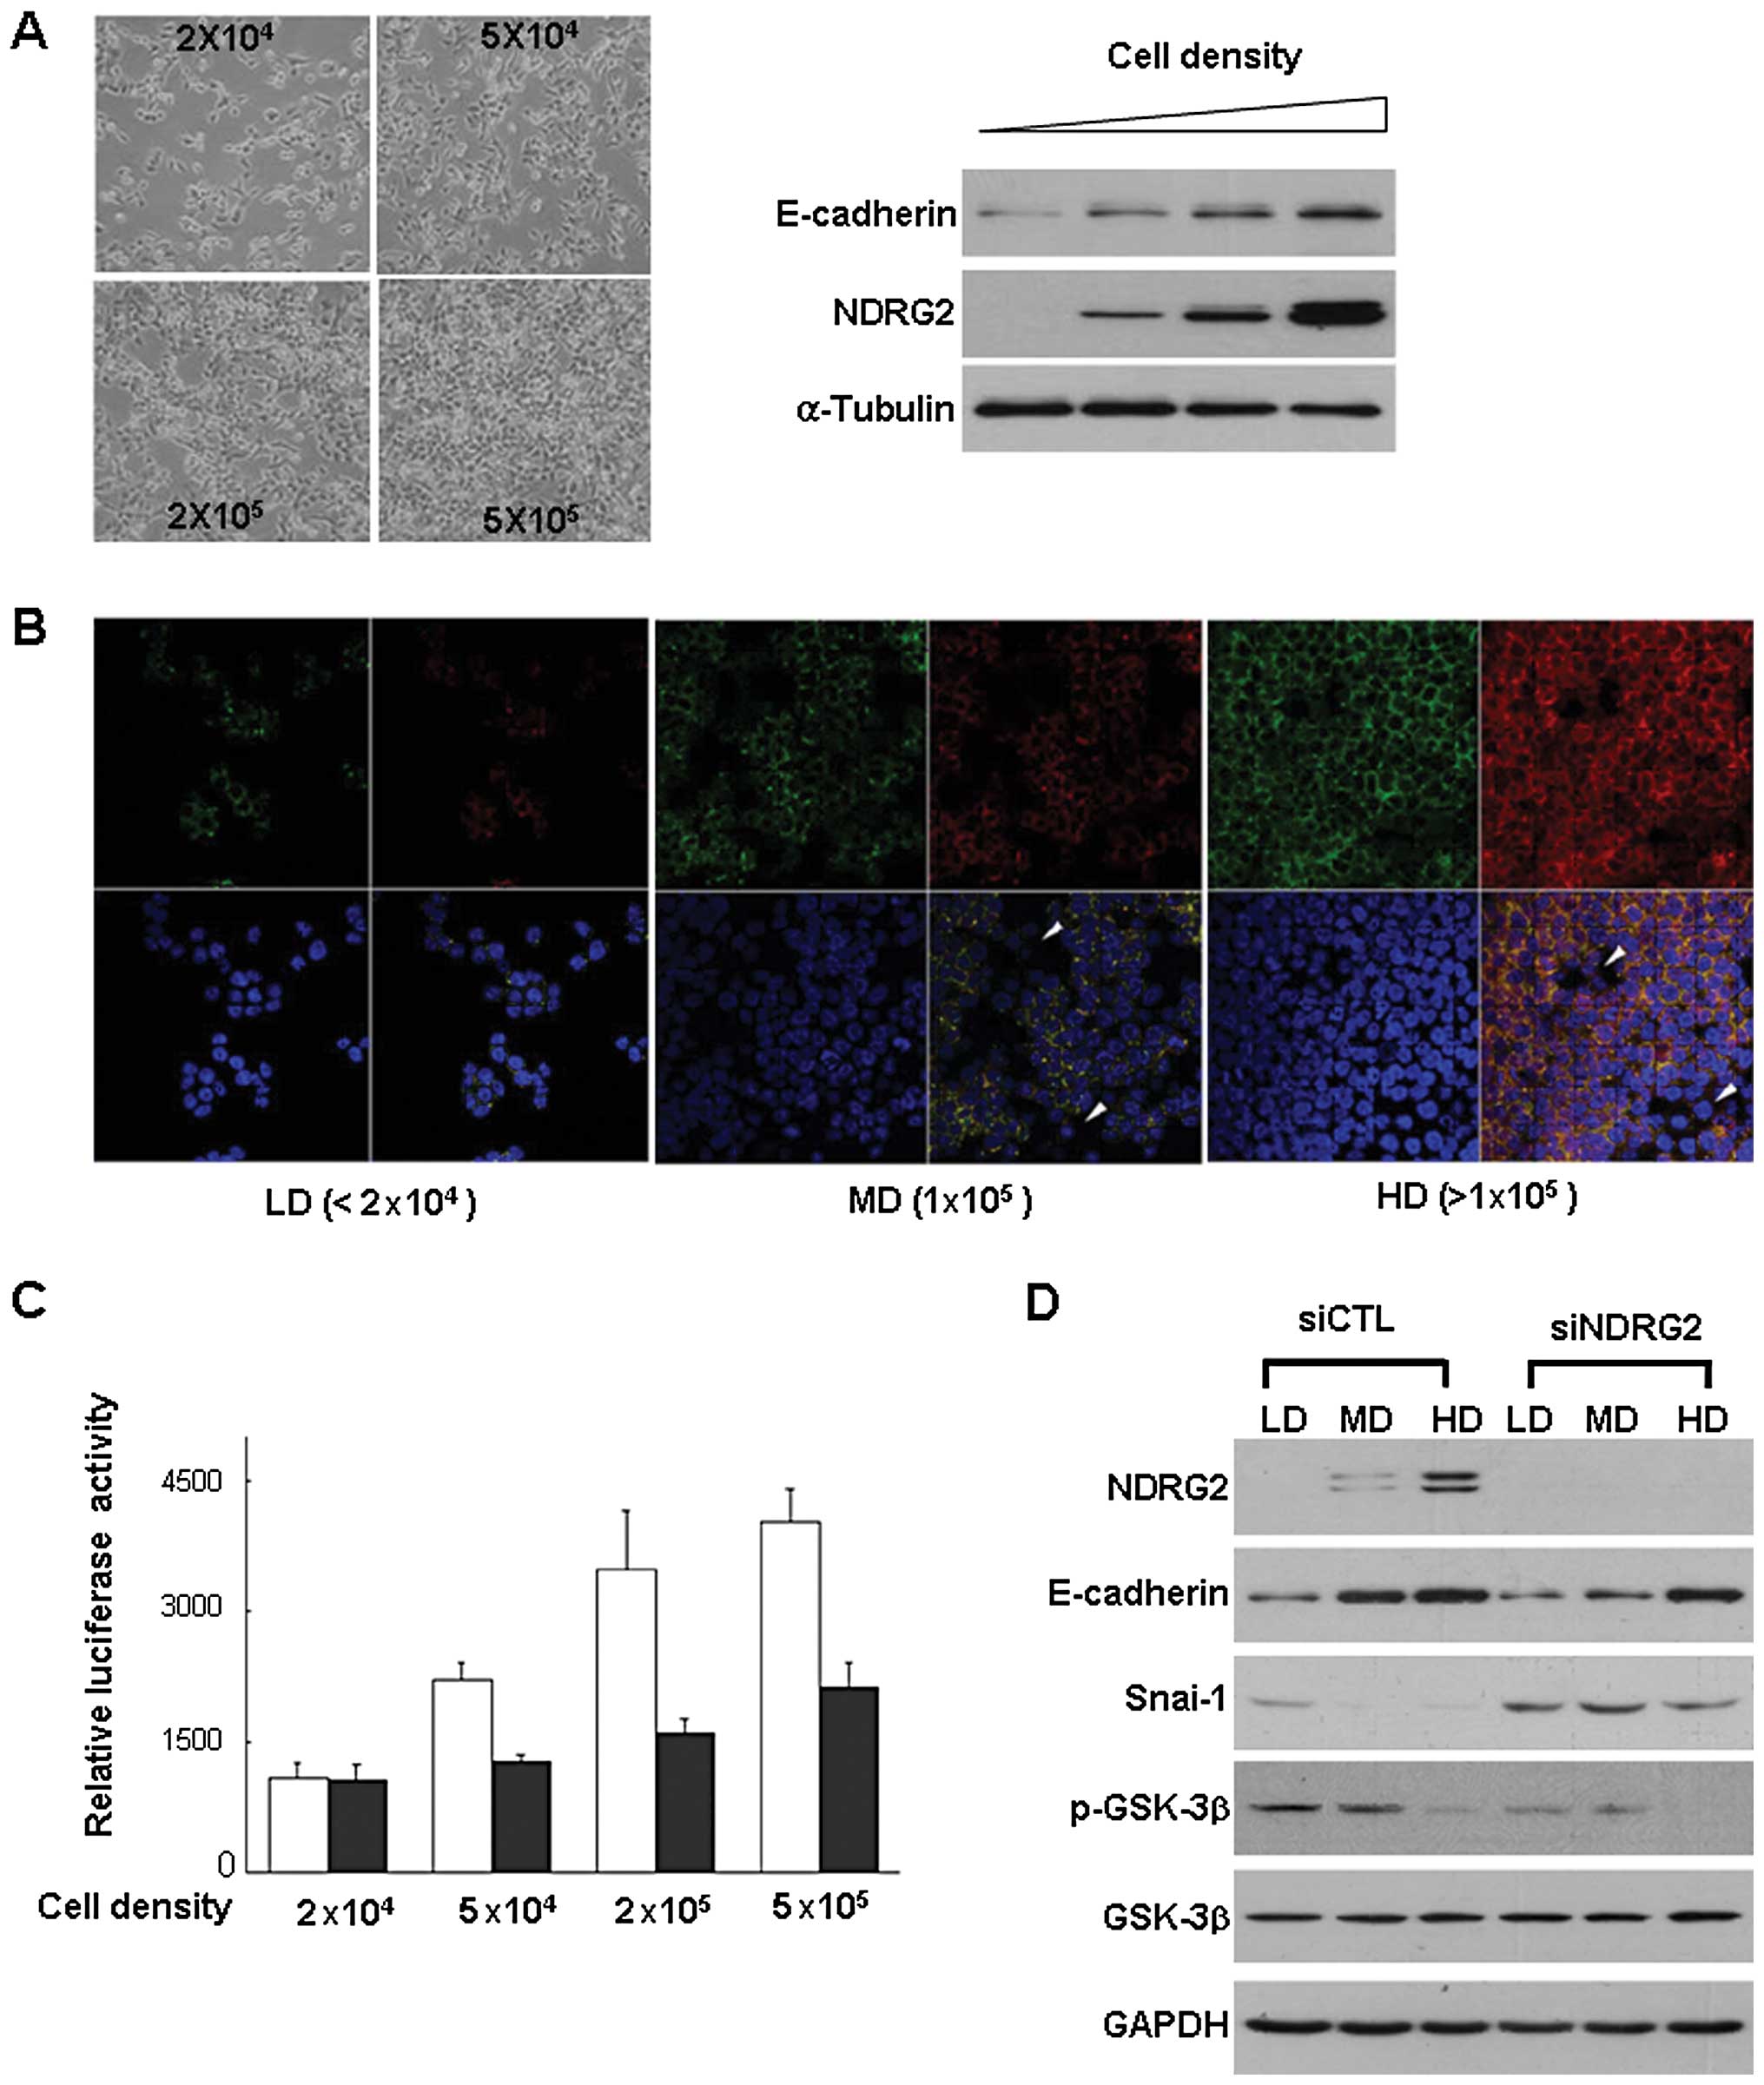
Regulation of NDRG2 and E-cadherin
expression by cell density
E-cadherin expression in HCT116 cells is regulated
by cell densities (31). We
verified the correlation between E-cadherin expression and cell
density in HCT116 cells, and found that the amounts of E-cadherin
and NDRG2 expression were increased with cell density concomitantly
(Fig. 4A). This type of
expressional correlation was verified by immunocytochemical data
(Fig. 4B). E-cadherin staining
exhibited the same patterns with NDRG2 staining which increased
with cell density. In compact regions, both NDRG2 and E-cadherin
were strongly detected. Conversely, NDRG2 expression was rarely
detected at low-density regions (arrow-head) although total cell
density was higher (Fig. 4B).
Knockdown of NDRG2 blocked the density-induced increase of
E-cadherin expression and E-cadherin promoter activity even
in the highest cell density (Fig.
4C). As expected, phosphorylation level of GSK-3β was decreased
with cell density. However, siNDRG2 treatment did not induce any
changes in GSK-3β status, indicating that GSK-3β activity can be
regulated by NDRG2 function (Fig.
4D).
NDRG2 expression level is an independent
prognostic factor for overall survival
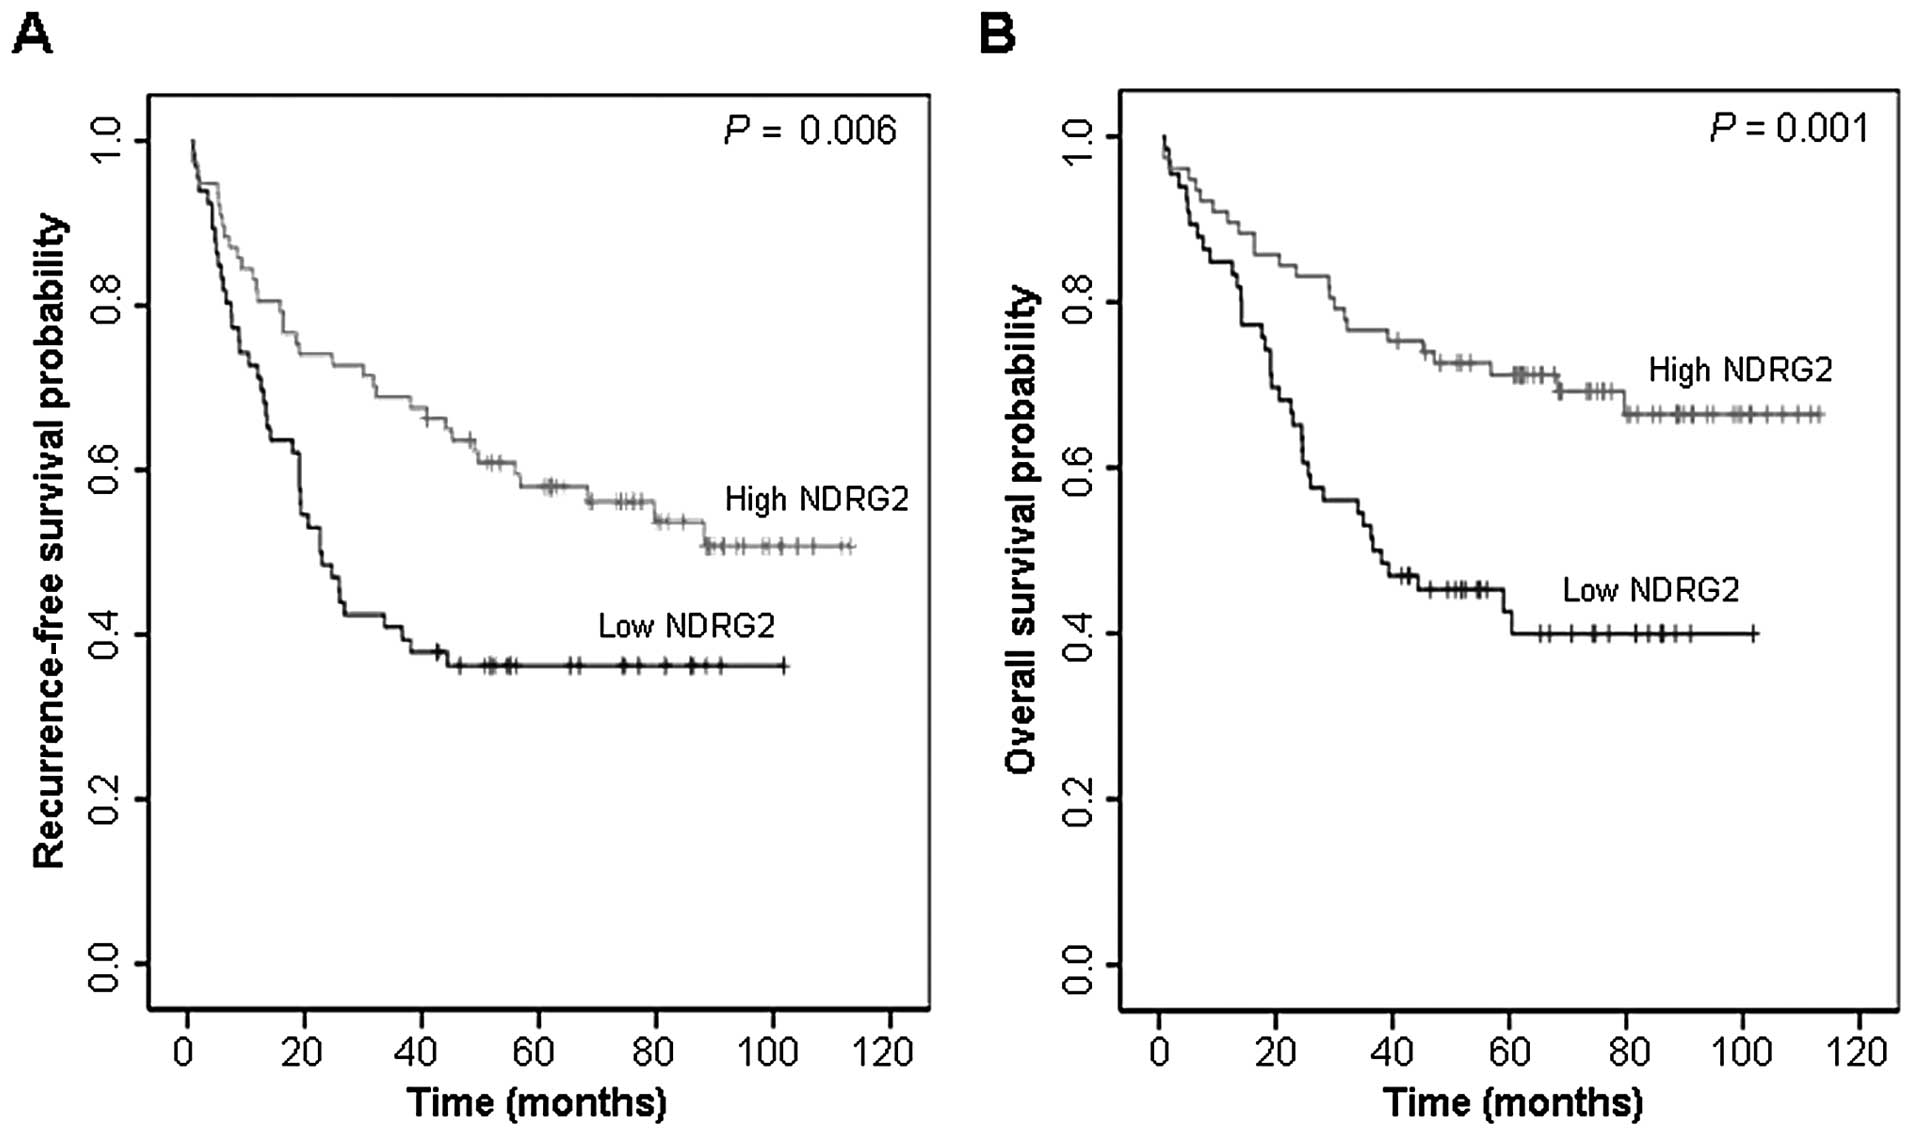
We first carried out univariate analyses to examine
whether the expression status of NDRG2 correlates with
recurrence-free survival. A total of 38 patients (26.6%) presented
with recurrence during the follow-up period. At the end of the
follow-up, 81 (56.6%) patients were alive and 62 had died. The
analysis showed that a high level of NDRG2 expression was
associated with recurrence-free survival (P=0.006), shown in
Fig. 5A. A high level of NDRG2
expression also correlated significantly with favorable overall
survival (P=0.001). Cumulative overall survival curves of patients
were significantly split by NDRG2 expression status (Fig. 5B). The mean overall survival for
patients with high and low level of NDRG2 expression, and all
patients were 84.9, 54.4 and 73.1 months, respectively. We carried
out multivariate analyses to assess the predictive value of NDRG2
expression status for recurrence-free survival and overall survival
by adjusting other potentially prognostic factors including age,
gender, tumor site, tumor size, cell differentiation and tumor
stage. The results corroborated a favorable survival outcome in
patients with a high level of NDRG2 expression. In a multivariate
Cox regression analysis, the independent prognostic factors
significantly associated with overall survival were NDRG2 (P=0.018)
and tumor stage (P=0.001). The relative risk (RR) of mortality was
more than twice greater in patients with low NDRG2 (RR, 0.486; 95%
CI, 0.267–0.884) than in those with high NDRG2. Although it did not
reach statistical significance, a high level of NDRG2 expression
was also predictive of increased recurrence-free survival with a
P-value of 0.051. The relative risk (RR) of disease recurrence for
patients with high NDRG2 was 0.572 (95% CI, 0.326–1.003). Results
from the Cox proportional hazards analysis are summarized in
Table II.
| Table IIMultivariate Cox proportional hazards
analysis for recurrence-free survival and overall survival. |
Table II
Multivariate Cox proportional hazards
analysis for recurrence-free survival and overall survival.
| | Recurrence-free
survival | Overall
survival |
|---|
| |
|
|
|---|
| n | RR (95% CI) | P-value | Median (95%
CI) | P-value |
|---|
| NDRG2 level |
| Low/negative | 77 | 1.000 | 0.051 | 1.000 | 0.018 |
| High | 66 | 0.572
(0.326–1.003) | | 0.486
(0.267–0.884) | |
| Age (years) |
| <50 | 26 | 1.000 | 0.996 | 1.000 | 0.123 |
| ≥50 | 117 | 0.999
(0.554–1.799) | | 1.771
(0.856–3.663) | |
| Gender |
| Female | 68 | 1.000 | 0.132 | 1.000 | 0.680 |
| Male | 75 | 1.444
(0.895–2.330) | | 1.118
(0.658–1.899) | |
| Site |
| Right colon | 34 | 1.000 | 0.089 | 1.000 | 0.167 |
| Left colon | 109 | 1.696
(0.922–3.122) | | 1.614
(0.818–3.185) | |
| Size diameter
(cm) |
| <5 | 61 | 1.000 | 0.344 | 1.000 | 0.104 |
| ≥5 | 82 | 1.27
(0.774–2.085) | | 1.626
(0.905–2.922) | |
|
Differentiation |
| Well | 34 | 1.000 | 0.612 | 1.000 | 0.933 |
| Moderately | 81 | 0.712
(0.360–1.409) | | 1.015
(0.467–2.205) | |
| Poorly | 28 | 0.772
(0.319–1.873) | | 1.147
(0.444–2.964) | |
| Dukes’ stage |
| A and B | 66 | 1.000 | 0.001 | 1.000 | 0.001 |
| C and D | 77 | 2.573
(1.507–4.395) | | 2.879
(1.585–5.230) | |
Discussion
Accumulating evidence presents the function of NDRG2
as a tumor suppressor active in early stages of tumor development;
however, little is known about its molecular mechanisms. We
previously discovered that NDRG2 inhibits tumor cell proliferation
by modulating AP-1 transcription factor activity (32), and tumor cell metastasis by
inactivating TCF/β-catenin signaling (8). During these studies, we found that
NDRG2 expression increases as cell density increases (Fig. 4A), which matches with E-cadherin
expression pattern (31). This led
us to study their expressional correlation and the functional
relevance of NDRG2 during tumor metastasis.
We explored possible correlations between NDRG2 and
E-cadherin expression status in colon cancer tissues (Fig. 1, Table
I). Among 44 tumor tissues exhibiting a high level of NDRG2
immunoreactivity, 42 cases displayed high level of E-cadherin
expression. On the contrary, 30 cases showed a correspondingly low
level of E-cadherin among 55 tumor tissues showing low level of
NDRG2. The likelihood of expressing high level of E-cadherin in
tumors with high level of NDRG2 is 1.68 times (95% CI,
5.5416–114.5953) greater than in tumors with low levels of NDRG2.
Indeed, the association between NDRG2 and E-cadherin expression
status reached statistical significance based on the analysis
(P<0.0001). This correlation in their expression patterns was
confirmed by transfection experiments of NDRG2-expressing plasmid
or siRNA into colon cancer cell lines.
Reporter assay and RT-PCR analysis indicated that
NDRG2 regulates E-cadherin expression at the transcriptional level.
E-cadherin is a key molecule in the maintenance of epithelial
phenotype and its deregulation may be a critical step in EMT, which
leads to metastasis of epithelial tumors. Transcriptional
repression of E-cadherin and associated morphological
changes in cells occur during EMT and some of these processes are
related with Snail function regulated by Wnt/β-catenin signaling
(29,36–38).
Snail, a zinc-finger transcriptional repressor, contains several
consensus sites for GSK-3β, and phosphorylation of these sites by
GSK-3β facilitates its proteasomal degradation as β-catenin does
(36). It was previously reported
that NDRG2 functions as a tumor suppressor by regulating GSK-3β
signaling (8). We studied the
functional relevance of GSK-3β activity on the regulation of NDRG2
function to control E-cadherin expression. Increase of E-cadherin
expression induced by NDRG2 was blocked by LiCl or MG132 treatment
demonstrating that NDRG2 employs GSK-3β kinase activity to regulate
E-cadherin expression. Inhibition of proteasomal degradation
mediated by GSK-3β resulted in enhancement of Snail activity with
concomitant downregulation of E-cadherin expression irrespective of
the presence of NDRG2, which indicates NDRG2 is an upstream
regulator of GSK-3β-mediated E-cadherin regulation. GSK-3β is also
known as an endogenous inhibitor of Snail transcription (30). However, Snail downregulation by
NDRG2 did not appear to be transcriptional in our system. mRNA
level of Snail in colon cancer cell lines displayed no
correlation with NDRG2 expression (Fig.
4D). Activated GSK-3β also induces the degradation of β-catenin
through proteasomal pathway. β-catenin known as a direct activator
of Slug, a transcriptional repressor of E-cadherin (known as
Snai-2 in human) (31). In our
system, GSK-3β-mediated modulation of β-catenin degradation was not
detected (data not shown), as HCT116 is known to express
degradation-resistant β-catenin mutant form (39,40).
Epithelial cells grow as clusters that maintain
complete cell-to-cell adhesion and tightly packed structure is a
major characteristic of epithelial tissues. In high-density culture
conditions, cells will form compact layers assuming epithelial
phenotype. On the contrary, cells will grow as mesenchymal
structure in sparse culture conditions. Confocal staining of NDRG2
and E-cadherin showed these phenomena definitively (Fig. 4B). NDRG2 expression was increased
with cell density and was the highest at the central region of
dense culture in which each cell was surrounded by neighboring
cells. However, at the marginal regions, NDRG2 expression was
rarely detected (arrowhead in Fig.
4B). These expression patterns were the same for E-cadherin
expression.
Recently, Piepoli et al(41) reported on NDRG2 promoter methylation
during colorectal tumor development. However, we could not find a
correlation between NDRG2 expression and promoter methylation
status in colon cancer cell lines (data not shown). Instead, NDRG2
is known to be regulated by phosphorylation (32). According to western blot data, NDRG2
is shown as a doublet. Higher molecular weight band is the
phosphorylated form of NDRG2 (Fig.
2A). Extracellular signals such as cytokines or hypoxic
conditions can regulate NDRG2 phosphorylation status although we
could not find the exact conditions for the phosphorylation. HIF-1α
may be a candidate for NDRG2 phosphorylation as it is activated by
hypoxic conditions which occur during high density cell growth. A
better understanding of the molecular mechanisms that control NDRG2
activity will help us to elucidate the early stage of tumor cell
development.
Acknowledgements
The present study was supported by a grant of the
Korea Healthcare Technology R&D Project, Ministry for Health,
Welfare & Family Affairs, Republic of Korea (A090509) and a
grant from KRIBB Research Initiative Program (KCS3021211).
Abbreviations:
|
NDRG2
|
N-Myc downstream-regulated gene 2
|
|
EMT
|
epithelial-mesenchymal transition
|
|
GSK-3β
|
glycogen synthase kinase 3β
|
|
TCF
|
T-cell factor
|
|
HMGA2
|
high mobility group A2
|
|
CD
|
cluster designation
|
|
PVDF
|
polyvinylidene fluoride
|
|
GAPDH
|
glyceraldehyde 3-phosphate
dehydrogenase
|
|
IgG
|
immunoglobulin G
|
|
mAb
|
monoclonal antibody
|
|
RT-PCR
|
reverse transcriptase-polymerase chain
reaction
|
|
RNA
|
ribonucleic acid
|
|
dNTP
|
deoxyribonucleotide triphosphate
|
References
|
1
|
Qu X, Zhai Y, Wei H, Zhang C, Xing G, Yu Y
and He F: Characterization and expression of three novel
differentiation-related genes belong to the human NDRG gene family.
Mol Cell Biochem. 229:35–44. 2002. View Article : Google Scholar : PubMed/NCBI
|
|
2
|
Nichols NR, Agolley D, Zieba M and Bye N:
Glucocorticoid regulation of glial responses during hippocampal
neurodegeneration and regeneration. Brain Res Brain Res Rev.
48:287–301. 2005. View Article : Google Scholar : PubMed/NCBI
|
|
3
|
Choi SC, Kim KD, Kim JT, Kim JW, Yoon DY,
Choe YK, Chang YS, Paik SG and Lim JS: Expression and regulation of
NDRG2 (N-myc downstream regulated gene 2) during the
differentiation of dendritic cells. FEBS Lett. 553:413–418. 2003.
View Article : Google Scholar : PubMed/NCBI
|
|
4
|
Lusis EA, Watson MA, Chicoine MR, Lyman M,
Roerig P, Reifenberger G, Gutmann DH and Perry A: Integrative
genomic analysis identifies NDRG2 as a candidate tumor suppressor
gene frequently inactivated in clinically aggressive meningioma.
Cancer Res. 65:7121–7126. 2005. View Article : Google Scholar : PubMed/NCBI
|
|
5
|
Deng Y, Yao L, Chau L, Ng SS, Peng Y, Liu
X, Au WS, Wang J, Li F, Ji S, Han H, Nie X, Li Q, Kung HF, Leung SY
and Lin MC: N-Myc downstream-regulated gene 2 (NDRG2) inhibits
glioblastoma cell proliferation. Int J Cancer. 106:342–347. 2003.
View Article : Google Scholar : PubMed/NCBI
|
|
6
|
Kim A, Yang Y, Lee MS, Yoo YD, Lee HG and
Lim JS: NDRG2 gene expression in B16F10 melanoma cells restrains
melanogenesis via inhibition of Mitf expression. Pigment Cell
Melanoma Res. 21:653–664. 2008. View Article : Google Scholar : PubMed/NCBI
|
|
7
|
Hu XL, Liu XP, Lin SX, Deng YC, Liu N, Li
X and Yao LB: NDRG2 expression and mutation in human liver and
pancreatic cancers. World J Gastroenterol. 10:3518–3521.
2004.PubMed/NCBI
|
|
8
|
Kim YJ, Yoon SY, Kim JT, Song EY, Lee HG,
Son HJ, Kim SY, Cho D, Choi I, Kim JH and Kim JW: NDRG2 expression
decreases with tumor stages and regulates TCF/β-catenin signaling
in human colon carcinoma. Carcinogenesis. 30:598–605.
2009.PubMed/NCBI
|
|
9
|
Lee DC, Kang YK, Kim WH, Jang YJ, Kim DJ,
Park IY, Sohn BH, Sohn HA, Lee HG, Lim JS, Kim JW, Song EY, Kim DM,
Lee MN, Oh GT, Kim SJ, Park KC, Yoo HS, Choi JY and Yeom YI:
Functional and clinical evidence for NDRG2 as a candidate
suppressor of liver cancer metastasis. Cancer Res. 68:4210–4220.
2008. View Article : Google Scholar : PubMed/NCBI
|
|
10
|
Kim A, Kim MJ, Yang Y, Kim JW, Yeom YI and
Lim JS: Suppression of NF-κB activity by NDRG2 expression
attenuates the invasive potential of highly malignant tumor cells.
Carcinogenesis. 30:927–936. 2009.
|
|
11
|
Brabletz T, Jung A, Spaderna S, Hlubek F
and Kirchner T: Migrating cancer stem cells - an integrated concept
of malignant tumour progression. Nat Rev Cancer. 5:744–749. 2005.
View Article : Google Scholar : PubMed/NCBI
|
|
12
|
Thiery JP and Sleeman JP: Complex networks
orchestrate epithelial-mesenchymal transitions. Nat Rev Mol Cell
Biol. 7:131–142. 2006. View
Article : Google Scholar : PubMed/NCBI
|
|
13
|
Thiery JP: Epithelial-mesenchymal
transitions in development and pathologies. Curr Opin Cell Biol.
15:740–746. 2003. View Article : Google Scholar : PubMed/NCBI
|
|
14
|
Radisky DC: Epithelial-mesenchymal
transition. J Cell Sci. 118:4325–4326. 2005. View Article : Google Scholar : PubMed/NCBI
|
|
15
|
Hirohashi S: Inactivation of the
E-cadherin-mediated cell adhesion system in human cancers. Am J
Pathol. 153:333–339. 1998. View Article : Google Scholar : PubMed/NCBI
|
|
16
|
Batlle E, Sancho E, Francí C, Domínguez D,
Monfar M, Baulida J and García De Herreros A: The transcription
factor snail is a repressor of E-cadherin gene expression in
epithelial tumour cells. Nat Cell Biol. 2:84–89. 2000. View Article : Google Scholar : PubMed/NCBI
|
|
17
|
Yokoyama K, Kamata N, Hayashi E, Hoteiya
T, Ueda N, Fujimoto R and Nagayama M: Reverse correlation of
E-cadherin and snail expression in oral squamous cell carcinoma
cells in vitro. Oral Oncol. 37:65–71. 2001. View Article : Google Scholar : PubMed/NCBI
|
|
18
|
Poser I, Domínguez D, de Herreros A,
Varnai A, Buettner R and Bosserhoff A: Loss of E-cadherin
expression in melanoma cells involves up-regulation of the
transcriptional repressor Snail. J Biol Chem. 276:24661–24666.
2001. View Article : Google Scholar : PubMed/NCBI
|
|
19
|
Comijn J, Berx G, Vermassen P, Verschueren
K, van Grunsven L, Bruyneel E, Mareel M, Huylebroeck D and van Roy
F: The two-handed E box binding zinc finger protein SIP1
downregulates E-cadherin and induces invasion. Mol Cell.
7:1267–1278. 2001. View Article : Google Scholar : PubMed/NCBI
|
|
20
|
Cano A, Pérez-Moreno MA, Rodrigo I,
Locascio A, Blanco MJ, del Barrio MG, Portillo F and Nieto MA: The
transcription factor snail controls epithelial-mesenchymal
transitions by repressing E-cadherin expression. Nat Cell Biol.
2:76–83. 2000. View
Article : Google Scholar : PubMed/NCBI
|
|
21
|
Nieto MA: The snail superfamily of
zinc-finger transcription factors. Nat Rev Mol Cell Biol.
3:155–166. 2002. View
Article : Google Scholar : PubMed/NCBI
|
|
22
|
Yang J, Mani SA, Donaher JL, Ramaswamy S,
Itzykson RA, Come C, Savagner P, Gitelman I, Richardson A and
Weinberg RA: Twist, a master regulator of morphogenesis, plays an
essential role in tumor metastasis. Cell. 117:927–939. 2004.
View Article : Google Scholar : PubMed/NCBI
|
|
23
|
Thuault S, Valcourt U, Petersen M,
Manfioletti G, Heldin CH and Moustakas A: Transforming growth
factor-β employs HMGA2 to elicit epithelial-mesenchymal transition.
J Cell Biol. 174:175–183. 2006.
|
|
24
|
Gupta PB, Kuperwasser C, Brunet JP,
Ramaswamy S, Kuo WL, Gray JW, Naber SP and Weinberg RA: The
melanocyte differentiation program predisposes to metastasis after
neoplastic transformation. Nat Genet. 37:1047–1054. 2005.
View Article : Google Scholar : PubMed/NCBI
|
|
25
|
Hajra KM, Chen DY and Fearon ER: The SLUG
zinc-finger protein represses E-cadherin in breast cancer. Cancer
Res. 62:1613–1618. 2002.PubMed/NCBI
|
|
26
|
Lie-Venema H, Gittenberger-de Groot AC,
van Empel LJ, Boot MJ, Kerkdijk H, de Kant E and DeRuiter MC: Ets-1
and Ets-2 transcription factors are essential for normal coronary
and myocardial development in chicken embryos. Circ Res.
92:749–756. 2003. View Article : Google Scholar : PubMed/NCBI
|
|
27
|
Manoukian AS and Woodgett JR: Role of
glycogen synthase kinase-3 in cancer: regulation by Wnts and other
signaling pathways. Adv Cancer Res. 84:203–229. 2002. View Article : Google Scholar : PubMed/NCBI
|
|
28
|
Hardt SE and Sadoshima J: Glycogen
synthase kinase-3β: a novel regulator of cardiac hypertrophy and
development. Circ Res. 90:1055–1063. 2002.
|
|
29
|
Zhou BP, Deng J, Xia W, Xu J, Li YM,
Gunduz M and Hung MC: Dual regulation of Snail by GSK-3β-mediated
phosphorylation in control of epithelial-mesenchymal transition.
Nat Cell Biol. 6:931–940. 2004.PubMed/NCBI
|
|
30
|
Bachelder RE, Yoon SO, Franci C, de
Herreros AG and Mercurio AM: Glycogen synthase kinase-3 is an
endogenous inhibitor of Snail transcription: implications for the
epithelial-mesenchymal transition. J Cell Biol. 168:29–33. 2005.
View Article : Google Scholar
|
|
31
|
Conacci-Sorrell M, Simcha I, Ben-Yedidia
T, Blechman J, Savagner P and Ben-Ze’ev A: Autoregulation of
E-cadherin expression by cadherin-cadherin interactions: the roles
of β-catenin signaling, Slug, and MAPK. J Cell Biol. 163:847–857.
2003.PubMed/NCBI
|
|
32
|
Kim YJ, Yoon SY, Kim JT, Choi SC, Lim JS,
Kim JH, Song EY, Lee HG, Choi I and Kim JW: NDRG2 suppresses cell
proliferation through down-regulation of AP-1 activity in human
colon carcinoma cells. Int J Cancer. 124:7–15. 2009. View Article : Google Scholar : PubMed/NCBI
|
|
33
|
Park MY, Choi SC, Lee HS, Kim D, Baek KE,
Kim JT, Lim JS, Yeom YI, Chung JW, Kim JW, Myung PK, Lee HG, Kim JW
and Song EY: A quantitative analysis of N-myc downstream regulated
gene 2 (NDRG 2) in human tissues and cell lysates by reverse-phase
protein microarray. Clin Chim Acta. 387:84–89. 2008. View Article : Google Scholar : PubMed/NCBI
|
|
34
|
Bussemakers MJ, Giroldi LA, van Bokhoven A
and Schalken JA: Transcriptional regulation of the human E-cadherin
gene in human prostate cancer cell lines: characterization of the
human E-cadherin gene promoter. Biochem Biophys Res Commun.
203:1284–1290. 1994. View Article : Google Scholar : PubMed/NCBI
|
|
35
|
Chomczynski P and Sacchi N: Single-step
method of RNA isolation by acid guanidinium
thiocyanate-phenol-chloroform extraction. Anal Biochem.
162:156–159. 1987. View Article : Google Scholar : PubMed/NCBI
|
|
36
|
Yook JI, Li XY, Ota I, Fearon ER and Weiss
SJ: Wnt-dependent regulation of the E-cadherin repressor snail. J
Biol Chem. 280:11740–11748. 2005. View Article : Google Scholar : PubMed/NCBI
|
|
37
|
Doble BW and Woodgett JR: Role of glycogen
synthase kinase-3 in cell fate and epithelial-mesenchymal
transitions. Cells Tissues Organs. 185:73–84. 2007. View Article : Google Scholar : PubMed/NCBI
|
|
38
|
Zhou BP and Hung MC: Wnt, hedgehog and
snail: sister pathways that control by GSK-3beta and beta-Trcp in
the regulation of metastasis. Cell Cycle. 4:772–776. 2005.
View Article : Google Scholar : PubMed/NCBI
|
|
39
|
Ilyas M, Tomlinson IP, Rowan A, Pignatelli
M and Bodmer WF: β-catenin mutations in cell lines established from
human colorectal cancers. Proc Natl Acad Sci USA. 94:10330–10334.
1997.
|
|
40
|
Morin PJ, Sparks AB, Korinek V, Barker N,
Clevers H, Vogelstein B and Kinzler KW: Activation of β-catenin-Tcf
signaling in colon cancer by mutations in β-catenin or APC.
Science. 275:1787–1790. 1997.
|
|
41
|
Piepoli A, Cotugno R, Merla G, Gentile A,
Augello B, Quitadamo M, Merla A, Panza A, Carella M, Maglietta R,
D’Addabbo A, Ancona N, Fusilli S, Perri F and Andriulli A: Promoter
methylation correlates with reduced NDRG2 expression in
advanced colon tumour. BMC Med Genomics. 2:112009. View Article : Google Scholar
|