Introduction
Hepatocellular carcinoma (HCC) is the fifth most
common cancer worldwide and the third most common cause of death
from cancer. HCC results in more than 600,000 deaths each year
(1). Surgical intervention is the
main treatment for HCC. However, no more than 20% of patients with
HCC are indicated to undergo surgery procedures. In addition,
chemotherapy and radiotherapy have limited efficacy for the
majority of HCC patients at an advanced stage (2). Thus, it is of importance to seek
cancer-specific therapeutic targets and develop effective
alternative approaches to specifically treat HCC.
The complement system is a set of biochemical
pathways that removes pathogen components from an organism as part
of the innate and acquired immune systems. Activation of the
complement system triggers a wide range of cellular responses
ranging from apoptosis to opsonization (3). To prevent self damage of the
overactivation of the complement system, host cells express several
membrane complement regulatory proteins (mCRPs) that can inhibit
complement activation (4). The
group of mCRPs consists of CD35 [complement receptor 1 (CR1)], CD46
(membrane cofactor protein), CD55 (decay-accelerating factor) and
CD59 (protectin) (5).
As a member of the mCRPs, membrane cofactor protein
(MCP) CD46 acts as a cofactor for the cleavage of C3b and C4b by
the serum protease factor I (6).
Moreover, CD46 also acts as a costimulatory factor for T cells
along with CD3 and IL-2 in vitro which induces the
differentiation of CD4+ cells into T-regulatory cells
(7).
The liver is responsible for biosynthesis of
approximately 80–90% of plasma complement components and expresses
a variety of complement receptors. It has been widely recognized
that serum complement levels are different in patients with various
forms of malignancies including HCC (8). mCRPs provide protection against the
attack of the homologous complement, which is necessary for in
vivo hepatoma growth (9).
Recent evidence suggests that MCP expression in HCC
is significantly higher than that in both liver cirrhosis and
chronic hepatitis, which may cause HCC cells to escape from
tumor-specific complement-mediated cytotoxicity (10). In addition, CD46 expression was
found to be increased following addition of IL-1β and decreased
upon treatment with interferon-γ (11). Although the roles of CD46 in
complement activation have recently been postulated, their
pathophysiological contributions to HCC are still largely unknown.
Understanding the role of CD46 in HCC development is important for
the development of effective means of prevention and treatment of
this highly malignant form of cancer.
Recent studies have indicated that microRNAs
(miRNAs) play important roles in HCC development (12,13).
The expression of various miRNAs is deregulated in human HCC in
comparison with matched non-neoplastic tissue (14). In some cases, aberrantly expressed
miRNAs may be linked to cancer-associated pathways, indicating a
direct role in liver tumorigenesis.
Here, we confirmed that the levels of CD46
expression in HCC tissues were significantly higher than that in
the adjacent normal tissues. Then, we aimed to identify key miRNAs
involved in CD46-related pathways based on the expression patterns
in CD46-altered HepG2 cell lines. The present study represents a
basic model that offers insight into the effects of cellular miRNAs
and complement regulatory protein CD46 during HCC pathogenesis.
Materials and methods
Clinical specimens
Fresh HCC tissues and the adjacent normal tissues
for microarray analysis were obtained from 10 patients who
underwent surgical resection at the Navy General Hospital (Beijing,
China). Histodifferentiation grading of specimens was carried out
according to Edmondson-Steiner grading by experienced pathologists.
Surgical pathological staging was carried out according to the
modified UICC classification (15).
A summary of the detailed clinicopathological information for HCC
patients is shown in Table I.
Paraffin-embedded liver, breast, lung, kidney and colon cancer
tissues, and the adjacent normal tissues were also obtained from
the Navy General Hospital. Informed consent was obtained from all
of the patients or their relatives prior to analysis, and the
project was approved by the Institutional Ethics Committee of the
Navy General Hospital.
 | Table IClinicopathological features of the
hepatocellular carcinoma samples. |
Table I
Clinicopathological features of the
hepatocellular carcinoma samples.
| Clinicopathological
features | No. | Mean patient age
(years) |
|---|
| Hepatocellular
carcinoma | 10 | 56.6 |
| Adjacent normal
tissues | 10 | 56.6 |
| Histodifferentiation
grade |
| Well
differentiated | 2 | 58 |
| Moderately
differentiated | 6 | 56.3 |
| Poorly
differentiated | 2 | 56 |
| Surgical
pathological stage |
| I | 1 | 61 |
| II | 7 | 56.1 |
| III | 2 | 56 |
Cell culture
Human hepatoma cell line HepG2 was purchased from
the American Type Culture Collection (ATCC, Rockville, MD, USA) and
maintained in Dulbecco’s modified Eagle’s medium (DMEM; Gibco-BRL,
USA) supplemented with 10% fetal calf serum (HyClone, USA),
penicillin (107 U/l) and streptomycin (10 mg/l) at 37°C
in a 5% CO2 atmosphere.
Transient transfection of the CD46
expression plasmid
Construction of the CD46 expression plasmid and CD46
short interfering RNA (siRNA) was carried out. The cDNA fragment
encoding CD46 was purchased from the Proteintech Group, Inc.
(BC030594) and then cloned into the pcDNA3.1/myc-His C expression
vector (Invitrogen Life Technologies, USA) between the
HindIII and XhoI restriction sites. The cloned cDNA
was verified by sequencing.
HepG2 cells were plated at 3×10⁵/well in
6-well plates and incubated until they reached 95% confluency.
Cells were then transiently transfected with Lipofectamine 2000
(Invitrogen Life Technologies) according to the manufacturer’s
recommendations. Plasmid DNA (4.0 μg) and 10 μl of Lipofectamine
2000 were diluted separately in DMEM and incubated for 5 min. They
were then combined and incubated for 30 min at room temperature.
The complexes were added to each well and mixed gently, followed by
incubation at 37°C. Six hours later, the medium was replaced with
DMEM containing 10% fetal bovine serum. Cells were then incubated
for 48 and 72 h, respectively, for RNA isolation and protein
extraction.
siRNA transfection
CD46 siRNA and negative control siRNA were
synthesized using phosphorothioate chemistry by Biomics (Nantong,
China). HepG2 cells were plated at 1×10⁵/well in 6-well
plates and incubated until they reached 50% confluency. Cells were
transfected with CD46 siRNA or the negative control siRNA at a
final concentration of 50 nM with Lipofectamine 2000 according to
the manufacturer’s instructions. Six hours after initiation of
transfection, cells were starved in serum-free DMEM for another 6
h, followed by replacement with DMEM containing 10% fetal bovine
serum.
RNA isolation and quantitative reverse
transcription-PCR (qRT-PCR)
Total RNAs were isolated using the RNeasy Mini kit
(Qiagen, Valencia, CA, USA) from 4 independent biological
replicates according to the manufacturer’s instructions.
First-strand cDNA was reversely transcribed from 1 μg total RNA in
a final volume of 20 μl using RTase and random hexamers from the
ExScript™ Reagent kit (Takara Bio, Inc., Dalian, China) according
to the manufacturer’s instructions. Primers were designed mainly
using Primer Premier 5 software, and a database search using NCBI
BLAST program was performed to ensure specificity. The primer
sequences are listed in Table II.
PCR was performed with rTaq (Takara Bio, Inc.) in a gradient DNA
thermal cycler (Bio-Rad) according to a touchdown protocol as
follows: 1 cycle of 95°C for 3 min; 10 cycles of 94°C for 45 sec,
annealing for 45 sec (the annealing temperature was set to 5°C
above the expected annealing temperature with a decrease of 1°C for
every cycle), 72°C for 1 min; 25 additional cycles with the
expected annealing temperature; a final extension at 72°C for 10
min and holding at 4°C. The amount of cDNA used for each PCR
reaction was 20 ng in a 25 μl reaction volume. The PCR products (5
μl) were analyzed by electrophoresis on 2% agarose gels and
visualized by SYBR Gold (Molecular Probes, Eugene, OR, USA)
staining.
| Table IISequences of the forward and reverse
primers of complement regulatory genes. |
Table II
Sequences of the forward and reverse
primers of complement regulatory genes.
| Primer name | Sequence |
|---|
| CD35 | CD35-F |
TAGATGTGCTTGGGGAGAATGGGG |
| CD35-R |
AGACGAGGAACCAATGAGTCGG |
| C4BP | C4BP-F |
GAGTGCCGCTTGGGCCACTGTCCT |
| C4BP-R |
CAGAGGTTCTTACTCTCCTGAAAGGCAAG |
| CD55 | CD55-R |
CCTTATCACCATCAACACCCCTGG |
| CD55-F |
AGGCATTTTCATCTTTCCTTCGGG |
| CD46 | CD46-R |
CTAGGACCTGAGGCACTGGACG |
| CD46-F |
CCAAAGTGTCTTAAAGTGCTGCCTC |
| CD59 | CD59-F |
GAGCCCAGGGAGGGAAAGGTTC |
| CD59-R |
CGAGGTTAAGGCAAAACCCTACGG |
Western blot analysis
Western blot analysis was performed as described
previously (16). Briefly, 30 μg of
proteins was separated by 12% SDS-PAGE and transferred to PVDF
membranes (Millipore). After incubation in blocking buffer (1X TBS,
0.1% Tween-20 and 5% w/v dry nonfat milk) for 1 h at room
temperature, membranes were incubated with the antibodies. Then the
membrane was incubated with the secondary antibodies for 45 min at
room temperature. Reactive bands were detected using enhanced
chemiluminescence (Amersham Biosciences Corp., Piscataway, NJ,
USA).
miRNA microarray analysis
Human miRNA microarray was performed by Phalanx
Biotech (Hsinchu, Taiwan). The total RNA sample (2.5 μg) was size
fractionated using a 100K Nanosep (Pall Corporation, USA) and small
RNAs (<300 nt) were labeled with Cy5 NHS Ester fluorescence dye
(GE Amersham, USA) using miRNA ULS™ Labeling kit (Kreatech
Diagnostics, The Netherlands). Hybridization was executed overnight
at 37°C on a Human miRNA OneArray® v4.0 with Phalanx
hybridization buffer using OneArray® hybridization
chamber (17). On the chip, each
unique probe which was spotted in triplicate format, consisted of a
chemically modified nucleotide-coding segment complementary to
target miRNA (1,884 human miRNA entries, miRBase version 18.0;
http://microrna.sanger.ac.uk/sequences/) and a spacer
segment to extend the coding segment away from the substrate.
Hybridization melting temperatures were balanced by modifications
of the detection probes. Hybridization images were collected using
a laser scanner (GenePix 4000B) and digitized using GenePix 4.1
software (both from Molecular Devices, Sunnyvale, CA, USA).
Description of the in depth analysis
Multiple sample analysis included normalization,
data adjustment, t-test/ANOVA analysis and clustering.
Normalization was carried out by the 75% media scaling method by R
2.12.1. on the background-subtracted data. The normalization was
performed to remove system-related variations, such as sample
amount variations, different labeling dyes and signal gain
differences of scanners so that biological variations were
revealed. Data adjustment included data filtering, log2
transformation, gene centering and normalization. Data filtering
removed miRNAs which flags were −50 across all samples. The log2
transformation converted intensity values into log2 scale. Gene
centering and normalization transformed the log2 values using the
mean and the standard deviation of individual genes across all
samples using the following formula: Value = [(value) − mean
(gene)]/[(standard deviation (gene)]. The t-test was performed
between ‘control’ and ‘test’ sample groups with each group
containing at least 2 samples (18). T-values were calculated for each
miRNA, and p-values were computed from the theoretical
t-distribution. The hierarchical clustering was carried out by
Cluster 3.0 software with miRNA probes with a difference between
the maximum and minimum intensity values exceeding 100 among all
microarrays. The clustering plot was generated using TreeView
software from Stanford University.
Results
Expression of CD46 in the cancer and the
adjacent normal tissues
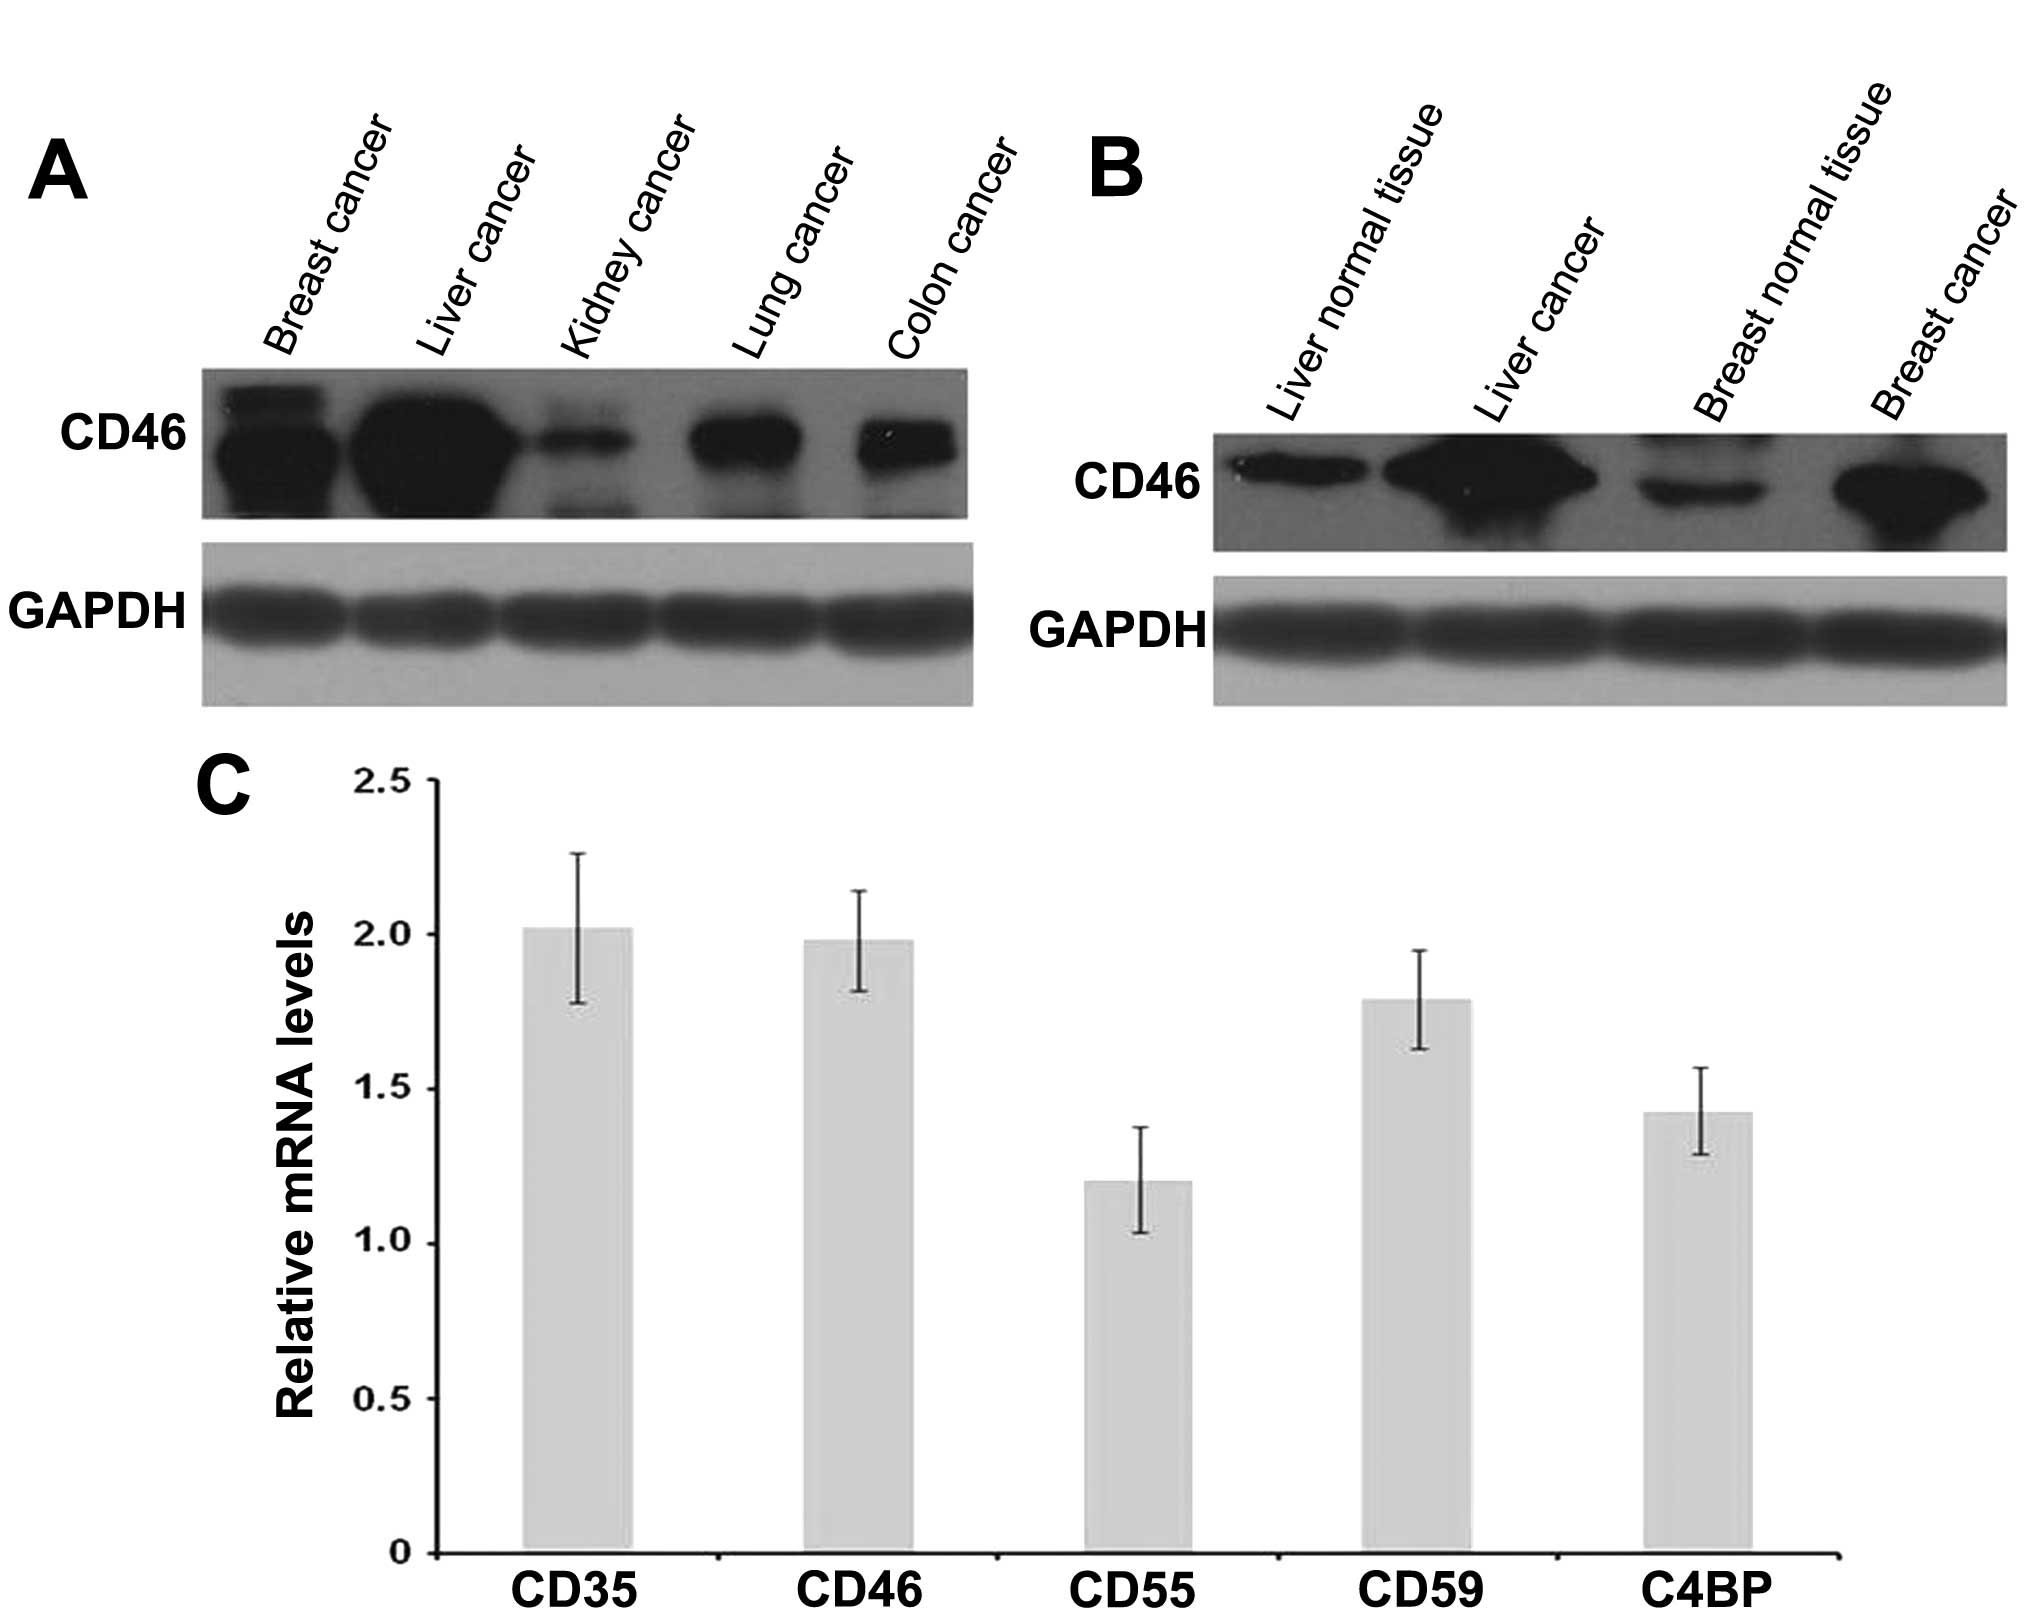
Western blotting revealed that CD46 was expressed in
liver, breast, lung, kidney and colon cancer as well as the
adjacent normal tissues (Fig. 1A).
The levels of CD46 expression in HCC tissues were significantly
higher than those in the other tumor tissues and the adjacent
normal tissues (Fig. 1B). mRNA
levels of CD35, CD46, CD55, CD59, C4BP were determined by
quantitative real-time RT-PCR (Fig.
1C).
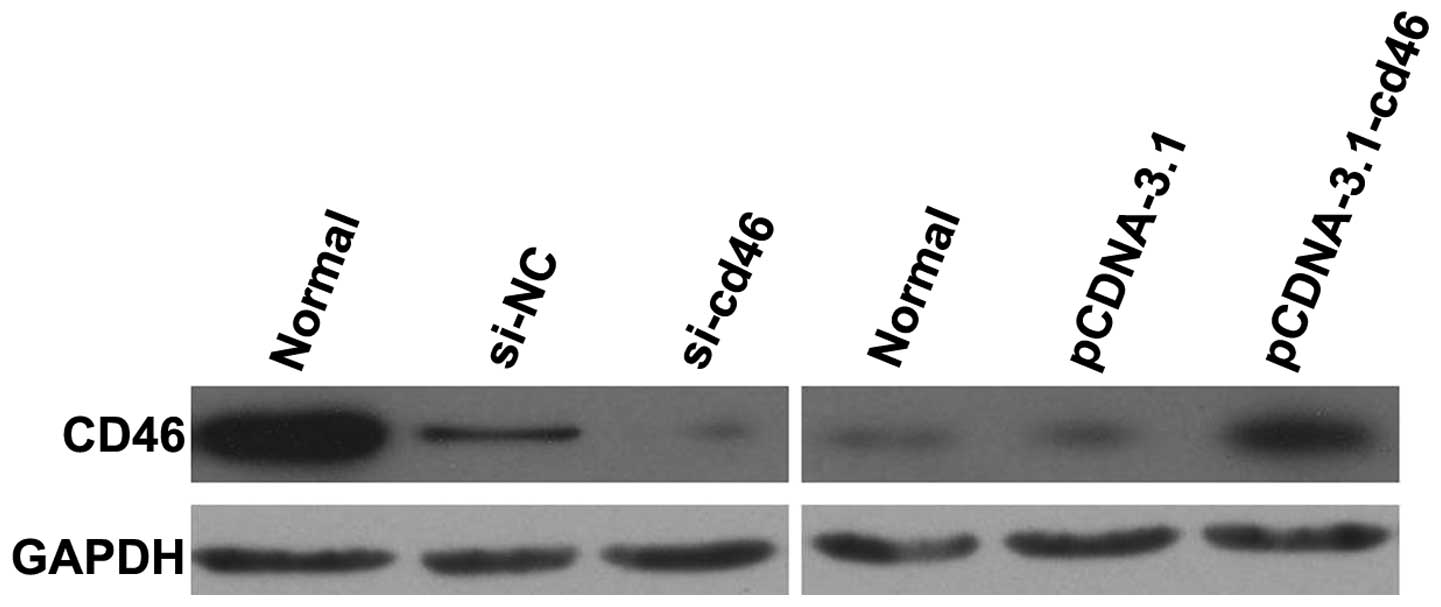
Expression of CD46 in pcDNA3.1-CD46 and
CD46 siRNA-transfected HepG2 cell lines
HepG2 cells were transfected with pcDNA3.1,
pcDNA3.1-CD46, CD46 siRNA or the negative control siRNA. The levels
of CD46 protein were then determined in each of the cell lines by
western blotting (Fig. 2). The
levels of CD46 expression were significantly higher in the
HepG2-pcDNA3.1-CD46 cells when compared to the levels of CD46
expression in the HepG2 and HepG2-pcDNA3.1 cells. In addition,
western blotting demonstrated that CD46 protein expression was
downregulated significantly at 48 h following CD46 siRNA
treatment.
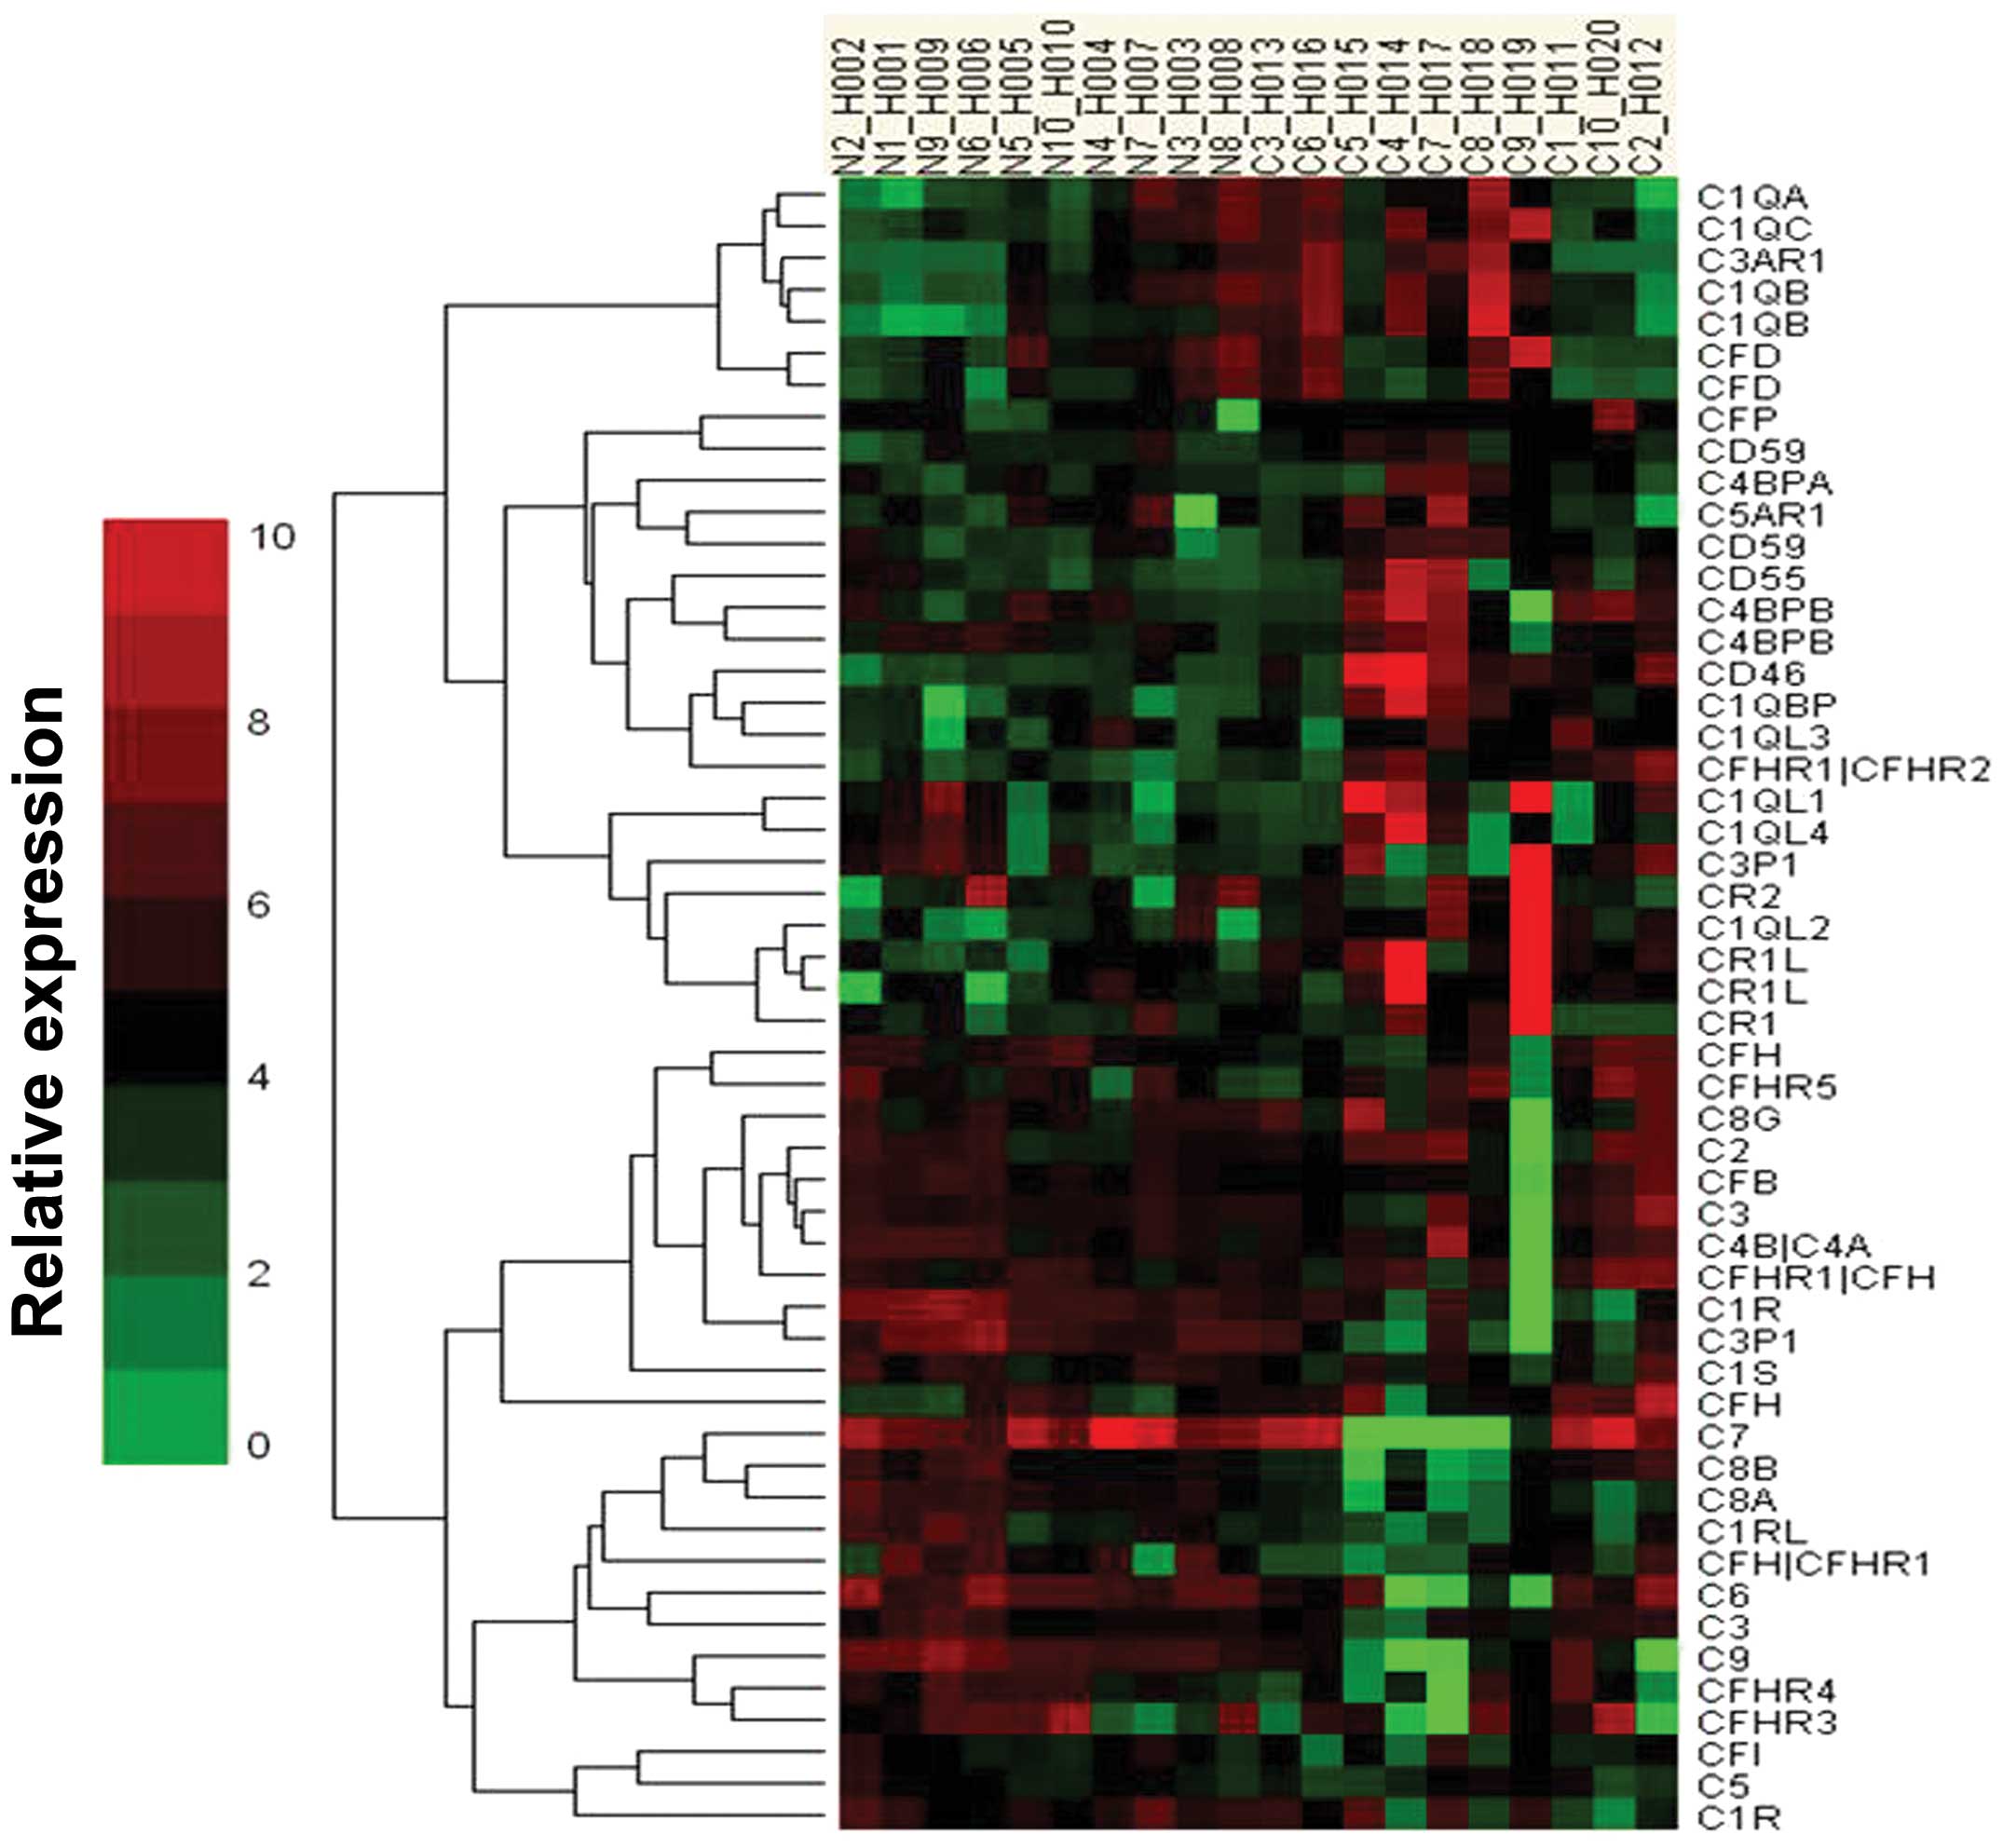
Microarray analysis of the
complement-related gene expression profile
We initially screened miRNA expression in HCC
tissues and the adjacent normal tissues from 10 patients, using a
microarray platform that covered a total of 875 human miRNAs
(Sanger miRBase release 13.0). Our analysis was limited to the set
of genes encoding complement-related proteins differentially
expressed between normal tissues and HCC tissues. Twenty-three
miRNAs exhibited a downregulated trend and 22 exhibited an
upregulating trend. Among these, CD46 was the most significantly
upregulated in the HCC tissues (Fig.
3).
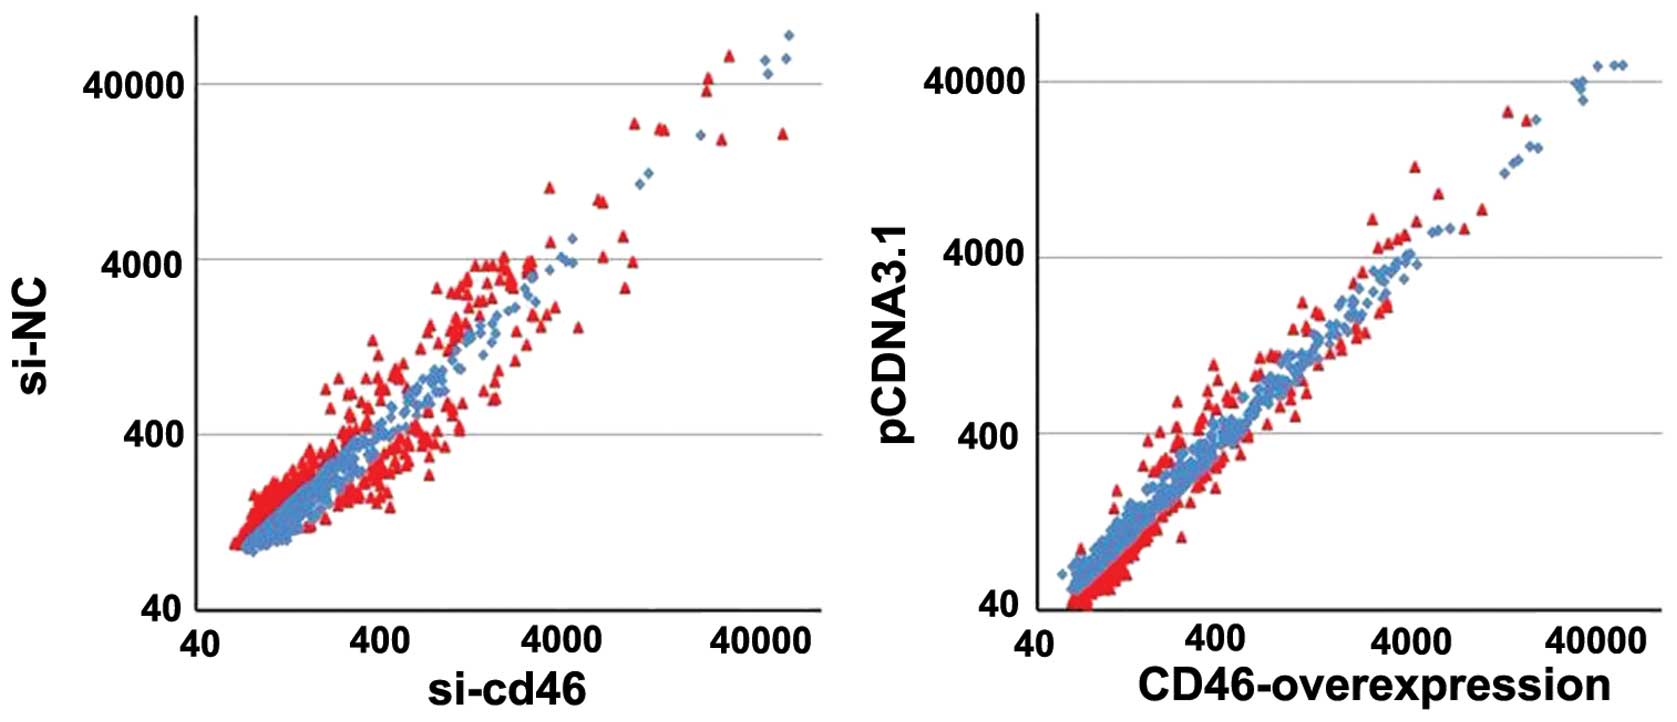
To explore the potential association between CD46
and miRNAs, we first performed miRNA expression profiling following
CD46 overexpression using the miRNA array. Our profiling analysis
revealed 293 miRNAs to be differentially expressed in HepG2 cells
transfected with si-CD46 and si-NC, while 82 miRNAs were
differentially expressed in HepG2 cells transfected with pcDNA3.1
and pcDNA3.1-CD46 (Fig. 4). Through
comparison of the miRNA levels in both groups, we found that 37
miRNAs were inverse expressed before and after CD46 expression
change (P<0.05; Table
III).
| Table IIImicroRNA array analysis reveals 37
miRNAs responsive to CD46 expression change in HepG2 cells
(P<0.01). |
Table III
microRNA array analysis reveals 37
miRNAs responsive to CD46 expression change in HepG2 cells
(P<0.01).
| Normalized
intensity | Log ratio | P-value |
|---|
|
|
|
|
|---|
| microRNA name | si-CD46 | si-NC | pcDNA3.1-CD46 | pcDNA3.1 |
pcDNA3.1-CD46/pcDNA3.1 | si-NC/si-CD46 |
pcDNA3.1-CD46/pcDNA3.1 | si-NC/si-CD46 |
|---|
| hsa-let-7b | 1,739.90 | 932.24 | 476.43 | 738.06 | −0.63 | −0.90 | 0.00178 | 0.00063 |
| hsa-miR-1281 | 1,866.42 | 4,151.44 | 2,411.89 | 1,513.13 | 0.67 | 1.15 | 0.00072 | 0.00001 |
| hsa-miR-129-3p | 384.62 | 850.57 | 707.68 | 460.06 | 0.62 | 1.14 | 0.00060 | 0.00015 |
| hsa-miR-1290 | 9,307.82 | 3,865.57 | 6,019.03 | 9,277.45 | −0.62 | −1.27 | 0.00024 | 0.00002 |
| hsa-miR-17-5p | 1,067.83 | 449.22 | 336.20 | 711.62 | −1.08 | −1.25 | 0.00001 | 0.00009 |
| hsa-miR-1825 | 1,996.99 | 3,048.80 | 2,162.06 | 1,417.19 | 0.61 | 0.61 | 0.00056 | 0.00010 |
| hsa-miR-30d | 489.89 | 257.70 | 229.39 | 618.70 | −1.43 | −0.93 | 0.00000 | 0.00067 |
|
hsa-miR-3156-3p | 96.16 | 153.50 | 124.45 | 80.83 | 0.62 | 0.67 | 0.00053 | 0.00047 |
| hsa-miR-3171 | 81.98 | 181.66 | 96.59 | 62.70 | 0.62 | 1.15 | 0.00069 | 0.00009 |
| hsa-miR-3175 | 8,277.44 | 5,401.94 | 4,485.72 | 13,183.03 | −1.56 | −0.62 | 0.00000 | 0.00002 |
|
hsa-miR-3177-5p | 105.26 | 191.52 | 121.66 | 64.97 | 0.91 | 0.86 | 0.00360 | 0.00009 |
| hsa-miR-320c | 985.84 | 559.06 | 645.46 | 1,098.40 | −0.77 | −0.82 | 0.00009 | 0.00026 |
| hsa-miR-320d | 678.15 | 388.67 | 361.27 | 995.66 | −1.46 | −0.80 | 0.00003 | 0.00094 |
|
hsa-miR-3616-3p | 97.17 | 161.95 | 96.59 | 62.70 | 0.62 | 0.74 | 0.00222 | 0.00082 |
|
hsa-miR-363* | 8,478.86 | 2,758.71 | 2,635.71 | 6,659.13 | −1.34 | −1.62 | 0.00122 | 0.00014 |
|
hsa-miR-3678-3p | 96.16 | 176.03 | 99.37 | 63.46 | 0.65 | 0.87 | 0.00560 | 0.00108 |
| hsa-miR-3692 | 105.26 | 160.54 | 99.37 | 64.21 | 0.63 | 0.61 | 0.00463 | 0.00075 |
| hsa-miR-377 | 98.18 | 173.21 | 87.30 | 56.66 | 0.62 | 0.82 | 0.00158 | 0.00157 |
| hsa-miR-3924 | 79.96 | 142.23 | 92.87 | 53.64 | 0.79 | 0.83 | 0.00608 | 0.00185 |
| hsa-miR-411 | 101.22 | 177.44 | 108.66 | 64.21 | 0.76 | 0.81 | 0.01089 | 0.00013 |
| hsa-miR-4429 | 540.49 | 312.63 | 338.05 | 595.28 | −0.82 | −0.79 | 0.00026 | 0.00001 |
| hsa-miR-4468 | 95.14 | 157.72 | 103.09 | 61.19 | 0.75 | 0.73 | 0.00476 | 0.00008 |
|
hsa-miR-4520a-3p | 111.34 | 194.33 | 133.74 | 83.85 | 0.67 | 0.80 | 0.00003 | 0.00061 |
| hsa-miR-4636 | 104.25 | 197.15 | 108.66 | 67.23 | 0.69 | 0.92 | 0.00187 | 0.00010 |
|
hsa-miR-4703-5p | 97.17 | 166.17 | 98.44 | 62.70 | 0.65 | 0.77 | 0.00069 | 0.00002 |
|
hsa-miR-4742-5p | 114.37 | 181.66 | 106.80 | 67.99 | 0.65 | 0.67 | 0.00114 | 0.00432 |
|
hsa-miR-4756-3p | 107.29 | 171.80 | 109.59 | 67.99 | 0.69 | 0.68 | 0.00001 | 0.00025 |
|
hsa-miR-4763-3p | 6,437.34 | 4,137.36 | 2,828.88 | 4,596.04 | −0.70 | −0.64 | 0.00392 | 0.00303 |
|
hsa-miR-4776-5p | 571.87 | 346.42 | 314.84 | 500.85 | −0.67 | −0.72 | 0.00047 | 0.00327 |
|
hsa-miR-4783-5p | 102.23 | 185.89 | 99.37 | 64.97 | 0.61 | 0.86 | 0.00871 | 0.00138 |
|
hsa-miR-4789-5p | 84.01 | 143.64 | 81.73 | 52.88 | 0.63 | 0.77 | 0.00028 | 0.00135 |
|
hsa-miR-4798-3p | 96.16 | 157.72 | 84.51 | 53.64 | 0.66 | 0.71 | 0.02291 | 0.00457 |
| hsa-miR-544b | 102.23 | 170.39 | 108.66 | 71.01 | 0.61 | 0.74 | 0.00530 | 0.00061 |
| hsa-miR-548s | 97.17 | 170.39 | 98.44 | 62.70 | 0.65 | 0.81 | 0.00022 | 0.00059 |
| hsa-miR-590-3p | 109.31 | 191.52 | 110.52 | 71.77 | 0.62 | 0.81 | 0.00134 | 0.00106 |
|
hsa-miR-664* | 566.81 | 284.46 | 158.81 | 370.92 | −1.22 | −0.99 | 0.00020 | 0.00029 |
| hsa-miR-93 | 791.51 | 356.28 | 304.62 | 468.37 | −0.62 | −1.15 | 0.00002 | 0.00046 |
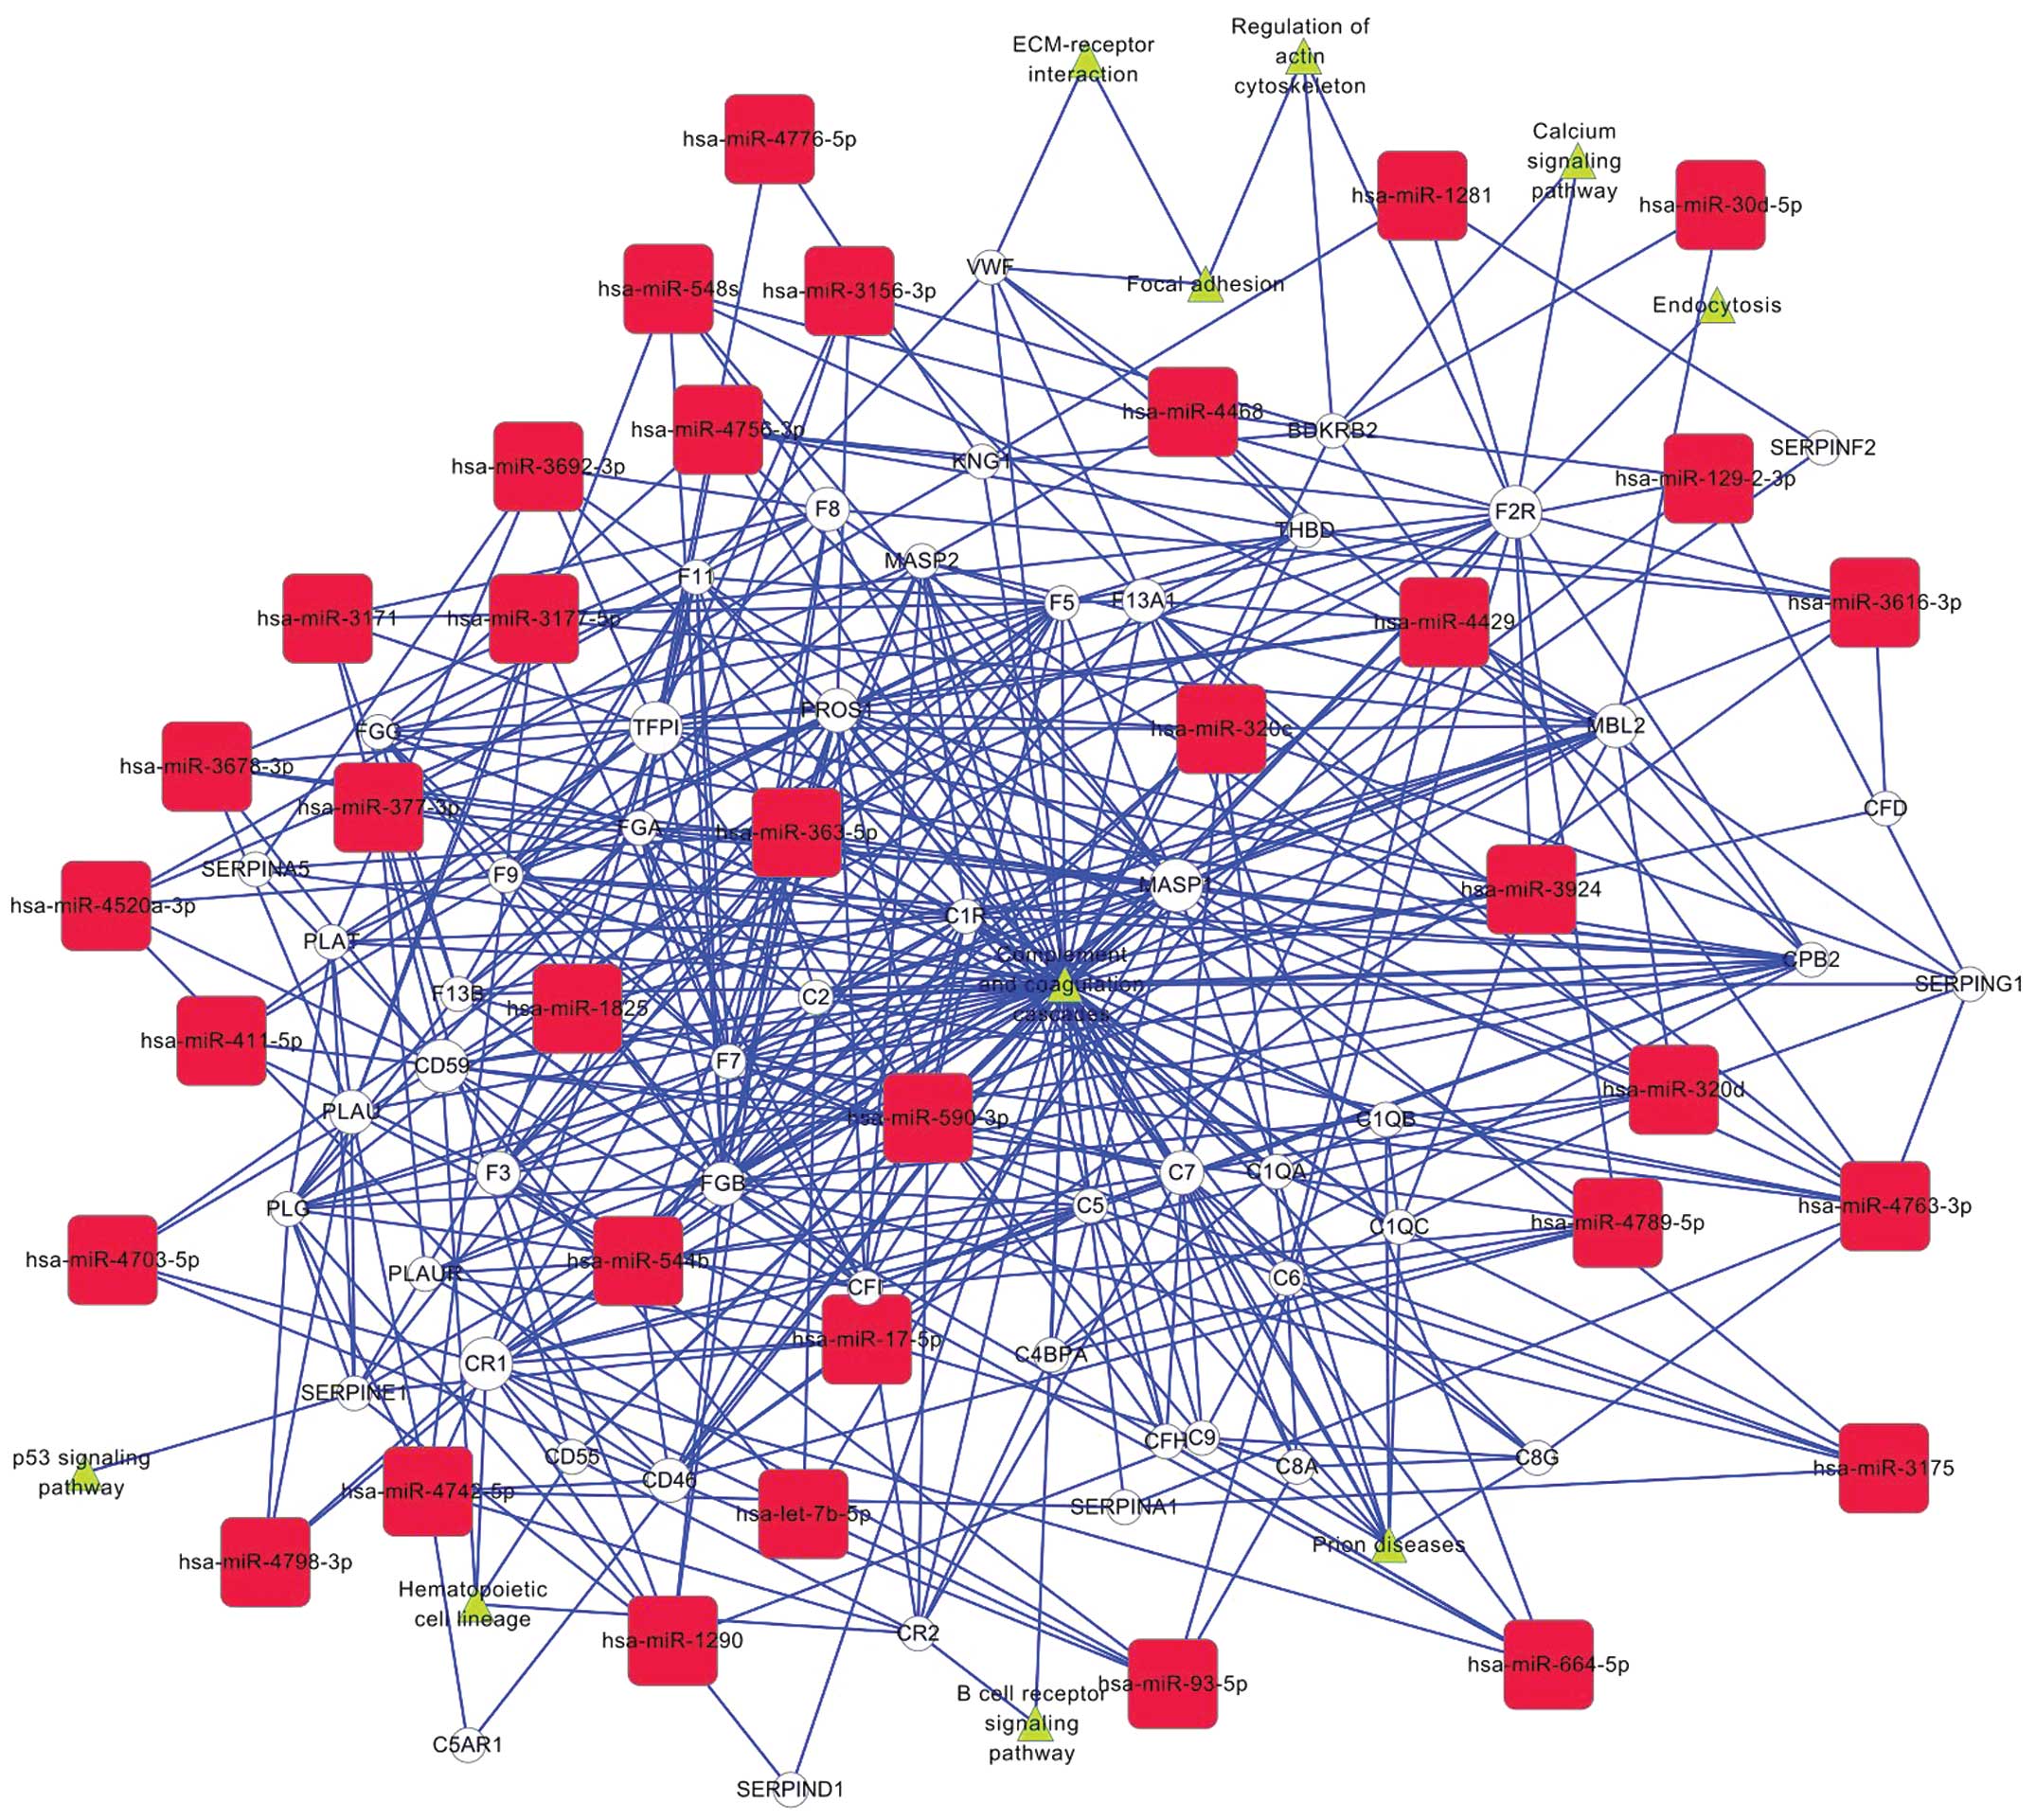
Bioinformatic analysis
To better understand how the functions of these
experimentally validated miRNAs and the complement-related genes
(Table III) are involved in the
neoplastic progression of HCC, we performed a gene interaction
network analysis (Fig. 5). The
CD46-related network of miRNA-mRNA interaction, representing the
critical miRNAs and their targets, was established according to the
miRNA degree. Our results revealed that miRNAs regulated by CD46
were hsa-let-7b, hsa-miR-17 and hsa-miR-590-3p. We confirmed the
result by the miRNA target prediction web tools of DIANA-microT
(version 3.0, www.microrna.gr/microT) and
TargetScan (release 6.2, http://www.targetscan.org/). In addition, let-7b,
miR-17-5p, miR-590-3p were also found to have direct or indirect
association with other members of the complement family, such as
CR1, CD55 and CD59.
Discussion
It is likely that the therapeutic potential of
monoclonal antibodies such as rituximab and trastuzumab, is largely
impaired by the mCRPs (19). It is
important to note that the number of reports demonstrating
increased expression of mCRPs in tumors relative to the
corresponding normal tissue is consistently increasing (20).
For example, the expression of CD46 in primary
cervix tissue was found to increase from normal to premalignant to
malignant (21). Here, we also
found that the levels of CD46 expression in HCC tissues were
significantly higher than those in other types of tumor tissues and
in the adjacent normal tissues. For cancer therapy, the aim should
be to identify a treatment that reduces mCRP expression.
However, due to the fact that even after the
blocking of mCRPs, some tumors still remain resistant to
complement-mediated lysis and that mCRP expression in vivo
in cancers is largely heterogeneous with specimens lacking or
having low mCRP expression, the expectations from mCRP-targeted
therapies are slightly low (22,23).
Why did this paradox occur? The reason for this may be that
previous studies only focused on the inhibitive effect of mCRP on
the complement-dependent cellular cytotoxicity (CDCC), but ignored
the role of mCRP in tumor occurrence and development. Thus, the
role of mCRP in tumor development must be exploited.
In contrast to CD55 and CD59, both CD35 and CD46 are
transmembrane proteins with a cytoplasmatic domain. CD46 is
implicated more in the control of the alternative complement
pathway than of the classical complement pathway (24). Studies have shown that expression of
CD46 was decreased in hepatoma cells upon treatment with
interferon-γ (11).
The efficacy of antisense technology to specifically
knockdown the expression of selected CRPs in tumors has been
demonstrated (25). Having
identified several miRNAs that may be of value for the
understanding of hepatoma development, here, we set out to compare
miRNA expression patterns in CD46-overexpressed and -silenced HepG2
cell lines by applying microarray and qPCR profiling techniques. In
the present study, we identified 37 miRNAs with significantly
differential expression levels before and after CD46 expression
change.
To link CD46-regulated miRNA profiling data with
biological consequences, we used a computational approach to
examine the possible pathways collectively regulated by the
downregulation or upregulation of miRNAs on the basis of their
predicted targets. In addition, inverse correlation of miRNA
expression with their tentative target genes is a useful approach
to reduce the generally extensive number of computationally
predicted target genes for further analysis. Here, network analysis
results revealed that CD46-regulated miRNAs included let-7b and
miR-17-5p.
Many studies have shown that miRNAs are implicated
in many types of cancers, and altered miRNA levels can result in
the aberrant expression of gene products that may contribute to
cancer biology (26). Moreover,
certain miRNAs have been classified as tumor-suppressors or
oncogenes (27). The let-7 miRNA is
conserved in invertebrates and vertebrates, and was originally
discovered in the nematode Caenorhabditis elegans, where it
regulates cell proliferation and differentiation (28). Increasing evidence has revealed that
let-7 is deregulated in various types of cancer cells, such as
colorectal, lung, colon, ovarian, breast and gastric cancer
(29). Recently, it has been
reported that members of the let-7 family are downregulated in HCC
carcinoma (30). Overexpression of
let-7 in liver cancer cell lines alters cell cycle progression and
reduces cell division, providing evidence that let-7 functions as a
tumor-suppressor in HCC.
Additionally, as a key oncogenic component of
miR-17-92, miR-17-5p was supposed to be regulated by CD46 in HepG2
cell lines. The association of miR-17-92 with a broad range of
cancers not only underlines the clinical significance of this locus
but also suggests that miR-17-92 may regulate fundamental
biological processes. miR-17-5p was found to be overexpressed in
HCC (31). Some targets of
miR-17-5p have been confirmed, such as E2F1, NCOA3 and HSP27
(32). Furthermore, recent research
has demonstrated that the level of miR-17-5p is associated with
development of HCC and can serve as a non-invasive biomarker for
the prognostic prediction of HCC patients (33,34).
In the present study, to identify clusters of miRNAs
and pathways directly or indirectly regulated by CD46, a microarray
and bioinformatic analysis approach was employed to compare the
proteome of HepG2 cells transfected with pcDNA3.1-CD46 and CD46
siRNA. To our knowledge, the present study was the first to take a
broad-based approach to identify the downstream effects of membrane
cofactor protein (MCP) CD46. The study provides functional data
linking CD46 to oncogenic characteristics of HCC. However, many
regulated spots remain unidentified in this complicated network.
Elucidation of all the physiological changes and the mechanisms
responsible for CRPs requires further research.
Acknowledgements
The present study was supported by the National
Natural Science Foundation of China (nos. 81102005, 81000723,
81070969 and 81171554). We thank Shaobin Zhang for expert advice on
data analysis, Lantu Gou for editing the manuscript and Liwei Jia
for photographic assistance.
References
|
1
|
Duffy A and Greten T: Developing better
treatments in hepatocellular carcinoma. Expert Rev Gastroenterol
Hepatol. 4:551–560. 2010. View Article : Google Scholar : PubMed/NCBI
|
|
2
|
Lo CM, Ngan H, Tso WK, et al: Randomized
controlled trial of transarterial lipiodol chemoembolization for
unresectable hepatocellular carcinoma. Hepatology. 35:1164–1171.
2002. View Article : Google Scholar : PubMed/NCBI
|
|
3
|
Holt DS, Botto M, Bygrave AE, Hanna SM,
Walport MJ and Morgan BP: Targeted deletion of the CD59 gene causes
spontaneous intravascular hemolysis and hemoglobinuria. Blood.
98:442–449. 2001. View Article : Google Scholar : PubMed/NCBI
|
|
4
|
Halperin JA, Taratuska A and
Nicholson-Weller A: Terminal complement complex C5b-9 stimulates
mitogenesis in 3T3 cells. J Clin Invest. 91:1974–1978. 1993.
View Article : Google Scholar : PubMed/NCBI
|
|
5
|
Hadders MA, Bubeck D, Roversi P, et al:
Assembly and regulation of the membrane attack complex based on
structures of C5b6 and sC5b9. Cell Rep. 1:200–207. 2012. View Article : Google Scholar : PubMed/NCBI
|
|
6
|
Brodbeck WG, Mold C, Atkinson JP and Medof
ME: Cooperation between decay-accelerating factor and in protecting
cells from autologous complement attack. J Immunol. 165:3999–4006.
2000. View Article : Google Scholar : PubMed/NCBI
|
|
7
|
Kemper C, Chan AC, Green JM, Brett KA,
Murphy KM and Atkinson JP: Activation of human CD4+cells
with CD3 and CD46 induces a T-regulatory cell 1 phenotype. Nature.
421:388–392. 2003.PubMed/NCBI
|
|
8
|
Matsumura N, Tagami H, Hotta T, Takemura
S, Yoshikawa T and Kondo M: Serum complement profile and its
clinical significance in patients with hepatocellular carcinoma and
liver cirrhosis. Nihon Shokakibyo Gakkai Zasshi. 78:1753–1759.
1981.(In Japanese).
|
|
9
|
Baranyi L, Baranji K, Takizawa H, Okada N
and Okada H: Cell-surface bound complement regulatory activity is
necessary for the in vivo survival of KDH-8 rat hepatoma.
Immunology. 82:522–528. 1994.PubMed/NCBI
|
|
10
|
Kinugasa N, Higashi T, Nouso K, et al:
Expression of membrane cofactor protein (MCP, CD46) in human liver
diseases. Br J Cancer. 80:1820–1825. 1999. View Article : Google Scholar : PubMed/NCBI
|
|
11
|
Spiller OB, Criado-García O, Rodríguez De
Córdoba S and Morgan BP: Cytokine-mediated up-regulation of CD55
and CD59 protects human hepatoma cells from complement attack. Clin
Exp Immunol. 121:234–241. 2000. View Article : Google Scholar : PubMed/NCBI
|
|
12
|
Law PT and Wong N: Emerging roles of
microRNA in the intracellular signaling networks of hepatocellular
carcinoma. J Gastroenterol Hepatol. 26:437–449. 2011. View Article : Google Scholar : PubMed/NCBI
|
|
13
|
Negrini M, Gramantieri L, Sabbioni S and
Croce CM: microRNA involvement in hepatocellular carcinoma.
Anticancer Agents Med Chem. 11:500–521. 2011. View Article : Google Scholar
|
|
14
|
Ladeiro Y, Couchy G, Balabaud C, et al:
MicroRNA profiling in hepatocellular tumors is associated with
clinical features and oncogene/tumor suppressor gene mutations.
Hepatology. 47:1955–1963. 2008. View Article : Google Scholar : PubMed/NCBI
|
|
15
|
Ariizumi S, Katagiri S, Katsuragawa H,
Kotera Y and Yamamoto M: Sectionectomy is suitable for patients
with T2 hepatocellular carcinoma according to the modified
International Union against Cancer TNM Classification. Dig Surg.
24:342–348. 2007. View Article : Google Scholar
|
|
16
|
Lu ZJ, Liu SY, Yao YQ, et al: The effect
of miR-7 on behavior and global protein expression in glioma cell
lines. Electrophoresis. 32:3612–3620. 2011. View Article : Google Scholar : PubMed/NCBI
|
|
17
|
Gao X, Gulari E and Zhou X: In situ
synthesis of oligonucleotide microarrays. Biopolymers. 73:579–596.
2004. View Article : Google Scholar : PubMed/NCBI
|
|
18
|
Pan W: A comparative review of statistical
methods for discovering differentially expressed genes in
replicated microarray experiments. Bioinformatics. 18:546–554.
2002. View Article : Google Scholar
|
|
19
|
Treon SP, Mitsiades C, Mitsiades N, et al:
Tumor cell expression of CD59 is associated with resistance to CD20
serotherapy in patients with B-cell malignancies. J Immunother.
24:263–271. 2001. View Article : Google Scholar
|
|
20
|
Nakagawa M, Mizuno M, Kawada M, et al:
Polymorphic expression of decay-accelerating factor in human
colorectal cancer. J Gastroenterol Hepatol. 16:184–189. 2001.
View Article : Google Scholar : PubMed/NCBI
|
|
21
|
Simpson KL, Jones A, Norman S and Holmes
CH: Expression of the complement regulatory proteins decay
accelerating factor (DAF, CD55), membrane cofactor protein (MCP,
CD46) and CD59 in the normal human uterine cervix and in
premalignant and malignant cervical disease. Am J Pathol.
151:1455–1467. 1997.
|
|
22
|
Junnikkala S, Jokiranta TS, Friese MA,
Jarva H, Zipfel PF and Meri S: Exceptional resistance of human H2
glioblastoma cells to complement-mediated killing by expression and
utilization of factor H and factor H-like protein 1. J Immunol.
164:6075–6081. 2000. View Article : Google Scholar : PubMed/NCBI
|
|
23
|
Weichenthal M, Siemann U, Neuber K and
Breitbart EW: Expression of complement regulatory proteins in
primary and metastatic malignant melanoma. J Cutan Pathol.
26:217–221. 1999. View Article : Google Scholar : PubMed/NCBI
|
|
24
|
Kojima A, Iwata K, Seya T, et al: Membrane
cofactor protein (CD46) protects cells predominantly from
alternative complement pathway-mediated C3-fragment deposition and
cytolysis. J Immunol. 151:1519–1527. 1993.
|
|
25
|
Zell S, Geis N, Rutz R, Schultz S, Giese T
and Kirschfink M: Down-regulation of CD55 and CD46 expression by
anti-sense phosphorothioate oligonucleotides (S-ODNs) sensitizes
tumour cells to complement attack. Clin Exp Immunol. 150:576–584.
2007. View Article : Google Scholar : PubMed/NCBI
|
|
26
|
Janssen EA, Slewa A, Gudlaugsson E, et al:
Biologic profiling of lymph node negative breast cancers by means
of microRNA expression. Mod Pathol. 23:1567–1576. 2010. View Article : Google Scholar : PubMed/NCBI
|
|
27
|
Herranz H and Cohen SM: MicroRNAs and gene
regulatory networks: managing the impact of noise in biological
systems. Genes Dev. 24:1339–1344. 2010. View Article : Google Scholar : PubMed/NCBI
|
|
28
|
Reinhart BJ, Slack FJ, Basson M, et al:
The 21-nucleotide let-7 RNA regulates developmental timing in
Caenorhabditis elegans. Nature. 403:901–906. 2000.
View Article : Google Scholar : PubMed/NCBI
|
|
29
|
Sempere LF, Christensen M, Silahtaroglu A,
et al: Altered microRNA expression confined to specific epithelial
cell subpopulations in breast cancer. Cancer Res. 67:11612–11620.
2007. View Article : Google Scholar : PubMed/NCBI
|
|
30
|
Lan FF, Wang H, Chen YC, et al:
Hsa-let-7g inhibits proliferation of hepatocellular
carcinoma cells by downregulation of c-Myc and upregulation
of p16INK4A. Int J Cancer. 128:319–331. 2011.
View Article : Google Scholar
|
|
31
|
Connolly E, Melegari M, Landgraf P, et al:
Elevated expression of the miR-17-92 polycistron and miR-21 in
hepadnavirus-associated hepatocellular carcinoma contributes to the
malignant phenotype. Am J Pathol. 173:856–864. 2008. View Article : Google Scholar
|
|
32
|
Yang F, Yin Y, Wang F, et al: miR-17-5p
promotes migration of human hepatocellular carcinoma cells through
the p38 mitogen-activated protein kinase-heat shock protein 27
pathway. Hepatology. 51:1614–1623. 2010. View Article : Google Scholar : PubMed/NCBI
|
|
33
|
Zheng J, Dong P, Gao S, Wang N and Yu F:
High expression of serum miR-17-5p associated with poor prognosis
in patients with hepatocellular carcinoma. Hepatogastroenterology.
60:549–552. 2012.PubMed/NCBI
|
|
34
|
Chen L, Jiang M, Yuan W and Tang H:
miR-17-5p as a novel prognostic marker for hepatocellular
carcinoma. J Invest Surg. 25:156–161. 2012. View Article : Google Scholar : PubMed/NCBI
|