Introduction
Hepatocellular carcinoma (HCC) is the most common
primary cancer of the liver and the third most frequent cause of
cancer-related mortality in the world, with more than 660,000
deaths per annum (1–5). The major etiologic factors of HCC are
hepatitis B virus (HBV) and hepatitis C virus (HCV)infection and
various other non-viral-related causes of liver cirrhosis (6). Over the past few decades, the
incidence of HCC has increased in eastern Asia and sub-Saharan
Africa (7,8). Surgery currently offers the only
possibility of prolonged survival in HCC patients. However,
recurrence occurs in more than two-thirds of these patients despite
initial curative intent, and, thus, HCC has a dismal prognosis
(9,10). Therefore, it is vital to identify
new clues to understand the pathogenesis of HCC and to explore
effective therapeutic strategies.
The latexin gene mapped to chromosome 3q25.32 was
originally identified in the lateral neocortex of rats and serves
as a marker of regionality and development in the rodent nervous
system (11). The human latexin
gene encodes the latexin protein comprised of 222 amino acids with
84.2% identical to rat and 84.7% identical to mouse latexin
proteins (12). It consists of two
topologically equivalent subdomains, each one with a cystatin-like
topology, consisting of an α-helix enveloped by a curved β-sheet.
These subdomains are packed against each other through the helices
and linked by a connecting segment encompassing a third α-helix
(13,14). Latexin has been reported to act as
an endogenous vertebrate carboxypeptidase inhibitor (CPI). However,
its sequence is unrelated to any other reported CPIs, but shows
significant homology with the putative tumor suppressor,
tazarotene-induced gene 1 (TIG1), suggesting a familial
relationship (13,15). Liang et al revealed that
latexin functions in the negative control of hematopoietic stem
cell (HSC) populations in mice by decreasing cell replication and
increasing apoptosis (16).
Latexin-deficient HSCs have been shown to possess an enhanced
colony-forming ability (17).
Elevated latexin expression has also been reported in normal human
stem cells compared to the same cell populations from patients with
acute myelogenous leukemia (AML) or lymphoma. The ectopic
expression of latexin in mouse lymphoma cells lacking latexin
expression shows marked suppression of growth in vitro
(18). A study by Ke et al
identified high levels of latexin expression in an immortalized
human gastric epithelial cell line, GES-1, as compared to
expression in the MC cell line, which is the malignant derivative
of the GES-1 cell line (19).
The cell cycle progression pathways are the endpoint
of signaling cascades implicated in cell growth and cell
proliferation. The cell cycle is tightly coordinated by sequential
assembly and activation of phase-specific protein kinase complexes
(20,21) formed by cyclins and cyclin-dependent
kinases (CDKs), which are also regulated by the INK4 proteins and
the CDK inhibitors (CDKIs). D-type cyclins are expressed throughout
the cycle in response to mitogen stimulation (21). Cyclin D-CDK4 and cyclin E-CDK2
complexes are required for the passage from G1 to S phase. The
levels of CDKI are high in quiescent cells, fall in response to
mitogenic stimulation, remain at threshold levels in proliferating
cells and increase again when mitogens are withdrawn (21).
In the present study, we found that latexin was
markedly downregulated in HCC specimens, compared to adjacent
non-cancerous tissues. This indicated that latexin may contribute
to the inhibition of cellular proliferation in HCC. The experiments
showed that overexpression of latexin inhibited HCC-derived
SK-hep-1 and HepG2 cellular proliferation in vitro and
vivo. In contrast, latexin knockdown via shRNA markedly
promoted these phenotypes in YY-8103 and Focus cells. Furthermore,
the mechanistic analyses indicated that latexin influenced cell
cycle transition by modulating the quantities of cell cycle
regulators.
Materials and methods
Tissue specimens
To examine the expression of latexin in human tumor
tissues, a total of 60 paired HCC and adjacent non-tumor tissues
were used in the present study. Adjacent non-tumor tissues were
removed 2 cm away from the edge of the primary tumors. Both HCC
specimens and adjacent non-tumor tissues were confirmed by
pathological examination and immediately stored in liquid nitrogen
after surgery. The study protocols for the investigations involving
human tissue, or animals, were approved by the Institutional Animal
Care and Use Committee at Nanjing Medical University.
Liver cancer cell lines
The human HCC cell lines (YY-8103, Focus, LM3, LM6,
HepG2, Hep3B, SK-hep-1, Huh-7, MHCC-97H, MHCC-97L, SMCC-7721) were
obtained from the Department of Liver Transplantation Center, The
First Affiliated Hospital of Nanjing Medical University. These cell
lines were propagated in a 5% CO2, 37°C-humidified
incubator and cultured in Dulbecco’s modified Eagle’s medium (DMEM)
containing 10% fetal bovine serum (FBS), penicillin (50 U/ml) and
streptomycin (50 μg/ml).
Semi-quantitative RT-PCR and quantitative
real-time PCR (qRT-PCR)
Total RNA from tissue samples and cultured cells was
extracted using TRIzol reagent (Invitrogen) and then reverse
transcribed into cDNA using the PrimeScript RT reagent kit
(Takara). qRT-PCR assays were carried out to detect mRNA expression
using SYBR Premix Ex Taq (Takara) according to the manufacturer’s
instructions. The latexin primers used in qRT-PCR were: forward
primer, 5′-CCTGGGTTGCCTGTGGTTAT-3′ and reverse primer,
5′-CTTCCTTTGGCAGACGGCTA-3′. β-actin was used as an internal control
and amplified with forward primer, 5′-AGAGCCTCGCCTTTGCCGATCC-3′ and
reverse primer, 5′-CTGGGCCTCGTCGCCCACATA-3′.
Immunohistochemical staining
All tissues were paraffin-embedded and were obtained
from the Department of Pathology, The First Affiliated Hospital of
Nanjing Medical University. The paraffin-embedded tissues were cut
into 4-μm sections and then incubated with rabbit anti-latexin
polyclonal antibody (1:200; Abcam) at 4°C overnight, SP-9000
Histostain™-Plus kits (ZSGB-BIO) were used according to the
manufacturer’s protocol. Scoring was measured by the cell cytoplasm
staining pattern: score of 0, absent cell cytoplasm staining; score
of 1, weak cell cytoplasm staining; score of 2, moderate cell
cytoplasm staining; and score of 3, strong cell cytoplasm
staining.
shRNA preparation
Two siRNAs against latexin were designed according
to the web of Invitrogen Co. and chemically synthesized by Shanghai
GenePharma Co. (Shanghai, China). The sequence of siRNA-424 was:
GCACAGCUGAA GUACUUUAdTdT (sense) and UAAAGUACUUCAGCUGU GCdTdT
(antisense). The sequence of siRNA-444 was: CCU
UCAACGGGACAAGAAAdTdT (sense) and UUUCUUGU CCCGUUGAAGGdTdT
(antisense). Negative control (NC) siRNA synthesized by Shanghai
GenePharma Co. was used as a control. The sequence of si-NC was:
UUCUCCG AACGUGUCACGUTT (sense) and ACGUGACCGUUCGG AGAATT
(antisense).
shRNA duplexes against latexin were designed
according to the web of Invitrogen Co. and synthesized by
GenePharma Co. The sequences were incorporated into the vector
p-SUPER to generate p-SUPER-shRNA-latexin (GenePharma Co.). The
sequence of shRNA-424 was as follows: GATCCCCGCACA
GCTGAAGTACTTTATTCAAGAGATAAAGTACTTCAG CTGTGCTTTTTGGAAA (sense) and
AGCTTTTCCAAAA AGCACAGCTGAAGTACTTTATCTCTTGAATAAAGTA CTTCAGCTGTGCGGG
(antisense). The sequence of shRNA-444 was as follows:
GATCCCCCCTTCAACGGGA CAAGAAATTCAAGAGATTTCTTGTCCCGTTGAAGGT TTTTGGAAA
(sense) and AGCTTTTCCAAAAACCTTCA
ACGGGACAAGAAATCTCTTGAATTTCTTGTCCCGTT GAAGGGGG (antisense). The
sequence of sh-NC was as follows: GATCCCCTTCTCCGAACGTGTCACGTTTCAA
GAGAACGTGACACGTTCGGAGAATTTTTGGAAA (sense) and
AGCTTTTCCAAAAATTCTCCGAACGTGTCACGTT CTCTTGAAACGTGACACGTTCGGAGAAGGG
(antisense). The constructs were verified by sequencing.
Construction of latexin expression
vector
The latexin open reading frame (ORF) was amplified
from the human liver cDNA library (Genbank: NM_020169.3) using
PrimeStar PCR and constructed into the expression vector pcDNA3.1B
to generate pcDNA3.1B-latexin. The sequence of the forward primer
was: 5′-EcoRI-AGAGAATTCATGGAAATC CCGCCGACCAAC-3′ and reverse
primer, 5′-BamHI-AGAG GATCCTTATTCCAGTTGTACTTCCTTTGGC-3′. The
construct was verified by sequencing.
Cell transfection
Both the shRNA and latexin expression vector were
transfected using Lipofectamine® 2000 (Invitrogen)
according to the manufacturer’s instructions.
Cell proliferation assay
Cells were seeded at a density of 2,000–5,000
cells/well in 100 μl complete medium in 96-well plates. The Cell
Counting Kit-8 (CCK-8; Dojindo Laboratories) was used to measure
cell viability according to the manufacturer’s instructions. Each
experiment was repeated at least 3 times.
Colony formation assay
To examine the effect of upregulated or
downregulated latexin expression on proliferation of HCC cell
lines, cells transfected with different plasmids were used for the
colony formation assay. Each type of cell was seeded into 10 cm
plates (50,000 cells/well) and cultured for 3 weeks in medium
containing 1,000 μg/ml G418. These cultures were stained with 0.4%
crystal violet. Clones >2 mm were counted and the number of
clones per well was averaged from 3 wells for each experiment. Each
experiment was repeated at least 3 times.
Soft agar colony formation assay
Cells transfected with different plasmids were
suspended in 0.5 ml 1% low melting point agarose with complete
culture medium, and then layered on top of 0.5 ml 2% low melting
agarose in 24-well plates. Cell numbers varied from 2,000–5,000 for
different cell lines. The plates were incubated in a 5%
CO2, 37°C-humidified incubator for 2 weeks. Colonies in
at least 6 random microscopic fields were counted and photographed.
All experiments were repeated 3 times.
Flow cytometric analysis of cell
cycle
For the cell cycle assay, cells were trypsinized and
rinsed twice with ice-cold PBS solution, then added to 75% ice-cold
ethanol while vortexing, followed by incubation on ice for 60 min.
The fixed cells were washed with ice-cold PBS and incubated at 37°C
for 30 min in 0.5 ml PBS solution containing 20 mg/ml RNase A, 0.2%
Triton X-100, 0.2 mM EDTA and 20 mg/ml of propidium iodide. The
percentage of cells in G0/G1, S and G2/M phases was determined
using the Beckman Gallios Flow Cytometer (Beckman Coulter).
Tumorigenicity assay in nude mice
Male BALB/c nude mice (3–4 weeks old) were purchased
from the Department of Laboratory Animal Center, Nanjing Medical
University. Cells with differential latexin expression were
injected subcutaneously into the lateral root of the anterior limb
of nude mice (500×106 cells/mouse, 7 mice in each
experimental group). Tumor size was measured every third day after
injection. Three weeks after injection, the mice were sacrificed
and photographed. Tumor weight was then calculated.
Western blot analysis
Cell lysates were prepared using cold lysis buffer
containing 25 mmol/l Tris-Cl (pH 7.5), 5 mmol/l EDTA, 1% SDS and
protease inhibitor cocktail (Sigma). After boiling for 5 min,
samples were subjected to electrophoresis in 10% SDS-PAGE and
transferred onto a polyvinylidene difluoride (PVDF) membrane and
blocked for 1 h at room temperature with 5% blocking buffer. The
membranes were washed 3 times with 0.1% Tris-buffered saline with
Tween-20 (TBST) and incubated with the primary antibody overnight
at 4°C. The membranes were washed again and then incubated with the
secondary antibody at room temperature for 1 h. Primary antibodies
used in the present study included: rabbit anti-latexin polyclonal
antibody (1:500), rabbit anti-p21Cip1 polyclonal antibody
(1:1,000), rabbit anti-p27Kip1 polyclonal antibody (1:1,000),
rabbit anti-p15INK4B polyclonal antibody (1:1,000), rabbit
anti-cyclin D1 polyclonal antibody (1:1,000), rabbit anti-cyclin E
polyclonal antibody (1:200) and rabbit anti-β-actin polyclonal
antibody (1:1,000) (all from Abcam). Proteins were detected using
an ECL western blotting detection system (Pierce) by enhanced
chemiluminescence.
Statistical analysis
Statistical analysis was performed using SPSS 18.0
and Graphpad Prism 5.0 software. Quantitative data were recorded as
means ± SD. Differences between 2 groups were assessed by Student’s
t-test (two-tailed). P<0.05 was considered to indicate a
statistically significant difference.
Results
Latexin expression is decreased in HCC
and HCC-derived cell lines
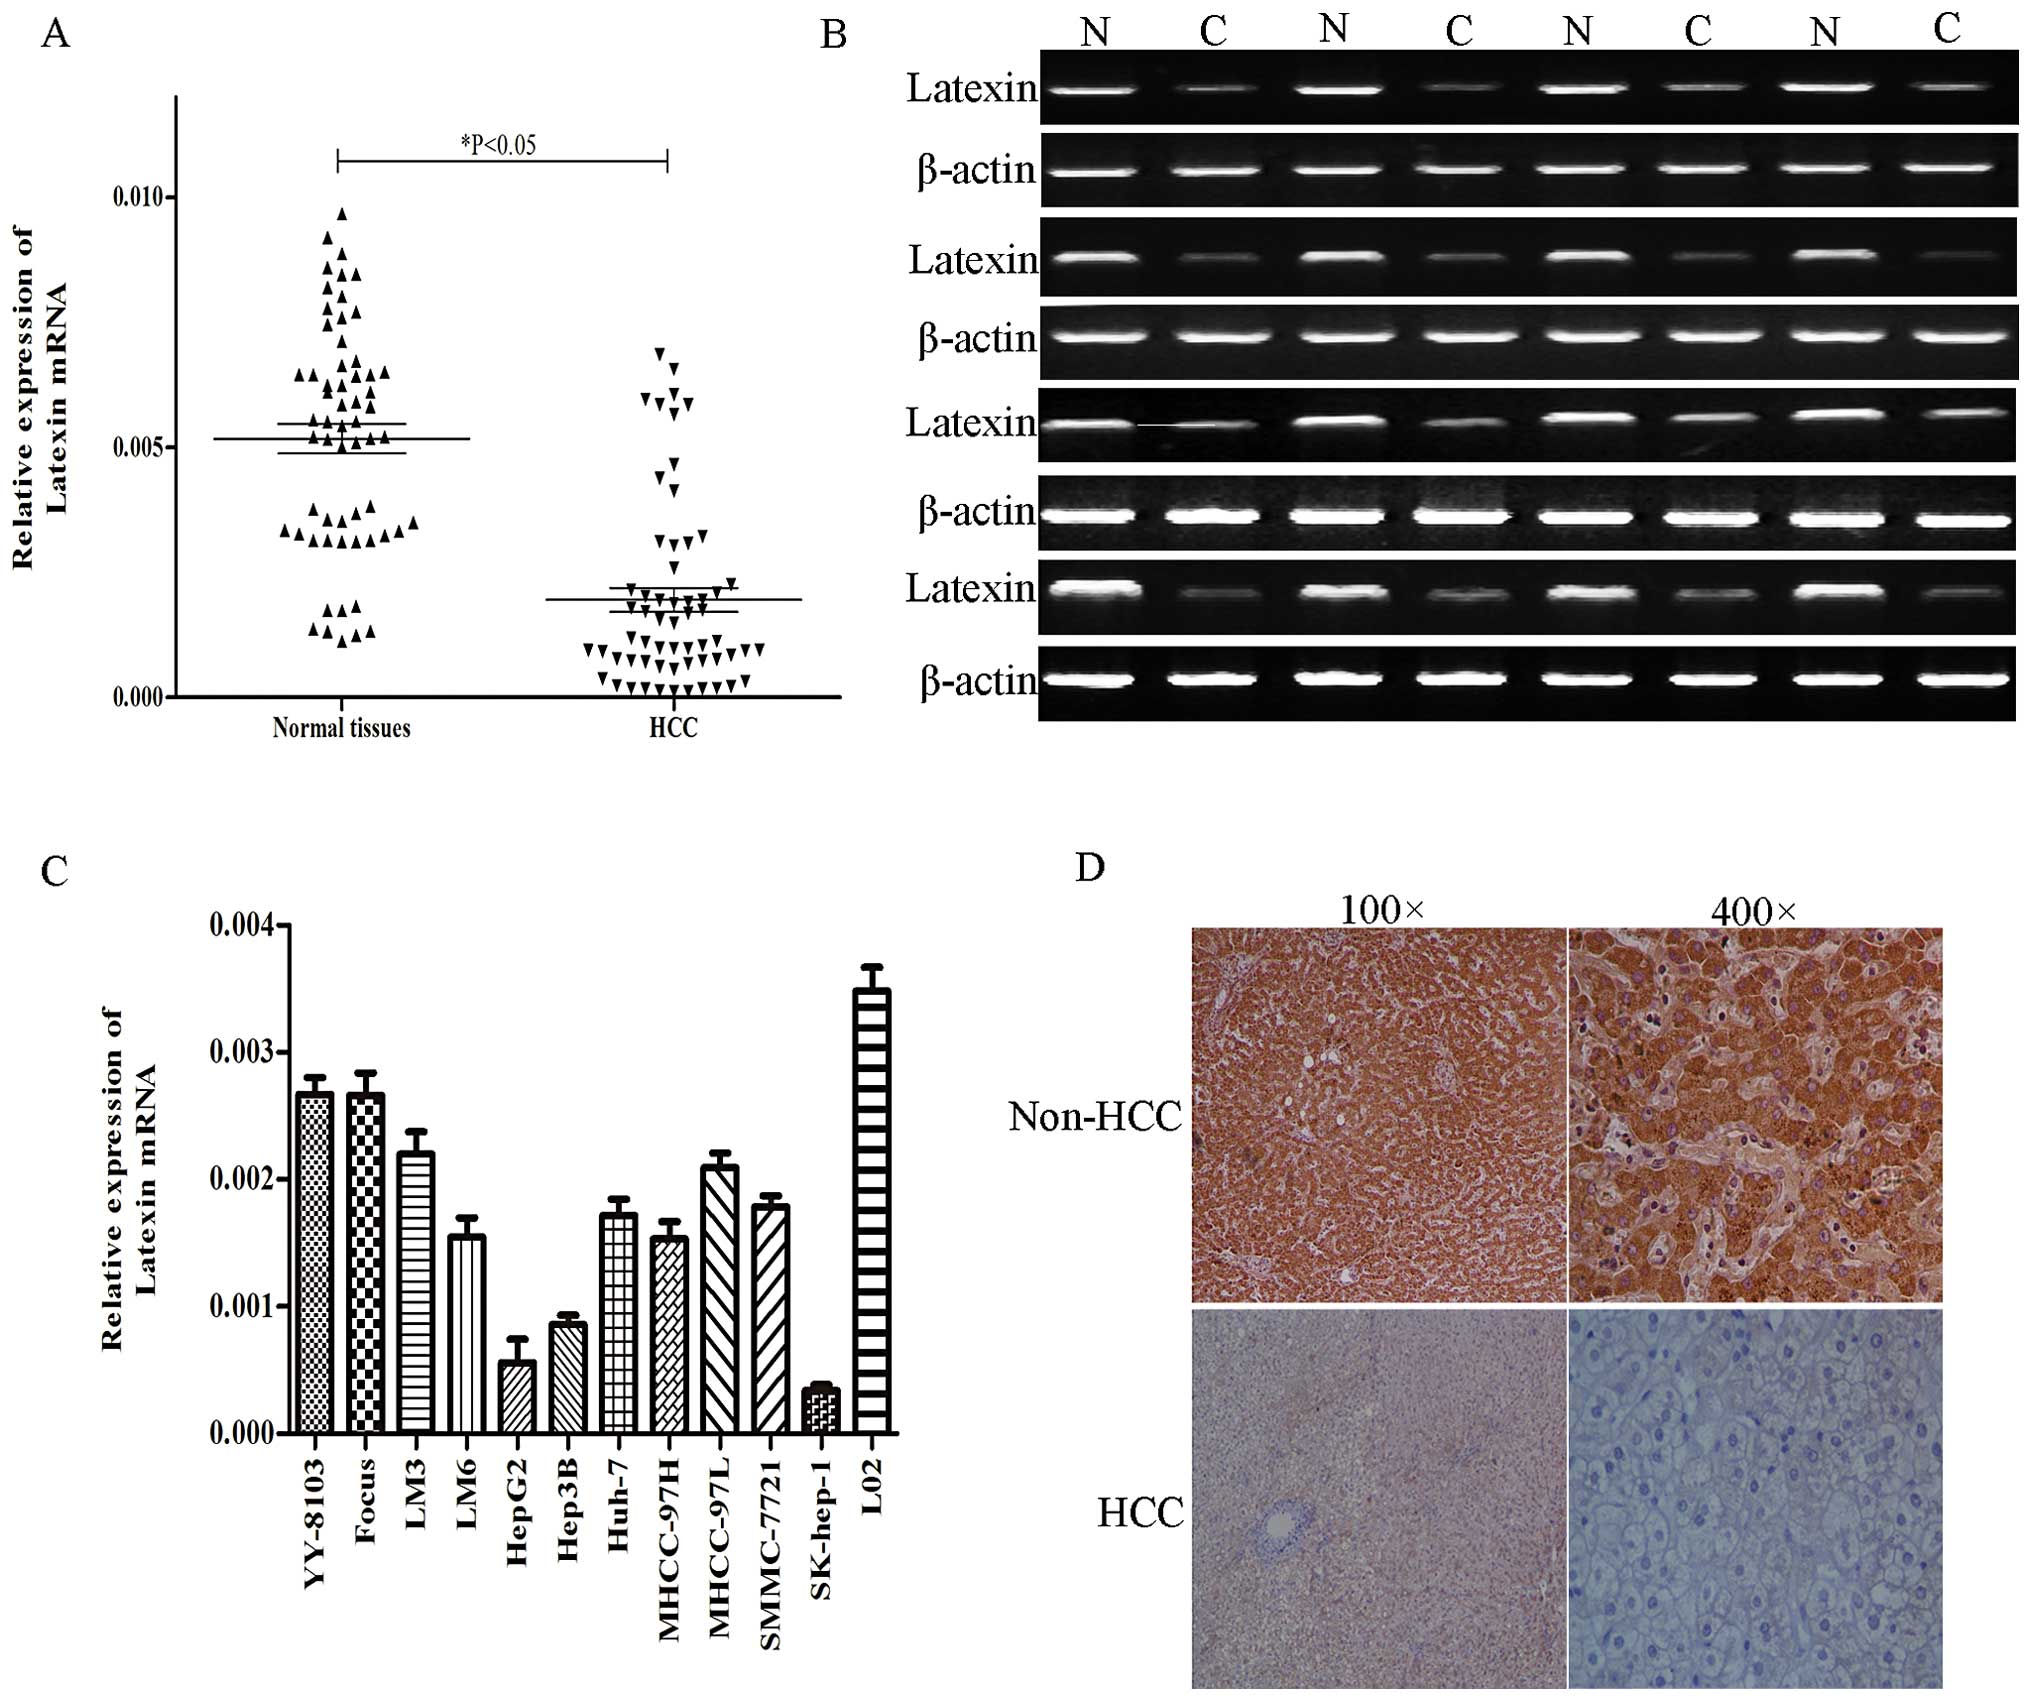
Semi-quantitative RT-PCR and qRT-PCR were performed
to measure the latexin mRNA expression levels in HCC and adjacent
non-cancerous livers from 60 patients. The results indicated that
latexin mRNA was decreased in 42 (70%) of 60 HCC specimens compared
with the matched normal liver tissues (Fig. 1A and B). We performed
immunohistochemistry (IHC) to evaluate latexin protein expression
in HCC specimens and paired normal liver tissues in the same 60
matched samples. Of these specimens, 45/60 (75.0%) of cancerous
specimens showed no or weak () positive staining, whereas 24/60
(40.0%) of non-HCC tissues showed no or weak () positive staining
(Fig. 1D). Furthermore, we
evaluated the expression of latexin in 11 HCC-derived cell lines
using qRT-PCR. Latexin mRNA was significantly decreased in all
HCC-derived cell lines (YY-8103, Focus, LM3, LM6, HepG2, Hep3B,
SK-hep-1, Huh-7, MHCC-97H, MHCC-97L, SMCC-7721) compared with
normal human liver cells (L02) (Fig.
1C). These data showed that latexin is decreased in HCC.
Overexpression of latexin inhibits
proliferation and colony formation in SK-hep-1 and HepG2 cell
lines
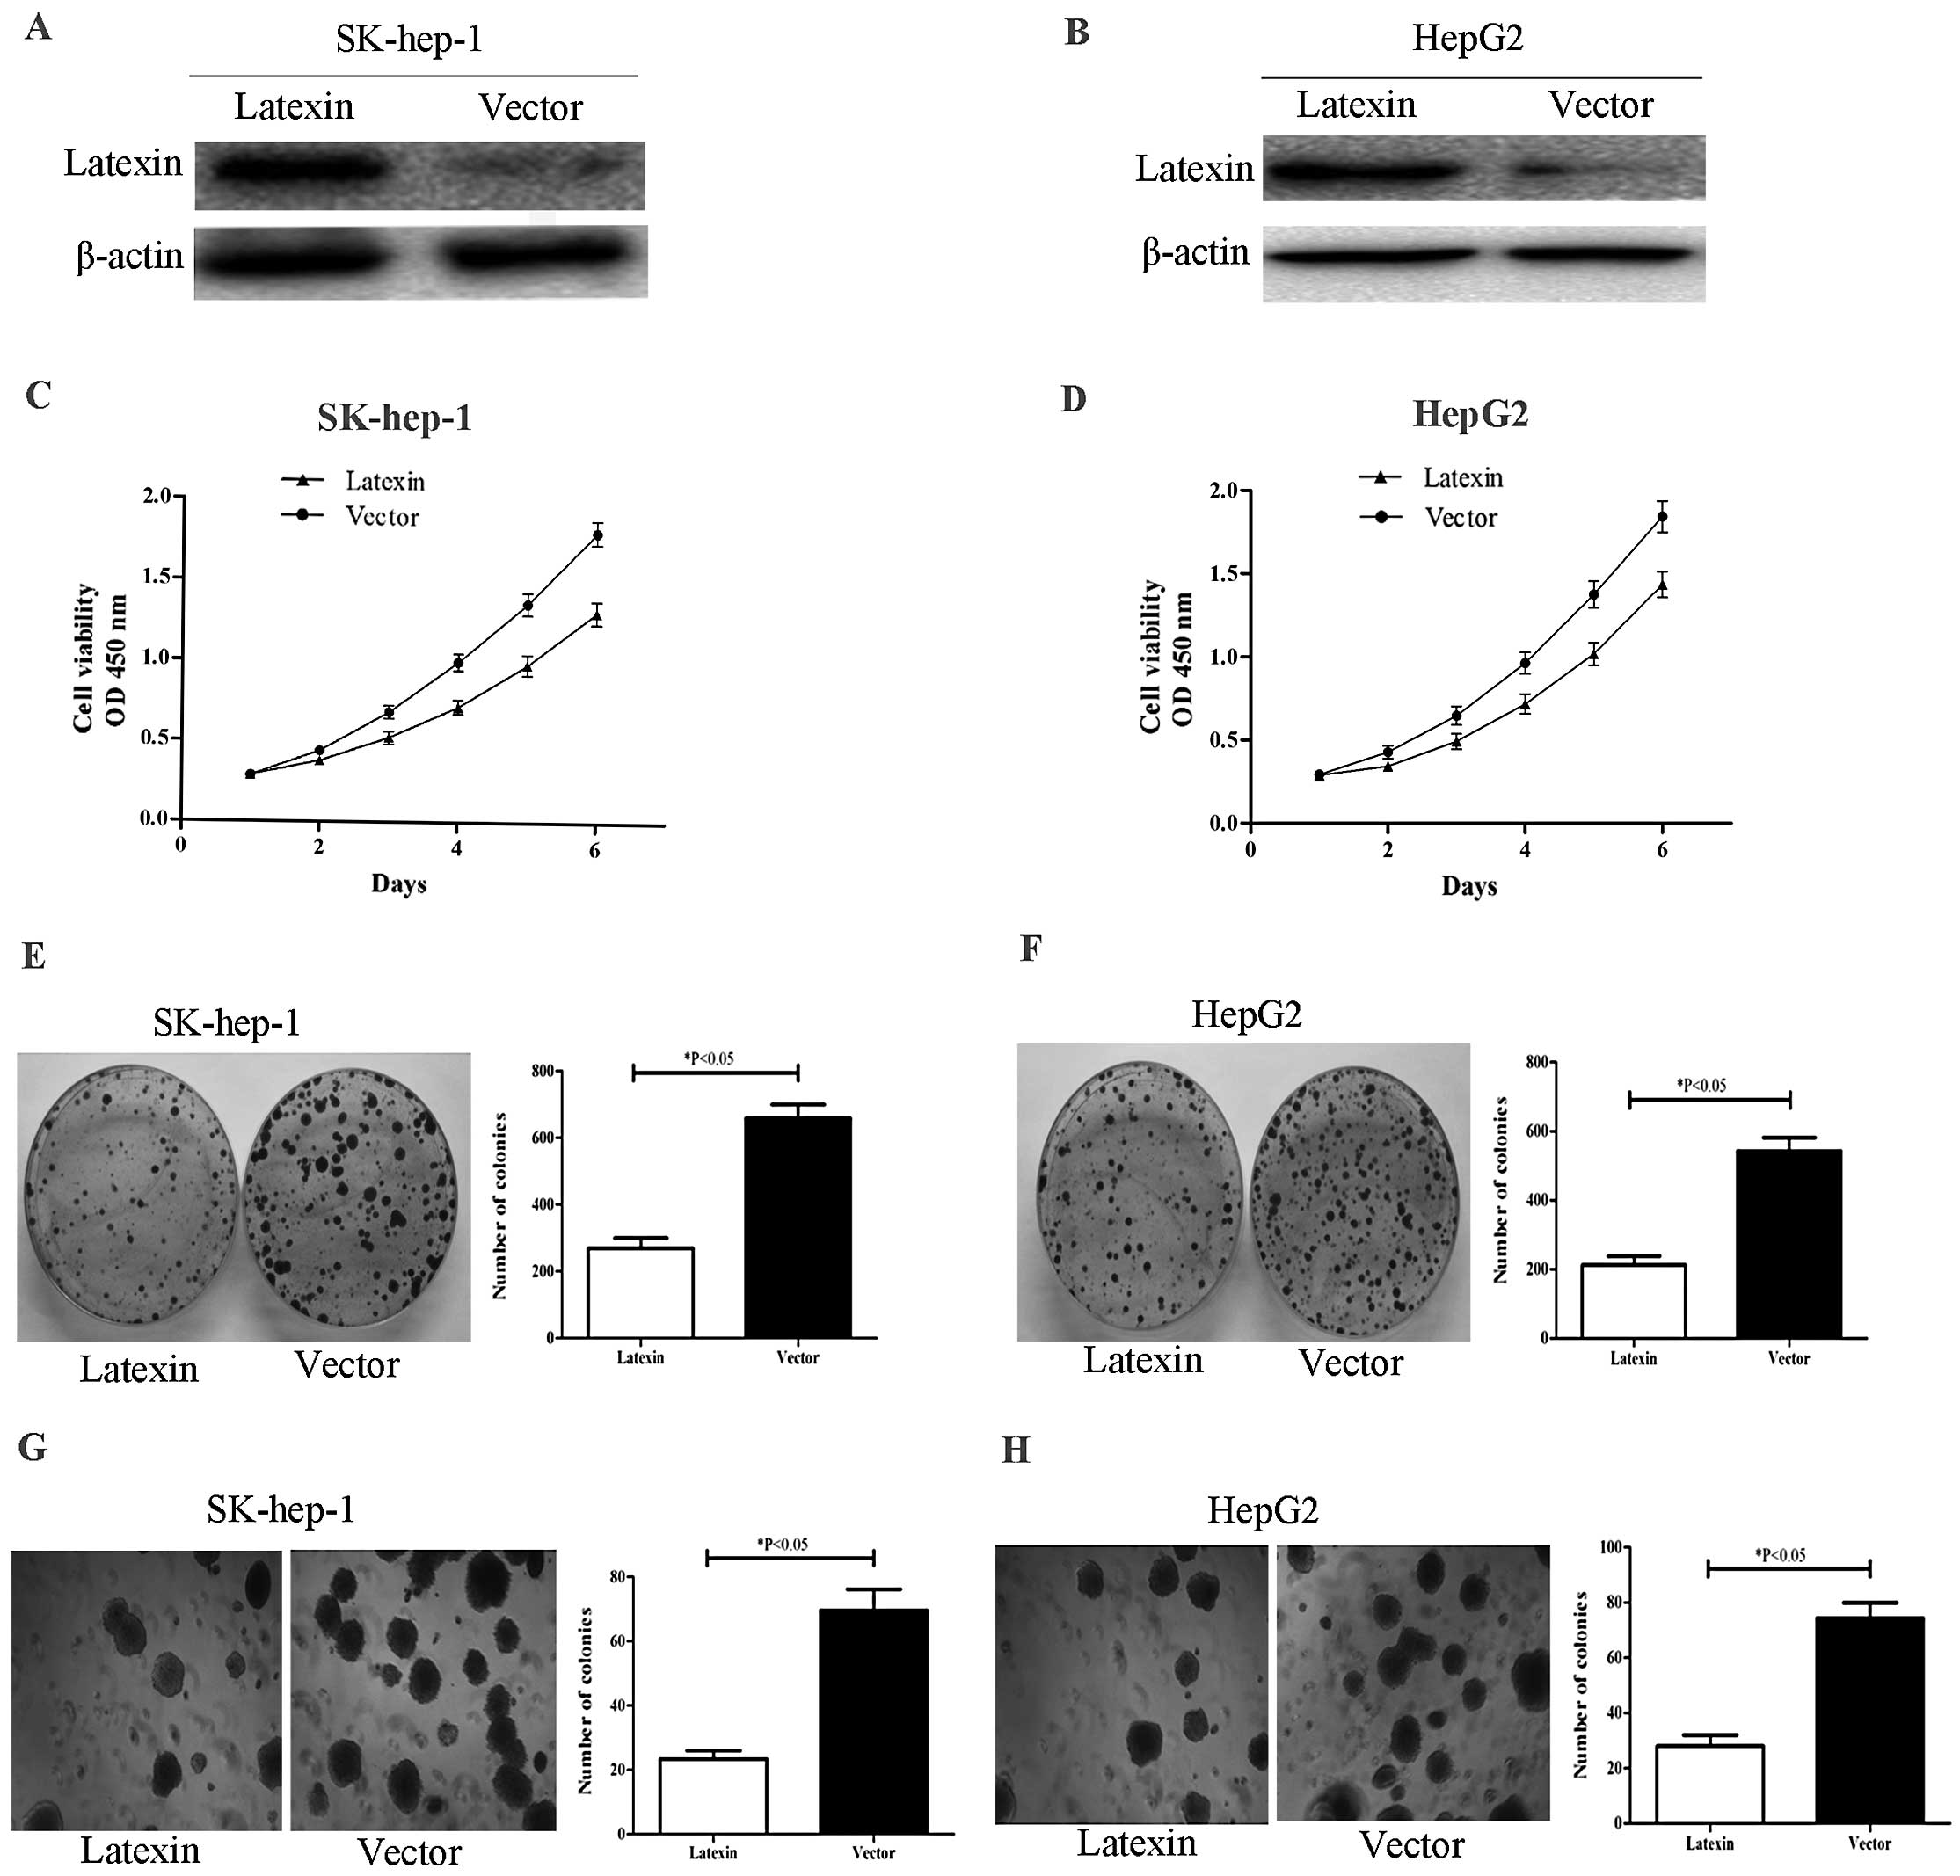
To overexpress latexin, the recombinant
pcDNA3.1B-latexin was transfected into SK-hep-1 and HepG2 cell
lines. We performed western blotting to evaluate latexin protein
expression in SK-hep-1 and HepG2 cells transfected with
pcDNA3.1B-latexin 48 h post-transfection. Latexin protein
expression in pcDNA3.1B-latexin-transfected cells was significantly
higher than in empty vector-transfected cells (Fig. 2A and B). To investigate the
anti-proliferative effects in pcDNA3.1B-latexin-transfected cells,
cellular growth was monitored for 6 days. The
pcDNA3.1B-latexin-transfected SK-hep-1 and HepG2 cells (Fig. 2C and D) showed a significant
decrease in cellular growth compared with empty vector-transfected
cells (*P<0.05). SK-hep-1 and HepG2 cells with
overregulated latexin expression were subjected to colony formation
assay. As shown in Fig. 2E and F,
overexpression of latexin in SK-hep-1 and HepG2 cells resulted in
significant inhibition of colony formation as compared with
SK-hep-1 and HepG2 cells transfected with empty vector
(*P<0.05) and the majority of clones were smaller
than those of control cells. We then used a soft agar assay for
colony formation, which is the most stringent assay for detecting
the proliferative ability of cells. We observed reduced formation
of colonies in soft agar (Fig. 2G and
H) that had been seeded with SK-hep-1 and HepG2 cells infected
with pcDNA3.1B-latexin compared with empty vector-transfected cells
(*P<0.05). These results indicated that latexin acts
as an inhibitor of tumor cell growth in vitro.
Knockdown of latexin promotes
proliferation and colony formation in YY-8103 and Focus cell
lines
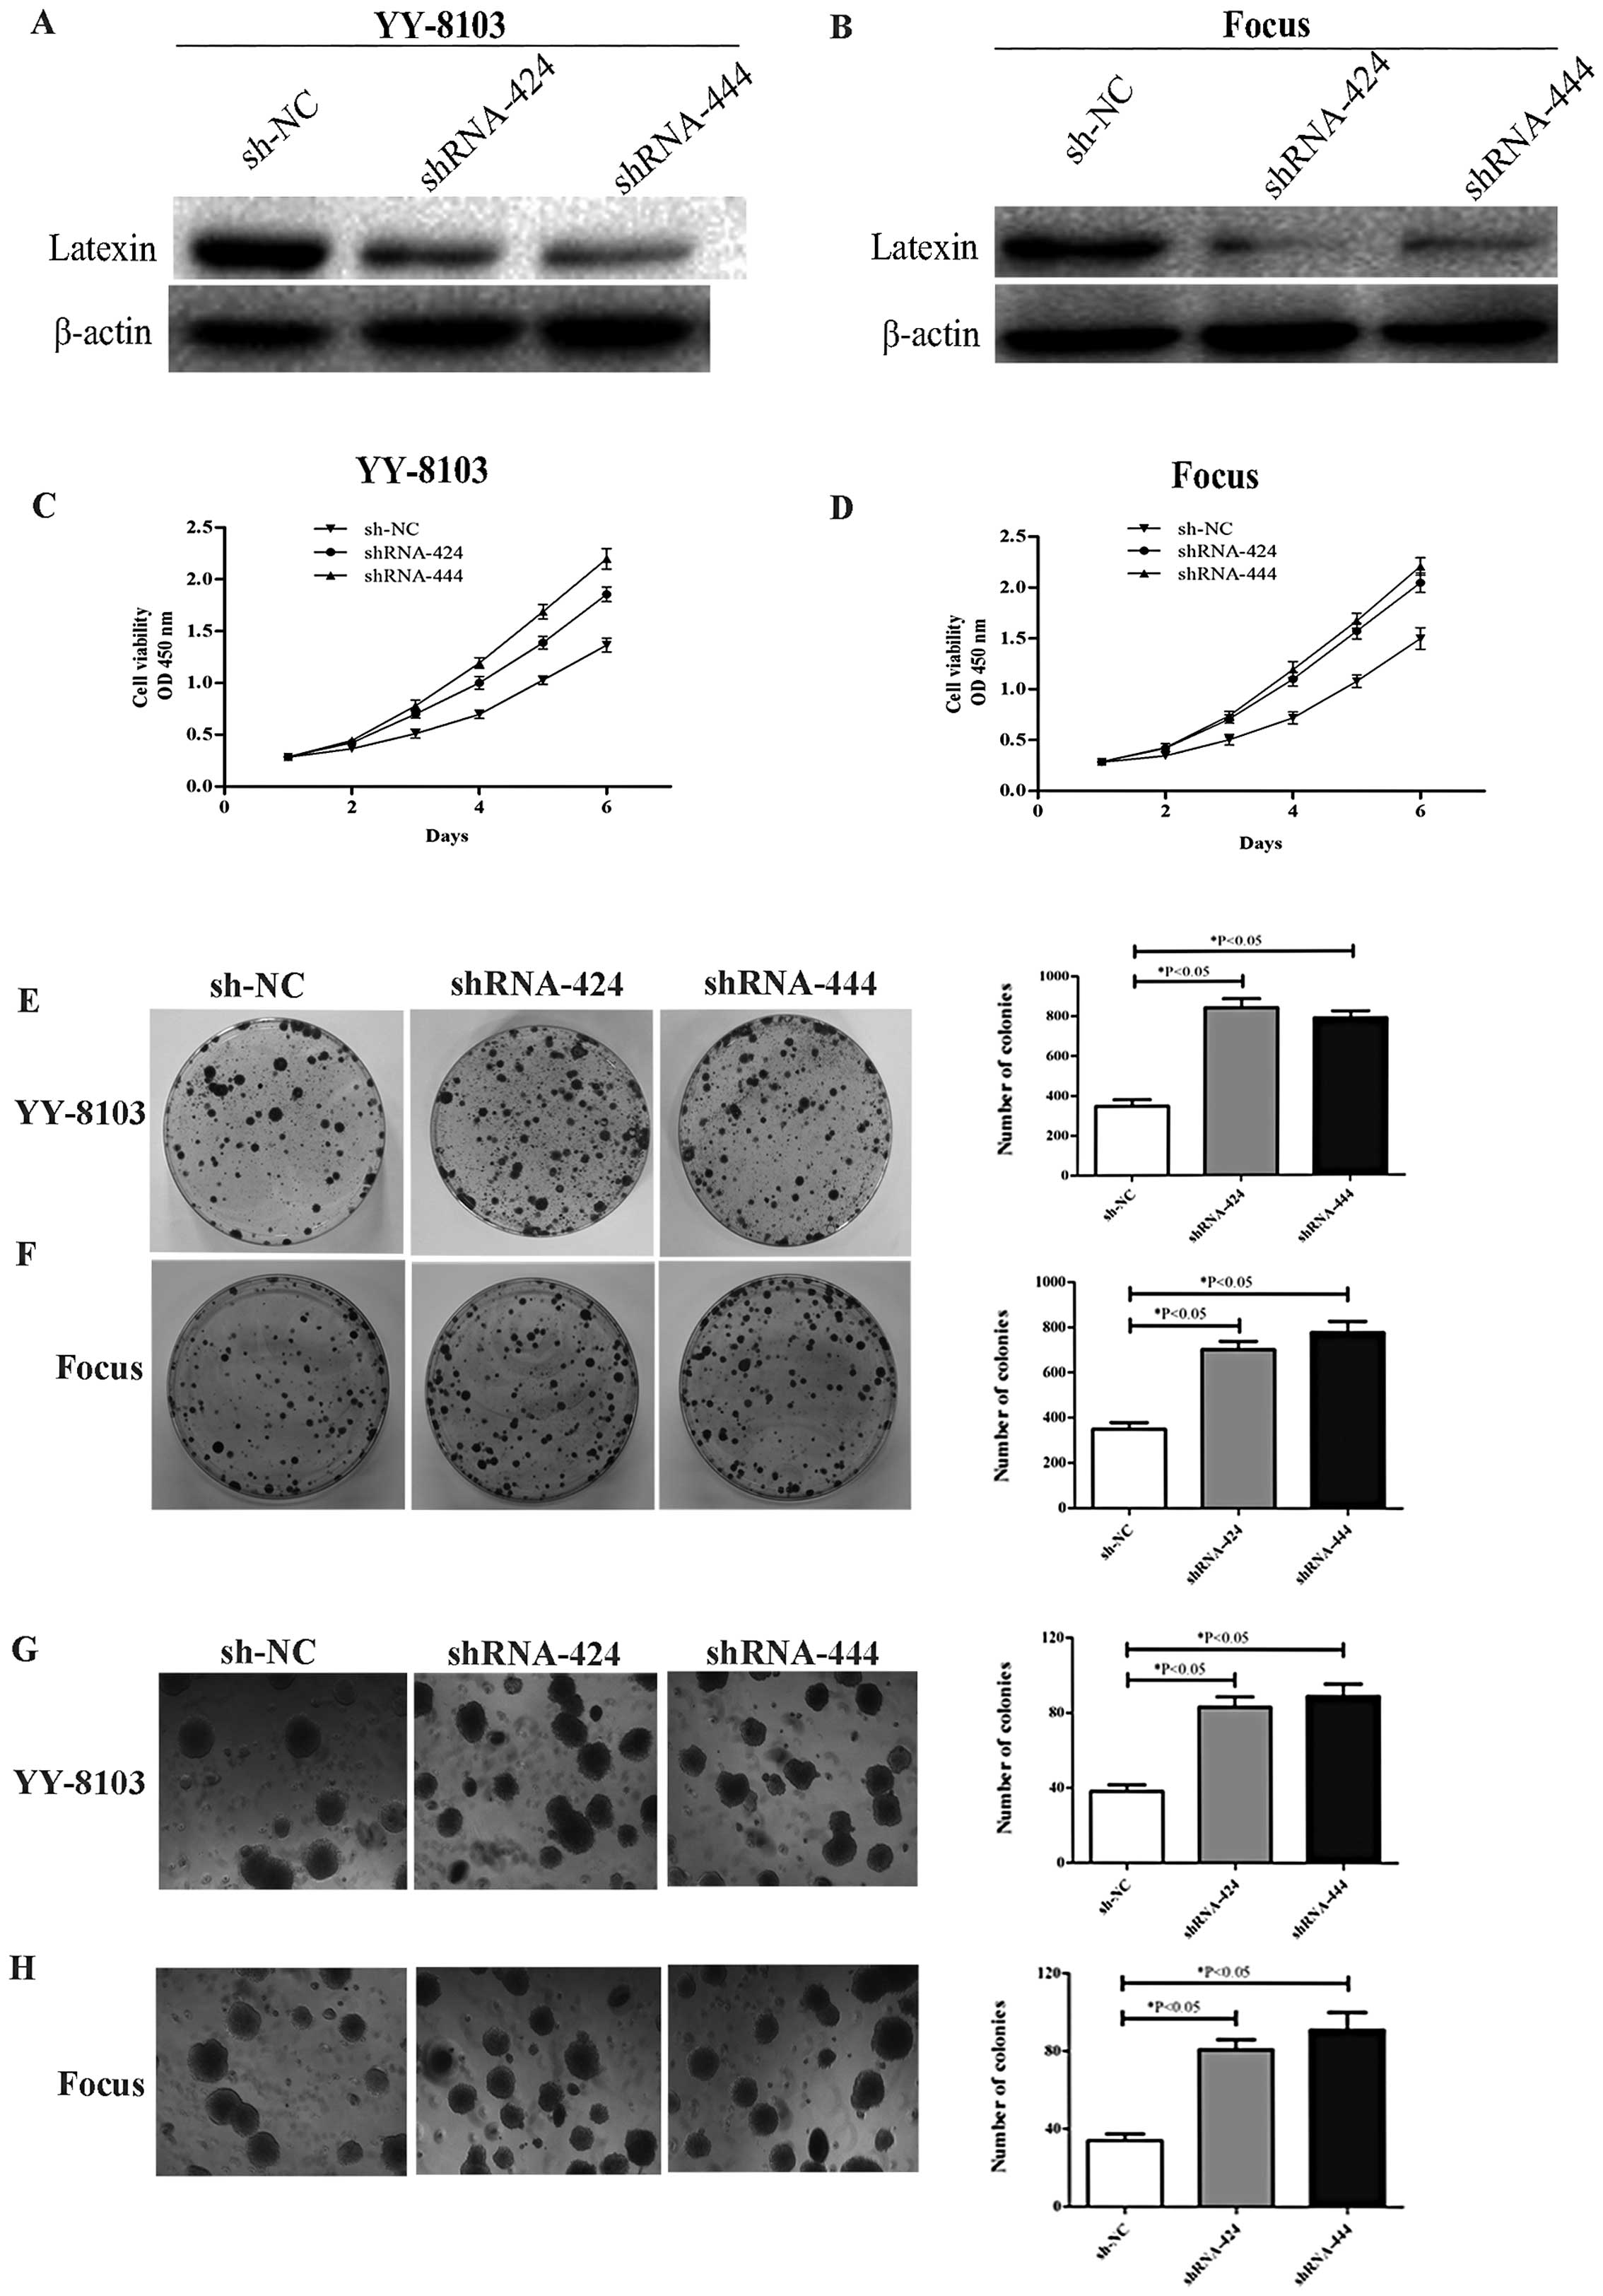
To knock down latexin, the recombinant
p-SUPER-shRNA-latexin was transfected into YY-8103 and Focus cell
lines. Western blot analyses were performed to assess the
efficiency of latexin knockdown in YY-8103 and Focus cells
transfected with p-SUPER-shRNA-latexin 48 h post-transfection.
Latexin protein expression in p-SUPER-shRNA-latexin-transfected
cells was significantly lower than that in sh-NC-transfected cells
(Fig. 3A and B). The
p-SUPER-shRNA-latexin-transfected YY-8103 and Focus cells (Fig. 3C and D) showed significant promotion
of cellular growth compared with sh-NC-transfected cells
(*P<0.05). YY-8103 and Focus cells with downregulated
latexin expression were subjected to colony formation assay. As
shown in Fig. 3E and F, decreased
expression of latexin in YY-8103 and Focus cells resulted in
significant promotion of colony formation as compared with cells
transfected with sh-NC (*P<0.05). We also observed
enhanced formation of colonies in soft agar (Fig. 3G and H) that had been seeded with
YY-8103 and Focus cells transfected with p-SUPER-shRNA-latexin
compared with sh-NC-transfected cells (*P<0.05).
Overexpression of latexin promotes cell
cycle arrest in G0/G1 phase in SK-hep-1 cells and knockdown of
latexin promotes the cell cycle transition from G0/G1 to S phase in
YY-8103 cells
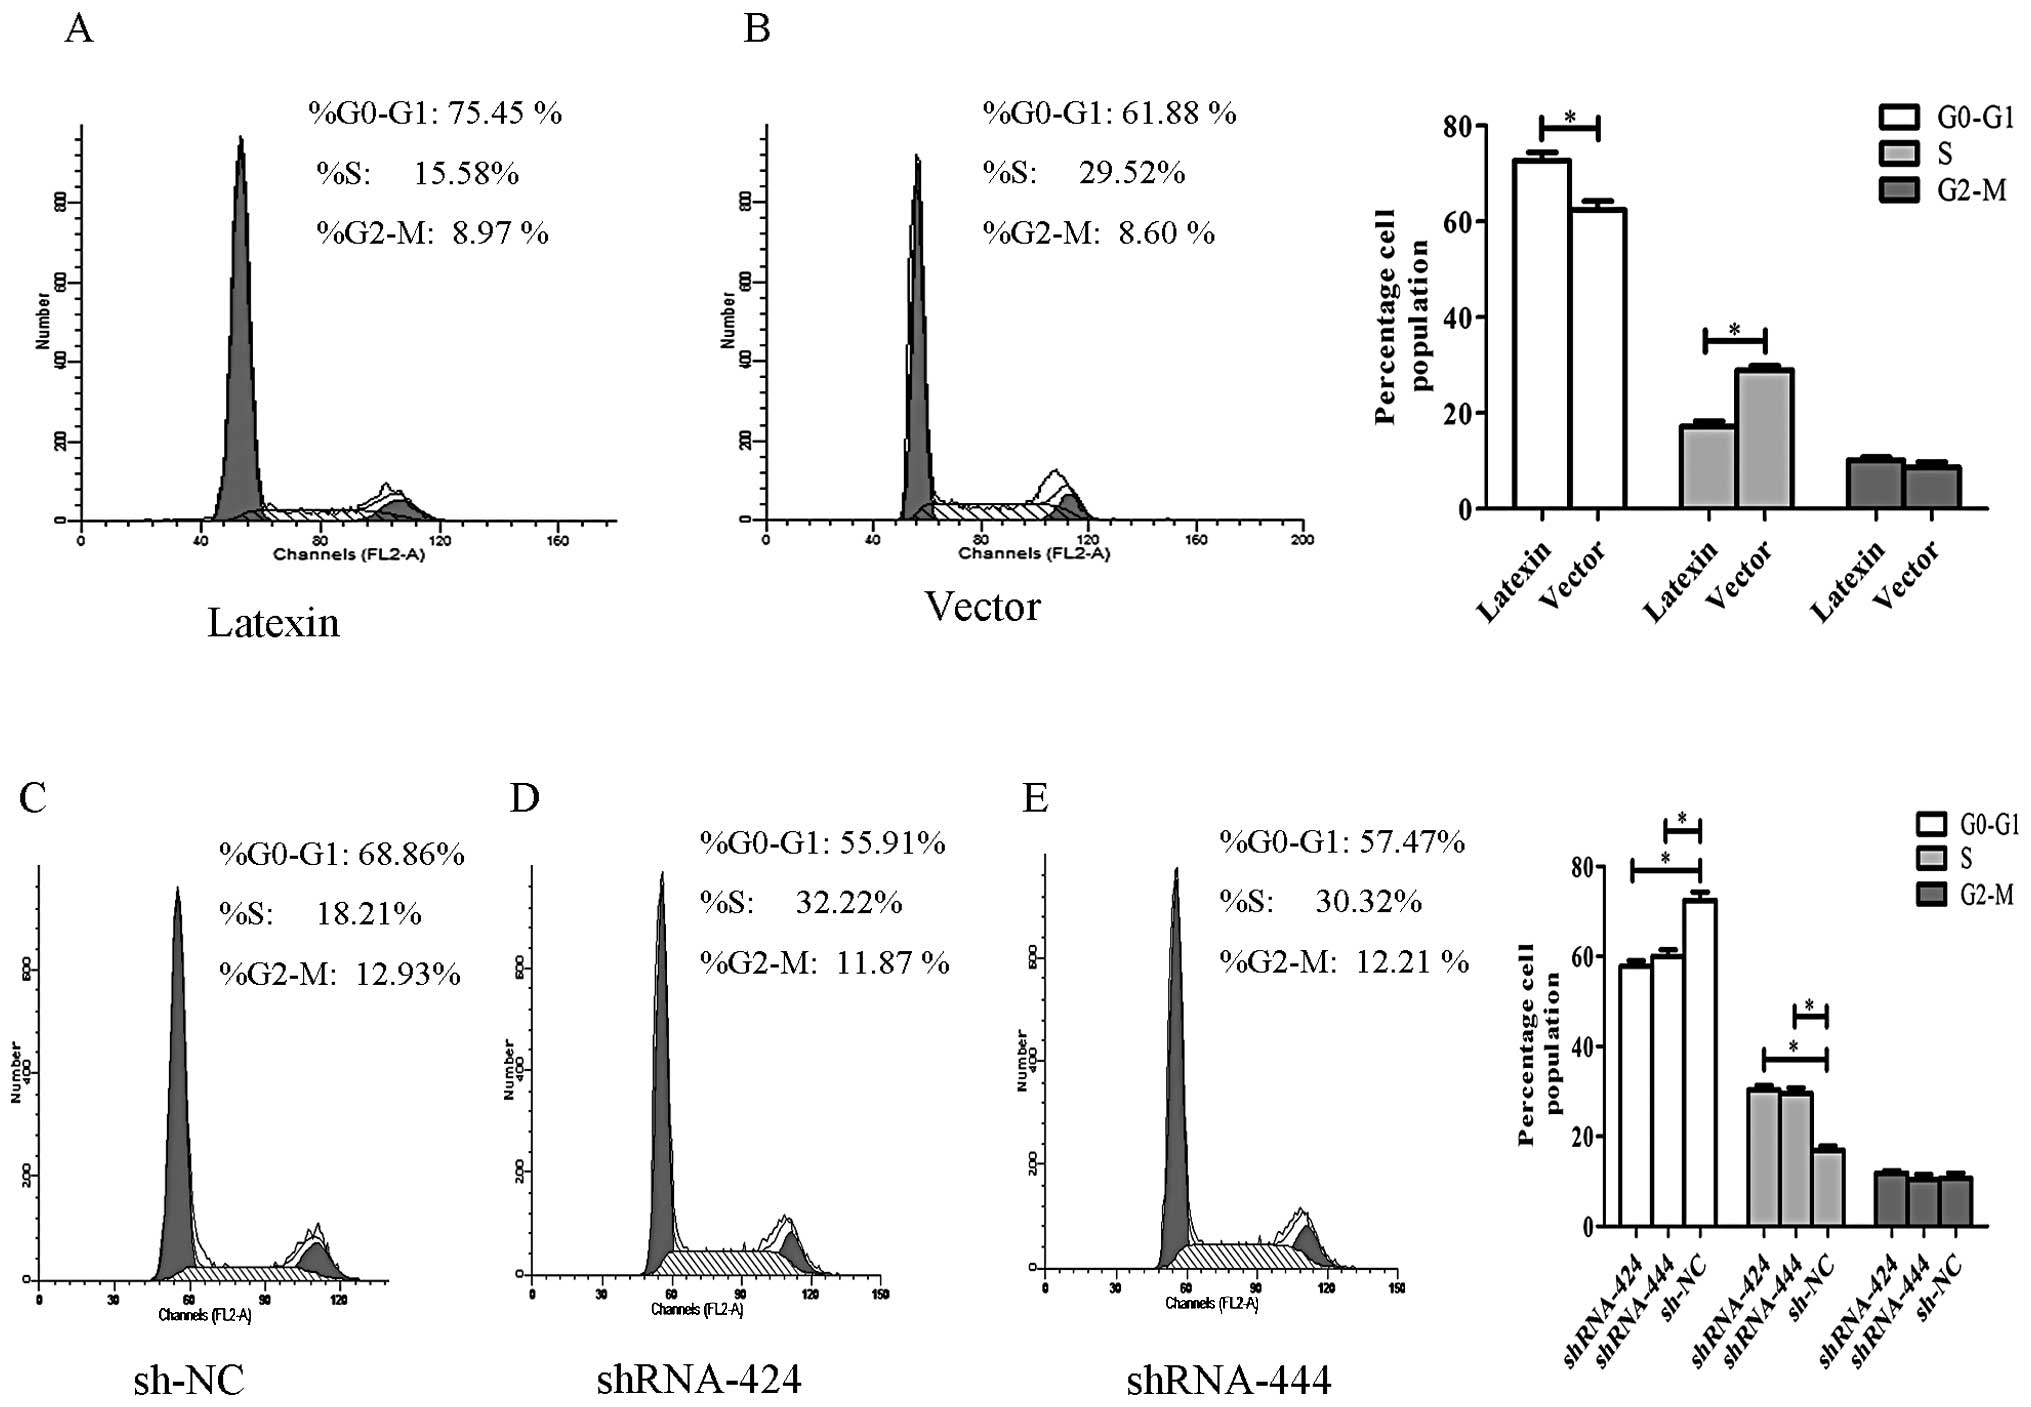
To study the growth suppression effect of
pcDNA3.1B-latexin on SK-hep-1 cells and the growth enhancement
effect of p-SUPER-shRNA-latexin on YY-8103 cells, we performed cell
cycle distribution analysis using flow cytometry 24 h after
transfection. As shown in Fig. 4A and
B, overexpression of latexin induced cell cycle arrest in G0/G1
phase in SK-hep-1 cells compared with the empty vector-transfected
cells; the percentage of G0/G1 phase in the pcDNA3.1B-latexin group
was increased by 13.57% (*P<0.05) at 24 h. These
results demonstrated that latexin overexpression may induce cell
cycle arrest at G0/G1 phase. The opposite phenomenon was seen in
YY-8103 cells when transfected with p-SUPER-shRNA-latexin, as shown
in Fig. 4C–E. Knockdown of latexin
promoted the cell cycle transition from G0/G1 to S phase in YY-8103
cells compared with sh-NC-transfected cells; the percentage of S
phase in the p-SUPER-shRNA-latexin group was increased by 14.01 and
12.11% (*P<0.05) at 24 h. These results indicated
that downregulation of latexin may facilitate cell entrance from
the G0/G1 to the S phase, thus promoting cell proliferation.
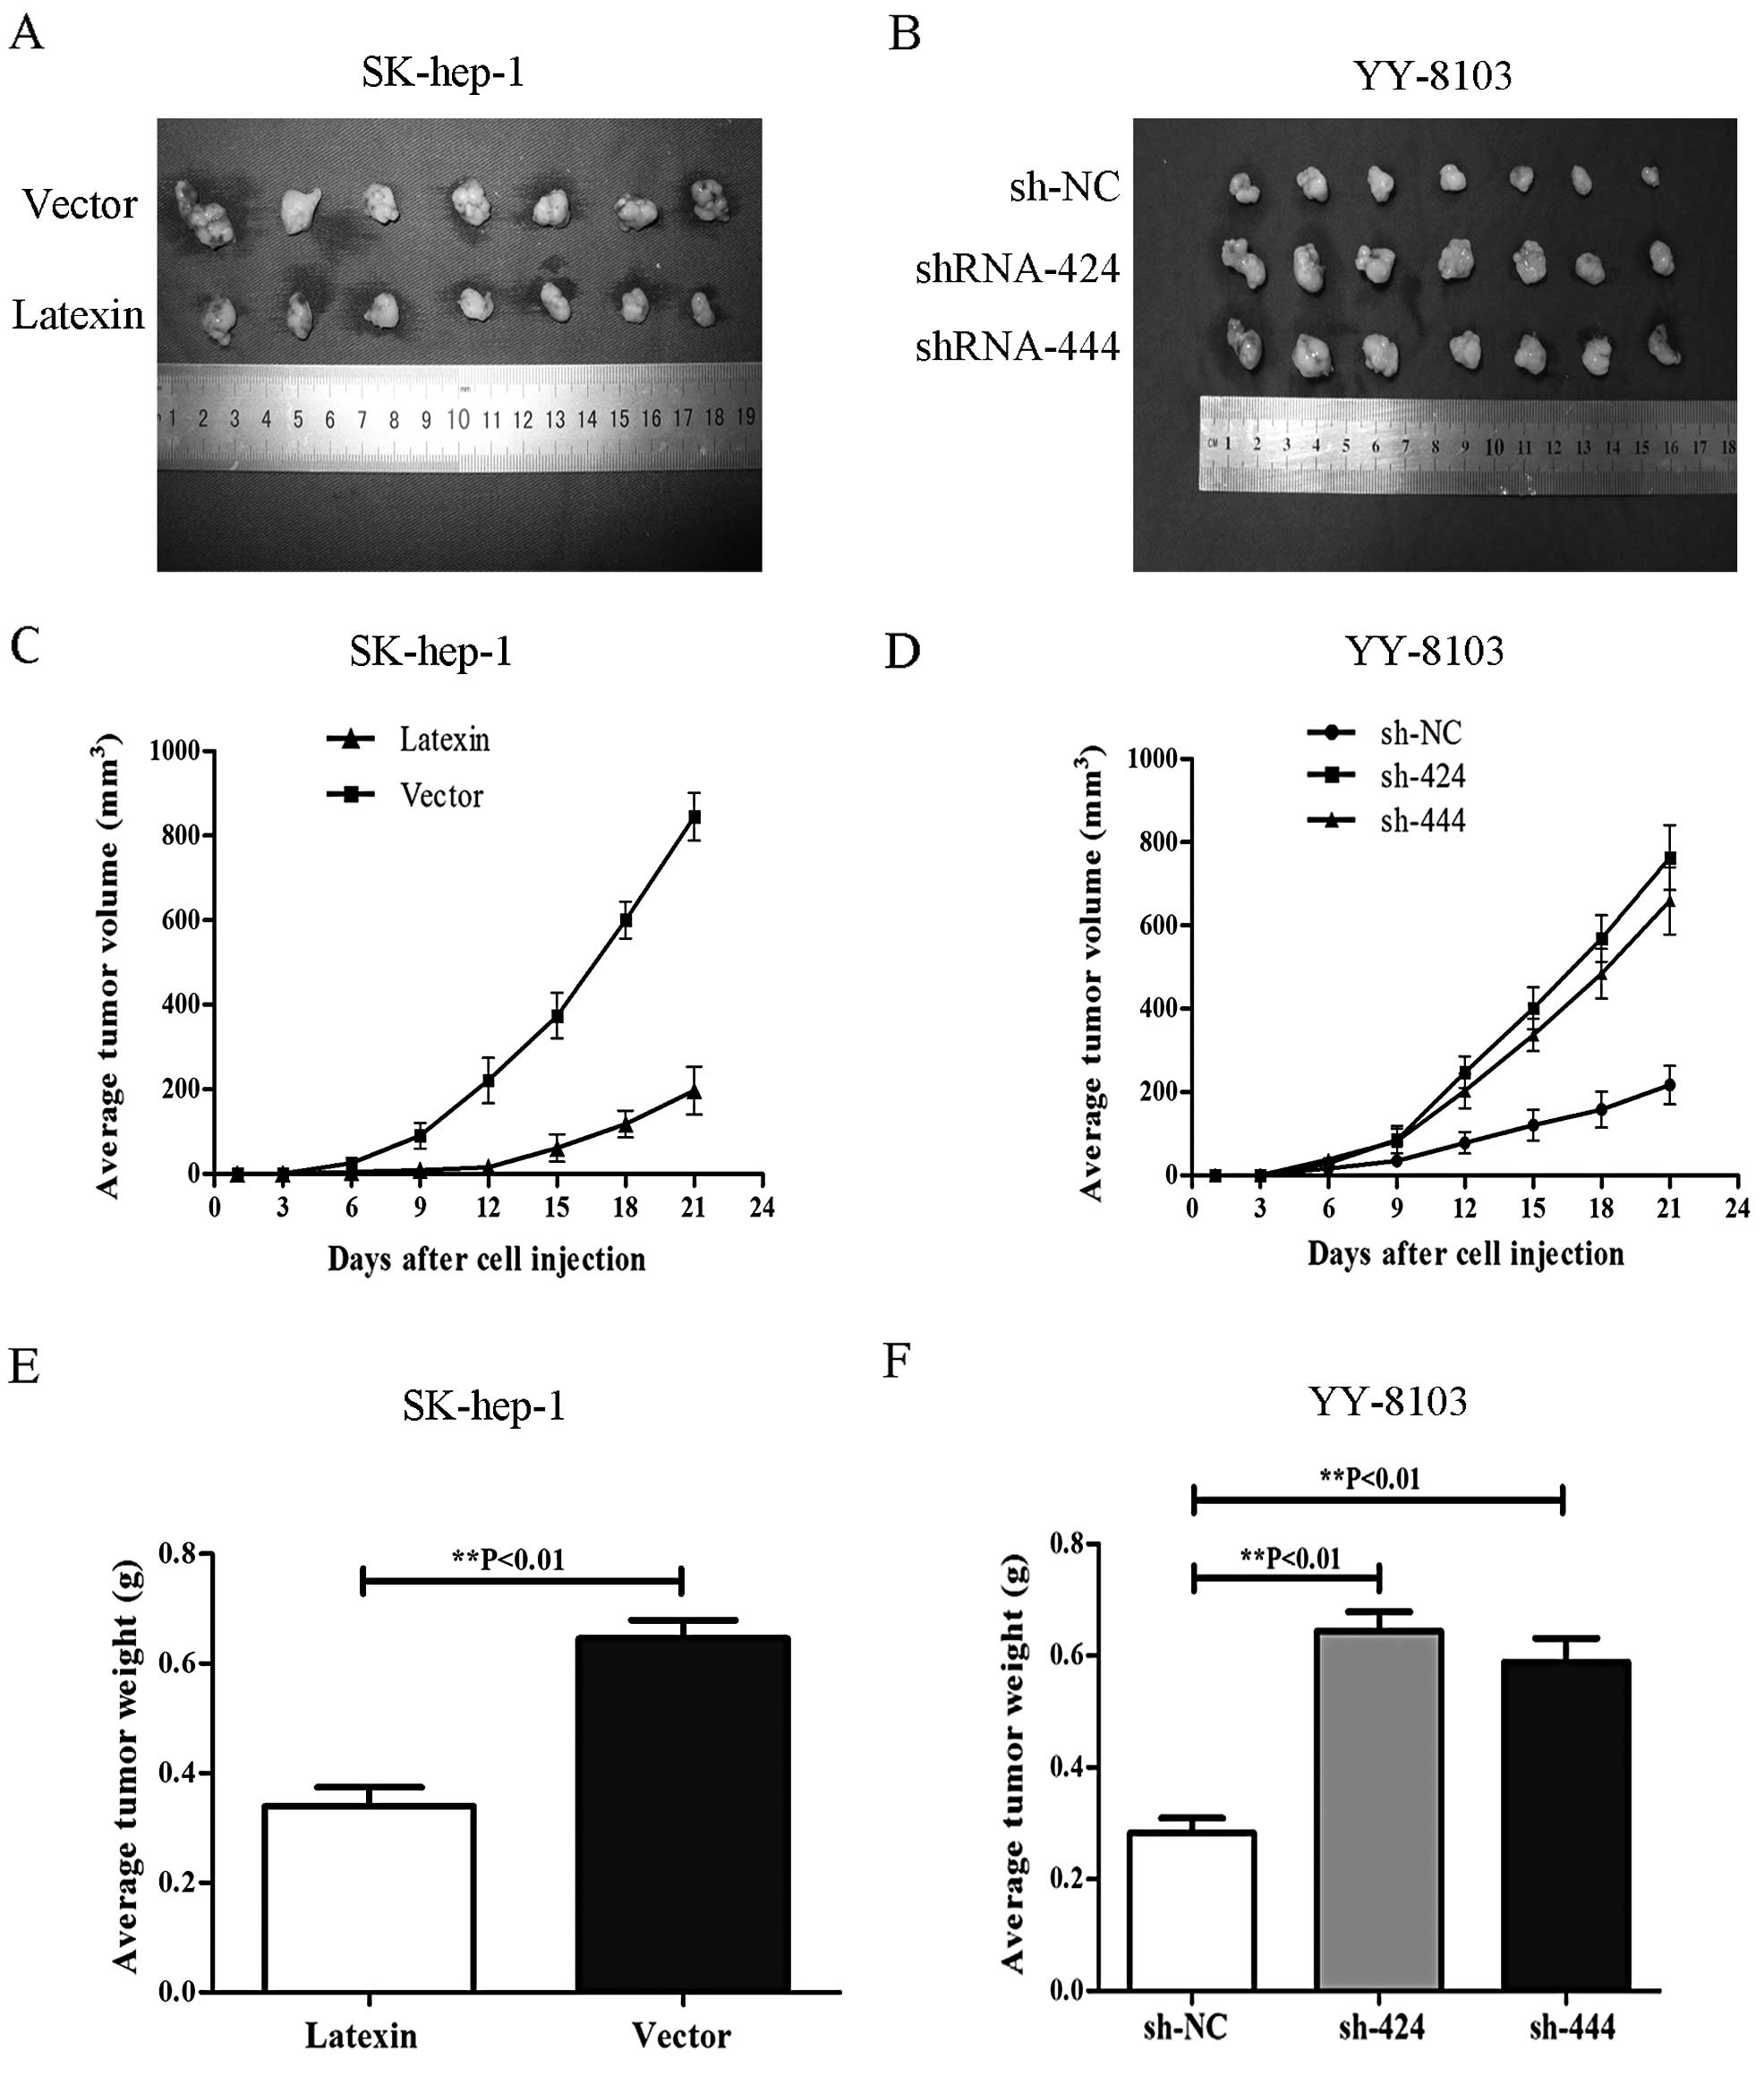
Differential expression of latexin
influences tumorigenesis in nude mice
The effects of differential latexin expression on
the tumorigenic potential of liver cancer cells in vivo were
also evaluated. SK-hep-1 cells overexpressing latexin and YY-8103
with downregulated latexin expression were injected subcutaneously
into BALB/c nude mice (500×106 cells/mouse, 7 mice in
each experimental group). Tumor size was measured every third day
after injection. After 3 weeks, mice were sacrificed and
photographed and the tumors were removed and weighed. Compared to
the mice injected with SK-hep-1 cells transfected with vector, the
mice injected with SK-hep-1 cells overexpressing latexin displayed
smaller tumors during the same time period, and the average tumor
volumes and weights were significantly less than those in the
control group (**P<0.01) (Fig. 5A, C and E). Compared to the mice
injected with YY-8103 cells transfected with p-SUPER-sh-NC, the
mice injected with YY-8103 cells and downregulated latexin showed a
clear increased capacity for tumorigenesis (**P<0.01)
(Fig. 5B, D and F). Taken together,
these results strongly suggest that latexin acts as an inhibitor of
tumor cell growth and tumorigenicity in vivo.
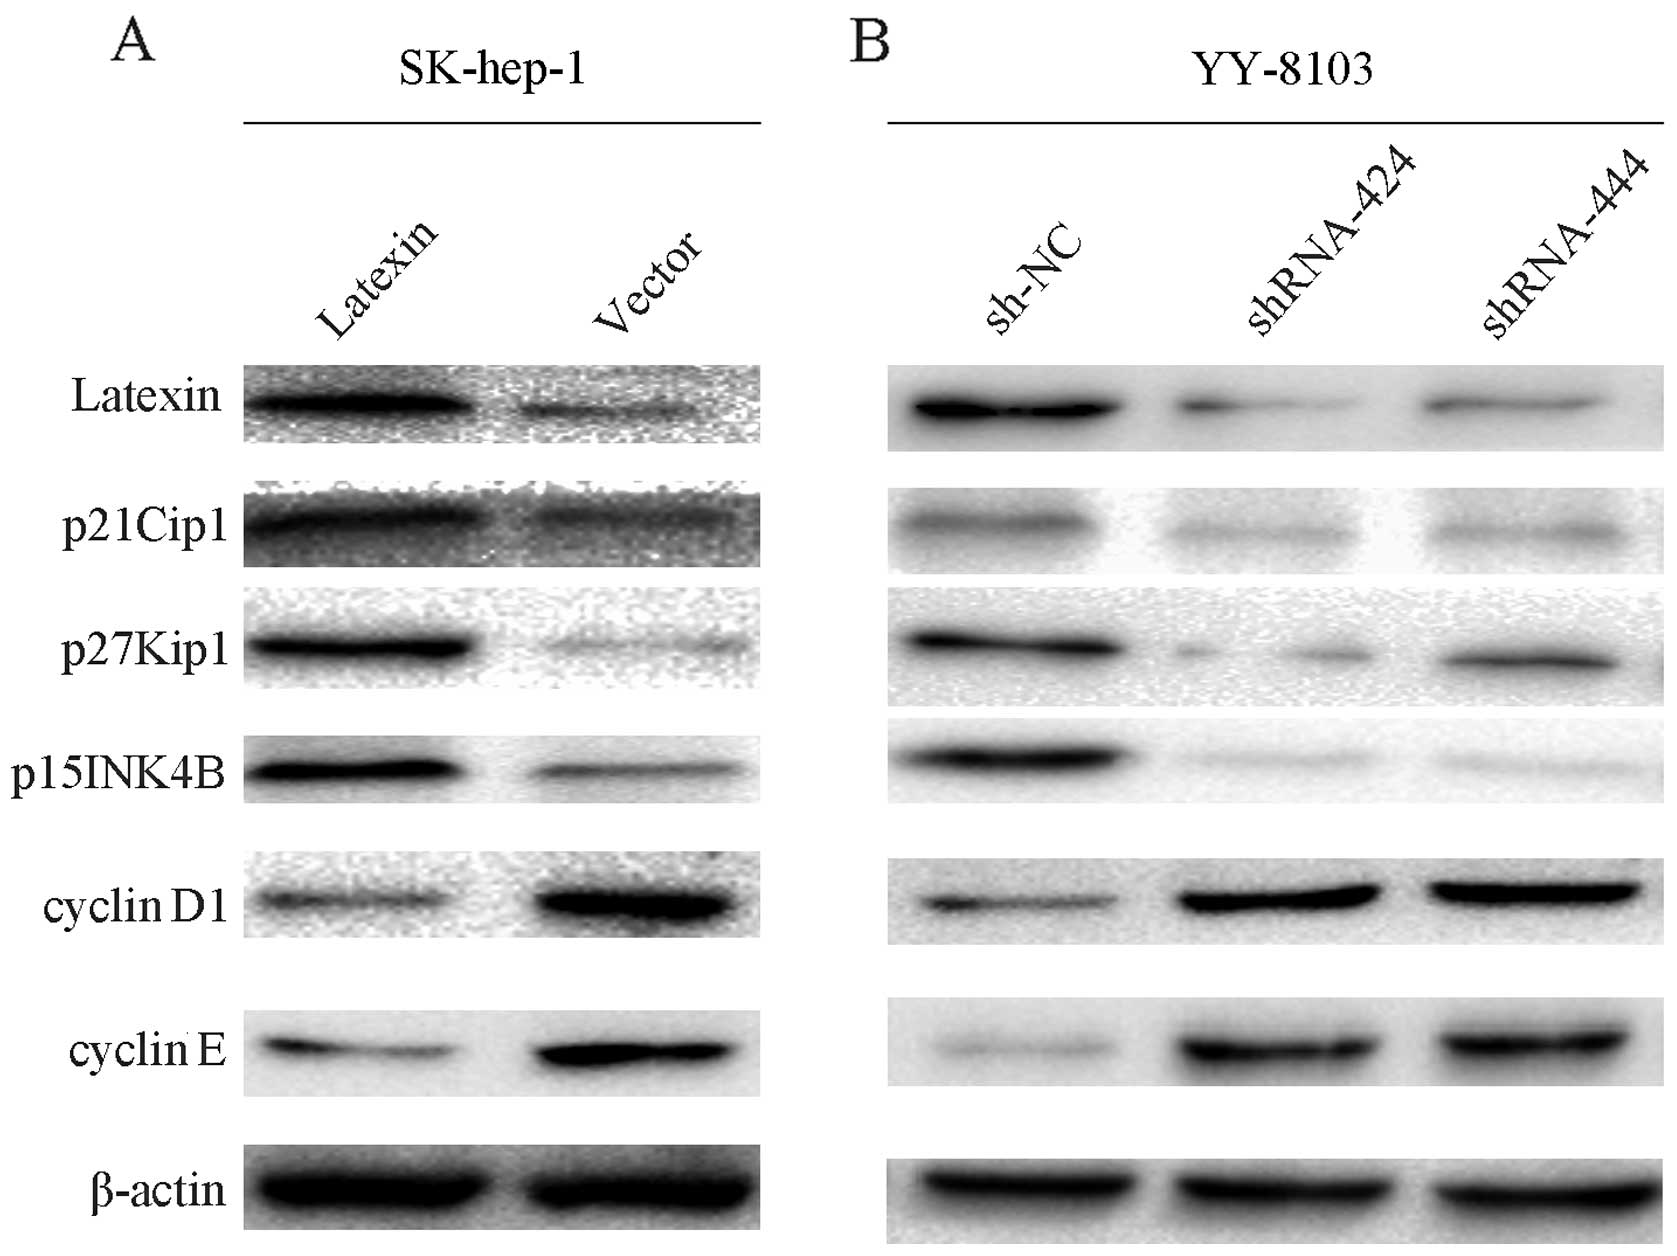
Overexpressed or silenced latexin
influences the expression of cyclin pathway-related proteins
The protein expression data showed upregulation of
p21Cip1, p27Kip1, p15INK4B and downregulation of cyclin D1 and
cyclin E in the latexin-overexpressed cell line SK-hep-1 (Fig. 6A). Conversely, latexin-silencing via
shRNA in the YY-8103 cell line showed downregulation of p21Cip1,
p27Kip1, p15INK4B and upregulation of cyclin D1 and cyclin E
(Fig. 6B).
Discussion
The silencing of latexin gene expression resulted in
an enhanced capacity for colony formation and tumorigenicity in
nude mice (22). A study by Greaves
and Maley demonstrated that latexin may influence the crucial step
in carcinogenesis (23). In
addition, due to the close linkage both structurally and
genetically with TIG1, we proposed that latexin may also act as a
tumor suppressor. In the present study, we showed that latexin mRNA
was downregulated in HCC samples and HCC-derived cell lines.
Immunohistochemical analysis demonstrated that latexin was
downregulated in the cytoplasm of HCC tissue. Of the HCC tissues
tested, only 25.0% (15/60) were latexin-positive, while 60.0% of
normal liver tissues (36/60) were latexin-positive. Colony
formation assays and tumor xenografts in nude mice indicated a
negative correlation between latexin expression and tumorigenesis
of HCC.
To investigate the underlying molecular mechanism of
latexin expression in negative control of tumor cell growth, we
examined changes in the gene expression profile in response to
differential latexin expression in SK-hep-1 and YY-8103 cells. We
found that the variation in cellular proliferation was a result of
cell cycle arrest at the G1 phase or cell cycle transition from the
G0/G1 to the S phase with differential expression of p21Cip1,
p27Kip1, p15INK4B, cyclin D1 and cyclin E. These results were
consistent with the observations that cell cycle progression is
negatively controlled by CDKIs, such as p21Cip1, p27Kip1, p57Kip2
and the INK4 families (p15INK4B, p16INK4A, p18INK4C and p19INK4D),
which are involved in cell cycle arrest at the G1 phase and have
several functions as tumor suppressor genes (24), and that upregulation of p21Cip1
and/or p27Kip1 causes growth inhibition in various cancer models
(25–27). The INK4 families can bind to CDK4
and/or to CDK6 and inhibit the catalytic activity of the CDK/cyclin
D complex (28–31). Cyclin D1, cyclin E, CDK4 and CDK6
are also critical regulators of G1 progression and G1-S transition
(33). Inhibition of cyclin D1,
cyclin E and CDK4 activation blocks G1-S transition in the cell
cycle (32–35).
Our results showed that downregulation of latexin
occurs frequently during liver carcinogenesis and that
silenced-latexin may be associated with progression of HCC by
preventing cessation of cell cycle progression at the G1 phase,
through decreased expression of CDKIs and increased expression of
cyclin D1 and cyclin E. Further studies are required to identify
the detailed interaction between latexin and cell cycle
regulators.
Acknowledgements
This study was supported by a grant from the Natural
Science Foundation of China (81270483).
References
|
1
|
Llovet JM, Burroughs A and Bruix J:
Hepatocellular carcinoma. Lancet. 362:1907–1917. 2003. View Article : Google Scholar
|
|
2
|
Farazi PA and DePinho RA: Hepatocellular
carcinoma pathogenesis: from genes to environment. Nature Rev
Cancer. 6:674–687. 2006. View
Article : Google Scholar : PubMed/NCBI
|
|
3
|
El-Serag HB and Rudolph KL: Hepatocellular
carcinoma: epidemiology and molecular carcinogenesis.
Gastroenterology. 132:2557–2576. 2007. View Article : Google Scholar : PubMed/NCBI
|
|
4
|
Poon D, Anderson BO, Chen LT, Tanaka K,
Lau WY, Van Cutsem E, et al: Management of hepatocellular carcinoma
in Asia: consensus statement from the Asian Oncology Summit 2009.
Lancet Oncol. 10:1111–1118. 2009. View Article : Google Scholar : PubMed/NCBI
|
|
5
|
Bruix J and Sherman M; Practice Guidelines
Committee, American Association for the Study of Liver Diseases.
Management of hepatocellular carcinoma. Hepatology. 42:1208–1236.
2005. View Article : Google Scholar
|
|
6
|
Coleman WB: Mechanism of human
hepatocarcinogenesis. Curr Mol Med. 3:573–588. 2003. View Article : Google Scholar
|
|
7
|
Caldwell S and Park SH: The epidemiology
of hepatocellular cancer: from the perspectives of public health
problem to tumor biology. J Gastroenterol. 44(Suppl 19): 96–101.
2009. View Article : Google Scholar : PubMed/NCBI
|
|
8
|
Bosch FX, Ribes J and Borràs J:
Epidemiology of primary liver cancer. Semin Liver Dis. 19:271–285.
1999. View Article : Google Scholar : PubMed/NCBI
|
|
9
|
Tung-Ping Poon R, Fan ST and Wong J: Risk
factors, prevention, and management of postoperative recurrence
after resection of hepatocellular carcinoma. Ann Surg. 232:10–24.
2000.PubMed/NCBI
|
|
10
|
Portolani N, Coniglio A, Ghidoni S,
Giovanelli M, Benetti A, Tiberio GA and Giulini SM: Early and late
recurrence after liver resection for hepatocellular carcinoma:
prognostic and therapeutic implications. Ann Surg. 243:229–235.
2006. View Article : Google Scholar : PubMed/NCBI
|
|
11
|
Hatanaka Y, Uratani Y, Takiguchi-Hayashi
K, Omori A, Sato K, Miyamoto M and Arimatsu Y: Intracortical
regionality represented by specific transcription for a novel
protein, latexin. Eur J Neurosci. 6:973–982. 1994. View Article : Google Scholar : PubMed/NCBI
|
|
12
|
Liu Q, Yu L, Gao J, Fu Q, Zhang J, Zhang
P, Chen J and Zhao S: Cloning, tissue expression pattern and
genomic organization of latexin, a human homologue of rat
carboxypeptidase A inhibitor. Mol Biol Rep. 27:241–246. 2000.
View Article : Google Scholar : PubMed/NCBI
|
|
13
|
Aagaard A, Listwan P, Cowieson N, Huber T,
Ravasi T, Wells CA, Flanagan JU, Kellie S, Hume DA, Kobe B and
Martin JL: An inflammatory role for the mammalian carboxypeptidase
inhibitor latexin: relationship to cystatins and the tumor
suppressor TIG1. Structure. 13:309–317. 2005. View Article : Google Scholar : PubMed/NCBI
|
|
14
|
Pallarès I, Bonet R, García-Castellanos R,
Ventura S, Avilés FX, Vendrell J and Gomis-Rüth FX: Structure of
human carboxypeptidase A4 with its endogenous protein inhibitor,
latexin. Proc Natl Acad Sci USA. 102:3978–3983. 2005.PubMed/NCBI
|
|
15
|
Jing C, El-Ghany MA, Beesley C, Foster CS,
Rudland PS, Smith P and Ke Y: Tazarotene-induced gene 1 (TIG1)
expression in prostate carcinomas and its relationship to
tumorigenicity. J Natl Cancer Inst. 94:482–490. 2002. View Article : Google Scholar : PubMed/NCBI
|
|
16
|
Liang Y, Jansen M, Aronow B, Geiger H and
Van Zant G: The quantitative trait gene latexin influences the size
of the hematopoietic stem cell population in mice. Nat Genet.
39:178–188. 2007. View
Article : Google Scholar : PubMed/NCBI
|
|
17
|
Mitsunaga K, Kikuchi J, Wada T and
Furukawa Y: Latexin regulates the abundance of multiple cellular
proteins in hematopoietic stem cells. J Cell Physiol.
227:1138–1147. 2012. View Article : Google Scholar : PubMed/NCBI
|
|
18
|
Van Zant G and Liang Y: Natural genetic
diversity as a means to uncover stem cell regulatory pathways. Ann
NY Acad Sci. 1176:170–177. 2009.PubMed/NCBI
|
|
19
|
Ke Y, Xu GW, Hagiwara K, Zhang JM, Ning T,
Wang B, Su XL, Feng LY, Lu GR, Lu YY and Harris CC: Isolation and
sequencing of the target genes induced by chemical carcinogen.
Science in China (Series C). 26:85–91. 1996.
|
|
20
|
Elledge SJ: Cell cycle checkpoints:
preventing an identity crisis. Science. 274:1664–1672. 1996.
View Article : Google Scholar : PubMed/NCBI
|
|
21
|
Sherr CJ: Cancer cell cycles. Science.
274:1672–1677. 1996. View Article : Google Scholar : PubMed/NCBI
|
|
22
|
Li Y, Basang Z, Ding H, et al: Latexin
expression is downregulated in human gastric carcinomas and
exhibits tumor suppressor potential. BMC Cancer. 11:111–121.
2011.PubMed/NCBI
|
|
23
|
Greaves M and Maley CC: Clonal evolution
in cancer. Nature. 481:306–313. 2012. View Article : Google Scholar : PubMed/NCBI
|
|
24
|
Porter PL, Malone KE, Heagerty PJ, et al:
Expression of cell-cycle regulators p27Kip1 and cyclin
E, alone and in combination, correlate with survival in young
breast cancer patients. Nat Med. 3:222–225. 1997.
|
|
25
|
Eastham JA, Hall SJ, Sehgal I, et al: In
vivo gene therapy with p53 or p21 adenovirus for
prostate cancer. Cancer Res. 55:5151–5155. 1995.PubMed/NCBI
|
|
26
|
Craig C, Wersto R, Kim M, et al: A
recombinant adenovirus expressing p27Kip1 induces cell
cycle arrest and loss of cyclin-Cdk activity in human breast cancer
cells. Oncogene. 14:2283–2289. 1997.PubMed/NCBI
|
|
27
|
Chen J, Willingham T, Shuford M, et al:
Effects of ectopic overexpression of p21WAF1/CIP1 on
aneuploidy and the malignant phenotype of human brain tumor cells.
Oncogene. 13:1395–1403. 1996.PubMed/NCBI
|
|
28
|
Hannon GJ and Beach D: p15INK4B
is a potential effector of TGF-β-induced cell cycle arrest. Nature.
371:257–261. 1994.
|
|
29
|
Guan KL, Jenkins CW, Li Y, et al: Growth
suppression by p18, a p16INK4/MTS1- and p14INK4B/MTS2-related CDK6
inhibitor, correlates with wild-type pRb function. Genes Dev.
8:2939–2952. 1994. View Article : Google Scholar : PubMed/NCBI
|
|
30
|
Hirai H, Roussel MF, Kato JY, et al: Novel
INK4 proteins, p19 and p18, are specific inhibitors of the cyclin
D-dependent kinases CDK4 and CDK6. Mol Cell Biol. 15:2672–2681.
1995.PubMed/NCBI
|
|
31
|
Chan FK, Zhang J, Cheng L, et al:
Identification of human and mouse p19, a novel CDK4 and CDK6
inhibitor with homology to p16ink4. Mol Cell Biol. 15:2682–2688.
1995.PubMed/NCBI
|
|
32
|
Sherr CJ and Roberts JM: CDK inhibitors:
positive and negative regulators of G1-phase progression. Genes
Dev. 13:1501–1512. 1999. View Article : Google Scholar : PubMed/NCBI
|
|
33
|
Kiviharju-af Hällström TM, Jäämaa S,
Mönkkönen M, et al: Human prostate epithelium lacks Wee1A-mediated
DNA damage-induced checkpoint enforcement. Proc Natl Acad Sci USA.
104:7211–7216. 2007.PubMed/NCBI
|
|
34
|
Yoshida T, Tanaka S, Mogi A, et al: The
clinical significance of Cyclin B1 and Wee1 expression in
non-small-cell lung cancer. Ann Oncol. 15:252–256. 2004. View Article : Google Scholar : PubMed/NCBI
|
|
35
|
Quelle DE, Ashmun RA, Shurtleff SA, et al:
Overexpression of mouse D-type cyclins accelerates G1 phase in
rodent fibroblasts. Genes Dev. 7:1559–1571. 1993. View Article : Google Scholar : PubMed/NCBI
|