Introduction
Renal cell carcinoma (RCC) is the tenth most common
cancer in men worldwide (1) and the
third most common genitourinary tumor. The use of targeted
therapies has improved treatment of metastatic RCC, but survival
remains significantly decreased in late-stage or metastatic RCC
patients (2).
The molecular carcinogenesis of clear cell renal
cell carcinoma (ccRCC) includes von Hippel-Lindau gene
alterations as gatekeeper mutations that are followed by additional
genetic changes for full development of the cancer (3). In view of the epigenetic progenitor
cancer model, such mutations may be substituted by epigenetic
alterations that cause gene silencing and thus contribute to the
accumulation of epigenetic and genetic alterations, as has been
found for several human malignancies (4). Indeed, a considerable number of loci
undergoing DNA methylation have been identified in ccRCC at a high
frequency. For example, the secreted frizzled-related protein
(SFRP1) and RAS-associated domain family 1 CpG island (CGI)
hypermethylation have been found in 34–68% and 28–76% of RCCs,
respectively (5–7). Hypermethylation of the SCUBE3
gene is associated with clinicopathological para- meters and poorer
survival (8). A genome-wide CGI
methylation analysis by Ricketts et al (9) showed that CGI hypermethylation of
several genes (including SLC34A2 in 63%, OVOL1 in
40%, DLEC in 20%, TMPRSS2 in 26%, SST in 31%
and BMP4 in 35% of RCC) is associated with transcriptional
silencing, reactivation after demethylation in RCC cell lines and
downregulation of expression in RCC.
Recently, we identified GATA5, a member of
the GATA transcription factor family (GATA1 to GATA6), as a new
target for CGI hypermethylation in RCC, also demonstrating a
statistical association with disease progression and decreased
survival. However, since combined bisulfite restriction analysis
detection was applied for methylation detection, only site-specific
average methylation could be assessed (10). Heterogeneous methylation as
determined in the CGI of GREM1 in RCC (11) may lead to varying statistical
associations with clinicopathological parameters; thus, our
previous findings of GATA5 CGI methylation as a potential
prognosticator for RCC would be strengthened if another
GATA5 methylation locus could be identified to demonstrate
association with an unfavorable prognosis. Detecting highly
methylated sequences located in a different subregion of the
GATA5 CGI would provide further evidence for a crucial role
of GATA5 in RCC progression.
In addition, comparing expression and methylation
data from public databases (12),
we noted that GATA3, as a member of the GATA transcription
factor family, might also represent a potential target for CGI
hypermethylation. The GATA1, GATA2 and GATA3 members of the GATA
transcription factor family are functionally involved in cellular
lineage determination (13) while
the GATA4, GATA5 and GATA6 are mainly involved in epithelial
differentiation and are suggested to play a critical role in
tumorigenesis of cancer with endo- or mesodermal origins (13). Furthermore, both mechanisms exhibit
extensive changes in neoplastic development in different cancer
types (14) and loss of GATA3
expression in breast cancer patients has been significantly
associated with poor clinical outcome and advanced tumor disease
(15). Comparing normal and tumor
renal tissues, decreased GATA3 protein and mRNA expression levels
have already been observed, supporting the hypothesis that
GATA3 may be epigenetically silenced in RCC (16).
To clarify the relevance of GATA3 and
GATA5 methylation in RCC, we measured CGI methylation of
both genes in normal human primary tubule epithelial cells and in
renal tumor cell lines, as well as in renal cancer tissues and a
subset of paired adjacent normal tissues, using quantitative
methylation-specific PCR (qMSP). We found that higher methylation
is more likely to be found in tumors of patients with advanced and
metastatic disease and in case of GATA5 is also associated
with poorer survival of RCC patients.
Materials and methods
Tissue specimens
Cross-sectional analyses were conducted on 119 RCC
samples and 87 samples from paired histologically normal-appearing
tissues, i.e., adjacent normal renal tissue. Tissue samples were
collected from patients who had undergone radical or
nephron-sparing nephrectomy and stored as previously described
(17). TNM classification of all
tissues was evaluated according to the Union for International
Cancer Control 2010 classification, and grading was assessed as
previously described (18,19). Localized RCC was defined as pT ≤2,
lymph node (N) and metastasis (M) negative (N0 and M0), and a
grading (G) of 1 and 1–2. Advanced tumors were classified as p ≥T3
and/or lymph node positive (N+), positive for distant metastasis
(M+) or G2–3 and G3. Time to disease recurrence was designated as
the point at which patients had either a local recurrence or a
synchronous/metachronous metastasis as detected by computerized
tomography scan. The local ethics committee approved sample
collection, and informed consent was obtained from each patient.
Clinical and histopathological parameters of tissues are summarized
in Table I. Purchase, culturing,
storage and identity control of cell lines and primary cells were
carried out as previously described (17).
 | Table IClinicopathological data of
patients. |
Table I
Clinicopathological data of
patients.
| Clinicopathological
parameters | GATA3
(%) | GATA5
(%) |
|---|
| Cases in total (all
RCC) | 119 (100) | 109 (100) |
| Histology |
| ccRCC | 86 (72) | 78 (72) |
| papRCC | 24 (20) | 22 (20) |
| Chromophobe/mixed
RCC | 5 (4) | 5 (5) |
| Not
classified | 4 (3) | 4 (4) |
| Gender |
| Female | 42 (35) | 37 (34) |
| Male | 77 (65) | 72 (66) |
| Age (years) |
| Median | 65 (55) | 65 (60) |
| Tumor size |
| In diameter
(cm) | 4.6 | 4.5 |
| Primary tumor
classification |
| pT1 | 11 (9) | 11 (10) |
| pT1a | 35 (29) | 32 (29) |
| pT1b | 19 (16) | 19 (17) |
| pT2 | 8 (7) | 6 (6) |
| pT3 | 5 (4) | 4 (4) |
| pT3a | 11 (9) | 8 (7) |
| pT3b/c | 25 (21) | 24 (22) |
| pT4 | 1 (1) | 1 (1) |
| Not known | 4 (3) | 4 (4) |
| Lymph node
status |
| N0 | 104 (87) | 96 (88) |
| N+ | 15 (13) | 13 (12) |
| Metastasis
classification |
| M0 | 92 (77) | 85 (78) |
| M+ | 27 (23) | 24 (22) |
| Grade |
| Low risk
group |
| G1 | 23 (19) | 22 (20) |
| G1–2 | 16 (13) | 14 (13) |
| G2 | 60 (50) | 57 (52) |
| High risk
group |
| G2–3 | 9 (8) | 7 (6) |
| G3 | 11 (9) | 9 (8) |
| Localized
disease |
| pT ≤2, N0, M0 and
G1; G1–2 | 63 (53) | 58 (53) |
| Advanced
disease |
| pT≥3 and/or N+, M+
or G2–3;G3 | 55 (46) | 50 (46) |
| Not known | 1 (1) | 1 (1) |
| Paired samples |
| All RCC | 87 (73) | 77 (71) |
| ccRCC | 66 (55) | 57 (52) |
Isolation of DNA and bisulfite
conversion
DNA was extracted from frozen tissue sections using
a standard phenol/chloroform extraction method. Bisulfite
conversions and histopathological examination of control sections
were conducted as previously reported (20).
Quantitative methylation-specific
real-time PCR analysis of GATA3 and GATA5 CGI methylation
Methylation analyses of bisulfite-treated genomic
DNA for CGI methylation of GATA3 and GATA5 was
performed by quantitative real-time fluorimetric 5′ exonuclease
methylation-specific PCR assays. Methylation analysis was carried
out as described elsewhere (21).
The qMSP-specific primers 5′-TGTATCGGGACGGA ATCGTT-3′ (forward) and
5′-ACGCGCGCTCTAACCCTT-3′ (reverse) as well as the
Taqman® probe 5′-FAM-AAATAT
AACCGCGACTCCTACCAATTCATTCG-BHQ-3′ were designed using Beacon
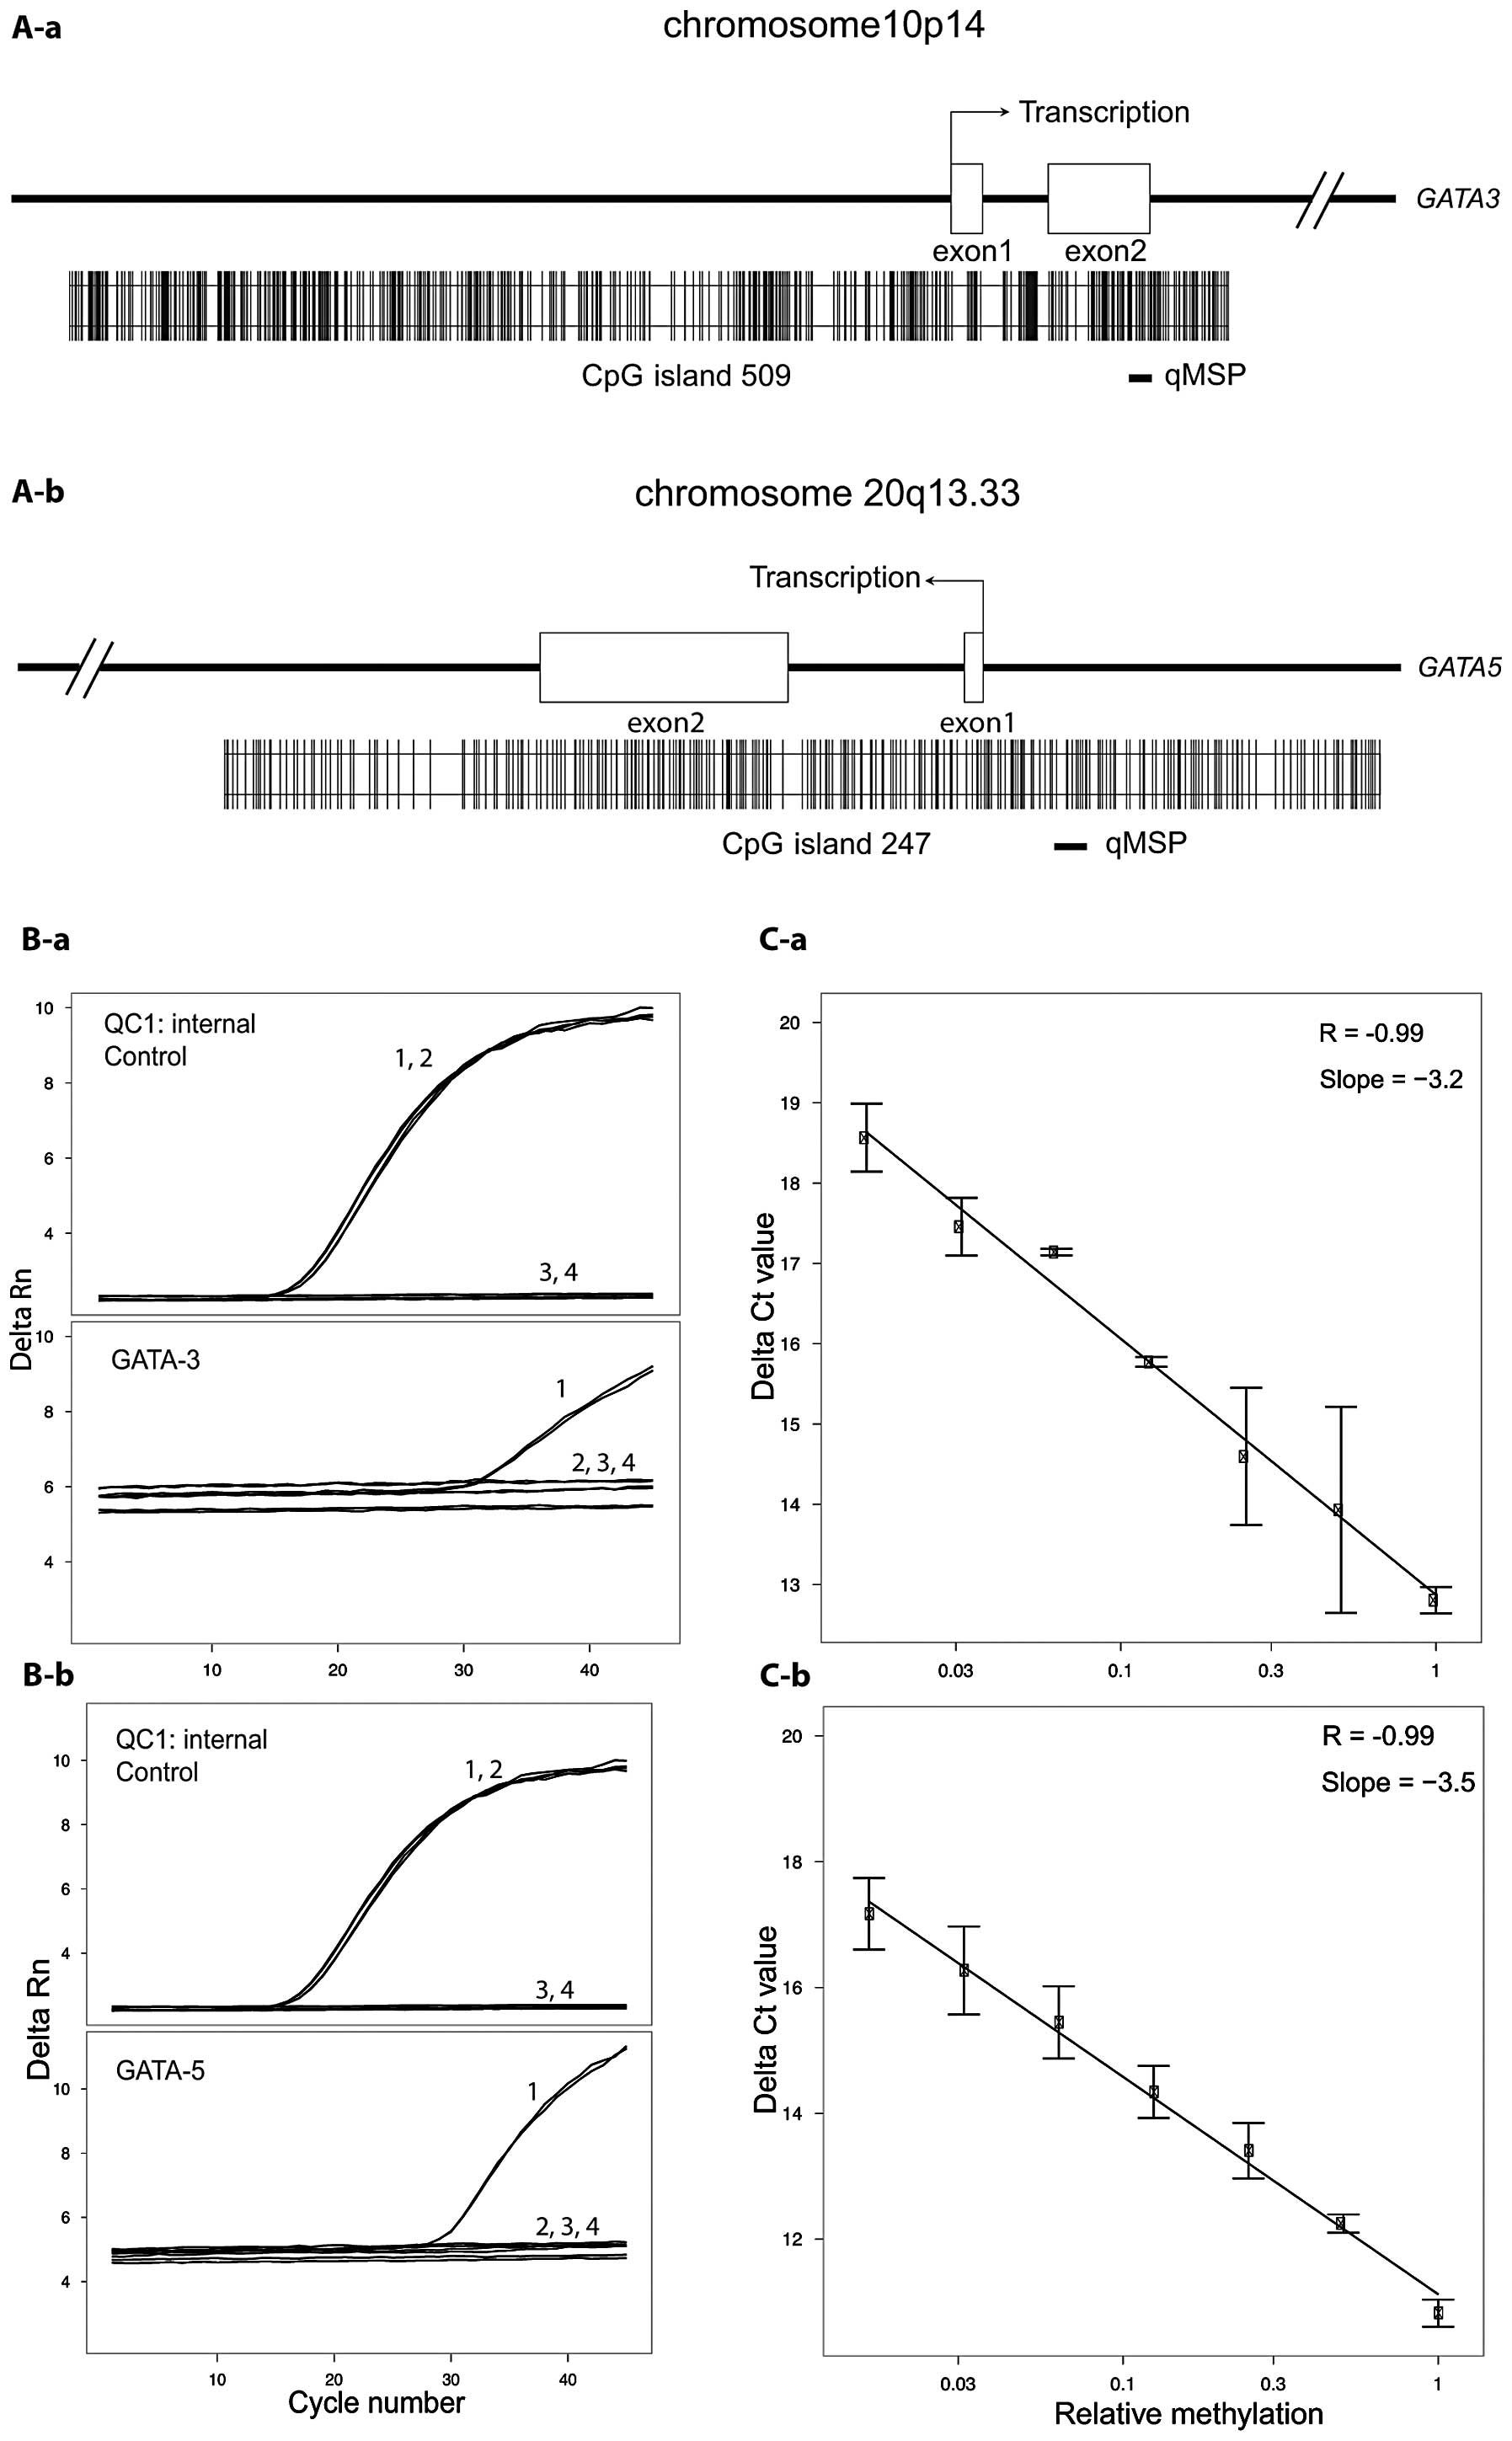
Designer™ software (Premier Biosoft, Palo Alto CA, USA). Intra-CGI
location of both qMSP assays, designed within an area of high GC
percentage, is shown in Fig. 1A-a
(GATA3) and in Fig. 1A-b
(GATA5). Table II shows the
base positions of investigated CpG sites in the corresponding CGI
referenced in the USCS Genome Browser (12,22).
Real-time PCR was carried out in duplicate using a FasTrans
automatic Liquid Handling System (Analytik Jena, Jena, Germany) and
an ABI 7900HT (Life Technologies, Foster City, CA, USA) in 384-well
plates as previously reported (17). An experimenter who was blinded to
type, order and clinicopathological status of samples carried out
measurements.
| Table IIDetailed chromosomal information of
GATA3 and GATA5. |
Table II
Detailed chromosomal information of
GATA3 and GATA5.
| GATA3 | GATA5 |
|---|
| Chromosome | 10p14 | 20q13.33 |
| GeneID | 2625 | 140628 |
| CpG Island |
| No. of CpG
sites | 509 | 247 |
| Base position
(bp) |
8091375–8098329 |
61049362–61051897 |
| bp of CpG sites
investigated by qMSP | 8097735, ~744,
~750, ~796, ~801, ~811, ~831, ~849 | 61051188, ~210,
~223, ~232, ~236, ~241, ~253, ~255, ~262 |
Calculation of relative methylation
indices and statistical analysis
Calculation of the relative degree of methylation
was based on the method of Weisenberger et al, recently
described in detail (21,23). Statistical analyses and definition
of the cut-off value for dichotomization used in survival analysis
were also carried out as previously described (17).
For univariate statistical analyses, all groups were
dichotomized according to their clinicopathological parameters,
i.e., localized (Loc.) vs. advanced (Adv.) disease, metastasis
negative (M0) vs. positive (M+), lymph node metastasis-negative vs.
lymph node metastasis-positive (N0/N+), and low-grade (G1, G1–2)
vs. high-grade (G2–3, G3) tumors.
Results
Measurement of technical controls and
analysis of GATA3 and GATA5 CGI methylation in human normal cells
and cancer cell lines
The specificity of the GATA3 and GATA5
qMSP analyses was evaluated by duplicate measurements of converted
methylated (M), converted non-methylated (U) and non-converted DNA
control samples. For U and non-converted DNA samples, we
exclusively measured Ct values of 45 (undetermined) whereas the M
sample demonstrated Ct values of ~32 for GATA3 (Fig. 1B-a) and Ct values of ~29 for
GATA5 (Fig. 1B-b). None of
the control or CGI-specific qMSP assays gave signals for
non-converted DNA, thus demonstrating that only methylated and
converted DNA was detected. PCR efficiency and linearity of the
methylation detection assays were assessed using a log dilution
series of the M control within the U control DNA and adjusting for
constant total converted DNA amount in PCR reactions. Linear
regression analyses demonstrated a slope of ΔCt = −3.3 per 10-fold
dilution and a coefficient of correlation of r=−0.99 for both genes
(P=0.001), indicating linearity of the assays (Fig. 1C-a and 1C-b).
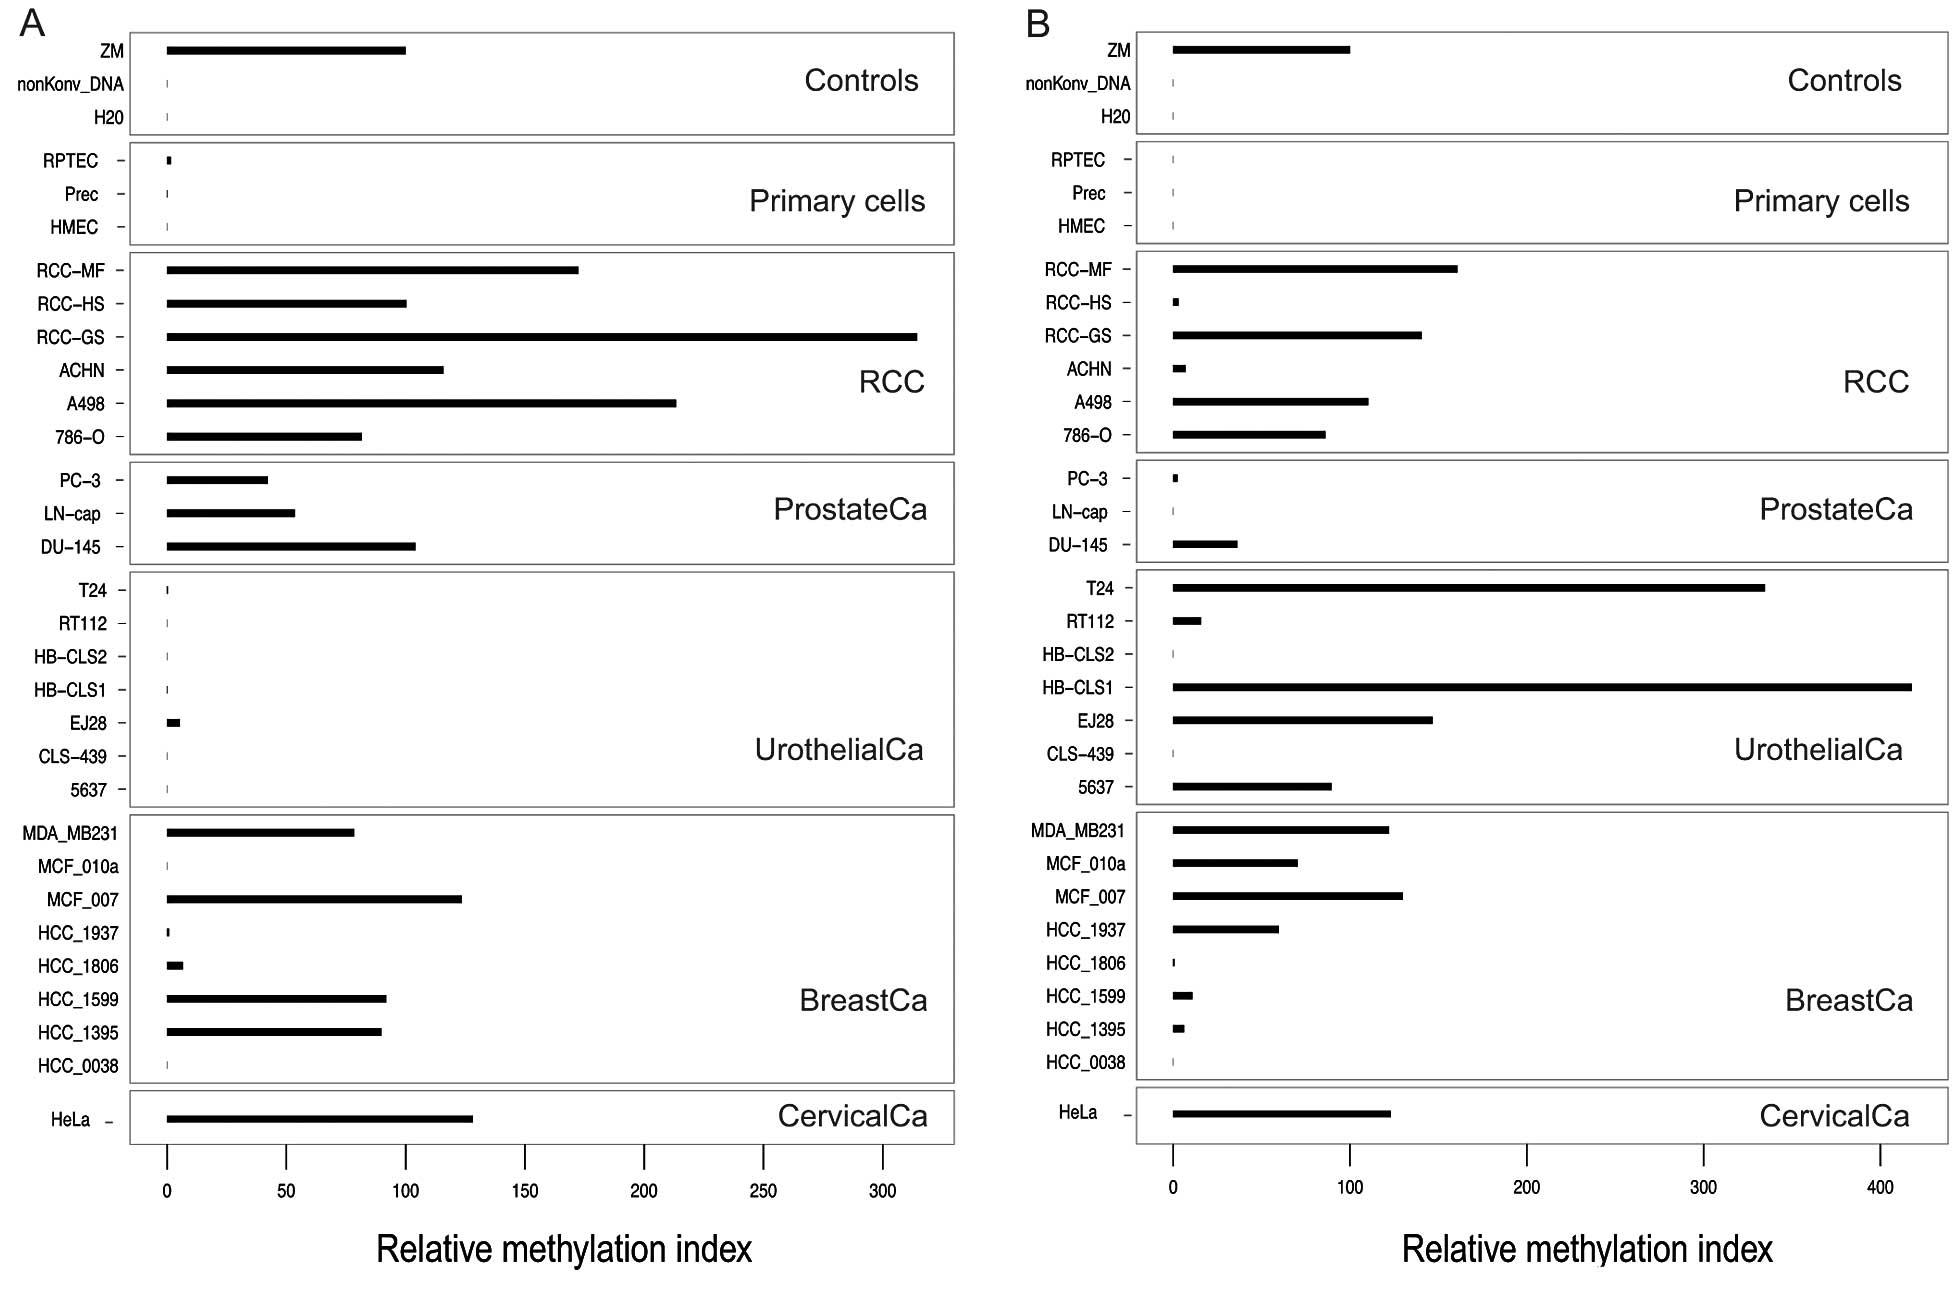
We assessed whether the GATA3 and
GATA5 qMSP assays are capable of methylation detection in
normal human primary tubule epithelial cells and in cancer cell
lines, each respectively used as a proxy for normal tissues and
localized and metastatic human cancers of other origin (kidney,
prostate, bladder, breast and cervical cancer cell lines), which in
part have already been reported to demonstrate tumor specific
hypermethylation. Methylation for GATA3 was found in 5/8
(63%) breast cancer cell lines, as expected from previous reports
describing GATA3 methylation in breast cancer tissue
samples. Notably, all 6 renal cancer cell lines showed high
relative methylation indices while normal primary cells from kidney
(RPTEC), prostate cancer, and mammary tissues demonstrated low or
undetectable methylation (Fig. 2A).
Similarly, GATA5 CGI methylation was not detectable or was
low in normal primary cells but demonstrated higher relative
methylation indices only for 4/6 renal cancer cell lines (Fig. 2B).
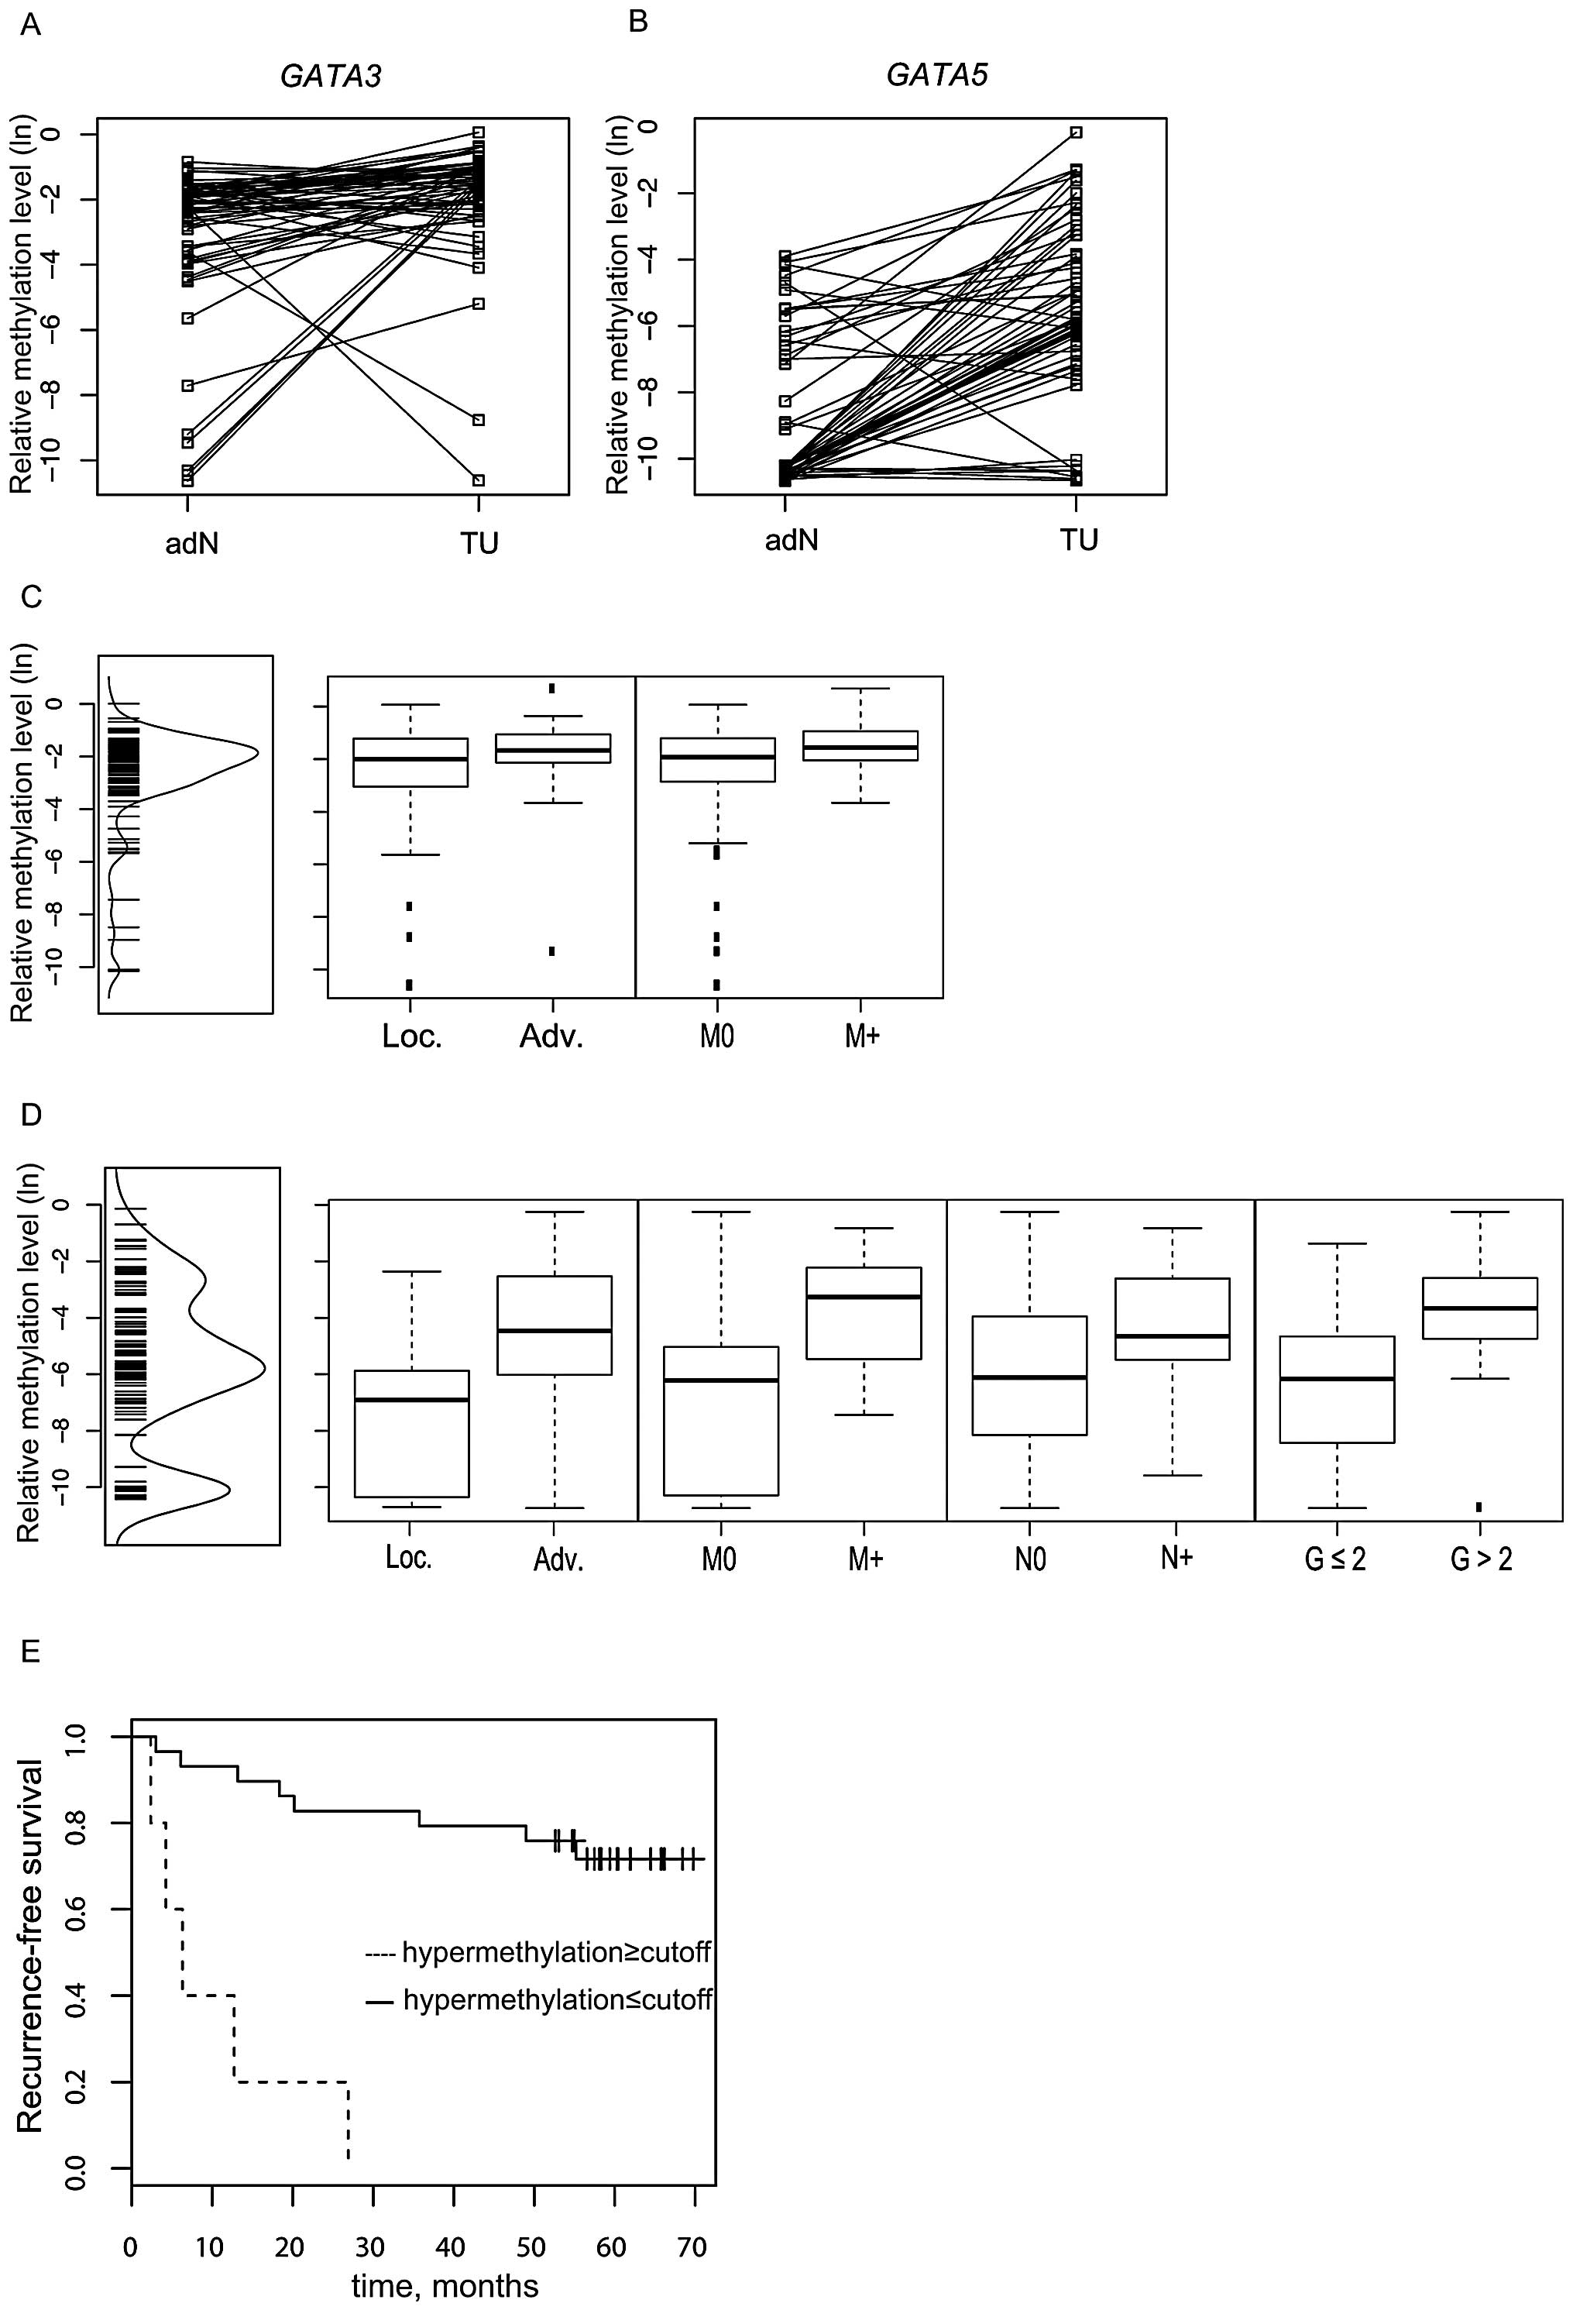
GATA3 and GATA5 CGI is hypermethylated in
RCC
Comparison of GATA3 and GATA5
methylation in matched tumor (TU) and adjacent normal (adN) tissues
demonstrated tumor-specific hypermethylation (Fig. 3A and B). Using the paired t-test for
statistical analysis (Table III),
we found significant differences for GATA3 methylation in
the RCC tissue groups (P=0.006) as well as in the ccRCC subset
(P=0.001). The corresponding analysis of GATA5 methylation
also demonstrated higher methylation in tumor tissues both for the
RCC group (P<0.001) and the ccRCC subset (P<0.001).
| Table IIIStatistical analyses of GATA3
and GATA5 CGI methylation and correlation with
clinicopathological parameters in paired t-test and univariate
logistic regression analysis. |
Table III
Statistical analyses of GATA3
and GATA5 CGI methylation and correlation with
clinicopathological parameters in paired t-test and univariate
logistic regression analysis.
| GATA3 | GATA5 |
|---|
| Paired t-test | P-value | | P-value | |
|---|
| adN/TU | | | | |
| all RCC | 0.006 | |
<0.001 | |
| ccRCC | 0.001 | |
<0.001 | |
|
| Univariate logistic
regression analysis | | OR (95% CI) | | OR (95% CI) |
|
| ccRCC/papRCC | 0.006 | 0.77
(0.63–0.94) | 0.015 | 0.80
(0.67–0.96) |
|
Localized/advanceda |
| all RCC | 0.024 | 1.32
(1.04–1.68) |
<0.001 | 1.55
(1.29–1.88) |
| ccRCC | 0.277 | 1.16
(0.89–1.50) |
<0.001 | 1.46
(1.19–1.80) |
| Metastasis:
M0/M+ |
| all RCC | 0.003 | 1.59
(1.05–2.43) |
<0.001 | 1.65
(1.29–2.11) |
| ccRCC | 0.179 | 1.38
(0.86–2.20) |
<0.001 | 1.64
(1.23–2.17) |
| Grade:
low/highb |
| all RCC | 0.658 | 1.06
(0.82–1.37) | 0.003 | 1.47
(1.14–1.88) |
| ccRCC | 0.542 | 0.92
(0.68–1.21) | 0.009 | 1.54
(1.11–2.14) |
| Lymph node
metastasis: N0/N+ |
| all RCC | 0.187 | 1.36
(0.86–2.14) | 0.03 | 1.32
(1.03–1.68) |
| ccRCC | 0.572 | 1.17
(0.68–2.01) | 0.35 | 1.15
(0.85–1.56) |
Analysis of GATA3 and GATA5 CGI
methylation and association with clinicopathological
parameters
Univariate logistic regression analysis (Table III) of dichotomized groups
revealed a statistically significant association between
methylation of GATA3 and GATA5 CGI with advanced and
metastasized RCC disease. Mean methylation for both CGIs
(GATA3 and GATA5) was significantly higher in
advanced vs. localized (P=0.024 and P<0.001, respectively) and
in metastasis-negative (M0) vs. metastasis-positive (M+) tumors
(P=0.003 and P<0.001, respectively; Fig. 3C and D) of the RCC tissue group. In
addition, GATA5 showed a significantly higher CGI
methylation status in the high-grade tumor and positive lymph node
metastasis (N+) groups compared to low-grade tumor tissues
(P=0.003) or negative lymph node status (P=0.03; Fig. 3D). Comparison of CGI methylation of
GATA3 and GATA5 in ccRCC and papillary renal cell
carcinoma showed significant statistical differences for the mean
GATA3 (P=0.006) and GATA5 (P=0.015) relative
methylation indices observed in both histological entities
(Table III).
GATA5 CGI methylation is independently
associated with decreased recurrence-free survival
Univariate Kaplan-Meier and bivariate Cox
proportional hazard analysis were conducted to elucidate a possible
relationship between GATA3 and GATA5 CGI methylation
and recurrence-free survival (RFS) of RCC patients. GATA3
analysis showed no statistical relationship with survival. In
contrast, univariate Cox regression analysis revealed GATA5
methylation as a strong parameter in the RCC [P<0.001; hazard
ratio (HR) = 17.8; 95% (CI) confidence interval, 4.89–65.1] and
ccRCC (P<0.001; HR = 13; 95% CI, 3.57–47.4; Table IVA) tissue groups. The Kaplan-Meier
analysis with a calculated optimum cut-off of −2.447 for
dichotomization showed that higher CGI methylation of GATA5
is associated with a decreased RFS in patients with ccRCC (Fig. 3E). A pairwise bivariate Cox
regression model demonstrated that the GATA5 CGI methylation
status remained a significant and strong parameter in the bivariate
models when the status of metastasis, advanced tumor disease,
grade, and age were considered as co-variables (Table IVB).
| Table IVUni- and bivariate Cox regression
model analysis of GATA5 CGI methylation. |
Table IV
Uni- and bivariate Cox regression
model analysis of GATA5 CGI methylation.
| A, Univariate Cox
regression analysis of GATA5 CGI methylation and association
with recurrence-free survival in patients with clear cell renal
cell carcinoma |
|---|
|
|---|
| P-value | HR | 95% CI |
|---|
| Methylation |
<0.001 | 13.0 | 3.57–47.4 |
| Status of
metastasis (M0/M+) | 0.012 | 4.07 | 1.36–12.2 |
| Localized vs.
advanceda | 0.061 | 3.44 | 0.94–12.5 |
| Grade
(low/high)b |
<0.001 | 8.46 | 2.49–28.7 |
| Age-Medianc | 0.362 | 0.59 | 0.19–1.82 |
|
| B, GATA5 CGI
methylation analysis in a bivariate Cox regression model and its
association with recurrence-free survival |
|
| P-value | HR | 95% CI |
|
| Methylation |
<0.001 | 19.3 | 4.58–81.6 |
| Status of
metastasis (M0/M+) | 0.004 | 5.8 | 1.73–19.4 |
| Methylation | 0.002 | 9.55 | 2.36–38.7 |
| Localized vs.
advanced | 0.355 | 1.96 | 0.47–8.23 |
| Methylation | 0.04 | 5.35 | 1.1–26.1 |
| Grade
(low/high) | 0.09 | 3.80 | 0.80–18.1 |
| Methylation |
<0.001 | 29.7 | 5.72–154 |
| Age-Medianc | 0.043 | 0.23 | 0.05–0.96 |
Discussion
GATA1, GATA2 and GATA3 from the GATA transcription
factor family are involved in cellular lineage and hematopoietic
development while GATA4, GATA5 and GATA6 are involved in epithelial
and endodermal differentiations (13,24).
GATA proteins have been suggested to play a crucial role in keeping
cells in the undifferentiated state (13). Moreover, previous experiments
(10) as well as in silico
analyses detecting reduced GATA3 and GATA5 mRNA
expression levels suggested that GATA3 and GATA5 are
potential targets of epigenetic alteration in RCC. The present
study has taken a translational approach to investigate the
presence and clinical relevance of CpG island methylation of both
genes for RCC.
Tumor cell lines (renal, bladder, prostate and
breast cancer) revealed distinct CGI methylation patterns for
GATA3 and GATA5 methylation but showed no obvious
overall correlation between the epi-alterations. Notably, both
methylation markers were frequently observed in kidney-derived
tumor cell lines and also demonstrated tumor-specific
hypermethylation in RCC in concordance with results for our paired
group. The present study identified both genes as candidates with a
possible relevance for RCC development. Therefore, our data are in
line with a recent functional study demonstrating that
methylation-dependent silencing of GATA3 expression is correlated
with the loss of transforming growth factor-β receptor III and
tumorigenesis in ccRCC tissues and cell lines, although its role in
disease progression and patient survival remained to be elucidated
(25).
Our study revealed that both GATA3 and
GATA5 showed a highly significant association between CGI
methylation and advanced as well as metastatic RCC. Furthermore,
GATA5 CGI methylation exclusively demonstrated a statistical
association with grade and lymph node status of the primary tumor.
In addition, bivariate Cox regression analysis adjusted for
advanced disease, metastatic status, and grade revealed a high and
fairly stable HR for GATA5 methylation in the bivariate
statistical survival models overall, identifying this epigenetic
mark as a new candidate for independent prognosis of decreased
RFS.
Although a great number of hypermethylated loci have
been identified in RCC (9), to
date, only a subset of CGIs has been functionally or clinically
characterized. A recent study found that a large portion of
clinically relevant epigenetic alterations identified in RCC also
exhibit functional changes in kidney cancer (8). Hence, pre-selection of CGIs based on
their statistical association with clinical factors could represent
an efficient means of narrowing the pool of candidate
epi-alterations affecting the onset or course of RCC. Only a
limited number of methylation-based independent candidate
prognosticators including BNC1, COL14A1,
SFRP1, SCUBE3, GREM1 and DAL-1/4.1b
(6,8,10,11,26)
have thus far been reported. Therefore, our results identify
GATA5 as a new candidate prognosticator gene and suggest its
functional relevance in the progression of RCC.
We observed a noticeable difference of approximately
two orders of magnitude in the median relative methylation values
detected for GATA3 and GATA5 CGIs in tumor compared
to adjacent normal renal tissues. Considering that histological
assessment of control sections ensured a minimum tumor cell content
of at least 50% and that identical samples have been measured, a
variation in tumor cell content as a possible explanation can be
ruled out. Instead, we infer that a different methylation
characteristic is present in both CGIs, as detected by qMSP
specifically measuring completely methylated sequences. Moreover,
as the present study only considered single regions within the
analyzed CGIs, we cannot rule out that other methylation marks may
exist that exhibit significant associations with
clinicopathological parameters, bearing in mind that a recent
report has shown such intra-CGI variations (11).
The present study identified GATA3 and
GATA5 methylation as a common and cancer-specific event in
RCC. The association with late-stage disease and for GATA5
with shortened RFS suggests these targets as biomarkers for
biological aggressiveness of RCC and, in case of GATA5, as a
candidate prognosticator.
Acknowledgements
We thank Margrit Hepke and Christel Reese for the
technical assistance.
References
|
1
|
Jemal A, Bray F, Center MM, Ferlay J, Ward
E and Forman D: Global cancer statistics. CA Cancer J Clin.
61:69–90. 2011. View Article : Google Scholar
|
|
2
|
Ljungberg B: Prognostic factors in renal
cell carcinoma. Urologe A. 43(Suppl 3): S119–S120. 2004. View Article : Google Scholar : PubMed/NCBI
|
|
3
|
Kaelin WG Jr: The von Hippel-Lindau tumor
suppressor gene and kidney cancer. Clin Cancer Res. 10:6290S–6295S.
2004. View Article : Google Scholar : PubMed/NCBI
|
|
4
|
Feinberg AP, Ohlsson R and Henikoff S: The
epigenetic progenitor origin of human cancer. Nat Rev Genet.
7:21–33. 2006. View
Article : Google Scholar : PubMed/NCBI
|
|
5
|
Dahl E, Wiesmann F, Woenckhaus M, et al:
Frequent loss of SFRP1 expression in multiple human solid tumours:
association with aberrant promoter methylation in renal cell
carcinoma. Oncogene. 26:5680–5691. 2007. View Article : Google Scholar : PubMed/NCBI
|
|
6
|
Morris MR, Ricketts C, Gentle D, et al:
Identification of candidate tumour suppressor genes frequently
methylated in renal cell carcinoma. Oncogene. 29:2104–2117. 2010.
View Article : Google Scholar : PubMed/NCBI
|
|
7
|
Peters I, Rehmet K, Wilke N, et al:
RASSF1A promoter methylation and expression analysis in normal and
neoplastic kidney indicates a role in early tumorigenesis. Mol
Cancer. 6:492007. View Article : Google Scholar : PubMed/NCBI
|
|
8
|
Morris MR, Ricketts CJ, Gentle D, et al:
Genome-wide methylation analysis identifies epigenetically
inactivated candidate tumour suppressor genes in renal cell
carcinoma. Oncogene. 30:1390–1401. 2011. View Article : Google Scholar
|
|
9
|
Ricketts CJ, Morris MR, Gentle D, et al:
Genome-wide CpG island methylation analysis implicates novel genes
in the pathogenesis of renal cell carcinoma. Epigenetics.
7:278–290. 2012. View Article : Google Scholar : PubMed/NCBI
|
|
10
|
Atschekzei F, Hennenlotter J, Janisch S,
et al: SFRP1 CpG island methylation locus is associated with
renal cell cancer susceptibility and disease recurrence.
Epigenetics. 7:447–457. 2012. View Article : Google Scholar
|
|
11
|
van Vlodrop IJ, Baldewijns MM, Smits KM,
et al: Prognostic significance of Gremlin1 (GREM1) promoter
CpG island hypermethylation in clear cell renal cell carcinoma. Am
J Pathol. 176:575–584. 2010.
|
|
12
|
Kent WJ, Sugnet CW, Furey TS, et al: The
human genome browser at UCSC. Genome Res. 12:996–1006. 2002.
View Article : Google Scholar : PubMed/NCBI
|
|
13
|
Patient RK and McGhee JD: The GATA family
(vertebrates and invertebrates). Curr Opin Genet Dev. 12:416–422.
2002. View Article : Google Scholar : PubMed/NCBI
|
|
14
|
Chou J, Provot S and Werb Z: GATA3 in
development and cancer differentiation: cells GATA have it! J Cell
Physiol. 222:42–49. 2010.
|
|
15
|
Abba MC, Nunez MI, Colussi AG, Croce MV,
Segal-Eiras A and Aldaz CM: GATA3 protein as a MUC1
transcriptional regulator in breast cancer cells. Breast Cancer
Res. 8:R642006. View
Article : Google Scholar : PubMed/NCBI
|
|
16
|
Tavares TS, Nanus D, Yang XJ and Gudas LJ:
Gene microarray analysis of human renal cell carcinoma: the effects
of HDAC inhibition and retinoid treatment. Cancer Biol Ther.
7:1607–1618. 2008. View Article : Google Scholar : PubMed/NCBI
|
|
17
|
Gebauer K, Peters I, Dubrowinskaja N, et
al: Hsa-mir-124–3 CpG island methylation is associated with
advanced tumours and disease recurrence of patients with clear cell
renal cell carcinoma. Br J Cancer. 108:131–138. 2013.
|
|
18
|
Sobin LH and Compton CC: TNM seventh
edition: what’s new, what’s changed: communication from the
International Union Against Cancer and the American Joint Committee
on Cancer. Cancer. 116:5336–5339. 2010.
|
|
19
|
Thoenes W and Storkel S: Pathology of
benign and malignant renal cell tumors. Urologe A. 30:W41–W50.
1991.(In German).
|
|
20
|
Peters I, Eggers H, Atschekzei F, et al:
GATA5 CpG island methylation in renal cell cancer: a
potential biomarker for metastasis and disease progression. BJU
Int. 110:E144–E152. 2012. View Article : Google Scholar
|
|
21
|
Weisenberger DJ, Siegmund KD, Campan M, et
al: CpG island methylator phenotype underlies sporadic
microsatellite instability and is tightly associated with BRAF
mutation in colorectal cancer. Nat Genet. 38:787–793. 2006.
View Article : Google Scholar
|
|
22
|
Lander ES, Linton LM, Birren B, et al:
Initial sequencing and analysis of the human genome. Nature.
409:860–921. 2001. View Article : Google Scholar : PubMed/NCBI
|
|
23
|
Weisenberger DJ, Campan M, Long TI, et al:
Analysis of repetitive element DNA methylation by MethyLight.
Nucleic Acids Res. 33:6823–6836. 2005. View Article : Google Scholar : PubMed/NCBI
|
|
24
|
Graf T and Enver T: Forcing cells to
change lineages. Nature. 462:587–594. 2009. View Article : Google Scholar : PubMed/NCBI
|
|
25
|
Cooper SJ, Zou H, Legrand SN, et al: Loss
of type III transforming growth factor-β receptor expression is due
to methylation silencing of the transcription factor GATA3 in renal
cell carcinoma. Oncogene. 29:2905–2915. 2010.
|
|
26
|
Yamada D, Kikuchi S, Williams YN, et al:
Promoter hypermethylation of the potential tumor suppressor
DAL-1/4.1B gene in renal clear cell carcinoma. Int J Cancer.
118:916–923. 2006. View Article : Google Scholar : PubMed/NCBI
|