Introduction
Reactive oxygen species (ROS) are a group of oxygen
moieties, which include hydrogen peroxide
(H2O2), the superoxide anion
(O2•−) and the hydroxyl radical
(•OH). Conventional theory has regarded ROS as
deleterious or harmful to cells (1). However, it has become clear that ROS
delicately regulate many cellular functions such as gene
expression, differentiation and cell proliferation (2). They can also act as second messengers,
influencing discrete signal transduction pathways in a variety of
systems (3,4). ROS are continuously generated by the
respiratory chain during oxidative phosphorylation in the form of
the O2•− and/or are specifically produced by
oxidases such as nicotine adenine diphosphate oxidase and xanthine
oxidase (5).
O2•− is metabolized to
H2O2 by superoxide dismutases (SODs)
(6). Moreover,
H2O2 by catalase or glutathione (GSH)
peroxidase yields O2 and H2O (7). Since a change in the redox state of a
tissue implies an alteration in ROS generation or metabolism,
cellular ROS are tightly regulated to prevent tissue damage.
Oxidative stress may be the consequence of either overproduction of
ROS and/or downregulation of antioxidants; this stress is believed
to be responsible for a variety of pathological conditions such as
inflammation, cardiovascular disease and cancer (8–11).
Compared with other members of ROS,
H2O2 plays a pivotal role since it is able to
freely travel through biological membranes to a distance of several
cell diameters and interacts with ferrous iron (Fenton chemistry)
causing the formation of the very aggressive and short-lived
•OH. Tissue concentrations of H2O2
for the period of inflammation have been likely to reach close to
millimolar levels whereas tiny amounts of
H2O2 generated by NADPH oxidase are assumed
to take action only in microenvironments of the plasma membrane
such as lipid rafts (12,13). Nevertheless, in both cases,
H2O2 may amend essential cellular functions
of cell growth, proliferation and differentiation via altering
signaling cascades and gene expression, or its higher level may
lead to outcomes such as apoptosis or necrosis. Exogenous
H2O2 is often applied as the representative
ROS in modeling oxidative stress in the cell and tissue.
The mechanism of apoptosis generally involves two
signaling pathways, the mitochondrial pathway and the cell death
receptor pathway (14–16). The key constituent in the
mitochondrial pathway is the efflux of cytochrome c from
mitochondria to the cytosol, where it subsequently forms a complex
(apoptosome) with Apaf-1 and caspase-9, activating other caspases
including caspase-3 and -7 (17).
The cell death receptor pathway is characterized by binding cell
death ligands such as TNFα and Fas and their cell death receptors,
and subsequently activates caspase-8 and -3 (18,19).
Particularly, cytosolic BID is cleaved by caspase-8 to generate a
truncated product (tBID), which translocates to the mitochondria
and decreases mitochondrial membrane potential (MMP;
ΔΨm) resulting in release of cytochrome c.
Therefore, crosstalk between both apoptotic pathways is manifested
by the tBID. Caspase-3 is an executioner caspase, whose activation
can systematically dismantle cells by cleaving key proteins such as
poly(ADP-ribose) polymerase (PARP).
Cervical cancer is a major cause of cancer-related
death in women worldwide, and the occurrence of this cancer is
ascribed to changes in cancer-related genes as well as
environmental events including viral infections. The carcinogenesis
of cervical cancer has been known to be tightly linked to tissue
inflammation mediated by ROS. Moreover, ROS influence genetic and
epigenetic changes thereby modulating cellular proliferation and
differentiation (11).
H2O2-induced cytotoxicity in cervical cancer
cells may be of toxicological research interest. Thus, in the
present study, the effects of exogenous H2O2
on cell growth and death in human cervix adenocarcinoma HeLa cells
were investigated and the anti-apoptotic effects of various caspase
(pan-caspase, caspase-3, -8 or -9) inhibitors on
H2O2-treated HeLa cells were evaluated in
relation to changes in ROS and GSH levels.
Materials and methods
Cell culture
Human cervical adenocarcinoma HeLa cells were
obtained from the American Type Culture Collection (ATCC; Manassas,
VA, USA) and maintained in a humidified incubator containing 5%
CO2 at 37°C. HeLa cells were cultured in RPMI-1640
supplemented with 10% fetal bovine serum (FBS) (both from
Sigma-Aldrich Chemical Co., St. Louis, MO, USA) and 1%
penicillin-streptomycin (Gibco-BRL, Grand Island, NY, USA). Cells
were routinely grown in 100-mm plastic tissue culture dishes (Nunc,
Roskilde, Denmark) and harvested with a solution of trypsin-EDTA
while in a logarithmic phase of growth.
Reagents
H2O2 was purchased from
Sigma-Aldrich Chemical Co. The pan-caspase inhibitor (Z-VAD-FMK;
benzyloxycarbonyl-Val-Ala-Asp-fluoromethylketone), caspase-3
inhibitor (Z-DEVD-FMK;
benzyloxycarbonyl-Asp-Glu-Val-Asp-fluoromethylketone), caspase-8
inhibitor (Z-IETD-FMK;
benzyloxycarbonyl-Ile-Glu-Thr-Asp-fluoromethylketone) and caspase-9
inhibitor (Z-LEHD-FMK;
benzyloxycarbonyl-Leu-Glu-His-Asp-fluoromethylketone) were obtained
from R&D Systems, Inc. (Minneapolis, MN, USA) and were
dissolved in dimethyl sulfoxide (DMSO; Sigma-Aldrich Chemical Co.).
Based on a previous study (20),
cells were pretreated with each caspase inhibitor for 1 h prior to
treatment with H2O2. DMSO (0.2%) was used as
a control vehicle and it did not appear to affect cell growth or
death.
Cell growth and cell number assays
Cell growth changes were determined by measuring the
absorbance of 3-(4,5-dimethylthiazol-2-yl)-2,5-diphenyltetrazolium
bromide dye (MTT; Sigma-Aldrich Chemical Co.) in living cells as
described previously (21). Changes
in the numbers of viable and dead cells were determined by trypan
blue cell counting. In brief, 5×10³ cells/well were
seeded in 96-well microtiter plates for the MTT assays and
3×10⁵ cells/well were seeded in 24-well plates (both
from Nunc) for cell counting. After exposure to the indicated
amounts of H2O2 for 24 h, the cells in the
96-well plates were used for MTT assays, and the cells in the
24-well plates were collected with trypsin digestion for trypan
blue cell counting. Twenty microliters of MTT solution [2 mg/ml in
phosphate-buffered saline (PBS)] was added to each well of the
96-well plates. The plates were incubated for an additional 4 h at
37°C. Media in plates were withdrawn by pipetting, and 200 μl DMSO
was added to each well to solubilize the formazan crystals. The
optical density was measured at 570 nm using a microplate reader
(Synergy™ 2; BioTek Instruments Inc., Winooski, VT, USA).
Analysis of cell cycle distribution and
sub-G1 phase cells
Cell cycle distribution and sub-G1 cell analysis
were determined by propidium iodide (PI) (Sigma-Aldrich; Ex/Em =
488/617 nm) staining. In brief, 1×10⁶ cells in a 60-mm
culture dish (Nunc) were incubated with the indicated amounts of
H2O2 with or without 15 μM caspase inhibitors
for 1, 6, 12 or 24 h. Total cells including floating cells were
then washed with PBS and fixed in 70% (v/v) ethanol. Cells were
washed again with PBS, and then incubated with PI (10 μg/ml) with
simultaneous RNase treatment at 37°C for 30 min. Cellular DNA
content was measured using a FACStar flow cytometer and analyzed
using Lysis II and CellFit software (both from Becton-Dickinson,
Franklin Lakes, NJ, USA).
Lactate dehydrogenase (LDH) activity for
the detection of necrosis
Necrosis in cells treated with
H2O2 was evaluated using the LDH kit
(Sigma-Aldrich Chemical Co.). In brief, 1×10⁶ cells in a
60-mm culture dish (Nunc) were incubated with the indicated doses
of H2O2 for 24 h. After treatment, the
culture media were collected and centrifuged for 5 min at 1,500
rpm. Fifty microliters of the media supernatant was added to a
fresh 96-well plate along with the LDH assay reagent and then
incubated at room temperature for 30 min. The absorbance values
were measured at 490 nm using a microplate reader (Synergy™ 2). LDH
release was expressed as the percentage of extracellular LDH
activity compared with the control cells.
Annexin V-FITC/PI staining for cell death
detection
Apoptotic cell death was determined by staining the
cells with Annexin V-fluorescein isothiocyanate (FITC; Invitrogen
Life Technologies, Camarillo, CA, USA; Ex/Em = 488/519 nm) as
previously described (22). In
brief, 1×10⁶ cells in a 60-mm culture dish (Nunc) were
incubated with the designated doses of H2O2
with or without 15 μM caspase inhibitors for 1, 6, 12 or 24 h.
Cells were washed twice with cold PBS and then resuspended in 500
μl of binding buffer [10 mM HEPES/NaOH (pH 7.4), 140 mM NaCl, 2.5
mM CaCl2] at a concentration of 1×10⁶
cells/ml. Annexin V-FITC (5 μl) and PI (1 μg/ml) were then added,
and the cells were analyzed with a FACStar flow cytometer. Viable
cells were negative for both PI and Annexin V; apoptotic cells were
positive for Annexin V and negative for PI whereas late apoptotic
dead cells display both high Annexin V and PI labeling. Nonviable
cells, which underwent necrosis, were positive for PI and negative
for Annexin V.
Measurement of mitochondrial membrane
potential (MMP; ΔΨm)
MMP (ΔΨm) levels were measured by
Rhodamine 123 fluorescent dye (Sigma-Aldrich Chemical Co.; Ex/Em =
485/535 nm). In brief, 1×10⁶ cells in a 60-mm culture
dish (Nunc) were incubated with the indicated amounts of
H2O2 with or without 15 μM caspase inhibitors
for 24 h. Cells were washed twice with PBS and incubated with
Rhodamine 123 (0.1 μg/ml) at 37°C for 30 min. Rhodamine 123
staining intensity was determined by a FACStar flow cytometer
(Becton-Dickinson). Rhodamine 123-negative cells indicated the loss
of MMP (ΔΨm) in the cells.
Western blot analysis
The change in caspase-3 and PARP in
H2O2-treated cells was determined by western
blotting. In brief, 1×10⁶ cells in a 60-mm culture dish
(Nunc) were incubated with the indicated amounts of
H2O2 for 24 h. The cells were then washed in
PBS and suspended in five volumes of lysis buffer [20 mM HEPES. (pH
7.9), 20% (v/v) glycerol, 200 mM KCl, 0.5 mM EDTA, 0.5% (v/v)
NP-40, 0.5 mM DTT and 1% (v/v) protease inhibitor cocktail]. The
protein concentrations in the supernatant were determined using the
Bradford method. Samples containing 10 μg total protein were
resolved by 8 or 12.5% SDS-PAGE gels, transferred to Immobilon-P
PVDF membranes (Millipore, Billerica, MA, USA) by electroblotting
and then probed with anti-caspase-3, anti-PARP, anti-β-actin (Santa
Cruz Biotechnology, Santa Cruz, CA, USA) and anti-LC3A/B (Cell
Signaling Technology, Waltham, MA, USA) antibodies. Membranes were
incubated with horseradish peroxidase-conjugated secondary
antibodies. Blots were developed using an ECL kit (Amersham,
Arlington Heights, IL, USA).
Quantification of caspase-3 and -8
activities
The activities of caspase-3 and -8 were assessed
using the Caspase-3 and Caspase-8 Colorimetric Assay Kits (R&D
Systems, Inc.) as previously used (23). In brief, 1×10⁶ cells in a
60-mm culture dish (Nunc) were incubated with 100 μM
H2O2 for 24 h. The cells were then washed in
PBS and suspended in 5 volumes of lysis buffer provided in the
kits. Protein concentrations were determined using the Bradford
method. Supernatant samples containing 50 μg total protein were
used for determination of caspase-3 and -8 activities. These were
added to each well in 96-well microtiter plates (Nunc) with
DEVD-pNA or IETD-pNA as caspase-3 and -8 substrates respectively at
37°C for 1 h. The optical density of each well was measured at 405
nm using a microplate reader (SpectraMax 340; Molecular Devices Co.
Sunnyvale, CA, USA). Caspase-3 and -8 activities were expressed in
arbitrary absorbance units.
Detection of intracellular ROS
levels
Intracellular ROS levels were detected by the
fluorescent probe dye, 2′,7′-dichlorodihydrofluorescein diacetate
(H2DCFDA) (Ex/Em = 495/529 nm; Invitrogen Molecular
Probes, Eugene, OR, USA) at 1, 6, 12 or 24 h. H2DCFDA is
poorly selective for the superoxide anion radical
(O2•−). In contrast, dihydroethidium (DHE)
(Invitrogen Molecular Probes; Ex/Em = 518/605 nm) is a fluorogenic
probe that is highly selective for O2•− among
ROS. In brief, 1×10⁶ cells/ml in FACS tube
(Becton-Dickinson) were treated with 100 μM
H2O2 with or without 15 μM caspase inhibitors
in the presence of 20 μM H2DCFDA or DHE. The
fluorescence levels of DCF and DHE were evaluated using a FACStar
flow cytometer at 1 h. DCF (ROS) and DHE
(O2•−) levels were expressed as mean
fluorescence intensity (MFI), which was calculated by CellQuest
software (Becton-Dickinson). In addition, 1×10⁶ cells in
a 60-mm culture dish (Nunc) were incubated with the indicated
amounts of H2O2 with or without 15 μM caspase
inhibitors for 6, 12 and 24 h. Cells were incubated with 20 μM
H2DCFDA or DHE at 37°C for 30 min. H2DCFDA or
DHE fluorescence was assessed using a FACStar flow cytometer.
Measurement of cellular SOD and catalase
activities
SOD enzyme activity was measured using the SOD assay
kit-WST (Fluka Co., Milwaukee, WI, USA), and catalase enzyme
activity was measured using a catalase assay kit from Sigma-Aldrich
Chemical Co. In brief, 1×10⁶ cells were incubated with
100 μM H2O2 for 24 h. The cells were then
washed in PBS and suspended in 5 volumes of lysis buffer [20 mM
HEPES (pH 7.9), 20% glycerol, 200 mM KCl, 0.5 mM EDTA, 0.5% NP-40,
0.5 mM DTT and 1% protease inhibitor cocktail (from Sigma)]. The
protein concentration of the supernatant was determined by the
Bradford method. Supernatant samples containing 100 μg total
protein were used for determination of SOD and catalase enzyme
activities. These were added to each well in 96-well microtiter
plates (Nunc) with the appropriate working solutions (according to
the manufacturer’s instructions) at 25°C for 30 min. The color
changes were measured at 450 or 520 nm using a microplate reader
(SpectraMax 340). The value for the experimental group was
expressed as a percentage of the control group.
Detection of the intracellular GSH
Cellular GSH levels were analyzed using a
5-chloromethylfluorescein diacetate dye (CMFDA) (Invitrogen
Molecular Probes; Ex/Em = 522/595 nm) at 1, 6, 12, or 24 h. In
brief, 1×10⁶ cells/ml in a FACS tube (Becton-Dickinson)
were treated with 100 μM H2O2 with or without
15 μM caspase inhibitors in the presence of 5 μM CMFDA. The level
of CMF fluorescence was evaluated using a FACStar flow cytometer at
1 h. CMF (GSH) levels were expressed as MFI, which were calculated
by CellQuest software. In addition, 1×10⁶ cells in a
60-mm culture dish (Nunc) were incubated with the indicated amounts
of H2O2 with or without 15 μM caspase
inhibitors for 6, 12 and 24 h. Cells were incubated with 5 μM CMFDA
at 37°C for 30 min. CMF fluorescence was assessed using a FACStar
flow cytometer. Negative CMF staining (GSH depleted) of cells was
expressed as the percentage of (-) CMF cells.
Statistical analysis
The results represent the means of at least two
independent experiments (means ± SD). The data were analyzed using
InStat software (GraphPad Prism4; GraphPad Software, San Diego, CA,
USA). The Student’s t-test or one-way analysis of variance (ANOVA)
with post hoc analysis using Tukey’s multiple comparison test was
used for parametric data. The statistical significance was defined
as p<0.05.
Results
Effects of H2O2 on
cell growth in HeLa cells
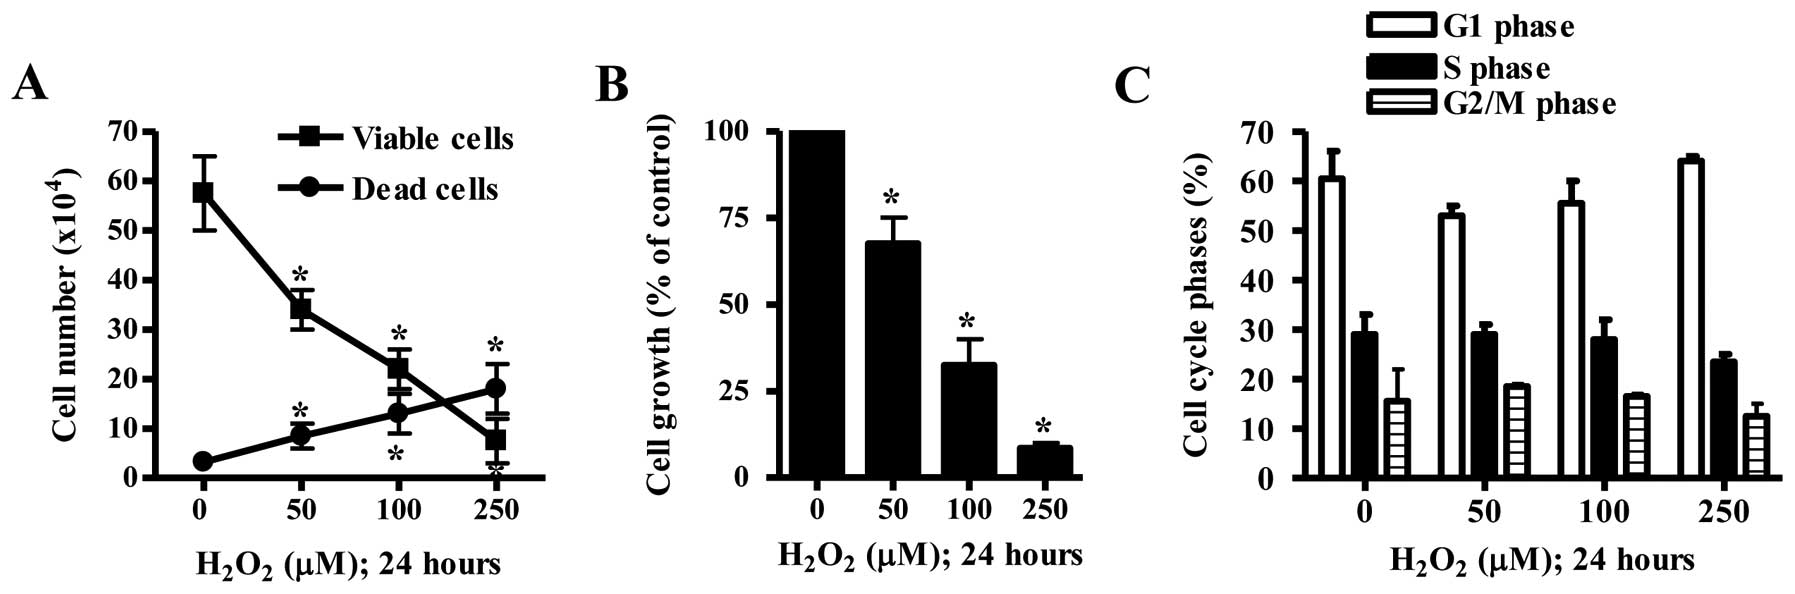
The effect of H2O2 on the
growth of HeLa cells was examined at 24 h. Treatment with 50–250 μM
H2O2 significantly decreased the viable
(trypan blue-negative) cell number in the HeLa cells in a
dose-dependent manner whereas H2O2
dose-dependently increased the number of dead (trypan
blue-positive) cells (Fig. 1A).
Based on the MTT assays, 50–250 μM H2O2
significantly inhibited the growth of HeLa cells with an
IC50 (the half maximal inhibitory concentration) of ~75
μM (Fig. 1B). When the cell cycle
distribution in the H2O2-treated HeLa cells
was examined, none of the tested doses of
H2O2 significantly induced any specific cell
cycle phase arrest when compared with these parameters in the
control cells (Fig. 1C).
Effects of H2O2 on
cell death and MMP (ΔΨm) in HeLa cells
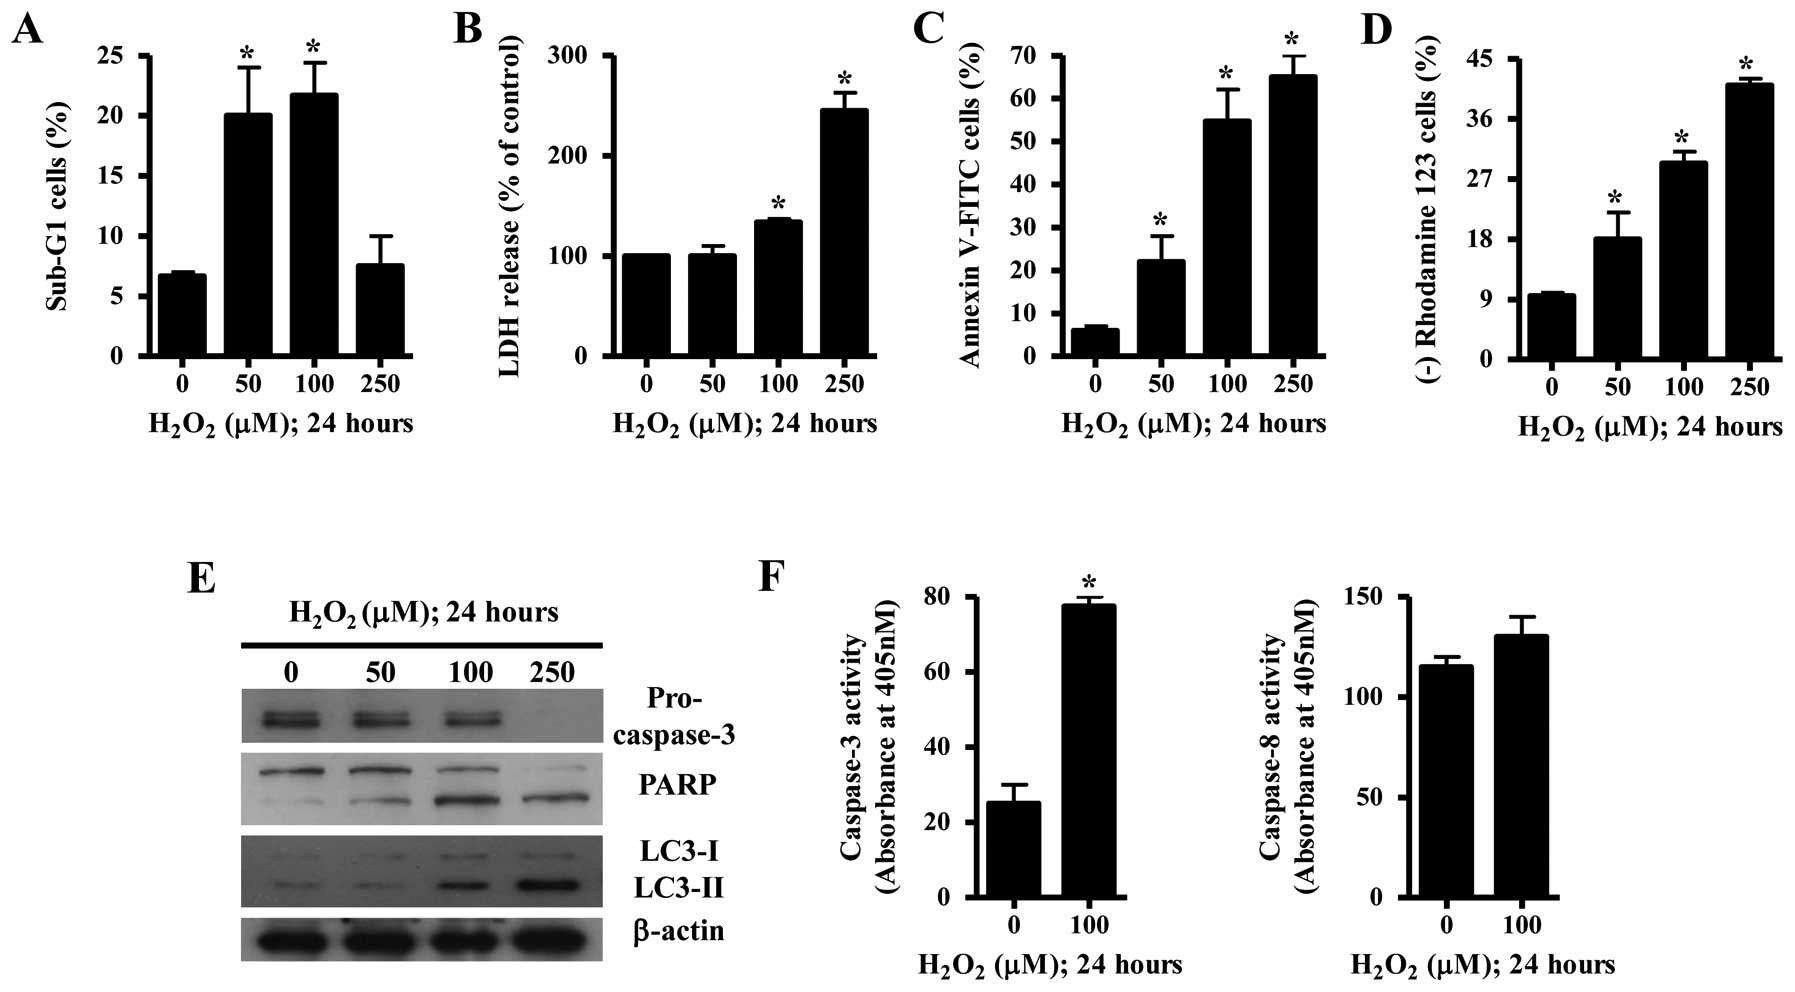
Next, we aimed to ascertain whether the
H2O2-induced cell death was through apoptosis
or necrosis in HeLa cells. While 50 or 100 μM
H2O2 significantly increased the percentages
of sub-G1 cells in HeLa cells, 250 μM H2O2
did not increase the percentages of sub-G1 cells in these cells
(Fig. 2A). Since
H2O2 can induce necrosis in HeLa cells, the
status of necrosis was assessed using the LDH release assay.
Treatment with 100 or 250 μM H2O2
significantly induced LDH release in HeLa cells at 24 h (Fig. 2B). Treatment with 50–250 μM
H2O2 increased the numbers of Annexin
V-FITC-positive cells in the HeLa cells in a dose-dependent manner
(Fig. 2C). Treatment with 100 μM
H2O2 increased the portion of apoptotic cells
(Annexin V-FITC-positive/PI-negative) whereas 250 μM
H2O2 relatively increased the portion of late
apoptotic cells (Annexin V-FITC-positive/PI-positive) (data not
shown). When the effect of H2O2 on MMP
(ΔΨm) in HeLa cells was assessed using Rhodamine 123,
H2O2 dose-dependently induced the loss of MMP
(ΔΨm) (Fig. 2D).
Examination of apoptosis-related protein changes during
H2O2-induced cell death revealed that the
level of pro-caspase-3 was decreased by H2O2
(Fig. 2E). The intact 116-kDa form
of PARP was decreased by H2O2 whereas the
cleaved form was increased (Fig.
2E). Furthermore, autophagy marker light chain 3 (LC3) was
converted to LC3-II in the 100 and 250 μM
H2O2-treated HeLa cells, indicating that
H2O2 induced autophagy in the HeLa cells
(Fig. 2E). The activity of
caspase-3 was increased in H2O2-treated HeLa
cells whereas that of caspase-8 was slightly increased (Fig. 2F).
Effects of caspase inhibitors on the
apoptosis of H2O2-treated HeLa cells
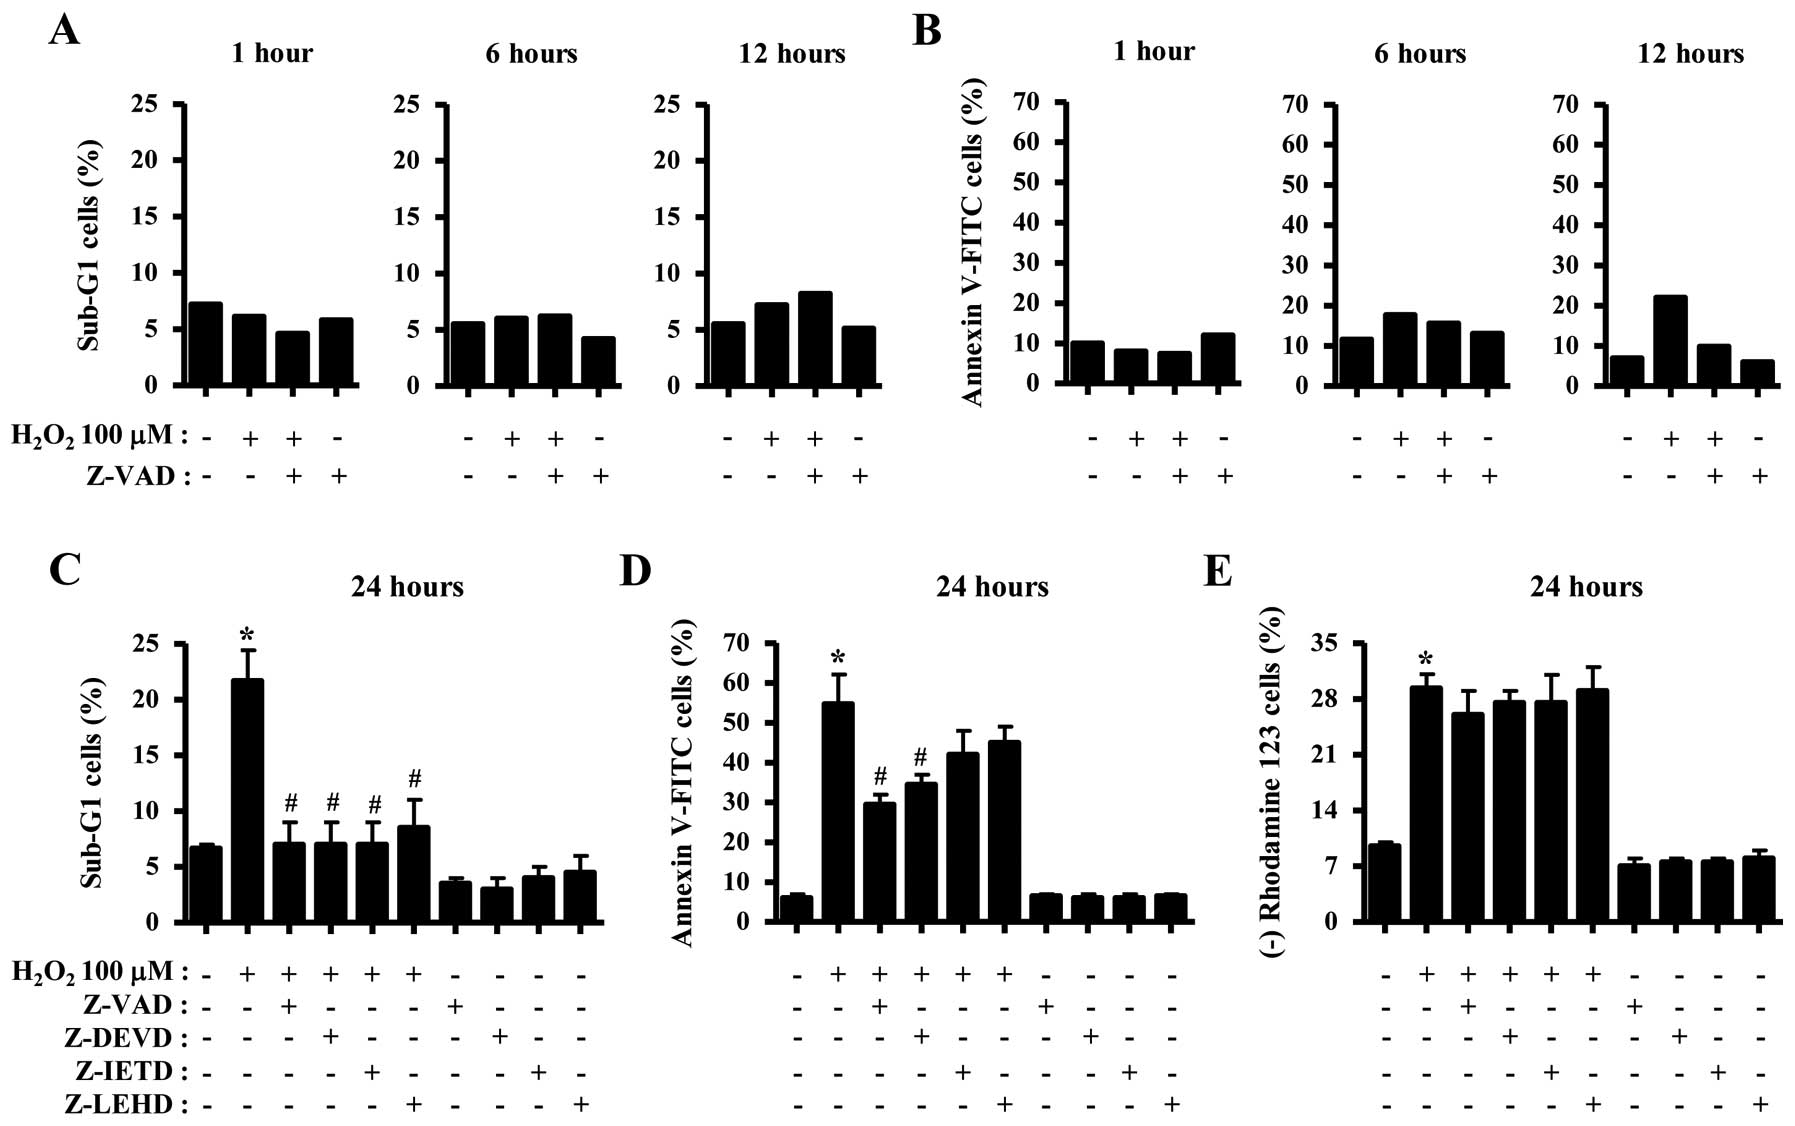
We investigated whether caspases are required for
H2O2-induced apoptosis. Based on a previous
study (20), HeLa cells were
pretreated with 15 μM of caspase inhibitor for 1 h prior to
treatment with H2O2. Treatment with 100 μM
H2O2 did not significantly increase the
percentages of sub-G1 cells in the HeLa cells at 1, 6 or 12 h, and
the pan-caspase inhibitor (Z-VAD) did not affect the percentages at
these times (Fig. 3A).
H2O2 increased the numbers of Annexin
V-FITC-positive cells in the HeLa cells at 6 and 12 h, and Z-VAD
markedly reduced the number at 12 h (Fig. 3B). Moreover, treatment with all of
the tested caspase inhibitors (Z-VAD, Z-DEVD for caspase-3, Z-IETD
for caspase-8 and Z-LEHD for caspase-9) showed the marked rescue of
HeLa cells from H2O2-induced cell death at 24
h, as measured by the population of sub-G1 cells (Fig. 3C). In addition, these inhibitors
decreased the numbers of Annexin V-FITC-positive cells in the
H2O2-treated HeLa cells at 24 h, and Z-VAD
particularly showed a strong effect (Fig. 3D). However, none of the caspase
inhibitors significantly prevented the loss of MMP (ΔΨm)
by H2O2 (Fig.
3E). In relation to the 250 μM
H2O2-treated HeLa cells, 250 μM
H2O2 seemed to slightly increase the numbers
of sub-G1 cells at 6, 12 and 24 h but not at 1 h (data not shown).
Z-VAD did not decrease the numbers at these times but instead it
increased the number at 12 h (data not shown). In addition,
H2O2 increased the numbers of Annexin
V-FITC-positive cells in the HeLa cells at 6, 12 and 24 h (data not
shown). Z-VAD did not reduce the percentages of Annexin
V-FITC-positive cells in the 250 μM
H2O2-treated HeLa cells but it increased the
number of Annexin V-FITC-positive cells in these cells at 24 h
(data not shown). These results indicated that the caspase
inhibitors did not protect HeLa cell death induced by 250 μM
H2O2.
Effects of H2O2 on
intracellular ROS and GSH levels in HeLa cells
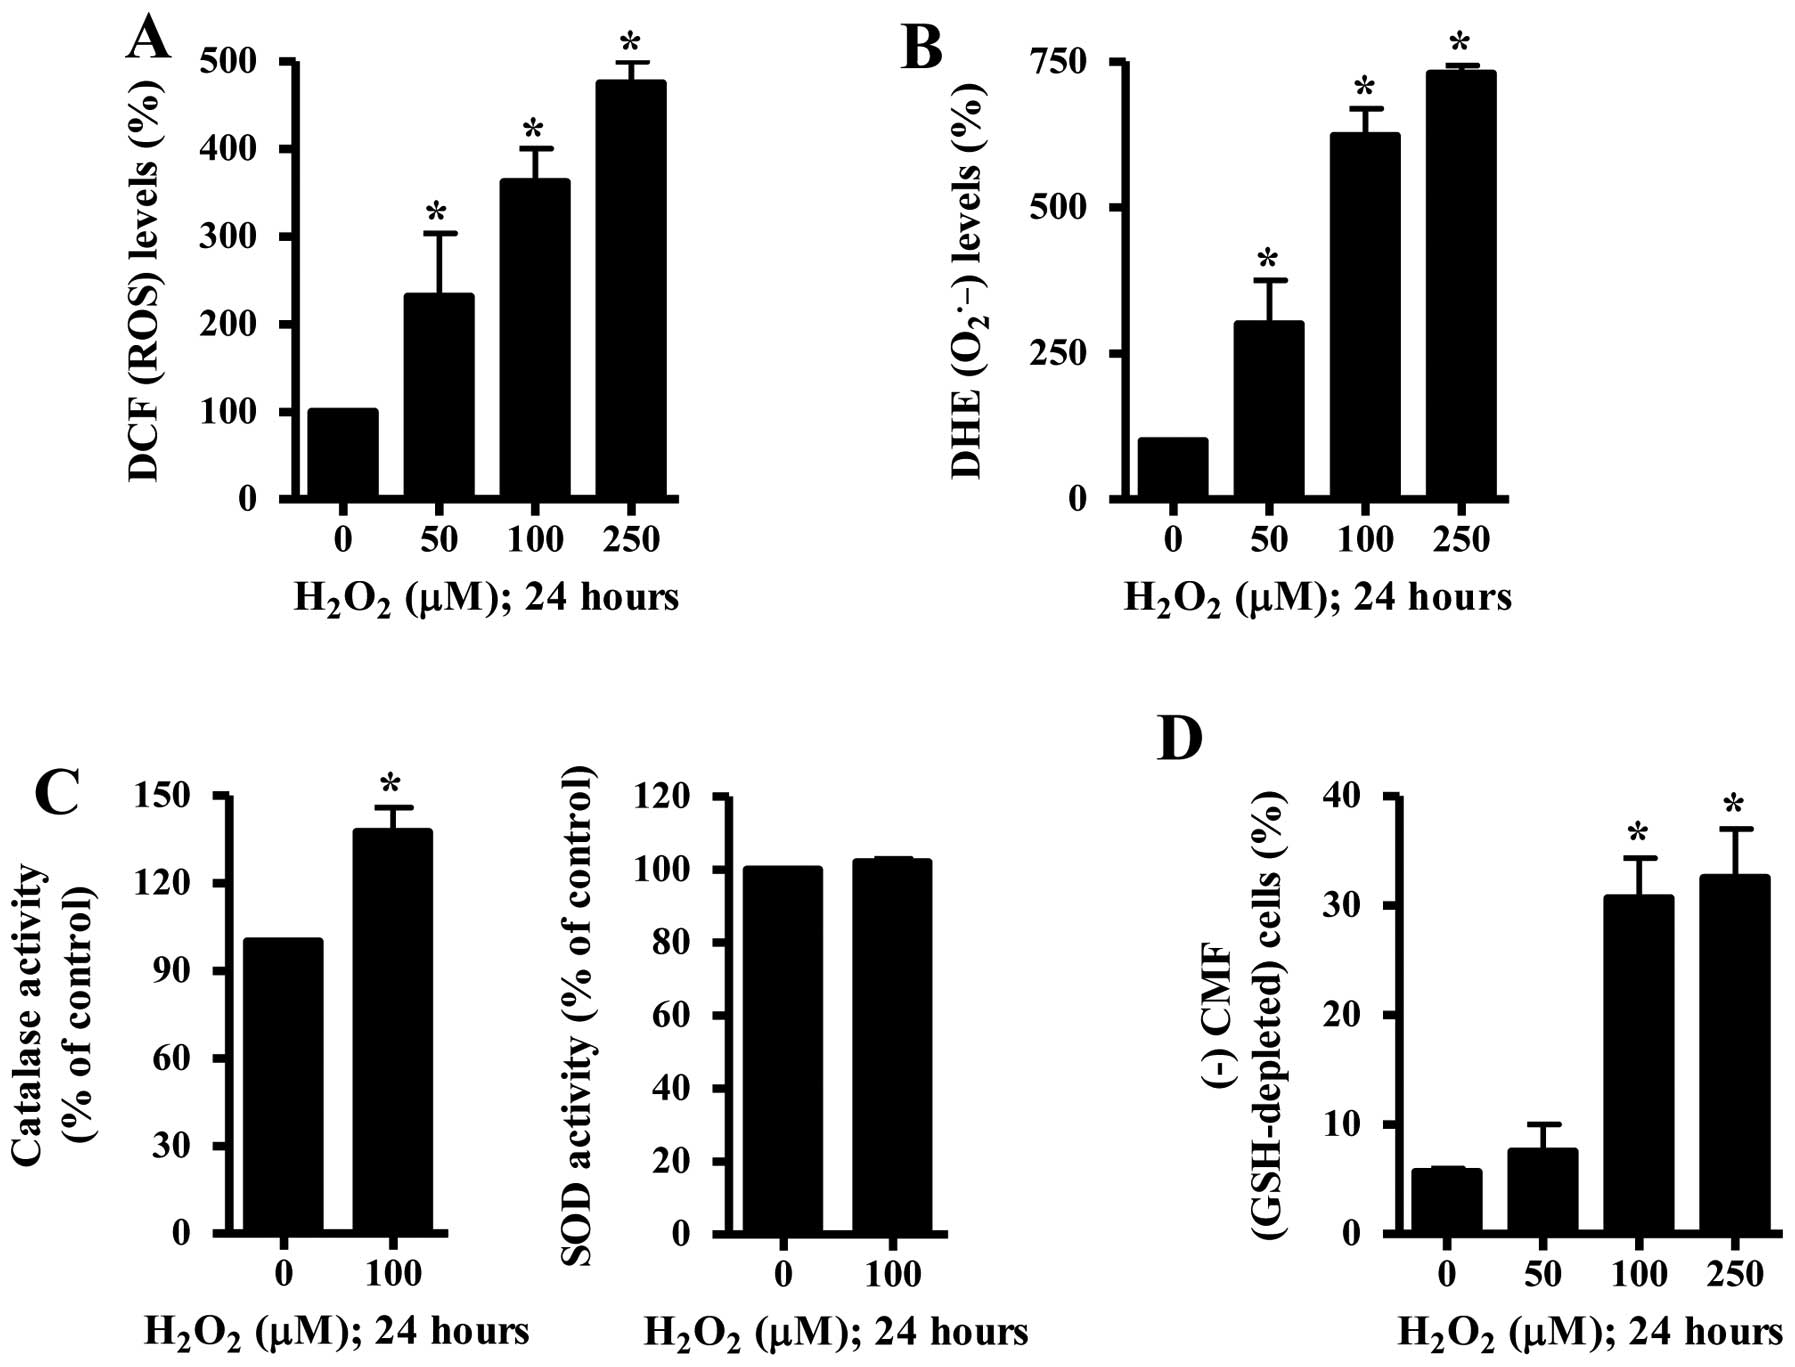
To assess the intracellular ROS levels in the
H2O2-treated HeLa cells, H2DCFDA
and DHE dyes were used. All the tested doses of
H2O2 increased the ROS (DCF) level in the
HeLa cells at 24 h (Fig. 4A). The
level of DHE fluorescence dye, which specifically reflects
O2•− accumulation in cells, was also
increased in the H2O2-treated HeLa cells
(Fig. 4B). Furthermore, the
activities of SOD and catalase in the
H2O2-treated HeLa cells were measured. As
shown in Fig. 4C, 100 μM
H2O2 increased the activity of catalase but
did not alter the activity of SOD. Following the measurement of
intracellular GSH levels in the H2O2-treated
HeLa cells using a CMFDA dye, 100 or 250 μM
H2O2 increased the GSH-depleted cell number
in HeLa cells at 24 h while 50 μM H2O2 did
not significantly induce GSH depletion (Fig. 4D).
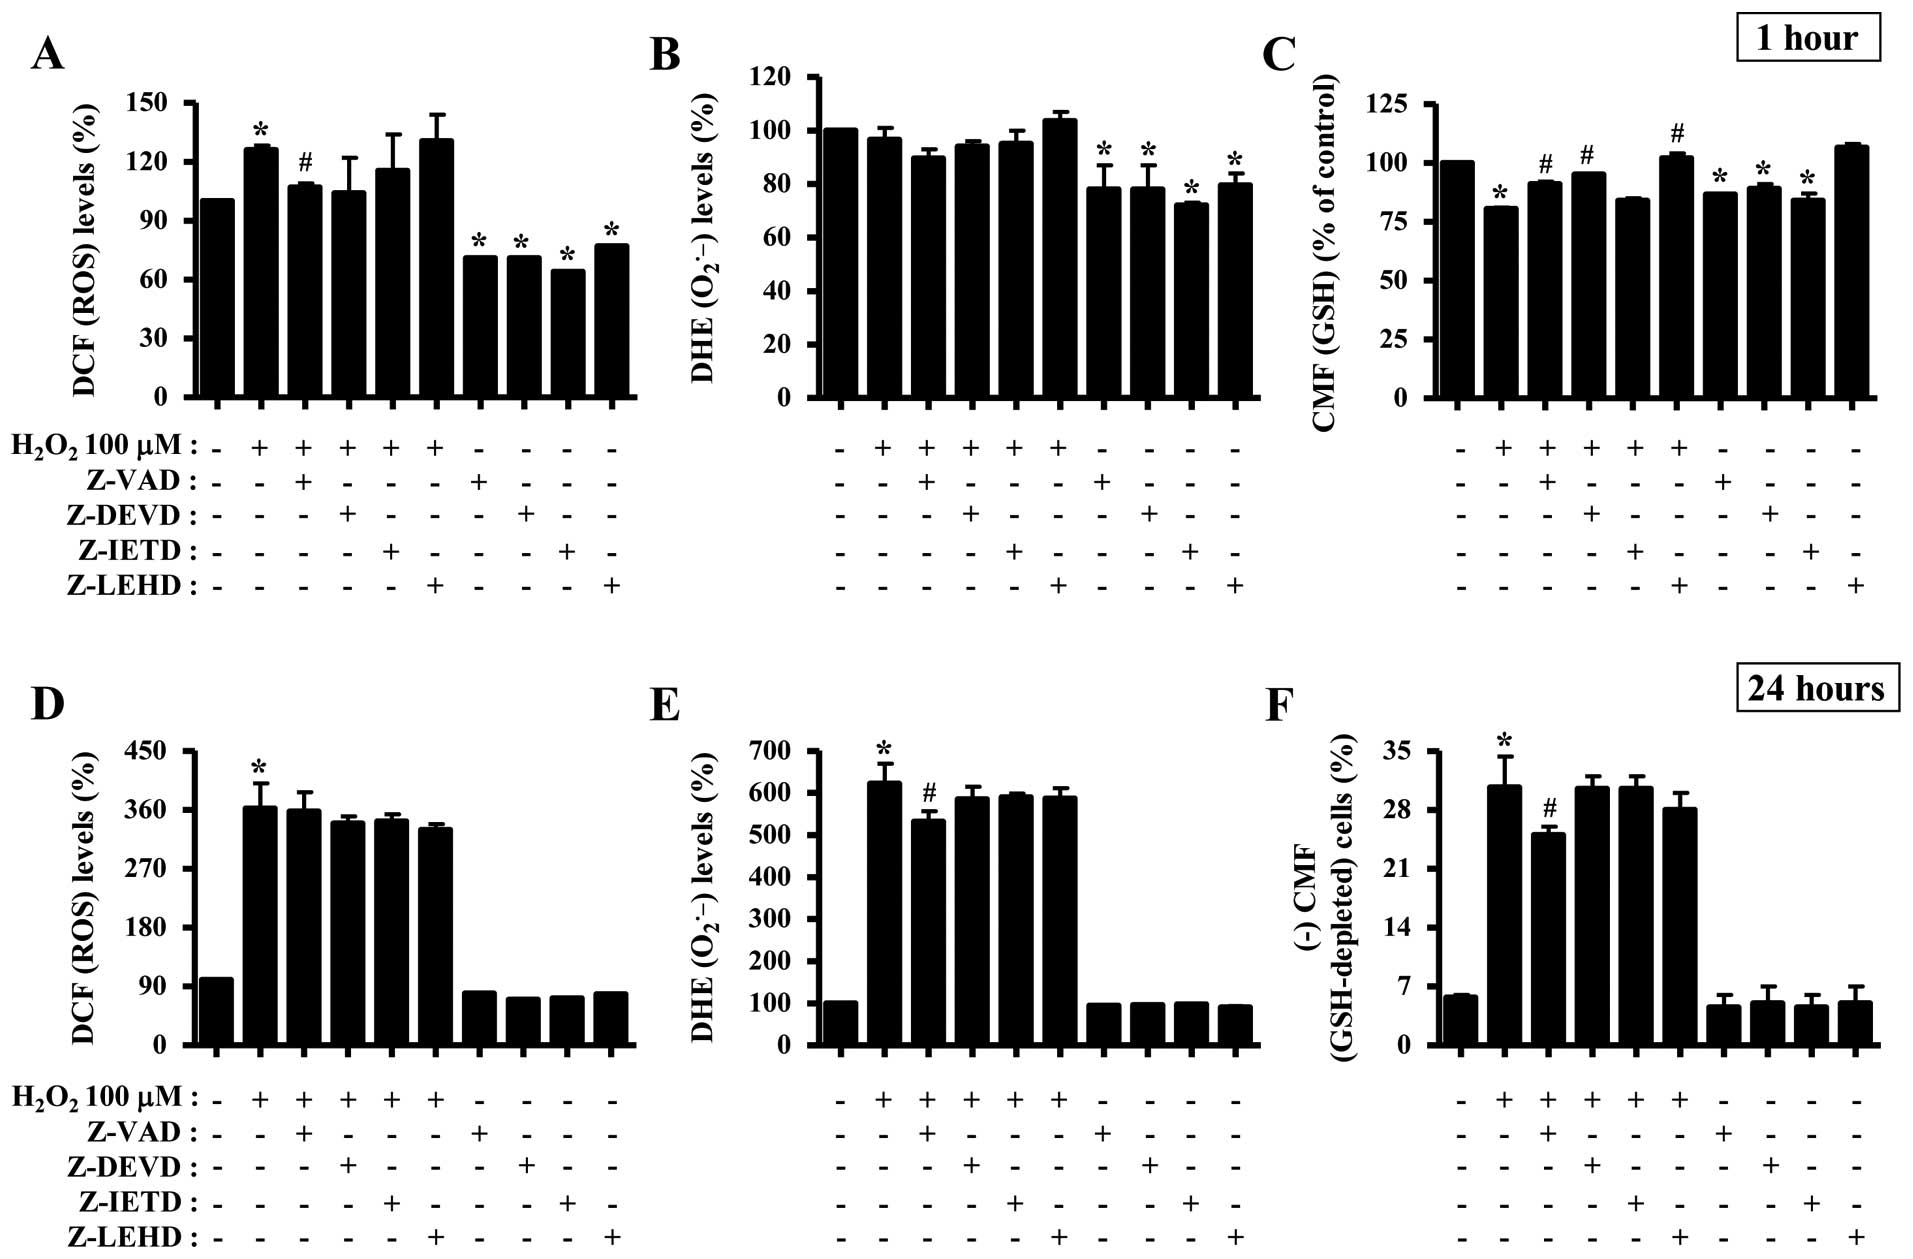
Effects of caspase inhibitors on ROS and
GSH levels in the H2O2-treated HeLa
cells
To determine whether the levels of intracellular
ROS and GSH in the H2O2-treated HeLa cells
were altered by treatment with each caspase inhibitor, ROS and GSH
levels in the HeLa cells were assessed at the early time point of 1
h and at the extended time point of 24 h (Fig. 5). The intracellular ROS (DCF) level
was increased in the H2O2-treated cells at 1
h (Fig. 5A). Z-VAD, caspase-3 and
-9 inhibitors seemed to attenuate the increased ROS (DCF) level by
H2O2, and all the caspase inhibitors
decreased the basal level of ROS (DCF) in the HeLa control cells
(Fig. 5A). At 24 h, none of the
caspase inhibitors significantly affected the ROS (DCF) level in
the H2O2-treated HeLa cells (Fig. 5D). Additionally, Z-VAD did not
attenuate the increased ROS (DCF) level by
H2O2 at 6 and 12 h (data not shown).
Treatment with 100 μM H2O2 did not alter the
DHE (O2•−) level in the HeLa cells at 1 h
(Fig. 5B). Z-VAD decreased the DHE
(O2•−) level in the
H2O2-treated and -untreated HeLa cells at 1
h, and other caspase inhibitors reduced the basal level of DHE
(O2•−) in the HeLa control cells (Fig. 5B). In addition, Z-VAD among the
caspase inhibitors decreased the DHE (O2•−)
level in H2O2-treated HeLa cells at 24 h
(Fig. 5E). In regards to the GSH
levels, 100 μM H2O2 decreased the GSH level
in HeLa cells at 1 h (Fig. 5C).
Caspase-3 and -9 inhibitors including Z-VAD attenuated the
decreased GSH level by H2O2, and all
inhibitors except the caspase-9 inhibitor reduced the basal level
of GSH in the HeLa control cells at 1 h (Fig. 5C). At 24 h, Z-VAD prevented GSH
depletion in the H2O2-treated HeLa cells
(Fig. 5F).
Discussion
Exogenous H2O2 was applied
for inducing oxidative stress in HeLa cervical cancer cells. After
exposure to H2O2 for 24 h, the
IC50 value in the HeLa cells was ~75 μM based on MTT
assays. H2O2 dose-dependently increased the
number of dead cells and Annexin V-FITC-positive cells in the HeLa
cells, suggesting that H2O2-induced HeLa cell
death occurred via apoptosis. Evidently, H2O2
decreased the level of pro-caspase-3 and induced the cleavage of
PARP proteins in the HeLa cells. The activity of caspase-3 was also
increased in the H2O2-treated HeLa cells.
However, 250 μM H2O2 did not significantly
increase the percentages of sub-G1 cells in the HeLa cells,
implying that the relatively higher dose of
H2O2 fixed HeLa cells similar to ethanol or
methanol. In addition, 100 or 250 μM H2O2
significantly induced LDH release in the HeLa cells at 24 h.
Therefore, H2O2 appeared to provoke HeLa cell
death via apoptosis as well as necrosis depending on its
concentration. Moreover, autophagy appeared to be involved in
H2O2-induced HeLa cell death since LC3-I was
converted to LC3-II in these cells. Apoptosis is closely related to
the collapse of MMP (ΔΨm) (24). This result demonstrated that
H2O2 triggered the loss of MMP
(ΔΨm) in HeLa cells in a dose-dependent manner,
suggesting that HeLa cell death by H2O2 was
tightly correlated with the collapse of MMP (ΔΨm).
Moreover, it has been reported that ROS may have roles in cell
cycle arrest and progression via regulating cell cycle-related
proteins (25,26). However, H2O2
did not induce any specific phase arrest of the cell cycle in HeLa
cells, suggesting that H2O2-induced oxidative
stress did not have an effect on particular proteins related to
cell cycle arrest and progression.
Treatment with the caspase inhibitors tested in
this experiment significantly prevented HeLa cell death by
H2O2, and Z-VAD showed a stronger effect on
reducing apoptosis. In particular, although
H2O2 slightly increased the activity of
caspase-8, its inhibitor significantly prevented HeLa cell death by
H2O2. Thus, a subtle change in the activity
of caspase-8 seemed to strongly affect the pro-apoptotic pathway in
H2O2-treated HeLa cells. These data suggest
that the mitochondrial pathway and cell death receptor pathway are
together necessary for the complete induction of apoptosis in
H2O2-treated HeLa cells. However, Wu et
al suggested that H2O2-induced apoptosis
in HeLa cells is not through mitochondria-dependent caspase-9
activation (27). The exact
apoptotic pathway(s) and the caspase(s) directly involved in the
H2O2-induced apoptosis in HeLa cells warrant
further studied. With regard to the MMP (ΔΨm), caspase
inhibitors did not prevent the loss of MMP (ΔΨm) induced
by H2O2. In addition, caspase inhibitors also
did not recover the decreased MMP (ΔΨm) level in the
H2O2-treated HeLa cells (data not shown).
These results imply that the loss of MMP (ΔΨm) following
treatment with H2O2 activated caspases and
consequently induced apoptosis. In addition, the activation of
caspase by H2O2 did not positively intensify
the MMP (ΔΨm) loss. Furthermore, the loss of MMP
(ΔΨm) by H2O2 may not be enough to
fully trigger apoptosis in HeLa cells under the inhibition of
caspase activity.
The ROS level was significantly increased in HeLa
cells treated with H2O2 at 24 h. Since
H2O2 did not decrease the activity of SOD and
increased the activity of catalase at 24 h, increases in ROS levels
including O2•− were likely to occur via their
strong generation rather than the lack of scavenging them. In
addition, it is possible that exogenous H2O2
strongly generates O2•− via the damage of
mitochondria, and both H2O2 and
O2•− can be efficiently converted into the
toxic •OH via the Fenton reaction to kill HeLa cells.
However, H2O2 did not increase the
O2•− (DHE) level in HeLa cells at 1 h,
suggesting that it did not affect the mitochondrial respiratory
transport chain and the activity of various oxidases to generate
O2•− within this early time point. Moreover,
caspase inhibitors showing the prevention of
H2O2-induced cell death failed to
significantly decrease the ROS level including
O2•− at 6, 12 and 24 h. However, Z-VAD,
caspase-3 and -8 inhibitors appeared to attenuate the increased ROS
(DCF) level by H2O2 at 1 h. In addition, all
of the caspase inhibitors decreased the basal level of ROS
including O2•− in the HeLa control cells. It
is conceivable that the reduced basal activity of caspase by their
inhibitors improves the reliability of antioxidant-related enzymes
to strongly scavenge basal intracellular ROS in HeLa cells.
Therefore, the early suppression of
H2O2-induced oxidative stress by caspase
inhibitors seems to be crucial for the protection of HeLa cells
against it. The exact role of each caspase inhibitor in preventing
H2O2-induced HeLa cell death still needs to
be defined further.
GSH is a main non-protein antioxidant in cells.
Apoptotic effects are inversely comparable to the GSH content
(28–30). Likewise, H2O2
was found to increase the number of GSH-depleted cells in HeLa
cells at 24 h. In addition, Z-VAD partially prevented GSH depletion
in H2O2-treated HeLa cells. These results
support the notion that the intracellular GSH content has a
decisive effect on cell death (29,31,32).
However, 50 μM H2O2, the dose at which
apoptosis is induced in HeLa cells, did not significantly allow GSH
depletion in these cells. Moreover, the other caspase inhibitors
except Z-VAD failed to prevent GSH depletion in the
H2O2-treated HeLa cells. Therefore, the loss
of GSH content seemed to be necessary but not sufficient for the
induction of apoptosis in the H2O2-treated
HeLa cells. Treatment with 100 μM H2O2
decreased the GSH level at 1 h. The decreased GSH level was likely
to be due to its use for the decrease in ROS (DCF) level at this
time. In addition, caspase-3 and -9 inhibitors partially recovered
the GSH level in the H2O2-treated HeLa cells,
implying that these caspase inhibitors seemed to positively
maintain the GSH content in these cells. Without the incubation of
H2O2, caspase inhibitors except for the
caspase-9 inhibitor reduced the basal level of GSH in the HeLa
control cells at 1 h. Thus, these results suggest that each caspase
inhibitor differentially regulated the intracellular GSH levels in
HeLa cells depending on the presence or absence of
H2O2.
In conclusion, H2O2 inhibited
the growth of HeLa cells via apoptosis and/or necrosis, which was
accompanied by intracellular ROS increase and GSH depletion. The
anti-apoptotic effect of caspase inhibitors on
H2O2-induced HeLa cell death may result from
the early suppression of H2O2-induced
oxidative stress. The present data provide useful information for
the understanding of the toxicological effect of exogenous
H2O2 on HeLa cells.
Acknowledgements
This study was supported by the National Research
Foundation of Korea (NRF), a grant funded by the Korean government
(MSIP) (no. 2008-0062279), and supported by the Basic Science
Research Program through the NRF funded by the Ministry of
Education (2013006279).
Abbreviations:
|
ROS
|
reactive oxygen species
|
|
GSH
|
glutathione
|
|
LDH
|
lactate dehydrogenase
|
|
Z-VAD-FMK
|
benzyloxycarbonyl-Val-Ala-Asp-fluoromethylketon
|
|
Z-DEVD-FMK
|
benzyloxycarbonyl-Asp-
Glu-Val-Asp-fluoromethylketon
|
|
Z-IETD-FMK
|
benzyloxycarbonyl-
Ile-Glu-Thr-Asp-fluoromethylketon
|
|
Z-LEHD-FMK
|
be oxycarbonyl-
Leu-Glu-His-Asp-fluoromethylketon
|
|
SOD
|
superoxide dismutase
|
|
MMP (ΔΨm)
|
mitochondrial membrane potential
|
|
FITC
|
fluorescein isothiocyanate
|
|
PI
|
propidium iodide
|
|
H2DCFDA
|
2′,7′-dichlorodihydrofluorescein
diacetate
|
|
DHE
|
dihydroethidium
|
|
CMFDA
|
5-chloromethylfluorescein
diacetate
|
|
MTT
|
3-(4,5-dimethylthiazol-2-yl)-2,5-diphenyltetrazolium bromide
|
References
|
1
|
Gonzalez C, Sanz-Alfayate G, Agapito MT,
Gomez-Niño A, Rocher A and Obeso A: Significance of ROS in oxygen
sensing in cell systems with sensitivity to physiological hypoxia.
Respir Physiol Neurobiol. 132:17–41. 2002. View Article : Google Scholar : PubMed/NCBI
|
|
2
|
Baran CP, Zeigler MM, Tridandapani S and
Marsh CB: The role of ROS and RNS in regulating life and death of
blood monocytes. Curr Pharm Des. 10:855–866. 2004. View Article : Google Scholar : PubMed/NCBI
|
|
3
|
Irani K: Oxidant signaling in vascular
cell growth, death, and survival: a review of the roles of reactive
oxygen species in smooth muscle and endothelial cell mitogenic and
apoptotic signaling. Circ Res. 87:179–183. 2000. View Article : Google Scholar : PubMed/NCBI
|
|
4
|
Perez-Vizcaino F, Cogolludo A and Moreno
L: Reactive oxygen species signaling in pulmonary vascular smooth
muscle. Respir Physiol Neurobiol. 174:212–220. 2010. View Article : Google Scholar : PubMed/NCBI
|
|
5
|
Zorov DB, Juhaszova M and Sollott SJ:
Mitochondrial ROS-induced ROS release: an update and review.
Biochim Biophys Acta. 1757:509–517. 2006. View Article : Google Scholar : PubMed/NCBI
|
|
6
|
Zelko IN, Mariani TJ and Folz RJ:
Superoxide dismutase multigene family: a comparison of the CuZn-SOD
(SOD1), Mn-SOD (SOD2), and EC-SOD (SOD3) gene structures,
evolution, and expression. Free Radic Biol Med. 33:337–349. 2002.
View Article : Google Scholar : PubMed/NCBI
|
|
7
|
Wilcox CS: Reactive oxygen species: roles
in blood pressure and kidney function. Curr Hypertens Rep.
4:160–166. 2002. View Article : Google Scholar : PubMed/NCBI
|
|
8
|
Chen TJ, Jeng JY, Lin CW, Wu CY and Chen
YC: Quercetin inhibition of ROS-dependent and -independent
apoptosis in rat glioma C6 cells. Toxicology. 223:113–126. 2006.
View Article : Google Scholar : PubMed/NCBI
|
|
9
|
Dasmahapatra G, Rahmani M, Dent P and
Grant S: The tyrphostin adaphostin interacts synergistically with
proteasome inhibitors to induce apoptosis in human leukemia cells
through a reactive oxygen species (ROS)-dependent mechanism. Blood.
107:232–240. 2006. View Article : Google Scholar
|
|
10
|
Wallach-Dayan SB, Izbicki G, Cohen PY,
Gerstl-Golan R, Fine A and Breuer R: Bleomycin initiates apoptosis
of lung epithelial cells by ROS but not by Fas/FasL pathway. Am J
Physiol Lung Cell Mol Physiol. 290:L790–L796. 2006. View Article : Google Scholar : PubMed/NCBI
|
|
11
|
Sarsour EH, Kumar MG, Chaudhuri L, Kalen
AL and Goswami PC: Redox control of the cell cycle in health and
disease. Antioxid Redox Signal. 11:2985–3011. 2009. View Article : Google Scholar : PubMed/NCBI
|
|
12
|
Rhee SG, Kang SW, Jeong W, Chang TS, Yang
KS and Woo HA: Intracellular messenger function of hydrogen
peroxide and its regulation by peroxiredoxins. Curr Opin Cell Biol.
17:183–189. 2005. View Article : Google Scholar : PubMed/NCBI
|
|
13
|
Vilhardt F and van Deurs B: The phagocyte
NADPH oxidase depends on cholesterol-enriched membrane microdomains
for assembly. EMBO J. 23:739–748. 2004. View Article : Google Scholar : PubMed/NCBI
|
|
14
|
Shi Y: Mechanisms of caspase activation
and inhibition during apoptosis. Mol Cell. 9:459–470. 2002.
View Article : Google Scholar : PubMed/NCBI
|
|
15
|
Ashkenazi A and Dixit VM: Death receptors:
signaling and modulation. Science. 281:1305–1308. 1998. View Article : Google Scholar : PubMed/NCBI
|
|
16
|
Budihardjo I, Oliver H, Lutter M, Luo X
and Wang X: Biochemical pathways of caspase activation during
apoptosis. Annu Rev Cell Dev Biol. 15:269–290. 1999. View Article : Google Scholar : PubMed/NCBI
|
|
17
|
Mehmet H: Caspases find a new place to
hide. Nature. 403:29–30. 2000. View
Article : Google Scholar : PubMed/NCBI
|
|
18
|
Hengartner MO: The biochemistry of
apoptosis. Nature. 407:770–776. 2000. View Article : Google Scholar : PubMed/NCBI
|
|
19
|
Liu X, Yue P, Zhou Z, Khuri FR and Sun SY:
Death receptor regulation and celecoxib-induced apoptosis in human
lung cancer cells. J Natl Cancer Inst. 96:1769–1780. 2004.
View Article : Google Scholar : PubMed/NCBI
|
|
20
|
Han YH, Kim SZ, Kim SH and Park WH:
Pyrogallol inhibits the growth of lung cancer Calu-6 cells via
caspase-dependent apoptosis. Chem Biol Interact. 177:107–114. 2009.
View Article : Google Scholar : PubMed/NCBI
|
|
21
|
Han YH and Park WH: Tiron, a ROS
scavenger, protects human lung cancer Calu-6 cells against
antimycin A-induced cell death. Oncol Rep. 21:253–261.
2009.PubMed/NCBI
|
|
22
|
Han YH, Moon HJ, You BR and Park WH: The
effect of MG132, a proteasome inhibitor on HeLa cells in relation
to cell growth, reactive oxygen species and GSH. Oncol Rep.
22:215–221. 2009.PubMed/NCBI
|
|
23
|
Park WH, Han YH, Kim SH and Kim SZ:
Pyrogallol, ROS generator inhibits As4.1 juxtaglomerular cells via
cell cycle arrest of G2 phase and apoptosis. Toxicology.
235:130–139. 2007. View Article : Google Scholar : PubMed/NCBI
|
|
24
|
Yang J, Liu X, Bhalla K, et al: Prevention
of apoptosis by Bcl-2: release of cytochrome c from
mitochondria blocked. Science. 275:1129–1132. 1997. View Article : Google Scholar : PubMed/NCBI
|
|
25
|
Han YH, Kim SH, Kim SZ and Park WH:
Antimycin A as a mitochondria damage agent induces an S phase
arrest of the cell cycle in HeLa cells. Life Sci. 83:346–355. 2008.
View Article : Google Scholar : PubMed/NCBI
|
|
26
|
Han YH, Kim SZ, Kim SH and Park WH:
Pyrogallol inhibits the growth of human lung cancer Calu-6 cells
via arresting the cell cycle arrest. Toxicol In Vitro.
22:1605–1609. 2008. View Article : Google Scholar : PubMed/NCBI
|
|
27
|
Wu Y, Wang D, Wang X, et al: Caspase 3 is
activated through caspase 8 instead of caspase 9 during
H2O2-induced apoptosis in HeLa cells. Cell
Physiol Biochem. 27:539–546. 2011. View Article : Google Scholar : PubMed/NCBI
|
|
28
|
Han YH, Kim SZ, Kim SH and Park WH:
Enhancement of arsenic trioxide-induced apoptosis in HeLa cells by
diethyldithiocarbamate or buthionine sulfoximine. Int J Oncol.
33:205–213. 2008.PubMed/NCBI
|
|
29
|
Estrela JM, Ortega A and Obrador E:
Glutathione in cancer biology and therapy. Crit Rev Clin Lab Sci.
43:143–181. 2006. View Article : Google Scholar
|
|
30
|
Han YH, Kim SZ, Kim SH and Park WH:
Suppression of arsenic trioxide-induced apoptosis in HeLa cells by
N-acetylcysteine. Mol Cells. 26:18–25. 2008.PubMed/NCBI
|
|
31
|
Han YH, Kim SH, Kim SZ and Park WH:
Carbonyl cyanide p-(trifluoromethoxy) phenylhydrazone (FCCP)
as an O2(*−) generator induces apoptosis via
the depletion of intracellular GSH contents in Calu-6 cells. Lung
Cancer. 63:201–209. 2009.
|
|
32
|
Han YH, Kim SZ, Kim SH and Park WH:
Intracellular GSH level is a factor in As4.1 juxtaglomerular cell
death by arsenic trioxide. J Cell Biochem. 104:995–1009. 2008.
View Article : Google Scholar : PubMed/NCBI
|