Introduction
Among the gynecological malignancies, ovarian cancer
ranks third in incidence but has the highest mortality rate
(1). Despite considerable
advancements in traditional treatments including surgery,
chemotherapy and radiation therapy, patients with advanced ovarian
cancer have a long-term survival rate of <20% (2). Hence, it is crucial to explore
improved treatment options for this disease.
Classically activated (M1) macrophages and
alternatively activated (M2) macrophages are two major subsets of
human macrophages that exert opposite effects on the inflammatory
response. Tumor-associated macrophages (TAMs) as important
inflammatory components mainly exhibit M2 polarization in tumor
tissues. These cells can promote the development of tumors;
therefore, they have become a new target for cancer treatment
(3,4). Studies have revealed that TAMs are
present in large numbers in ovarian cancer (5,6);
therefore, the elucidation of M2-TAM’s roles in the development of
ovarian cancer may provide new insight for the treatment of ovarian
cancer.
After the human genome was sequenced, the focus of
genomic studies shifted from structural to functional
investigations. The rapid advancement of various omics techniques
has provided platforms and opportunities to explore functional
genomics and has also catalyzed the exponential growth of relevant
biological data (7). It remains a
challenge for biologists and mathematicians to extract biologically
valuable information from these massive data sets.
The present study examined the gene expression
changes between SKOV3 ovarian carcinoma cells co-cultured with and
without TAMs using a microarray. A novel method for analyzing
microarray gene expression data was explored, and the results were
confirmed with molecular approaches.
Materials and methods
Cell preparation
The human ovarian cancer cell line, SKOV3, and the
human monocytic leukemia cell line, THP-1, were provide by the
Heilongjiang Cancer Research Institute and grown in Roswell Park
Memorial Institute (RPMI)-1640 medium supplemented with 10% fetal
calf serum (FBS), 100 U/ml penicillin and 100 μg/ml streptomycin at
37°C and 5% CO2 in a humidified chamber.
To generate M2-polarized THP-1 macrophages,
1×10⁶ THP-1 cells were seeded into the upper insert of a
6-well Transwell system (0.4 μM pore size; Corning Life Sciences,
Lowell, MA, USA) and treated with 320 nM PMA (phorbol myristate
acetate; Sigma-Aldrich, St. Louis, MO, USA) for 6 h. They were then
cultured with PMA supplemented with 20 ng/ml interleukin-4 (IL-4)
and 20 ng/ml IL-13 for another 18 h.
For co-culture, SKOV3 cells were plated into 6-well
plates at a density of 2×10⁵ cells/well and incubated
for 24 h. After a thorough wash to remove all PMA, M2-polarized
THP-1 macrophages in the upper inserts were co-cultured with SKOV3
cells in 6-well plates. After 72 h of co-culture, the SKOV3 cells
were washed and used for subsequent experiments.
Detection of gene expression using a
microarray
For the blank control group, cell-free culture
fluids were added to the upper inserts. The SKOV3 cells were
collected, and total RNA was extracted according to the
instructions for the TRIzol reagent (Invitrogen, Carlsbad, CA,
USA). Gene expression analyses were performed using the Human Whole
Genome 8 × 60k Microarray (Agilent-027114; Genotypic Technology Pvt
Ltd, Bangalore, Karnataka, India). Preparation of cRNA from 5 μg of
total RNA, hybridizations, washes, and detection were conducted in
accordance with the protocol (http://www.genotypic.co.in/custom_micro_design.html?mnu=1).
The resulting slides were scanned using the Axon GenePix 4000B
microarray scanner.
Microarray data analysis
The scanned images (TIFF format) were imported into
NimbleScan software (version 2.5) for grid alignment and expression
data analysis. The expression data were normalized through quantile
normalization and the Robust Multichip Average (RMA) algorithm
included in the software. The Probe level (*_norm_RMA.pair) files
and Gene level (*_RMA.calls) files were generated after
normalization. All gene level files were imported into Agilent
GeneSpring GX software (version 11.5.1) for further analysis.
Differentially expressed genes were identified by the Student’s
t-test.
Bioinformatic analysis
The protein-protein interaction (PPI) network was
obtained from the Human Protein Reference Database (HPRD,
http://www.hprd.org) which includes 9,453 nodes and
36,874 edges (8). The
differentially expressed genes were mapped onto the PPI network.
The protein pairs that were interactive and both encoded by
differentially expressed gene, were retained. Then the PPI network
showing the influence of TAMs on SKOV3 cells was obtained. The
resulting network was analyzed with CFinder software (http://www.cfinder.org/) to identify modules (9) and each module was functionally
annotated by the DAVID software (http://david.abcc.ncifcrf.gov/) (10). Specifically, enrichment analyses of
KEGG pathways (Kyoto Encyclopedia of Genes and Genomes, http://www.kegg.jp) and GO-BP terms (gene
oncology-biological process, http://www.geneontology.org/) for genes in each
module, were performed. Then, the enriched KEGG pathways and GO-BP
terms were arranged in ascending order of P-value, and the
functions of the top ten KEGG pathways and GO-BP terms were
examined. Those modules that were functionally interesting to us
were further analyzed.
For each target module, the genes-function (the KEGG
pathways or GO-BP terms) visualization networks were constructed
using Cytoscape software (version 2.6.3) (11). The genes that potentially played key
roles in the network were identified and analyzed.
Western blot analysis
Cells lysates were prepared with RIPA lysis buffer
(50 mM Tris-HCl, pH 7.5, 50 mM NaCl, 1 μM EGTA, 1% Triton X-100, 50
mM NaF, 5 mM Na3VO4, 10 mM
Na4P2O7, 0.1 mM
phenylmethylsulfonyl fluoride, 1 μg/ml aprotinin, 1 μg/ml pepstatin
A, 1 μg/ml leupeptin and 1 mM DTT) and cleared of cellular debris
by centrifugation. Protein extracts were normalized for
concentration by the Bio-Rad Protein Assay (Bio-Rad Laboratories,
Hercules, CA, USA) and 20 μg of total cell protein per sample were
subjected to sodium dodecyl sulfate-polyacrylamide gel
electrophoresis (SDS-PAGE) and then transferred to PVDF membranes
(Amersham Inc., Arlington Heights, IL, USA). Membranes were blocked
with 5% non-fat dry milk in TBST buffer (20 mM Tris-HCl, pH 7.4,
150 mM NaCl, 0.1% Tween-20) and probed with one of the following
antibodies: anti-CDK2, anti-CDK4 and anti-β-actin (Santa Cruz
Biotechnology, Santa Cruz, CA, USA). Following incubation with
horseradish peroxidase conjugated secondary antibody (Santa Cruz
Biotechnology), the blots were visualized by ECL kit
(Amersham).
CDK2 and CDK4 kinase assays
Cells were washed twice with ice-cold PBS and lysed
in RIPA lysis buffer. After clearing of cellular debris by
centrifugation, 500 μg of cell lysate from each sample was
incubated with anti-CDK2 or anti-CDK4 antibody (Santa Cruz
Biotechnology) at 4°C overnight. Immunocomplexes were captured by
Protein A-Sepharose beads (Pharmacia Biotech, Piscataway, NJ, USA)
at 4°C for 2 h, rocking. The precipitates were washed three times
with RIPA lysis buffer and twice with kinase assay buffer (50 mM
HEPES, pH 7.5, 10 mM MgCl2, 1 mM DTT, 10 mM
β-glycerophosphate, 1 mM NaF and 0.1 mM
Na3VO4), then resuspended in 30 μl kinase
buffer containing 100 μg/ml histone H1 (for CDK2 kinase assays) or
2 μg of glutathione S-transferase - Rb fusion protein (for CDK4
kinase assays), 50 μM ATP, 0.2 μCi/μl [γ-32P] ATP
(Amersham Life Science) and incubated at 30°C for 30 min. The
reaction was stopped by adding 5 μl 6x Laemmli sample buffer and
boiling for 5 min, and resolved on 10% SDS-PAGE. The gel was dried
and exposed to an X-ray film. The [32P]-labeled H1 or Rb
protein was visualized by autoradiography and the band intensities
were quantified using NIH ImageJ.
3H-TdR incorporation
The SKOV3 cells were seeded in 24-well plates at a
density of 40,000 per well and allowed to adhere for 24 h. After
washing three times with warm PBS, the cells were subjected to
growth arrest by incubation with serum-free medium for 48 h. Then,
in the presence or absence of 20 μM of roscovitine (A.G.
Scientific, Inc., San Diego, CA, USA) or 20 μM of 3-Amino-9-thio
(10H)-acridone (3-ATA; Alexis Biochemicals, San Diego, CA, USA)
within the SKOV3 cell culture medium, the SKOV3 cells were
cocultured with M2-polarized THP-1 macrophages in upper inserts for
72 h. Eighteen hours before harvesting, 1 μCi/ml of
3H-TdR was added to the medium of each well. To harvest
the cells, the medium was discarded, and the cells were rapidly
washed three times with PBS at 4°C and treated with ice-cold 10%
trichloroacetic acid and neutralized with 0.2 M NaOH (0.5 ml/well).
The resulting lysates were transferred to scintillation vials, and
thymidine incorporation was determined by scintillation counting.
In each experiment, the results from triplicate wells were averaged
before statistical analysis.
Cell cycle analysis
In the presence or absence of 20 μM of roscovitine
or 20 μM of 3-ATA in the SKOV3 cell culture medium, the SKOV3 cells
were co-cultured with or without M2-polarized THP-1 macrophages in
the upper inserts for 72 h. Then, the cells were harvested in cold
PBS, fixed in 5 ml of cold 70% ethanol and stored at 4°C for
subsequent cell cycle analysis. Fixed cells were washed with PBS
once and suspended in 1 ml of propidium iodide (PI; Sigma) staining
reagent (20 mg/ml ribonuclease and 5 mg/ml of PI). The samples were
incubated at 37°C in the dark for 30 min before cell cycle
analysis. The distribution of cells in the cell cycle was
determined by a FACSCalibur flow cytometer (BD, Biosciences, San
Jose, CA, USA).
Statistical analysis
All data represent the results of three independent
experiments. The data are expressed as the mean ± SD. Significance
was calculated using the Student’s t-test. P-values <0.05 were
considered to indicate statistically significant differences.
Results
CDK2 and CDK4 are identified for further
investigation after modular analysis of the network showing the
influence of TAMs on SKOV3 cells
There were a total of 996 genes that were
differentially expressed between the two groups (SKOV3 vs.
TAM-SKOV3 co-culture), including 653 upregulated genes and 343
downregulated genes in the co-culture group.
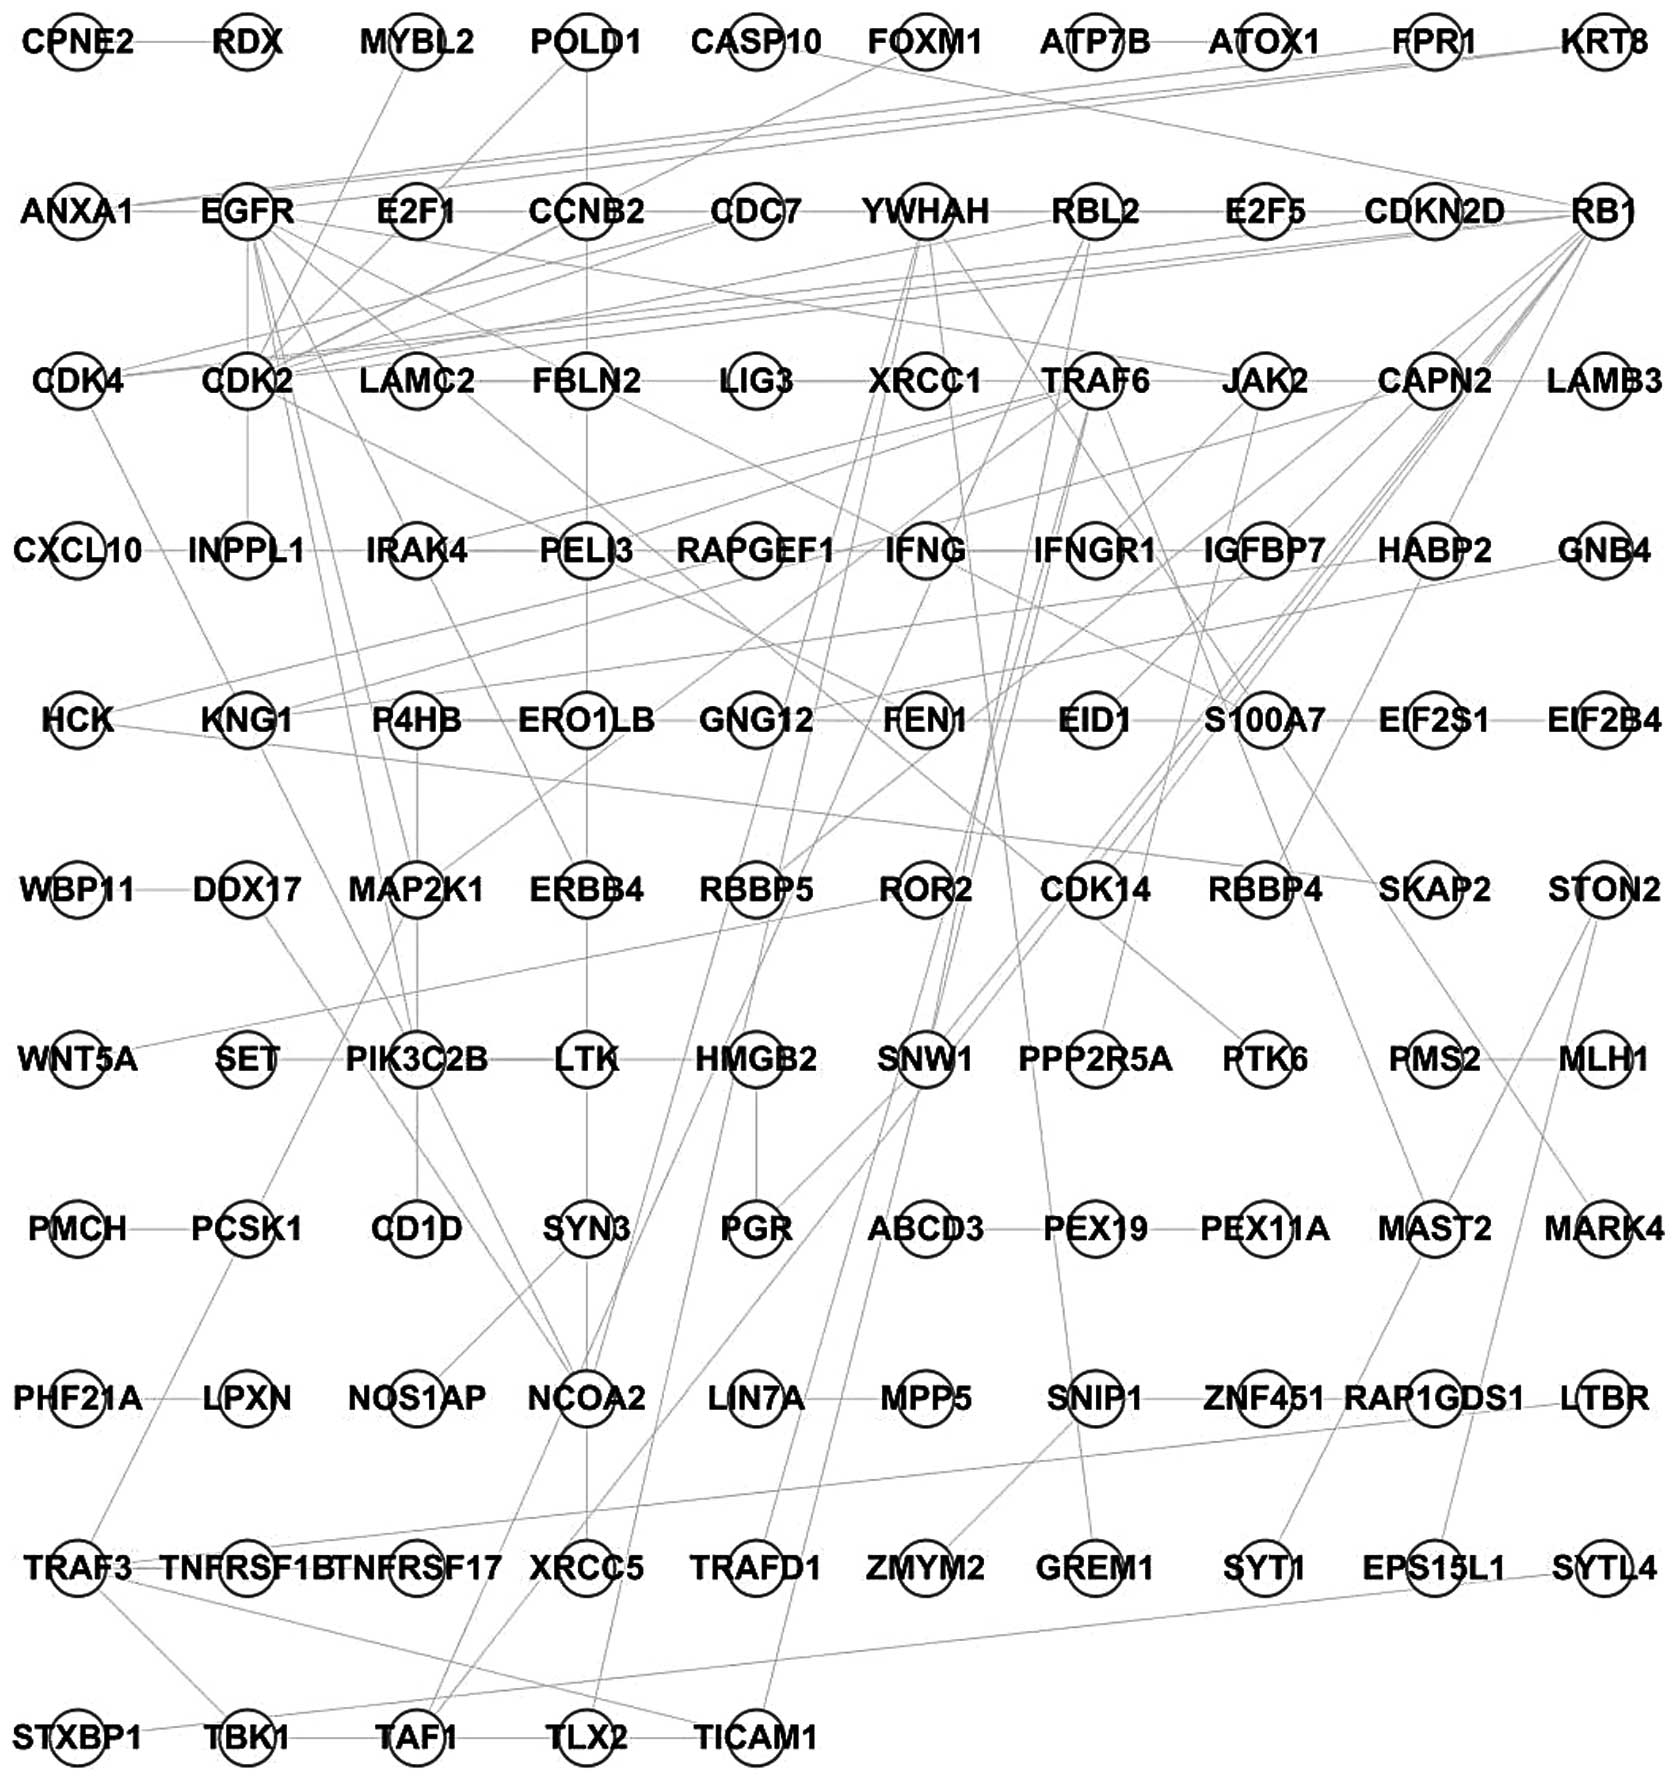
Using the PPI network and the 996 differentially
expressed genes, a network describing the influence of TAMs on
SKOV3 cells was constructed, comprised of 105 nodes and 91 edges
(Fig. 1).
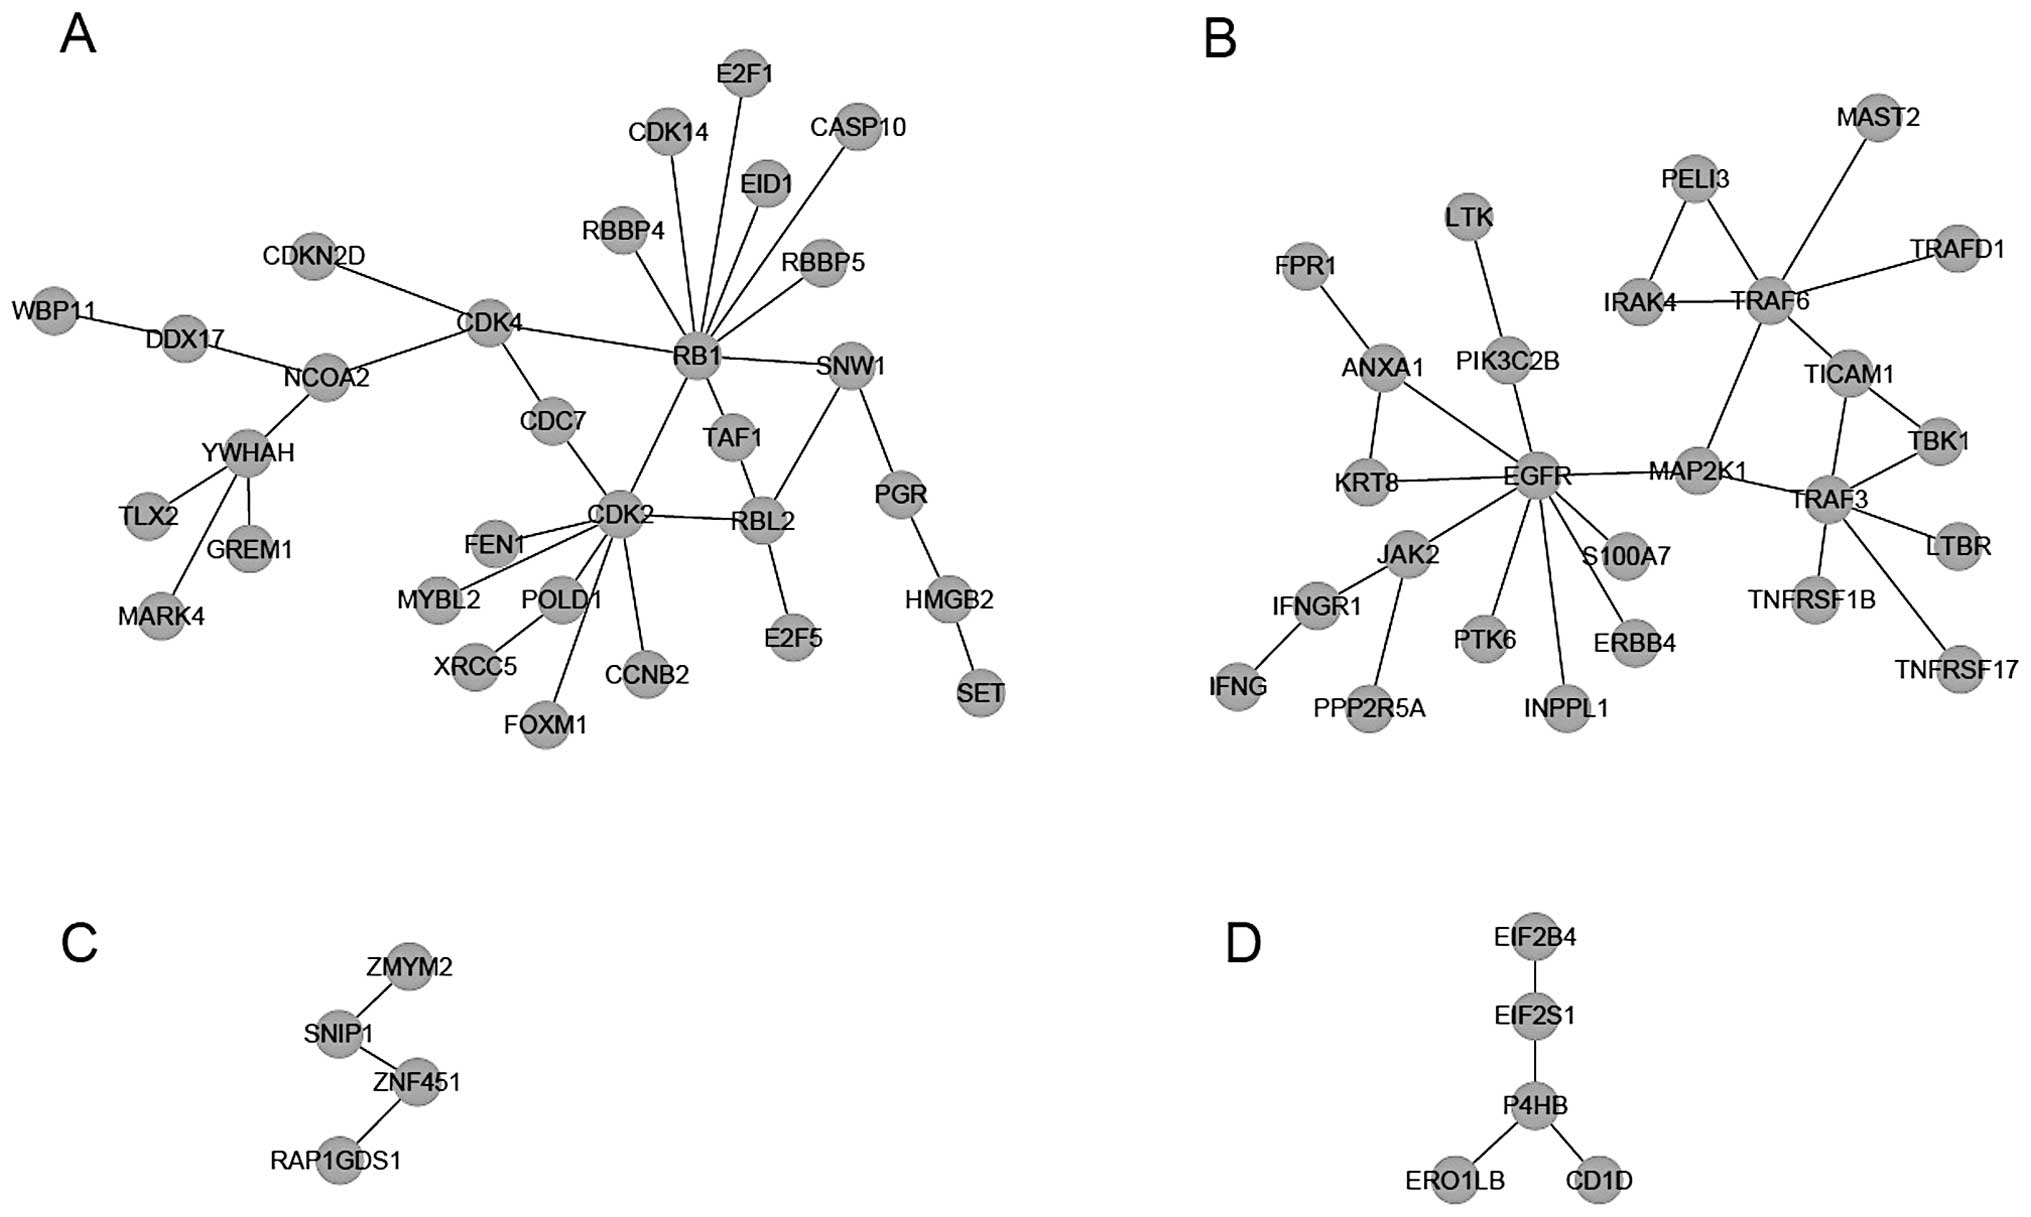
Module dividing was then performed for the network,
and four modules were recognized when k=3 (Fig. 2). Via enrichment analyses of KEGG
pathways and GO-BP terms for genes in each module, it was found
that multiple KEGG pathways and GO-BP terms were significantly
enriched for genes in modules I or II (Table I). Based on the P-value, the top ten
KEGG pathways and GO-BP terms for each module were functionally
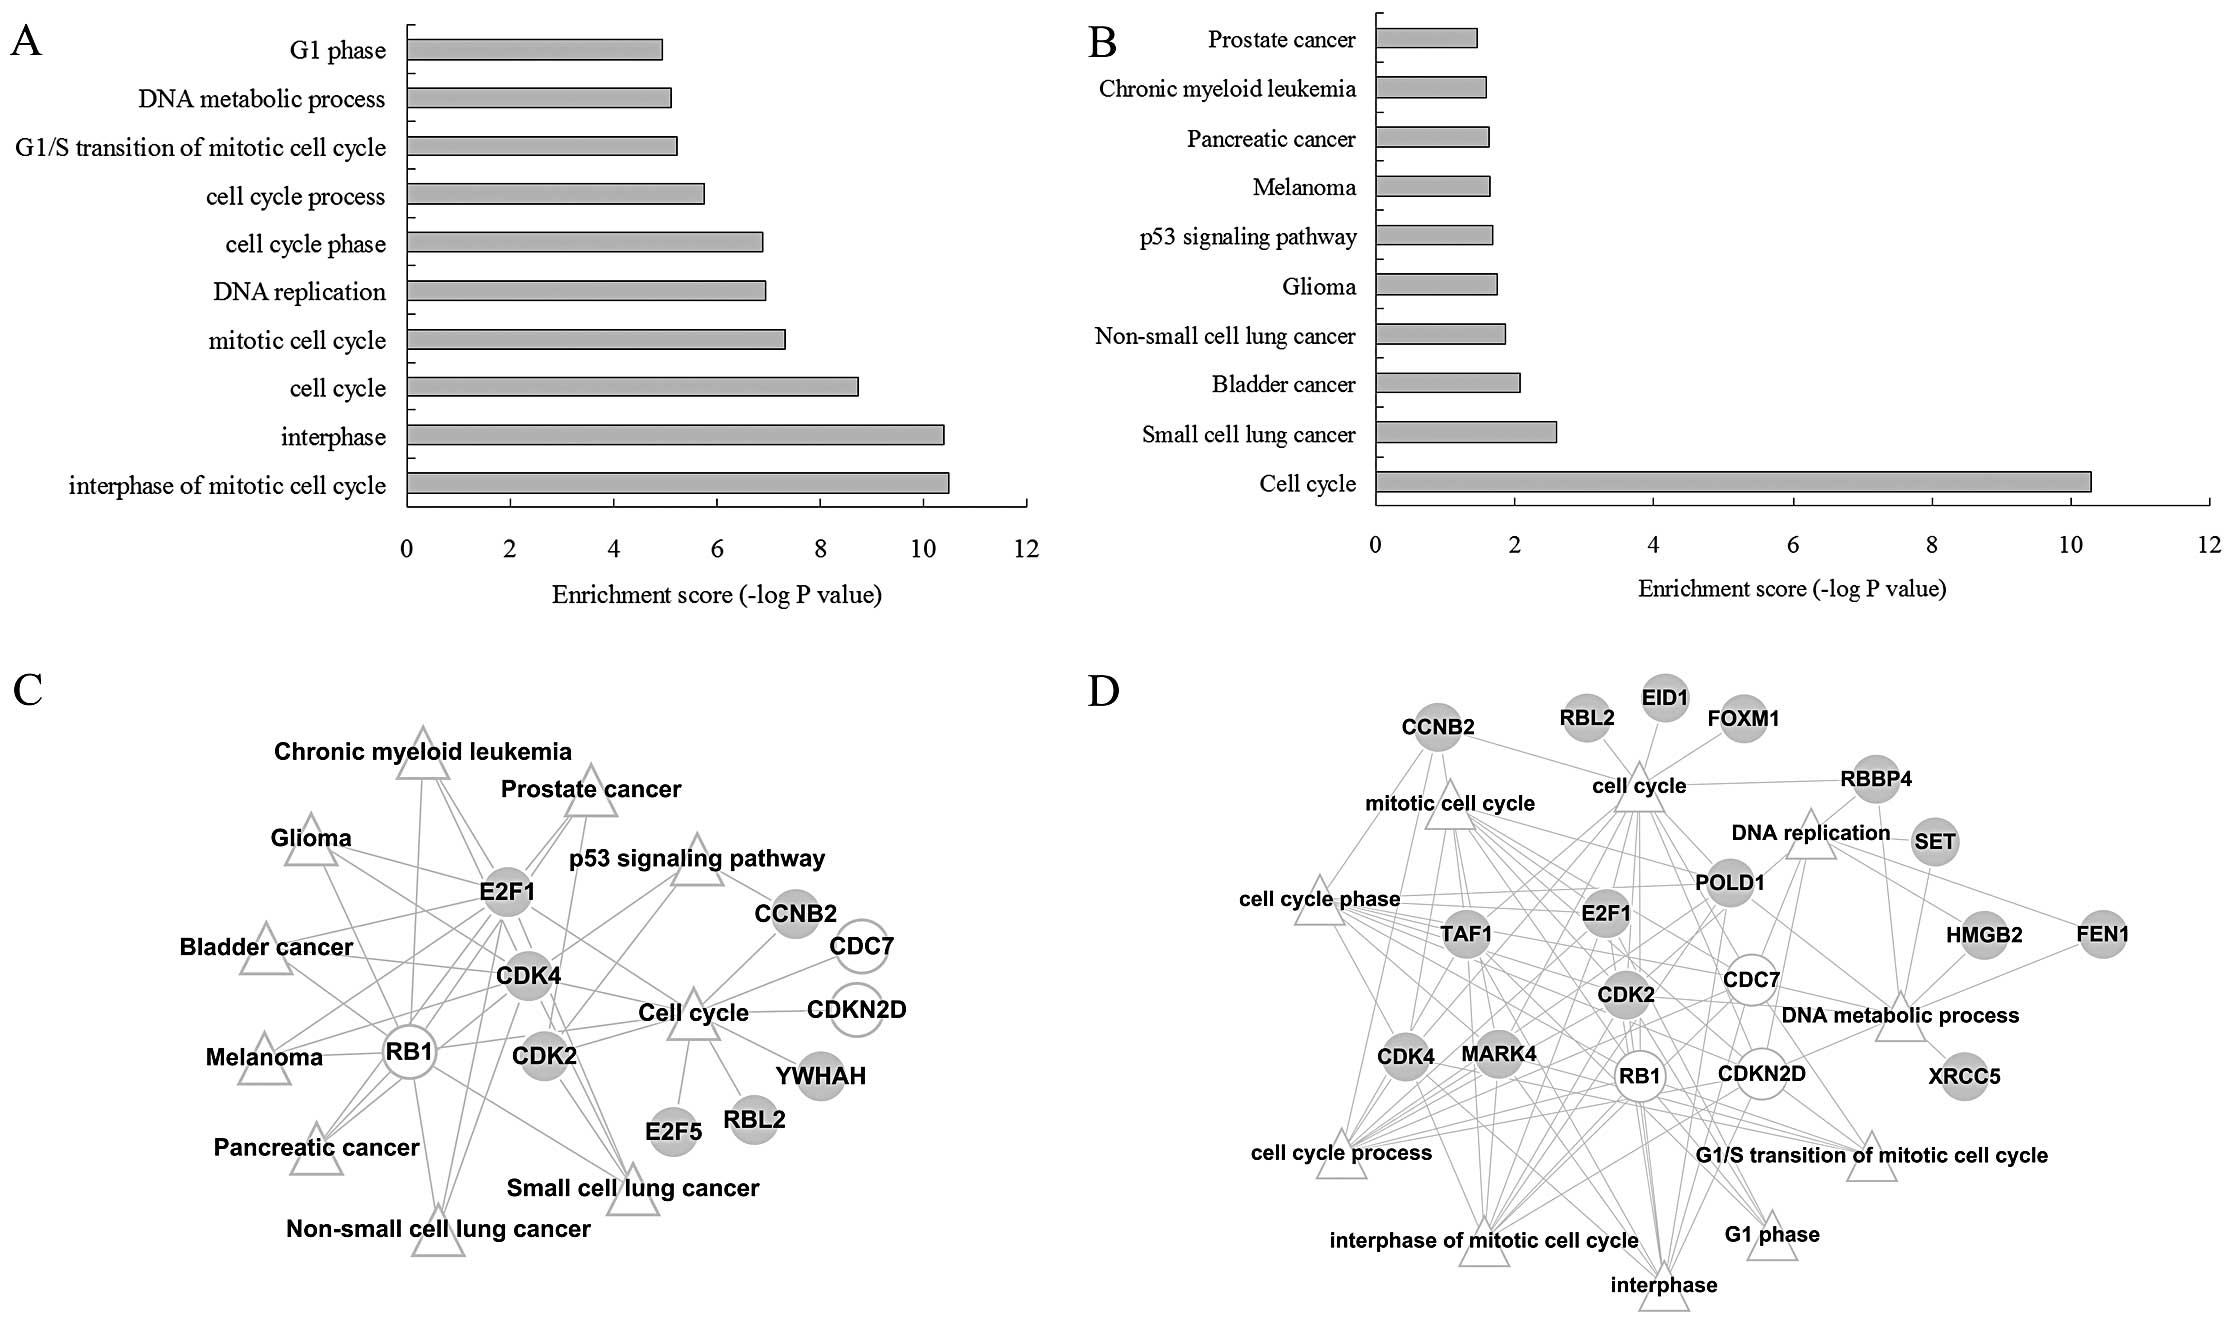
examined. The genes in module I were mainly related to
‘tumorigenesis’ (Fig. 3A) and ‘cell
cycle’ (Fig. 3B); thus, this module
was considered a target of further analysis.
 | Table INumbers of enriched KEGG pathways and
GO-BP terms for the four modules. |
Table I
Numbers of enriched KEGG pathways and
GO-BP terms for the four modules.
| Module | GO-BP terms (n) | KEGG pathways
(n) |
|---|
| 1 | 70 | 13 |
| 2 | 130 | 4 |
| 3 | 1 | 0 |
| 4 | 4 | 0 |
After the construction of the gene-function
visualization networks (Fig. 3C and
D), it was discovered that among the 31 genes in module I, 4
genes (E2F1, RB1, CDK2 and CDK4) were functional and involved in
multiple cancer pathways and the ‘cell cycle’ pathway, as well as
multiple GO-BP terms related with cell cycle.
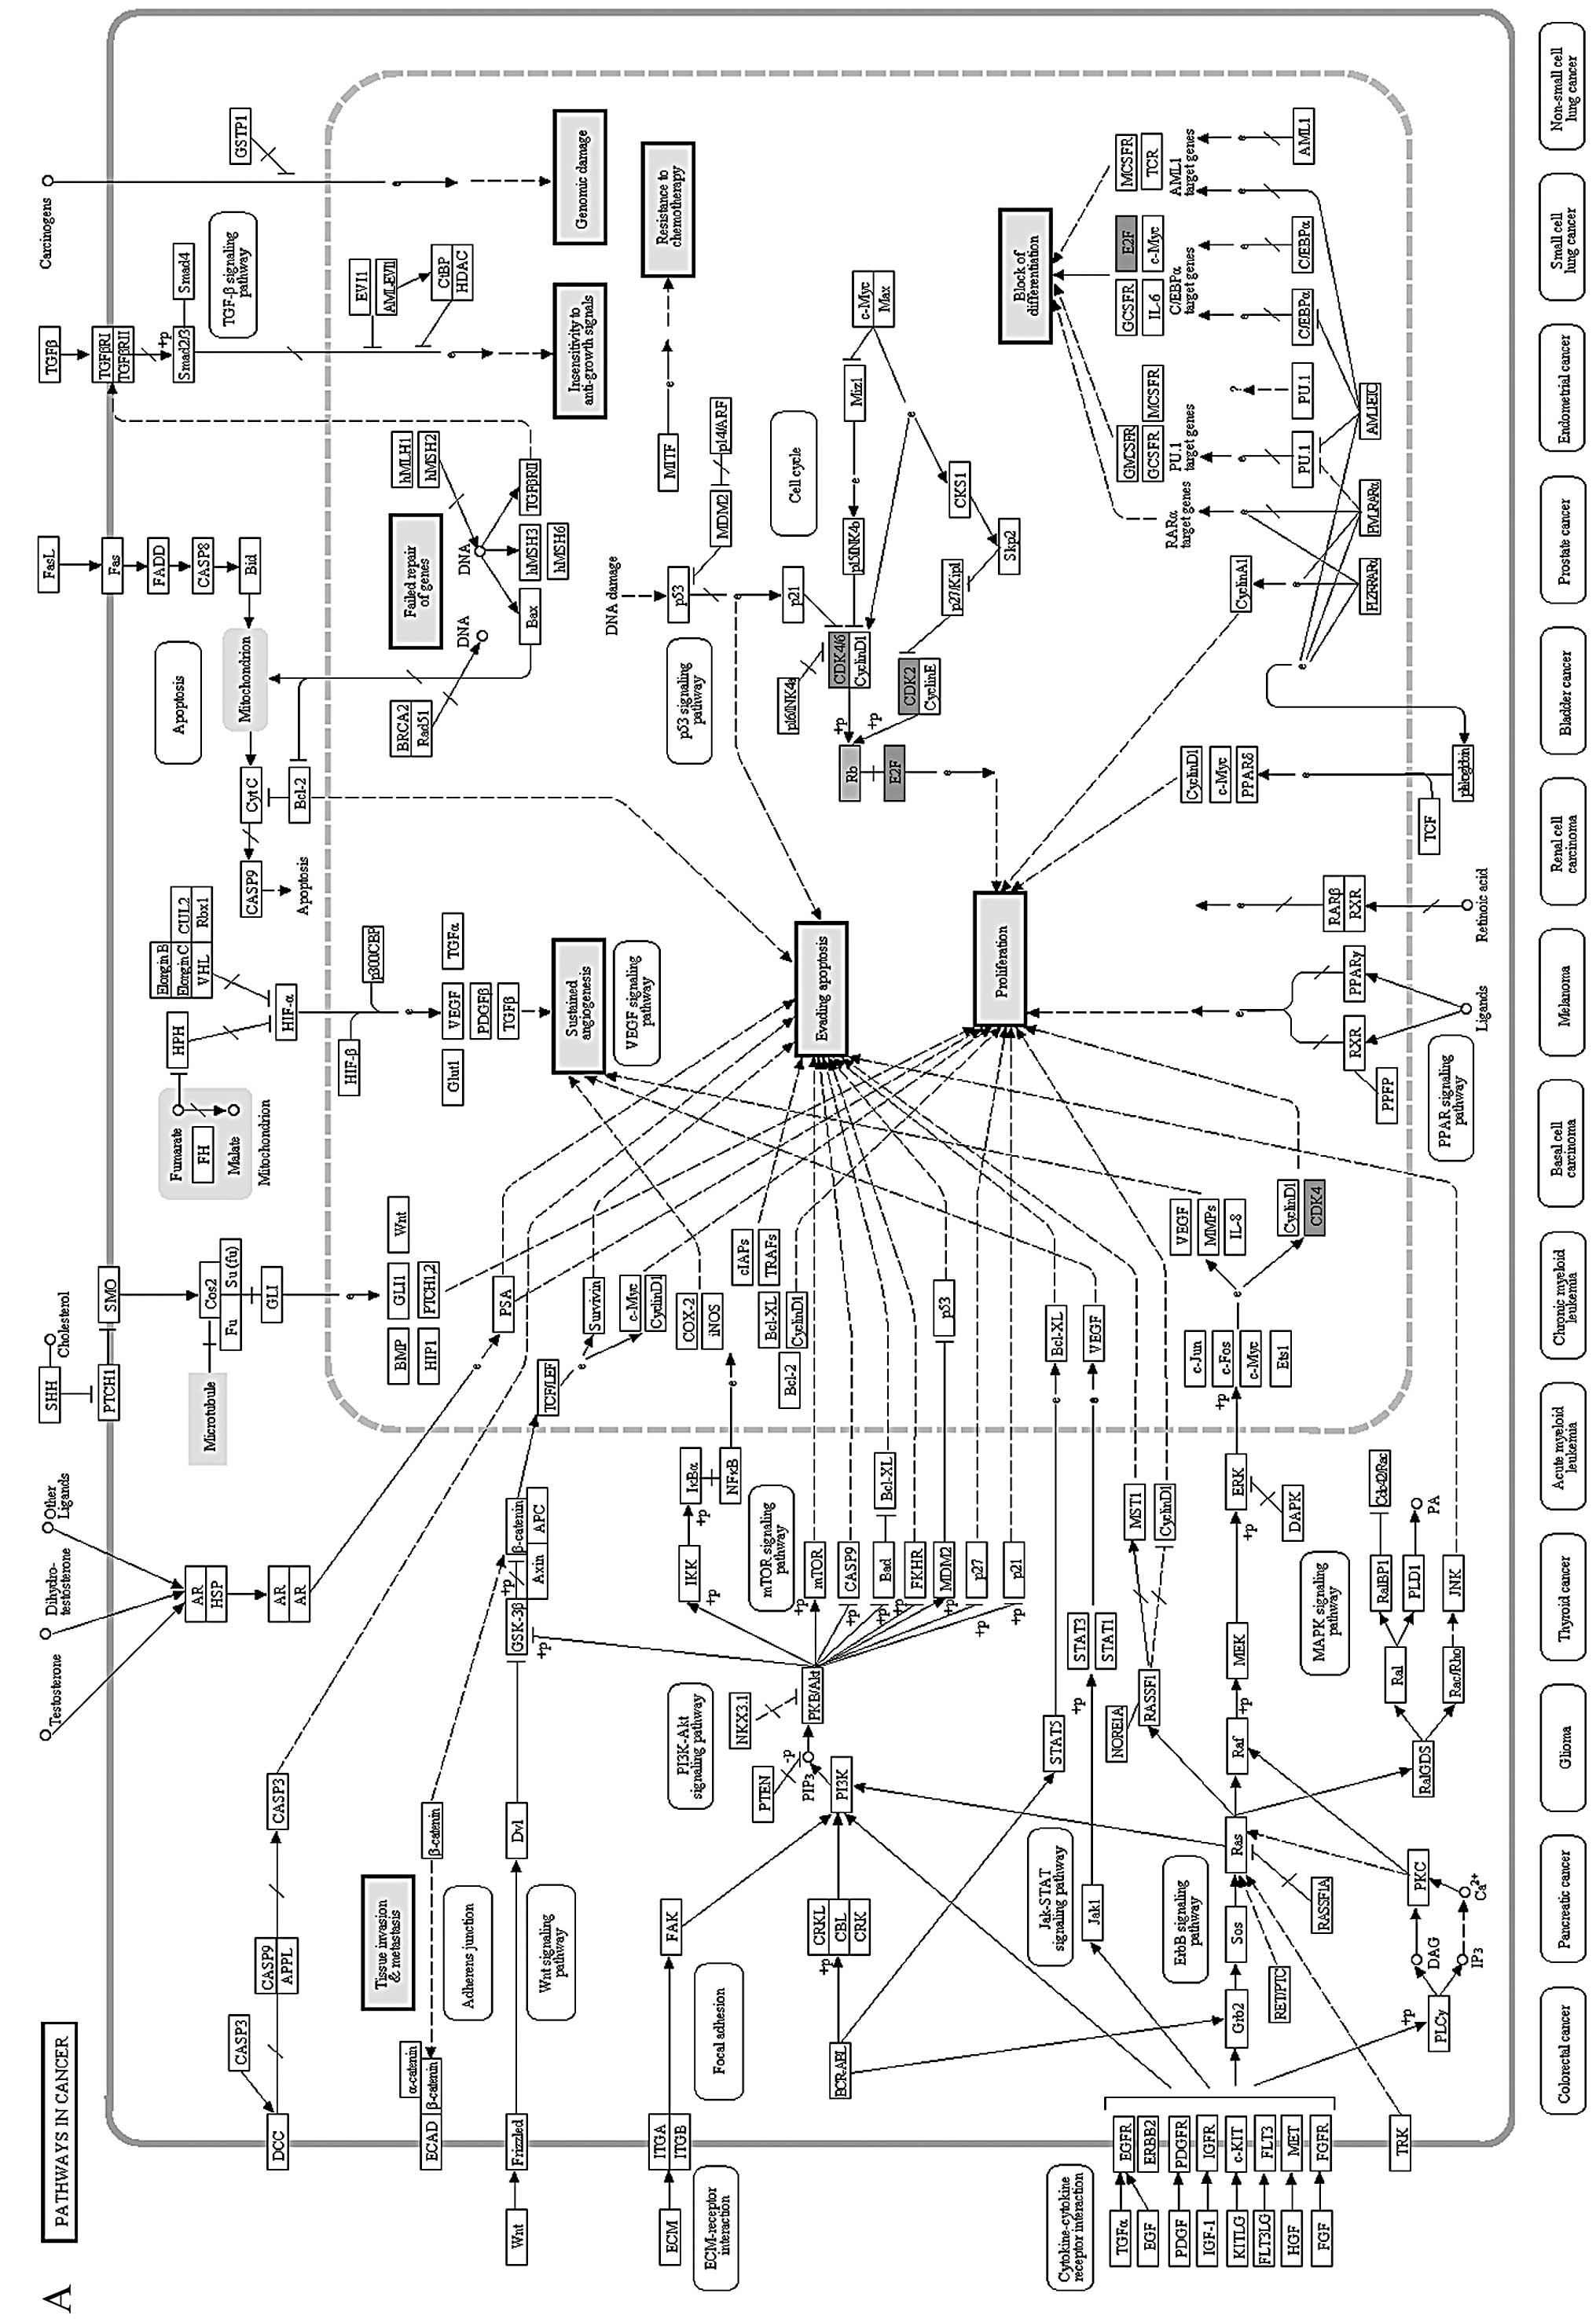
The 4 proteins were then mapped onto a KEGG pathway
termed ‘pathways in cancer’, in which their locations and effects
were thoroughly analyzed (Fig. 4A).
‘Pathways in cancer’ includes 9 aspects of functional abnormalities
(detailed in the 9 bigger solid boxes) in cancer. Markedly, all 4
proteins were concentrated in the ‘cell-cycle’ pathway and
dysfunction of ‘cell-cycle’ pathway may lead to uncontrolled growth
of tumor cells.
Subsequently, E2F1, RB1, CDK2 and CDK4 were analyzed
by mapping them onto the KEGG pathways of ‘cell cycle’ (Fig. 4B). The 4 proteins mainly played
roles in promoting cells past the G1/S checkpoint. This checkpoint
has the following regulatory process: when the cell is stimulated
by external signals such as growth factors, cyclin D is synthesized
and binds to CDK4/CDK6 to form a complex, thereby activating the
kinase activity of CDK4/6 (12).
Activated CDK4/6 catalyzes the phosphorylation of Rb protein
(retinoblastoma protein), thereby releasing the transcription
factor E2F that otherwise binds to Rb (13). The free E2F enters the nucleus and
induces the expression of cyclin E and CDK2 to form a cyclin E-CDK2
complex, which further boosts Rb phosphorylation and E2F releases.
Then, E2F enters the nucleus and initiates the expression of a
series of genes associated with DNA synthesis (14). As a consequence, DNA synthesis is
elevated and drives cells to pass the G1/S checkpoint (15). The reported cell cycle regulators
can be divided into three groups: cyclins, cyclin-dependent kinases
(CDKs) and cyclin-dependent kinase inhibitors (CKIs) (16). CDKs function in the central steps of
cell cycle regulation and play crucial roles in modulating cell
proliferation (17). Overactive
CDKs often result in uncontrolled growth of malignant tumors.
Therefore, suppressing CDKs has become a new focus of tumor studies
(18).
Based on the aforementioned theory and reasoning, we
postulated that CDK2 and CDK4 play important roles during the
process that TAMs promote SKOV3 cell proliferation. Thus, these two
genes merit further study.
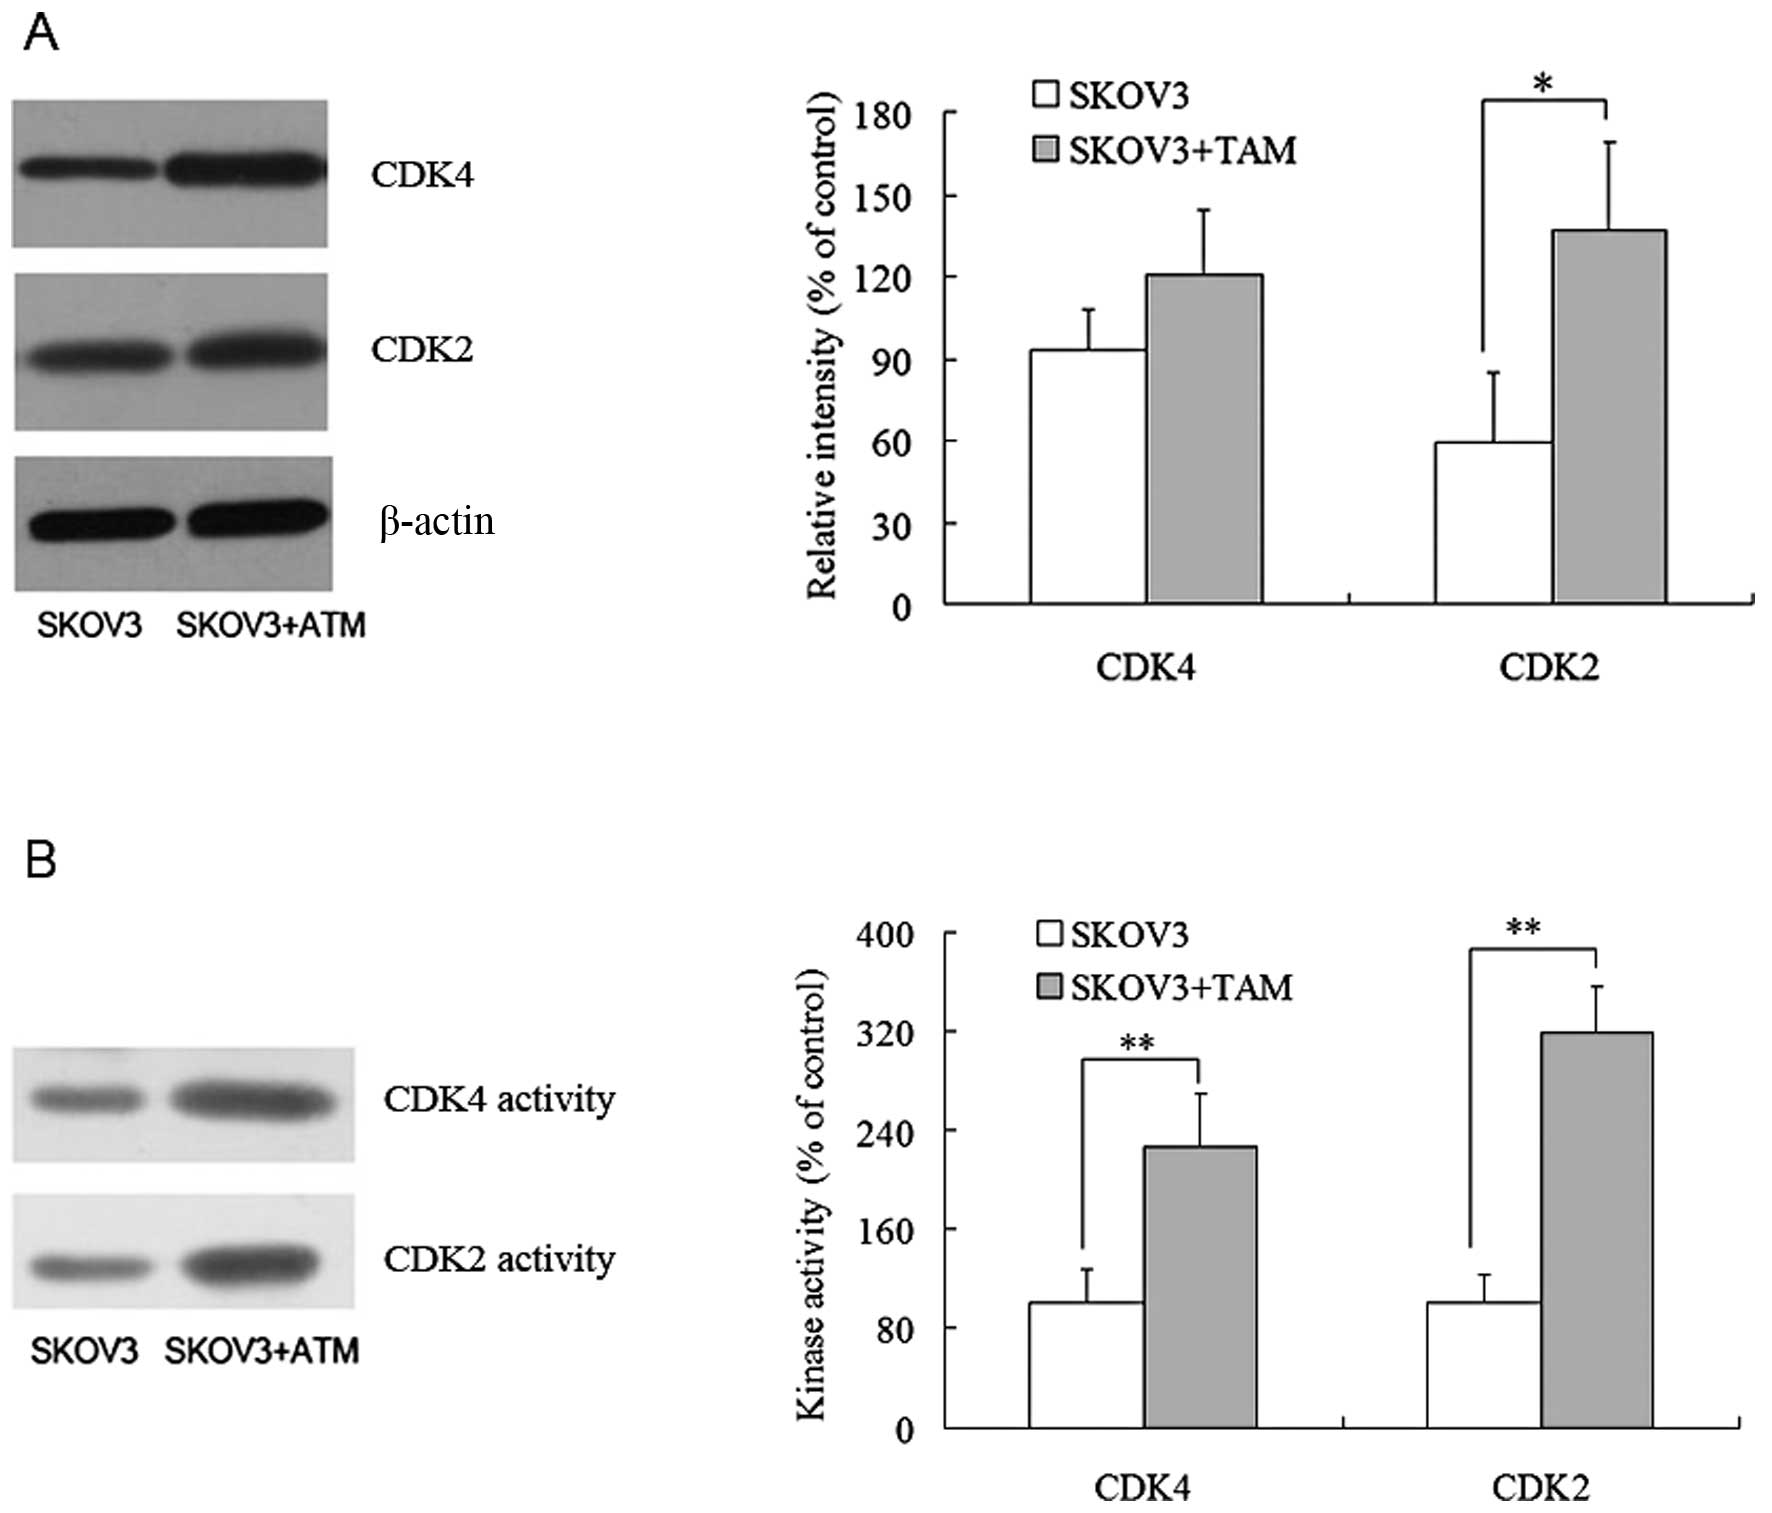
TAMs significantly boost the expression
levels and activities of CDK2 and CDK4 in SKOV3 cells
Via western blot analysis, it was discovered that
SKOV3 cells co-cultured with TAMs exhibited markedly higher CDK2
levels than their single-cultured counterparts. The CDK4 level was
also higher in co-cultured SKOV3, but the difference between the
two groups was not significant (P>0.05) (Fig. 5A). A subsequent examination of the
kinase activities of CDK2 and CDK4 revealed that both kinases
showed significantly higher activities in SKOV3 cells co-cultured
with TAMs (P<0.01) (Fig. 5B).
These results indicated that TAMs can enhance the expression levels
and activities of CDK2 and CDK4.
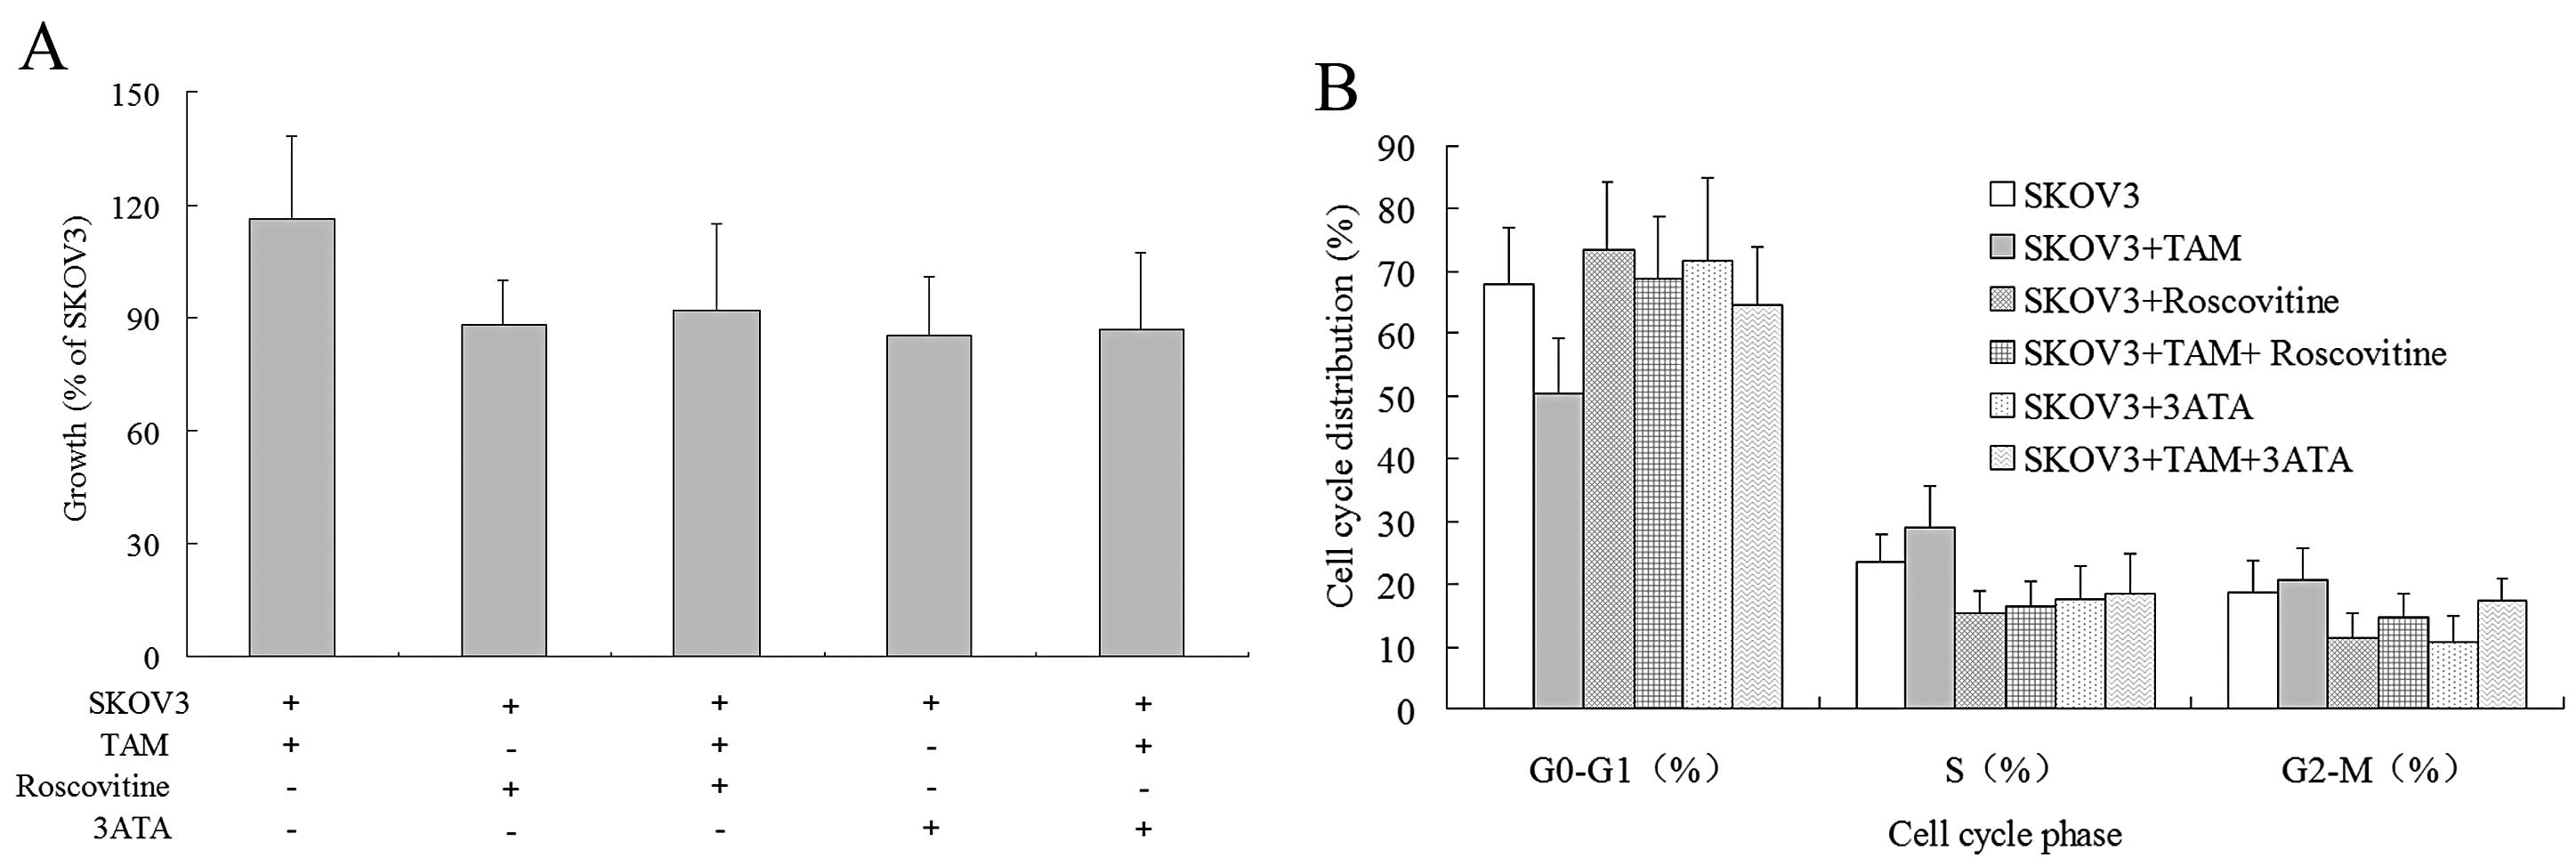
Inhibitors of CDK2 and CDK4 kinases
antagonize the proliferation-promoting effects of TAMs on SKOV3
cells through cell cycle arrest
Using roscovitine, a CDK2-specific inhibitor
(19,20) and 3-ATA, a CDK4-specific inhibitor
(20), we next examined how the
increased abundance and activities of CDK2 and CDK4 affect the
proliferation-promoting effect of M2-TAMs on SKOV3 cells.
3H-TdR incorporation was first performed to investigate
the proliferation of SKOV3 cells under various conditions (Fig. 6A). Roscovitine and 3-ATA reduced the
proliferation rates of SKOV3 cells by 12 and 15%, respectively,
indicating that CDK2 and CDK4 play important regulatory roles in
the normal proliferation of SKOV3 cells. After co-culture with TAMs
for 72 h, the proliferation of SKOV3 cells increased by 16%. In the
presence of roscovitine or 3-ATA, however, co-culture with TAM only
increased the proliferation of SKOV3 cells by 4 or 2%,
respectively, suggesting that the two CDK inhibitors antagonize
most of the proliferation-promoting effects of TAMs on the cells.
These results support the idea that CDK2 and CDK4 play important
roles during the process that TAMs promote SKOV3 cell
proliferation.
We next utilized flow cytometry to examine the cell
cycle distribution of SKOV3 cells under different conditions
(Fig. 6B). Roscovitine and 3-ATA
increased the number of SKOV3 cells in the G0/G1 phase and reduced
the number in the S phase, indicating that both CDK2 and CDK4 can
encourage SKOV3 cells to shift from the G1 phase to the S phase,
thereby promoting their proliferation. After 72 h of co-culture
with TAMs, there was a reduced proportion of SKOV3 cells in the
G0/G1 phase and an increased percentage in the S phase, indicating
that TAMs boost the transition of SKOV3 cells from the G1 phase to
the S phase. In the presence of roscovitine or 3-ATA, the
stimulatory effects of TAMs on the transition of SKOV3 cells from
the G1 phase to the S phase was mostly abolished and the percentage
of cells in the S phase was enhanced by only 1.08 and 0.82%,
respectively. The results indicated that CDK2 and CDK4 are crucial
for the proliferation-promoting effects of TAMs on SKOV3 cells
through pushing cell cycle progression from the G1 phase to the S
phase.
Discussion
The microenvironment of ovarian cancer consists of
tumor tissues, ascitic fluid and peritoneum. Studies have
demonstrated that large quantities of M2-polarized TAMs are present
in these locations. Freedman et al (21) discovered that the abdominal
peritonea of patients with advanced ovarian cancer were infiltrated
by large quantities of mononuclear macrophages even if there was no
tumor invasion. In the ascitic fluid of ovarian cancer, macrophages
can account for 50% or more of the mononuclear leukocytes (22). Yip et al (23) reported that TGF-β, VEGF, IL-10,
cyclooxygenase (COX) and prostaglandin E2 (PGE2) were the main
immune inhibitors secreted by ovarian cancer cells and that TGF-β,
VEGF, IL-10 and COX could all induce M2 polarization of TAMs. TAMs
in the ovarian cancer microenvironment play a pivotal role in the
progression and prognosis of the disease. Wan et al
(24) reported that individuals
with high-density infiltration of TAMs had a lower 5-year survival
rate and that such high TAM levels is an independent prognostic
factor in ovarian cancer.
In previous years, it was discovered that TAMs
promote the development, invasion and metastasis of tumor cells
through several mechanisms including suppressing inflammation in
the acute phase, suppressing the Th1 immune response, enhancing
tumor angiogenesis, inducing matrix reconstruction and improving
the immune tolerance of tumor cells (25). Currently, little effort has been
made to elucidate the underlying mechanisms by which TAM promotes
ovarian cancer (26–28), and the relevant studies have mainly
focused on the inhibition of the Th1 immune response.
Target molecules or research directions for the
previous research on the mechanisms by which TAMs promote the
development of ovarian cancer were mostly determined by reference
to available knowledge and experience. For example, the mechanisms
by which TAMs augment other types of tumors can be referenced. In
fact, such experimental design is, to some degree, subjective,
one-sided and difficult to grasp key issues. This is also a major
disadvantage of experimental design in molecular biology. To
effectively overcome this problem, the present study employed a
method of systems biology in which a microarray technology was used
to acquire the whole-genome differential gene expression data
between SKOV3 ovarian carcinoma cells co-cultured with and without
TAMs (revealing a total of 996 differentially expressed genes).
Despite the large number of new bioinformatic
methods, different methods often generate enormously different
results from the same set of biological data. Therefore, currently,
there is no research method or model that is universally accepted.
Since each analytical method has its pros and cons, it is often
very difficult to choose a more reasonable method for analyzing a
particular type of data. In the next step of data analysis, the
present study attempted a data processing method and achieved a
satisfactory outcome, as detailed below.
Specifically, we first used the differential gene
expression data and the human PPI network to establish a network
showing the influence of TAMs on SKOV3 cells that was composed of
105 genes. Subsequently, the network was analyzed with
bionetwork-processing software for module dividing based on the
modular properties intrinsic to biological networks (29,30).
The analysis yielded four functional modules. To a certain degree,
modules in a biological network represent functional units in life
processes, such that the functional similarity between biomolecules
within a module is far greater than that between those from
different modules (31). Hence,
dividing a biological network into modules, rather than
characterizing the entire sophisticated biological network, is not
only beneficial for understanding the mechanism underlying a
biological function, but it also considerably reduces the
complexity of the question.
After obtaining the functional modules of the
network, the next step is to perform focused research. Here, we
performed functional annotations using KEGG pathways and GO-BP
terms for the four modules and narrowed our focus to one target
module, which comprised 31 genes. After constructing a
gene-function network of the target module, four genes were found
functional. By comprehensively reviewing the research progress
associated with the functions of these four genes, CDK2 and CDK4
were hypothesized to play key roles in the influence of TAMs on
SKOV3 cells and, thus, warranted further study.
Lastly, molecular biology experiments were performed
to preliminarily demonstrate that CDK2 and CDK4 play important
roles in the proliferation-promoting effects of TAMs on SKOV3
cells. To the best of our knowledge, similar studies have not been
reported.
It is apparent that systems biology methods could
initiate a study from a comprehensive and global perspective. The
bioinformatic approach adopted in this study narrowed down targets
in a stepwise fashion and finally accurately located the crux of
the problem. Therefore, the bioinformatic results can be used to
effectively guide the design of molecular biology experiments,
which to a certain degree can avoid being subjective and one-sided,
thereby saving considerable effort, materials and money.
In summary, the present study identified the
specific changes in the gene expression profile of SKOV3 ovarian
carcinoma cells under the influence of TAMs and explored a method
for analyzing the gene expression profile data. The results may
benefit the design of subsequent molecular experiments.
References
|
1
|
Yin F, Liu X, Li D, Wang Q, Zhang W and Li
L: Tumor suppressor genes associated with drug resistance in
ovarian cancer (Review). Oncol Rep. 30:3–10. 2013.PubMed/NCBI
|
|
2
|
Sorbe B, Graflund M, Nygren L, Horvath G,
Swahn M, Boman K, Bangshöj R, Lood M and Malmström H: A phase II
study of docetaxel weekly in combination with carboplatin every
three weeks as first line chemotherapy in stage IIB-IV epithelial
ovarian cancer: Neurological toxicity and quality-of-life
evaluation. Int J Oncol. 40:773–781. 2012.
|
|
3
|
Pello OM, De Pizzol M, Mirolo M, Soucek L,
Zammataro L, Amabile A, Doni A, Nebuloni M, Swigart LB, Evan GI,
Mantovani A and Locati M: Role of c-MYC in alternative activation
of human macrophages and tumor-associated macrophage biology.
Blood. 119:411–421. 2012. View Article : Google Scholar : PubMed/NCBI
|
|
4
|
Okada M, Saio M, Kito Y, Ohe N, Yano H,
Yoshimura S, Iwama T and Takami T: Tumor-associated
macrophage/microglia infiltration in human gliomas is correlated
with MCP-3, but not MCP-1. Int J Oncol. 34:1621–1627.
2009.PubMed/NCBI
|
|
5
|
Zhang T, Ma Z, Wang R, Wang Y, Wang S,
Cheng Z, Xu H, Jin X, Li W and Wang X: Thrombin facilitates
invasion of ovarian cancer along peritoneum by inducing monocyte
differentiation toward tumor-associated macrophage-like cells.
Cancer Immunol Immunother. 59:1097–1108. 2010. View Article : Google Scholar
|
|
6
|
Wang X, Deavers M, Patenia R, Bassett RL
Jr, Mueller P, Ma Q, Wang E and Freedman RS: Monocyte/macrophage
and T-cell infiltrates in peritoneum of patients with ovarian
cancer or benign pelvic disease. J Transl Med. 4:302006. View Article : Google Scholar : PubMed/NCBI
|
|
7
|
Webb S: A decade after the genome,
bioinformatics comes of age. Biotechniques. 51:157–161. 2011.
View Article : Google Scholar : PubMed/NCBI
|
|
8
|
Keshava Prasad TS, Goel R, Kandasamy K,
Keerthikumar S, Kumar S, Mathivanan S, Telikicherla D, Raju R,
Shafreen B, Venugopal A, Balakrishnan L, Marimuthu A, Banerjee S,
Somanathan DS, Sebastian A, Rani S, Ray S, Harrys Kishore CJ, Kanth
S, Ahmed M, Kashyap MK, Mohmood R, Ramachandra YL, Krishna V,
Rahiman BA, Mohan S, Ranganathan P, Ramabadran S, Chaerkady R and
Pandey A: Human Protein Reference Database - 2009 update. Nucleic
Acids Res. 37(Database issue): D767–D772. 2009.PubMed/NCBI
|
|
9
|
Adamcsek B, Palla G, Farkas IJ, Derényi I
and Vicsek T: CFinder: locating cliques and overlapping modules in
biological networks. Bioinformatics. 22:1021–1023. 2006. View Article : Google Scholar : PubMed/NCBI
|
|
10
|
Gao Y, Lu XC, Yang HY, Liu XF, Cao J and
Fan L: The molecular mechanism of the anticancer effect of
atorvastatin: DNA microarray and bioinformatic analyses. Int J Mol
Med. 30:765–774. 2012.PubMed/NCBI
|
|
11
|
Smoot ME, Ono K, Ruscheinski J, Wang PL
and Ideker T: Cytoscape 2.8: new features for data integration and
network visualization. Bioinformatics. 27:431–432. 2011. View Article : Google Scholar : PubMed/NCBI
|
|
12
|
Bretz J, Garcia J, Huang X, Kang L, Zhang
Y, Toellner KM and Chen-Kiang S: Noxa mediates p18INK4c cell-cycle
control of homeostasis in B cells and plasma cell precursors.
Blood. 117:2179–2188. 2011. View Article : Google Scholar : PubMed/NCBI
|
|
13
|
Dickson MA, Tap WD, Keohan ML, D’Angelo
SP, Gounder MM, Antonescu CR, Landa J, Qin LX, Rathbone DD, Condy
MM, Ustoyev Y, Crago AM, Singer S and Schwartz GK: Phase II trial
of the CDK4 inhibitor PD0332991 in patients with advanced
CDK4-amplified well-differentiated or dedifferentiated liposarcoma.
J Clin Oncol. 31:2024–2028. 2013. View Article : Google Scholar : PubMed/NCBI
|
|
14
|
Kolupaeva V and Basilico C: Overexpression
of cyclin E/CDK2 complexes overcomes FGF-induced cell cycle arrest
in the presence of hypophosphorylated Rb proteins. Cell Cycle.
11:2557–2566. 2012. View
Article : Google Scholar : PubMed/NCBI
|
|
15
|
Baydoun HH, Pancewicz J, Bai X and Nicot
C: HTLV-I p30 inhibits multiple S phase entry checkpoints,
decreases cyclin E-CDK2 interactions and delays cell cycle
progression. Mol Cancer. 9:3022010. View Article : Google Scholar : PubMed/NCBI
|
|
16
|
Lim S and Kaldis P: Cdks, cyclins and
CKIs: roles beyond cell cycle regulation. Development.
140:3079–3093. 2013. View Article : Google Scholar : PubMed/NCBI
|
|
17
|
Lin WR, Lai MW and Yeh CT:
Cyclin-dependent kinase-associated protein phosphatase is
overexpressed in alcohol-related hepatocellular carcinoma and
influences xenograft tumor growth. Oncol Rep. 29:903–910. 2013.
|
|
18
|
Choi YH and Yoo YH: Taxol-induced growth
arrest and apoptosis is associated with the upregulation of the Cdk
inhibitor, p21WAF1/CIP1, in human breast cancer cells. Oncol Rep.
28:2163–2169. 2012.PubMed/NCBI
|
|
19
|
Nair BC, Vallabhaneni S, Tekmal RR and
Vadlamudi RK: Roscovitine confers tumor suppressive effect on
therapy-resistant breast tumor cells. Breast Cancer Res.
13:R802011. View
Article : Google Scholar : PubMed/NCBI
|
|
20
|
Shin JS, Hong SW, Lee SL, Kim TH, Park IC,
An SK, Lee WK, Lim JS, Kim KI, Yang Y, Lee SS, Jin DH and Lee MS:
Serum starvation induces G1 arrest through suppression of Skp2-CDK2
and CDK4 in SK-OV-3 cells. Int J Oncol. 32:435–439. 2008.PubMed/NCBI
|
|
21
|
Freedman RS, Ma Q, Wang E, Gallardo ST,
Gordon IO, Shin JW, Jin P, Stroncek D and Marincola FM: Migration
deficit in monocyte-macrophages in human ovarian cancer. Cancer
Immunol Immunother. 57:635–645. 2008. View Article : Google Scholar : PubMed/NCBI
|
|
22
|
Pollard JW: Tumour-educated macrophages
promote tumour progression and metastasis. Nat Rev Cancer. 4:71–78.
2004. View
Article : Google Scholar : PubMed/NCBI
|
|
23
|
Yip P, Chen TH, Seshaiah P, Stephen LL,
Michael-Ballard KL, Mapes JP, Mansfield BC and Bertenshaw GP:
Comprehensive serum profiling for the discovery of epithelial
ovarian cancer biomarkers. PLoS One. 6:e295332011. View Article : Google Scholar : PubMed/NCBI
|
|
24
|
Novitskiy SV, Ryzhov S, Zaynagetdinov R,
Goldstein AE, Huang Y, Tikhomirov OY, Blackburn MR, Biaggioni I,
Carbone DP, Feoktistov I and Dikov MM: Adenosine receptors in
regulation of dendritic cell differentiation and function. Blood.
112:1822–1831. 2008. View Article : Google Scholar : PubMed/NCBI
|
|
25
|
Mantovani A, Allavena P, Sica A and
Balkwill F: Cancer-related inflammation. Nature. 454:436–444. 2008.
View Article : Google Scholar
|
|
26
|
Saccani A, Schioppa T, Porta C, Biswas SK,
Nebuloni M, Vago L, Bottazzi B, Colombo MP, Mantovani A and Sica A:
p50 nuclear factor-κB overexpression in tumor-associated
macrophages inhibits M1 inflammatory responses and antitumor
resistance. Cancer Res. 66:11432–11440. 2006.
|
|
27
|
Curiel TJ, Coukos G, Zou L, Alvarez X,
Cheng P, Mottram P, Evdemon-Hogan M, Conejo-Garcia JR, Zhang L,
Burow M, Zhu Y, Wei S, Kryczek I, Daniel B, Gordon A, Myers L,
Lackner A, Disis ML, Knutson KL, Chen L and Zou W: Specific
recruitment of regulatory T cells in ovarian carcinoma fosters
immune privilege and predicts reduced survival. Nat Med.
10:942–949. 2004. View
Article : Google Scholar : PubMed/NCBI
|
|
28
|
Kryczek I, Zou L, Rodriguez P, Zhu G, Wei
S, Mottram P, Brumlik M, Cheng P, Curiel T, Myers L, Lackner A,
Alvarez X, Ochoa A, Chen L and Zou W: B7-H4 expression identifies a
novel suppressive macrophage population in human ovarian carcinoma.
J Exp Med. 203:871–881. 2006. View Article : Google Scholar : PubMed/NCBI
|
|
29
|
Alon U: Biological networks: the tinkerer
as an engineer. Science. 301:1866–1867. 2003. View Article : Google Scholar : PubMed/NCBI
|
|
30
|
Ravasz E and Barabási AL: Hierarchical
organization in complex networks. Phys Rev E Stat Nonlin Soft
Matter Phys. 67:0261122003. View Article : Google Scholar : PubMed/NCBI
|
|
31
|
Hartwell LH, Hopfield JJ, Leibler S and
Murray AW: From molecular to modular cell biology. Nature.
402:C47–C52. 1999. View
Article : Google Scholar : PubMed/NCBI
|