Introduction
Malignant astrocytoma is one of the most common
primary tumors of the central nervous system (CNS), accounting for
~40–60% of intracranial tumors (1),
and patients exhibit poor prognosis and an extremely short median
survival time, which are mainly related to the biological
characteristics of abnormal proliferation and invasive growth of
astrocytoma cells. Previous studies have shown that various types
of Na+ channels are widely distributed on the
astrocytoma cell membrane (2).
These channels play important roles in stabilizing the membrane
potential, intracellular Na+ balance, and
Na+/K+ ATPase activity of astrocytoma cells
as well as participating in the processes of cell cycle regulation
and apoptosis, which directly and indirectly affect cell
proliferation and metastasis in astrocytomas. Thus, Na+
channels are expected to become a new target for gene therapy for
astrocytoma (3–6). Our previous studies found that a new
neonatal isoform of the Nav1.5 Na+ channel, neonatal
Nav1.5 (nNav1.5), was functionally expressed in human brain
neuroblastoma NB-1 cells (7–9). This
neonatal isoform is considered to be the re-expression of an
embryonic gene or oncogene, and its expression is intimately
related to the occurrence and development of tumors, which has been
confirmed in lymphoma and breast cancer (10–12).
To date, no study concerning the specific expression of nNav1.5 in
human brain astrocytoma and its effect on the processes of tumor
cell proliferation and invasion has been reported.
The present study investigated the expression of
nNav1.5 in human brain astrocytoma in detail to localize nNav1.5
protein expression in astrocytoma cells for the first time. RNA
interference (RNAi) technology was applied to transfect a small
interfering RNA (siRNA) against nNav1.5 into U251 cells, and its
effects on cell proliferation, metastasis, invasion, and apoptosis
were observed to explore the relationship between expression of the
voltage-gated sodium channel (VGSC) α subtype nNav1.5 in
astrocytoma cells and the biological behavior of the tumor cells,
thereby providing new ideas and methods for molecular and gene
therapies for astrocytoma.
Materials and methods
Source of specimens
The astrocytoma tissues were collected from 68
patients with brain astrocytomas admitted to the Department of
Neurosurgery at the First Hospital of China Medical University from
October 2011 to October 2012. The tumors were pathologically
confirmed after surgery by two experienced neuropathologists, and
12 normal brain tissue samples were collected from the available
normal brain tissue specimens following decompression surgery for
traumatic brain injury. The 68 patients with brain astrocytomas
included 36 men and 32 women with a median age of 44 years (range
23 to 67 years). According to the 2007 classification of CNS tumors
by the World Health Organization (WHO), the pathological diagnosis
showed 4 cases of tumors in grade I, 21 cases in grade II, 23 cases
in grade III and 20 cases in grade IV. The tumor samples were
subsequently classified into a low-grade group (grade I–II) and
high-grade group (grade III–IV). None of the patients received
preoperative antitumor therapy. Each patient signed an informed
consent form, and the study was approved by the Ethics Committee of
China Medical University and the Review Board of the First Hospital
of China Medical University and met the requirements of the
Helsinki Declaration by the World Medical Association.
Cell culture
The human astrocytoma cell line U251 was purchased
from the Cell Resource Center of Shanghai Institutes for Biological
Sciences, the Chinese Academy of Science, and the cells were
cultured in Dulbecco’s modified Eagle’s medium (DMEM, high-glucose)
containing 10% fetal bovine serum (FBS) (both from HyClone, Logan,
UT, USA) at 37°C in 5% CO2 and 100% humidity. The medium
was changed regularly, and the cells were treated with routine
enzymatic digestion and passage.
Intracellular localization of nNav1.5
protein
U251 cells in the logarithmic growth phase were
seeded onto 6-well plates (Corning, Corning, NY, USA) pre-set with
coverslips. When the confluence of the adherent growing cells
reached 50–60%, the coverslips were taken out and fixed. The cells
were then incubated with rabbit anti-human Nav1.5 polyclonal
antibody (1:150; Abcam, Cambridge, UK) and mouse anti-human GFAP
monoclonal antibody (1:100; Abcam) at room temperature overnight,
and then incubated with DyLight 594-labeled goat anti-rabbit IgG
(1:150; EarthOx, USA) and FITC-labeled goat anti-mouse IgG (1:150;
Jackson, USA) at room temperature for 2 h. Cell nuclei were
counterstained with 4,6-diamidino-2-phenylindole (DAPI; Invitrogen,
Carlsbad, CA, USA). Results were visualized under a laser confocal
microscope (Olympus FluoView FV300; Olympus Co., Tokyo, Japan).
Real-time quantitative RT-PCR
Total RNA was extracted from the tissues using the
RNAiso Plus kit (Takara, Otsu, Shiga, Japan), and the RNA was
reversely transcribed into cDNA according to the manufacturer’s
instructions (Takara). Gene-specific primers were designed and
synthesized by Takara Inc. (Dalian, China), and the sequences are
listed in Table I. Real-time RT-PCR
was performed on an ABI PRISM 7000 Real-Time PCR System (Applied
Biosystems, Foster City, CA, USA) using the SYBR Premix Ex Taq™ kit
(Takara, Japan). The reaction conditions consisted of 95°C for 5
min followed by 40 cycles of 95°C for 1 min, 58°C for 1 min and
72°C for 1 min. For each analysis, results were calculated using
the 2−ΔΔCt method and normalized by the expression of
β-actin. Reactions were performed in triplicate for each
sample.
 | Table IPrimers used for real-time
RT-PCR. |
Table I
Primers used for real-time
RT-PCR.
| Gene | Primer
sequences | Product size
(bp) |
|---|
| nNav1.5 (F) |
5′-ACCTTGTGGTCCTGAATCTC-3′ | 282 |
| nNav1.5 (R) |
5′-GAGGCACCTTCTCCGTCT-3′ | |
| β-actin (F) |
5′-TCACCCACATGTGCCCATCTACGA-3′ | 295 |
| β-actin (R) |
5′-CAGCGGAACCGCTCATTGCCAATGG-3′ | |
Immunohistochemistry
All tissue specimens were fixed with 4%
paraformaldehyde to prepare the paraffin-embedded specimens in 4-μm
sections. Immunohistochemistry was performed according to the
manufacturer’s instructions for the Histostain-SP kit (Invitrogen).
Rabbit anti-human polyclonal Nav1.5 antibody (1:250; Abcam) and
biotinylated goat anti-rabbit IgG were used as the primary and
secondary antibody, respectively. After counterstaining with
3,3′-diaminobenzidine (DAB), the sections were inspected under an
optical microscope (BX40; Olympus Co.). For the control sections,
the primary antibody was replaced by phosphate-buffered saline
(PBS).
Western blot assay
Approximately 100 mg of tissue was used for sodium
dodecyl sulfate polyacrylamide gel electrophoresis (SDS/PAGE) and
western blot analysis, as described in a previous study (13). After the protein concentration was
determined using the BCA protein assay kit (R&D Systems,
Minneapolis, MN, USA) according to the manufacturer’s instructions,
50 μg of protein was resolved by SDS-PAGE, transferred onto
polyvinylidene fluoride (PVDF) membranes (Roche, Indianapolis, IN,
USA) by electroblotting, probed with specific primary antibodies,
followed by secondary antibody conjugation and analyzed. The
primary antibody was rabbit anti-human Nav1.5 polyclonal antibody
(1:500; Abcam) and was detected using horseradish
peroxidase-labeled goat anti-rabbit secondary antibody (1:10,000;
Santa Cruz, Santa Cruz, CA, USA). Immunoreactive protein bands were
detected with an enhanced chemiluminescence reagent (ECL-Plus) and
densitometrically quantitated according to the manufacturer’s
instructions (Amersham Pharmacia Biotech, Piscataway, NJ, USA).
Design and transfection of siRNA
The siRNA and siRNA-NC primers were designed and
synthesized by Sigma-Aldrich Trading Co., Ltd. (Shanghai, China);
sequences are presented in Table
II. Well-growing U251 cells in the logarithmic growth phase
were seeded at a density of 1×10⁶ cells/well in 6-well
plates (Corning) and cultured for 12 h. The following groups were
established for the experiment: the blank group (without any
treatment), the control group (transfected with siRNA-NC), the
siRNA-1 group (transfected with siRNA-1), the siRNA-2 group
(transfected with siRNA-2) and the siRNA-3 group (transfected with
siRNA-3). Transfection was carried out according to the
instructions for the Lipofectamine™ 2000 reagent (Invitrogen) as
previously described (14).
| Table IIPrimers of SCN5A/nNav1.5 siRNA. |
Table II
Primers of SCN5A/nNav1.5 siRNA.
| Gene | Primer
sequences |
|---|
| siRNA-1 (F) |
5′-GAGAUGACCUUCAAGAUCAdTdT-3′ |
| siRNA-1 (R) |
5′-UGAUCUUGAAGGUCAUCUCdTdT-3′ |
| siRNA-2 (F) |
5′-GAGUGAAGUUGGUGGUCAUdTdT-3′ |
| siRNA-2 (R) |
5′-AUGACCACCAACUUCACUCdTdT-3′ |
| siRNA-3 (F) |
5′-CAUUAUGCCUGCUGGUCUUdTdT-3′ |
| siRNA-3 (R) |
5′-AAGACCAGCAGGCAUAAUGdTdT-3′ |
| siRNA-NC (F) |
5′-UUCUCCGAACGUGUCACGUTT-3′ |
| siRNA-NC (R) |
5′-ACGUGACACGUUCGGAGAATT-3′ |
mRNA and protein determination following
cell transfection
Transfection was followed by real-time quantitative
RT-PCR and western blot assay to detect the nNav1.5 expression in
the cells after 24 and 48 h, respectively. The detailed procedures
were the same as mentioned in the ‘Real-time quantitative RT-PCR’
and ‘Western blot assay’ sections.
MTT proliferation assay
After adjusting the cell density to
3×10⁴/ml, well-growing U251 cells in the logarithmic
growth phase were seeded onto a 96-well plate (Corning) at 100
μl/well. Eight duplicate wells were established for each group. The
cells were placed in a 37°C, 5% CO2, saturated humidity
incubator for conventional culture, and the transfection with
medium change was carried out after 24 h. The experimental groups
were as follows: the blank group (without any treatment), the
control group (transfected with siRNA-NC) and the siRNA group
(transfected with siRNA-1). The transfection procedure was the same
as above, and the cells continued to be routinely cultured after
transfection. The assay was performed at 0, 24, 48, 72 and 96 h.
For the assay, 10 μl of CCK-8 reagent (Dojindo Molecular
Technologies, Kumamoto, Japan) was added to each well, vortexed to
mix and incubated at 37°C for 1 h. The absorbance (OD) value at 450
nm for each well was measured with a microplate reader (Bio-Rad,
Hercules, CA, USA). With time on the x-axis and the OD value on the
y-axis, the growth curve was plotted for each group of cells and
the inhibition rate of cell proliferation was calculated.
Wound healing assay
U251 cells before and after transfection were
subjected to a wound healing assay. Cells in the logarithmic growth
phase were seeded onto 6-well plates (Corning) at a density of
1×10⁶/well. After culture for 24 h, the medium was
aspirated and discarded. A scratch in the shape of a straight line
was created along the bottom of the well with a 10-μl pipette tip.
The unattached cells were washed away with PBS, and the image was
photographed for data recording. Ten evenly spaced points were
selected at the edges of the scratch on each side, and the midline
represented the edge of the scratch. The interval between the
scratched cells was measured and recorded under an inverted
microscope with a ruler (0 h). Changes after the 24-h interval were
recorded. The cell metastasis distance was calculated by
subtracting the 24-h interval from the 0-h interval.
Matrigel invasion assay
The Transwell chamber invasion assay kit (Corning)
was used to detect changes in the cell invasiveness 24 h after
transfection with the same experimental groups as in the
proliferation assays. In short, Transwell inserts with an 8-μm pore
size were coated with Matrigel (BD Biosciences, San Jose, CA, USA).
The upper wells contained serum-free DMEM, and DMEM with 15% FBS
was used as an attractant for the lower wells. Six hours after
transfection, the U251 cells were harvested and trypsinized into
single-cell suspensions. The cell density was adjusted to
1×10⁶/ml, and 100 μl of cells were seeded into each
upper chamber. After 24 h of incubation, the non-invading cells in
the upper chambers were gently wiped away, and the adherent cells
on the lower side of each membrane were fixed and stained with
trypan blue solution. Ten fields were randomly selected and counted
under a microscope. Quantification of invasion was performed by
counting the stained cells through the coated membranes. The cell
invasion index percentage was calculated by dividing the number of
cells in the lower chamber by the number of cells seeded in the
upper chamber and then multiplying by 100%.
Flow cytometric assay
Annexin V-FITC/PI (Annexin V-FITC/PI kit; BD, San
Diego, CA, USA) double staining was applied to detect apoptosis.
U251 cells in the logarithmic growth phase were selected for the
assay with the same experimental groupings as in the proliferation
assay. Seventy-two hours after transfection, the cells from each
sample were trypsinized and 1×10⁴ cells were centrifuged
and collected. Cells were re-suspended in 200 μl of staining buffer
and mixed with 10 μl of Annexin V-FITC for 15 min before being
filtered using a 200-μm mesh. After adding 300 μl of staining
buffer and 5 μl of propidium iodide (PI), flow cytometry (BD, San
Jose, CA, USA) was performed to analyze the percentage of apoptotic
cells.
Statistical analysis
Data were analyzed using one-way ANOVA followed by
the Student’s t-test using SPSS 18.0 statistical software (SPSS,
Inc., Chicago, IL, USA). Comparisons were made between appropriate
groups, and differences were considered statistically significant
at the level of P<0.05. Results are expressed as means ±
standard deviation.
Results
Expression of nNav1.5 in astrocytoma
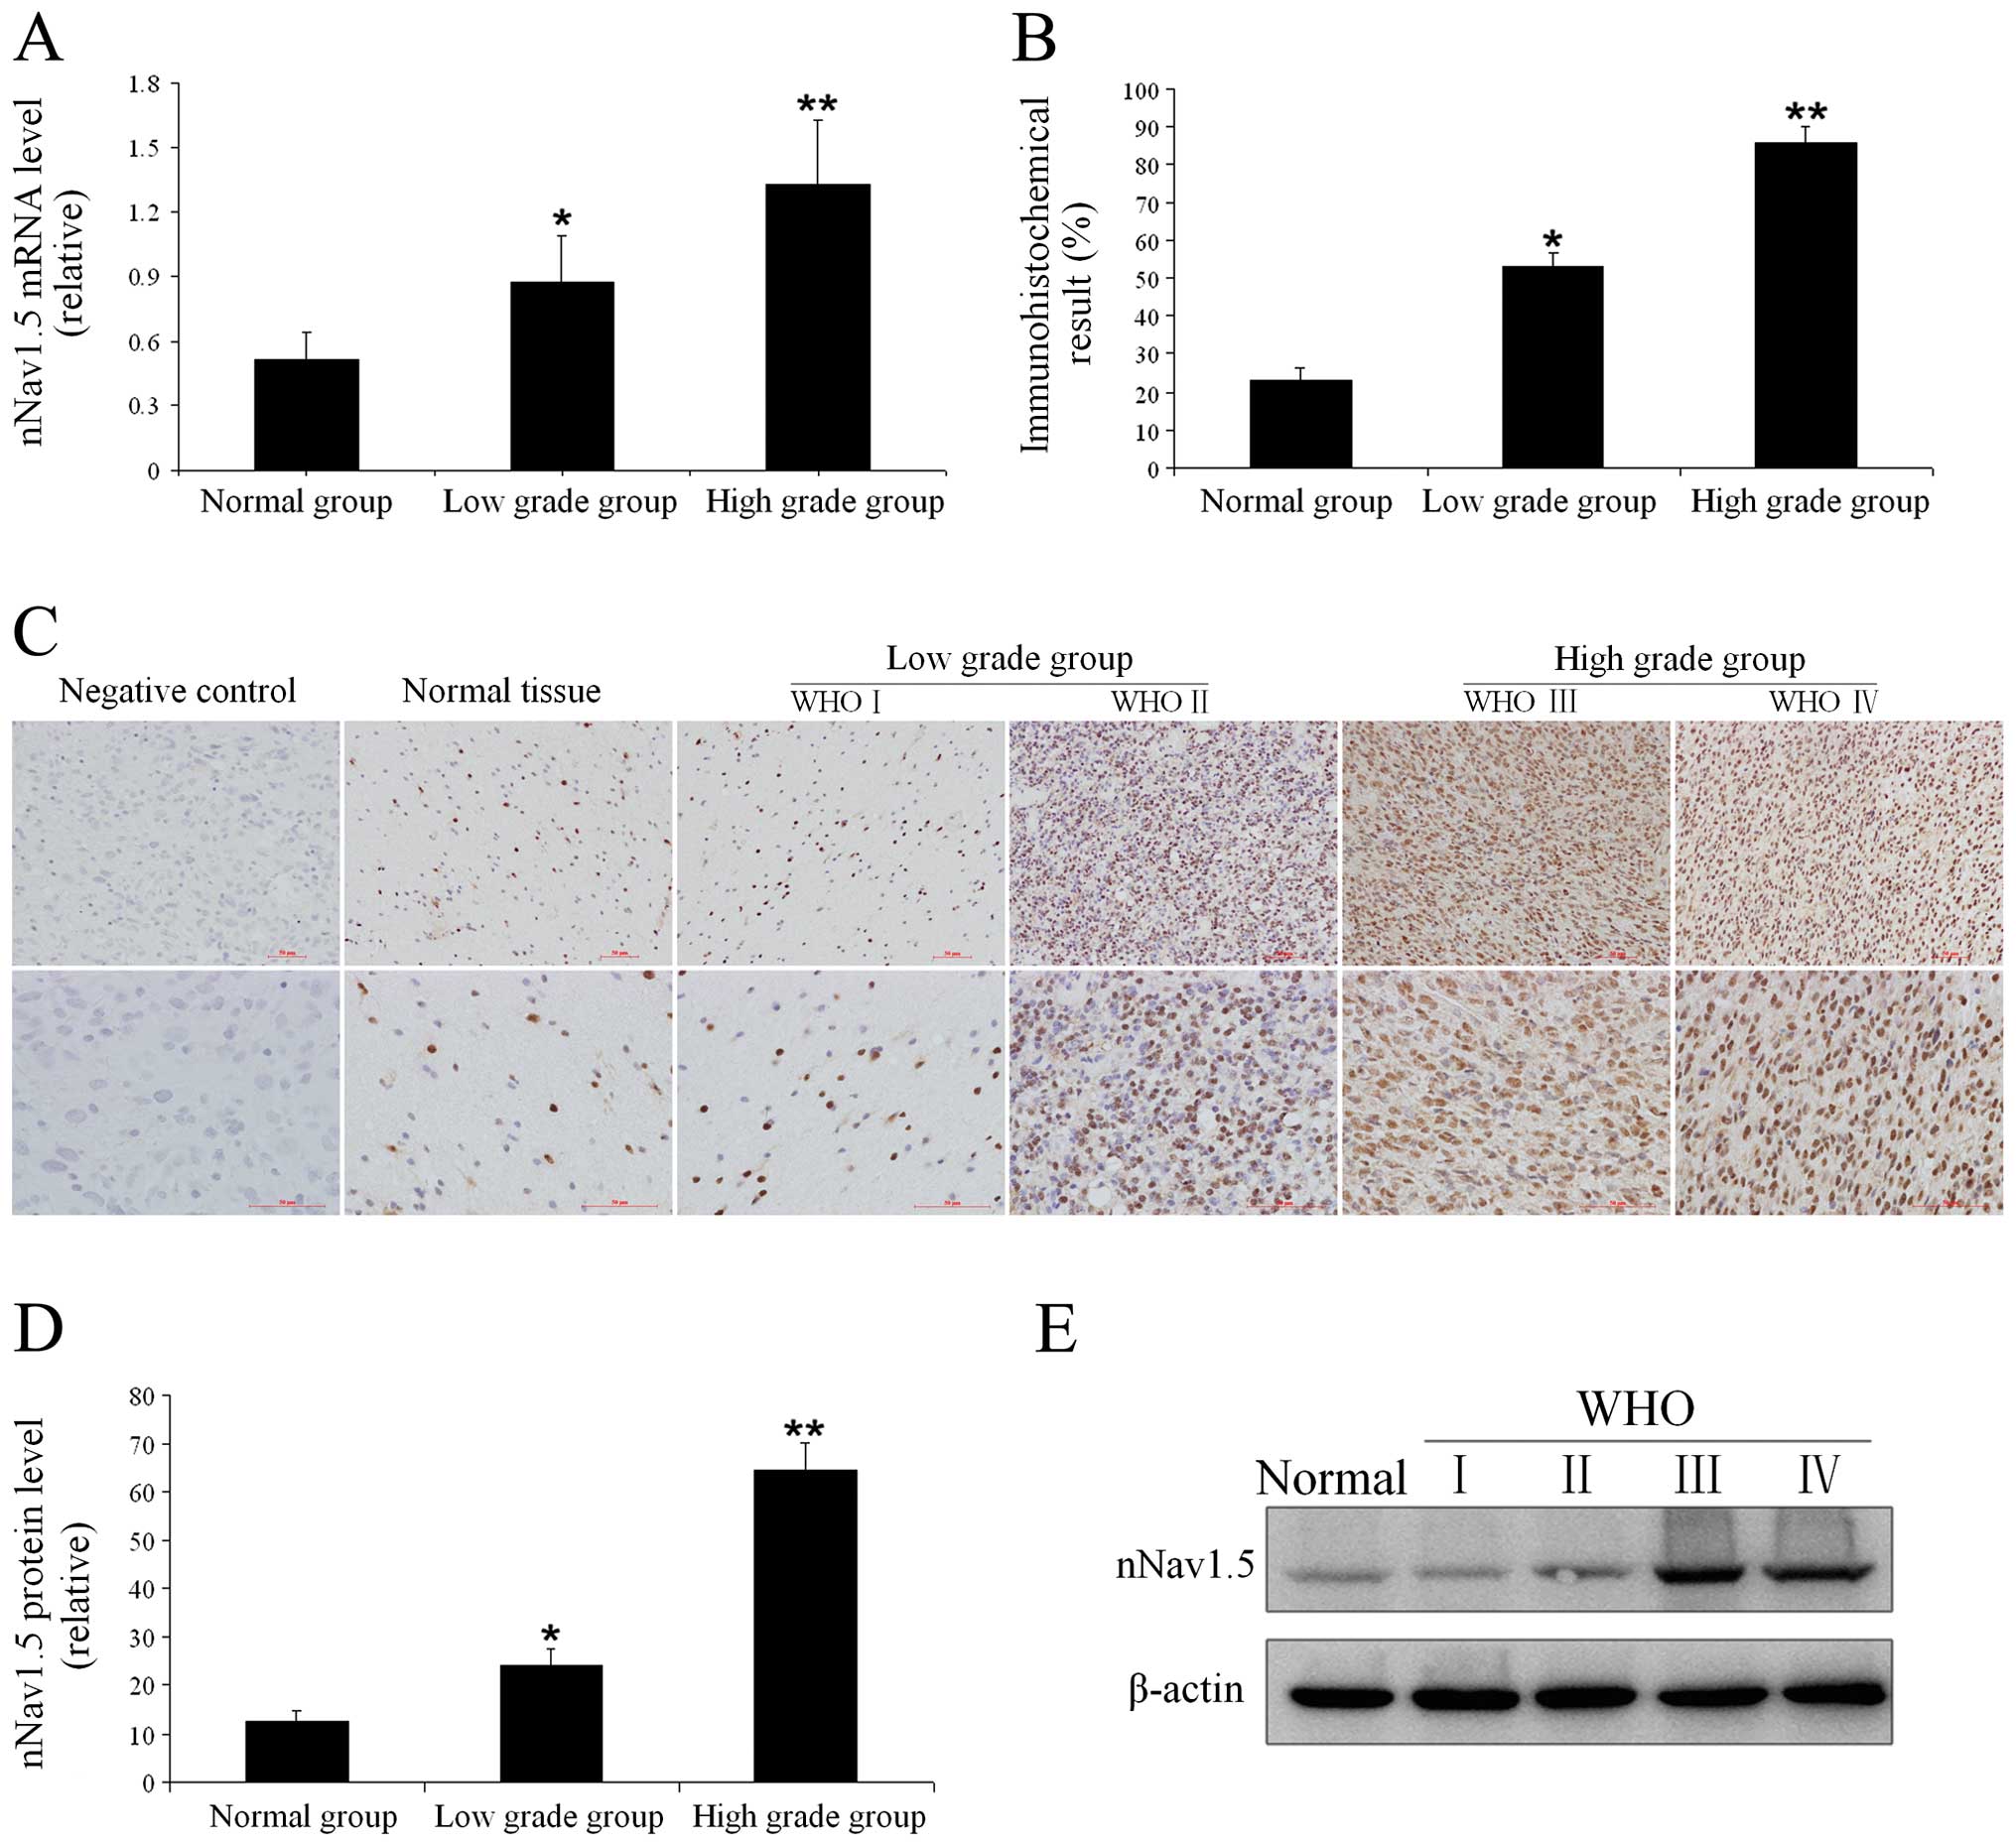
Real-time quantitative RT-PCR confirmed nNav1.5 mRNA
expression both in the astrocytoma and normal brain tissues. As
shown in Fig. 1A, the relative
levels of nNav1.5 mRNA in the low-grade group and high-grade group
were 0.875±0.219 and 1.327±0.303, respectively, while that in the
normal brain group was merely 0.509±0.131. The immunohistochemistry
and western blot analyses also confirmed nNav1.5 protein expression
in both normal brain tissues and astrocytomas, while its expression
in tumor tissues was significantly higher, with an increasing trend
correlated with increasing pathological grade (Fig. 1B and D). The protein and mRNA
expression levels were consistent. The nNav1.5 positive expression
rates were determined by estimation of the number of
nNav1.5-positive cells in the tissue specimens. The results of the
immunohistochemistry showed that nNav1.5 protein was expressed
mainly in the nucleus, with only a small amount of expression in
the cytoplasm and cell membrane (Fig.
1C). The positive expression rates in normal brain tissues,
low-grade astrocytomas, and high-grade astrocytomas were 23.0±3.4,
52.9±3.9 and 85.8±4.3%, respectively, with statistically
significant differences among the 3 groups (Fig. 1B). Western blotting showed that the
relative expression levels of nNav1.5 protein in normal brain
tissues, low-grade astrocytomas, and high-grade astrocytomas were
12.7±2.1, 24.1±3.3 and 64.3±5.9%, respectively. The differences
among the groups were statistically significant (Fig. 1D and E).
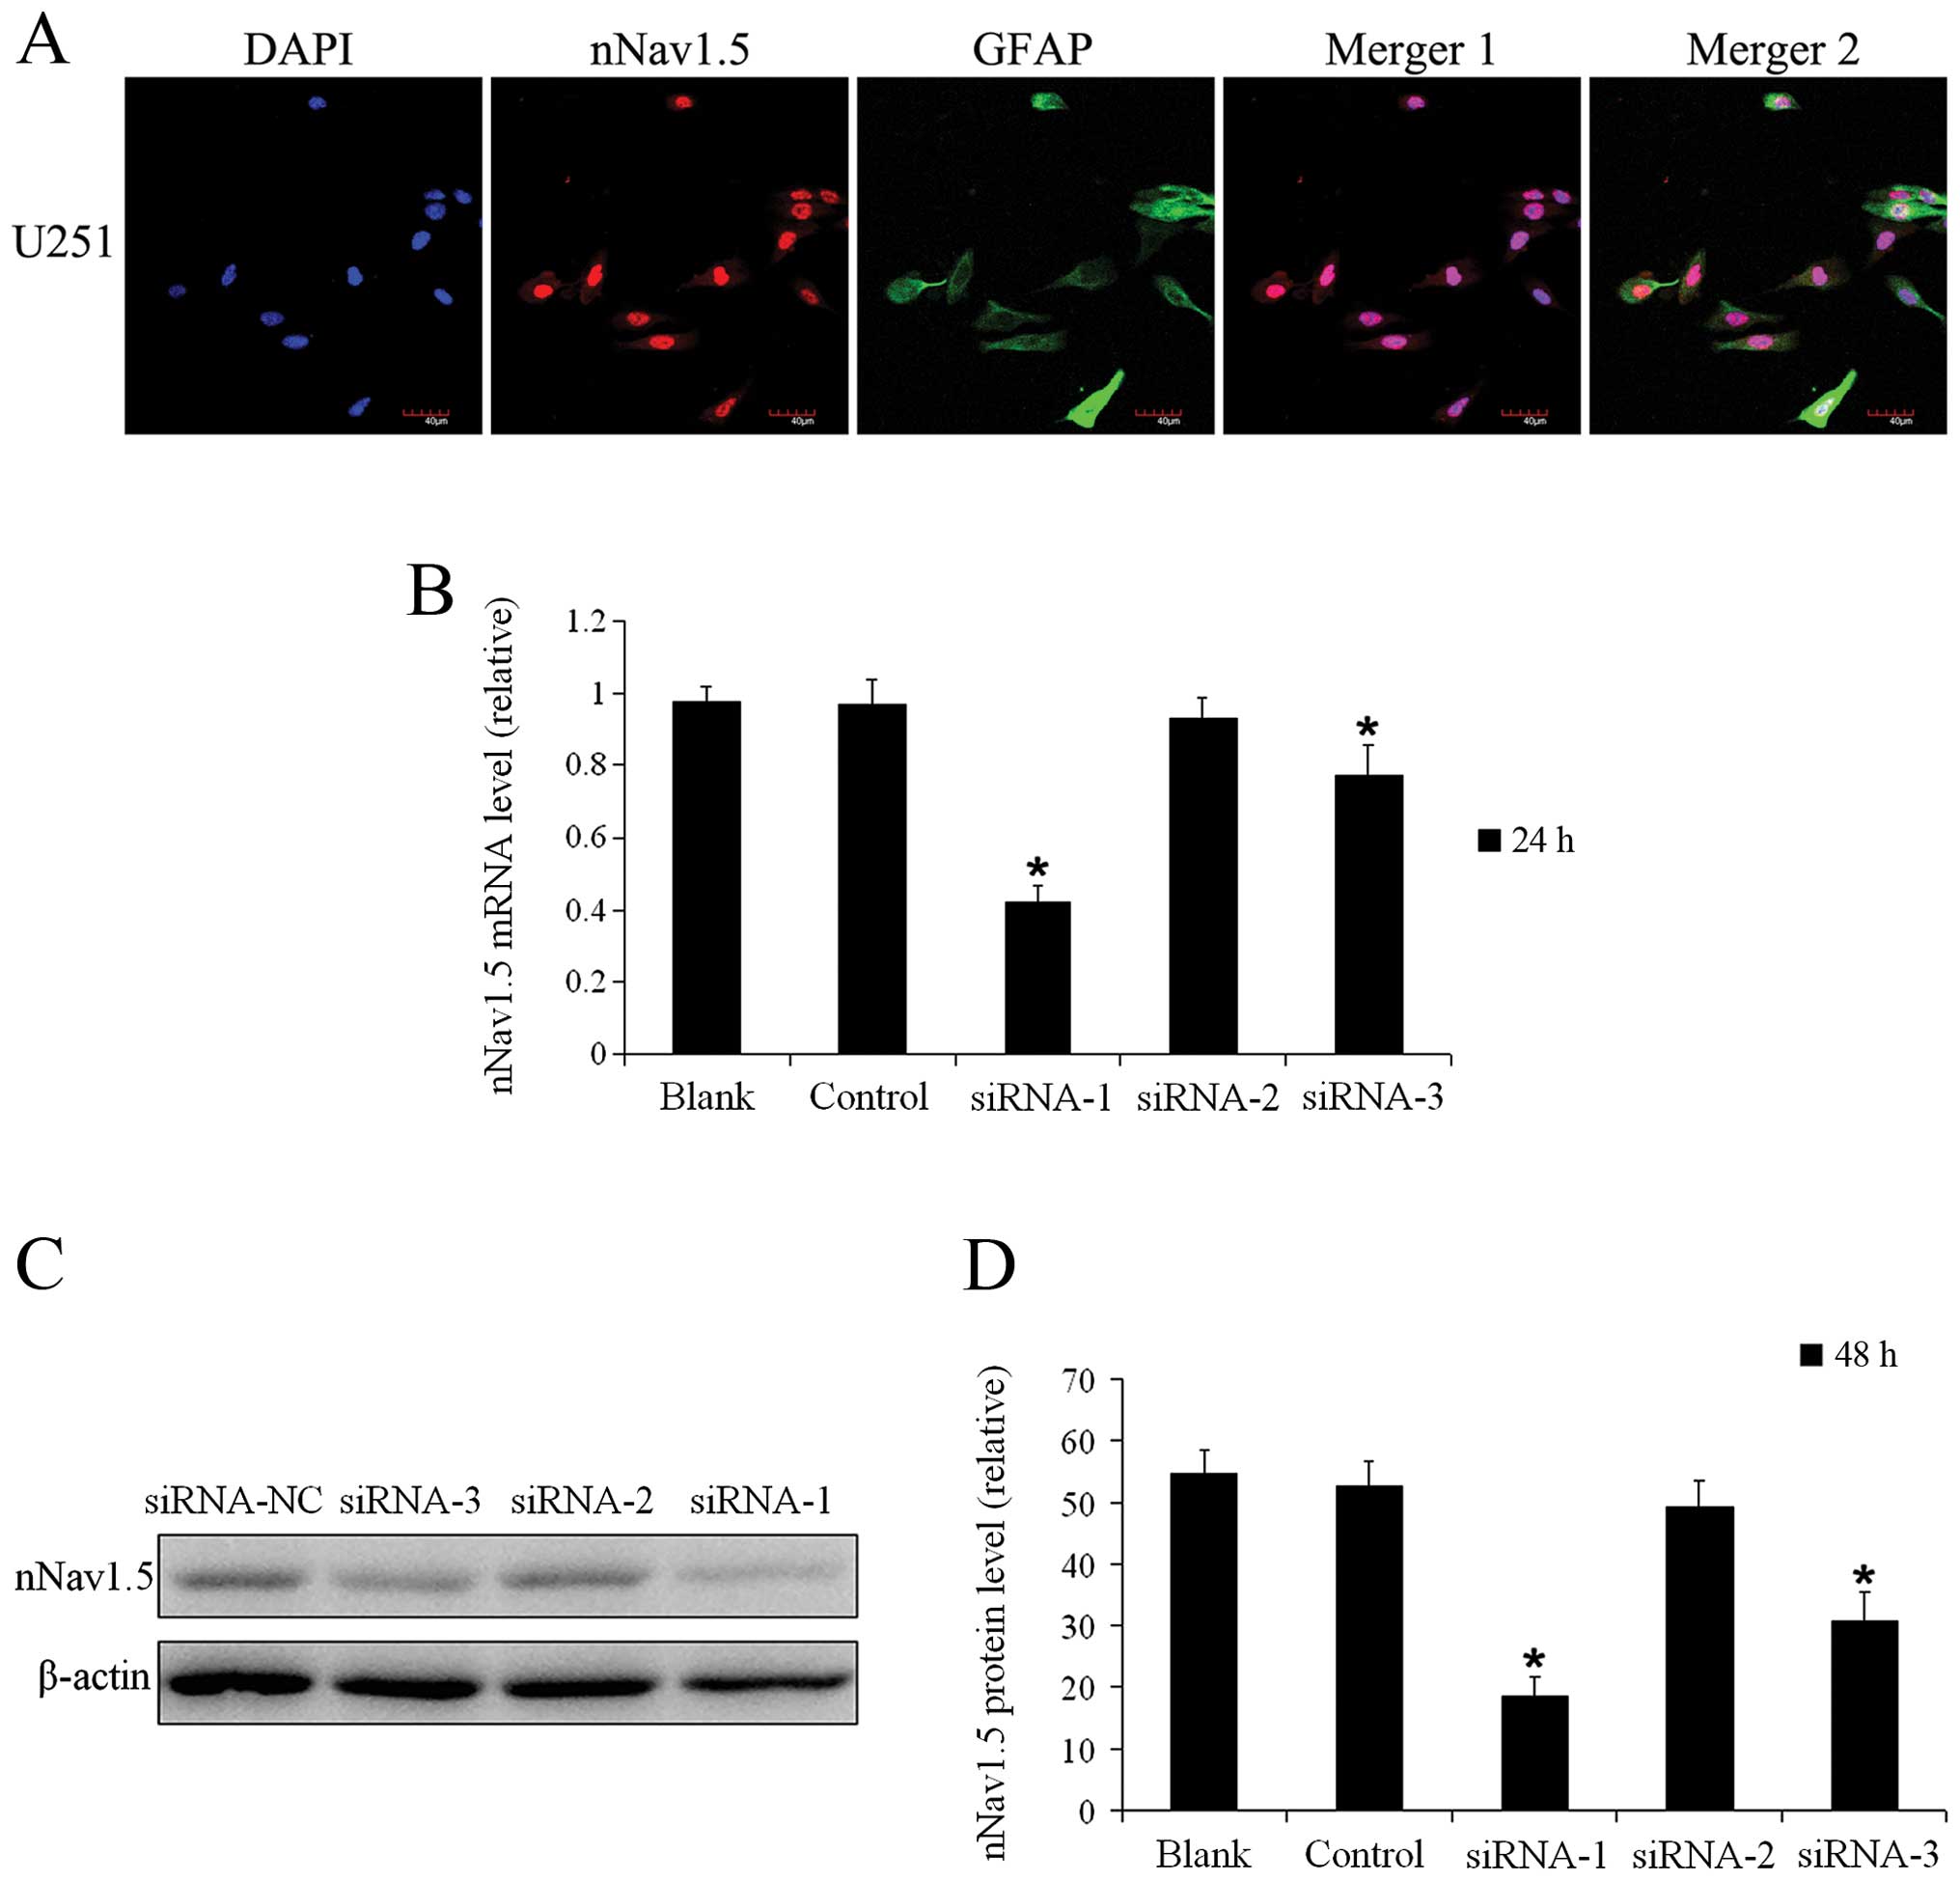
Localization of nNav1.5 protein in the
U251 cells
As observed under confocal microscopy, nNav1.5
protein was expressed in the nucleus, cytoplasm and membrane
(Fig. 2A) of U251 cells, which was
consistent with the results of the immunohistochemistry assay
(Fig. 1C).
nNav1.5 siRNA significantly inhibits the
expression of nNav1.5 in U251 cells
Twenty-four hours after siRNA transfection, the
relative expression level of nNav1.5 mRNA was 0.978±0.043 in the
blank group, 0.968±0.071 in the control group, 0.418±0.044 in the
siRNA-1 group, 0.930±0.054 in the siRNA-2 group and 0.772±0.086 in
the siRNA-3 group, respectively (Fig.
2B). The transfection efficiency was the highest in the siRNA-1
group compared with the siRNA-2 and siRNA-3 groups. Compared with
the blank and control groups, statistically significant differences
were found in the siRNA-1 group and siRNA-3 group (Fig. 2B), with a reduced nNav1.5 mRNA
expression level by 57.2 and 21.0%, respectively. For the siRNA-2
group, the difference was not statistically significant (Fig. 2B). The difference between the
control group and blank group was also not statistically
significant (Fig. 2B).
To further verify the interference effect of the 3
synthesized siRNAs on nNav1.5 protein expression, the protein
levels in the U251 cells were measured 48 h after transfection
(Fig. 2C). As shown in Fig. 2D, in the siRNA-1 group the relative
nNav1.5 protein level was 18.6±3.3%, which was significantly lower
than 49.2±4.2% in the siRNA-2 group and 30.9±4.5% in the siRNA-3
group. The expression level of nNav1.5 protein in the U251 cells 48
h after transfection with siRNA-1 was consistent with the nNav1.5
mRNA expression level at 24 h (Fig. 2B
and D). These data indicated that the nNav1.5 expression in
U251 cells was efficiently inhibited 24 h after transfection with
siRNA, and siRNA-1 was selected for the subsequent cellular
experiments.
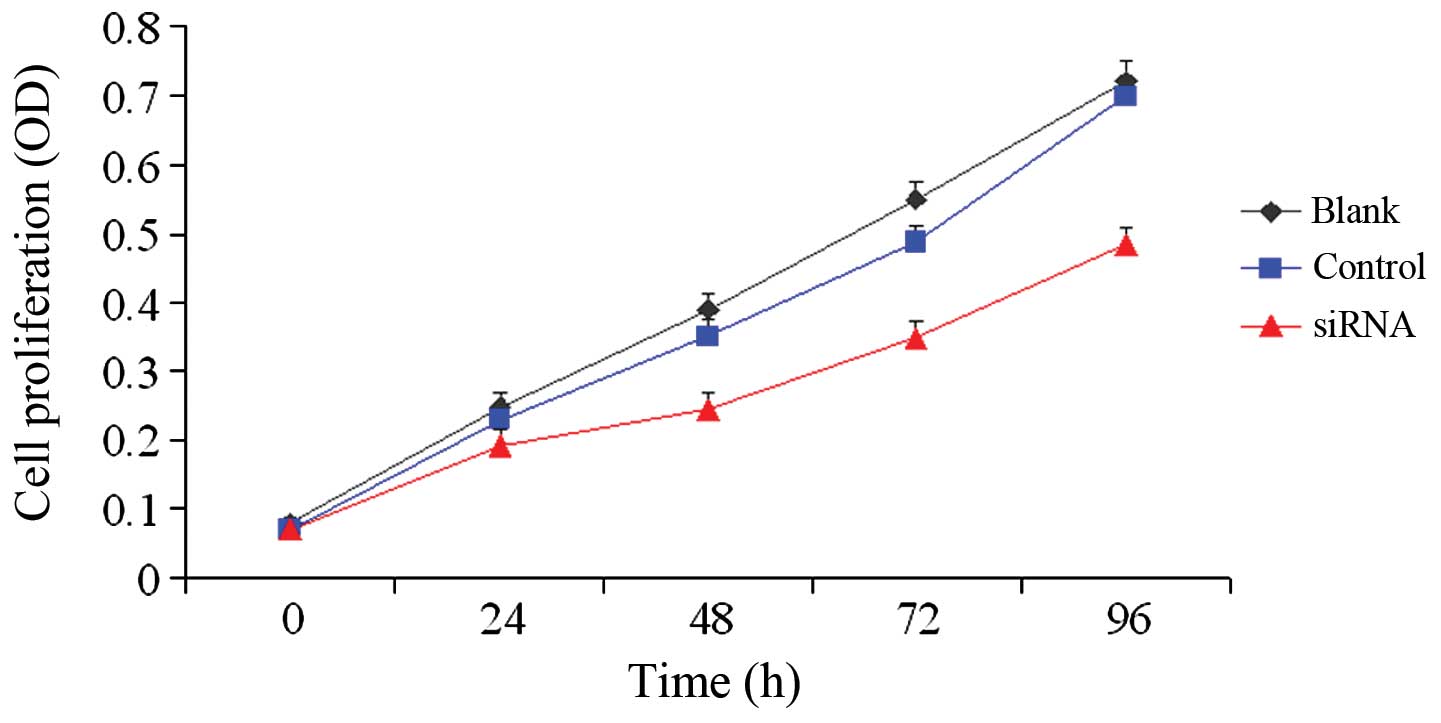
nNav1.5 siRNA inhibits the in vitro
proliferation of U251 cells
In the MTT proliferation assay, the CCK-8 assay was
utilized to detect changes in the in vitro proliferation of
U251 cells after transfection. As shown in Fig. 3, the OD values of the siRNA group at
each time point were statistically significantly different when
compared with those of the control group and blank group. The
inhibition rates of siRNA-1 were 22.7% at 24 h, 36.9% at 48 h,
36.4% at 72 h and 32.7% at 96 h, respectively. The inhibition of
cell proliferation peaked at 48 h, and the interference effect of
the siRNA weakened over time. These data suggest that the
proliferation of the U251 cells was significantly inhibited by
siRNA interference of SCN5A/nNav1.5 expression.
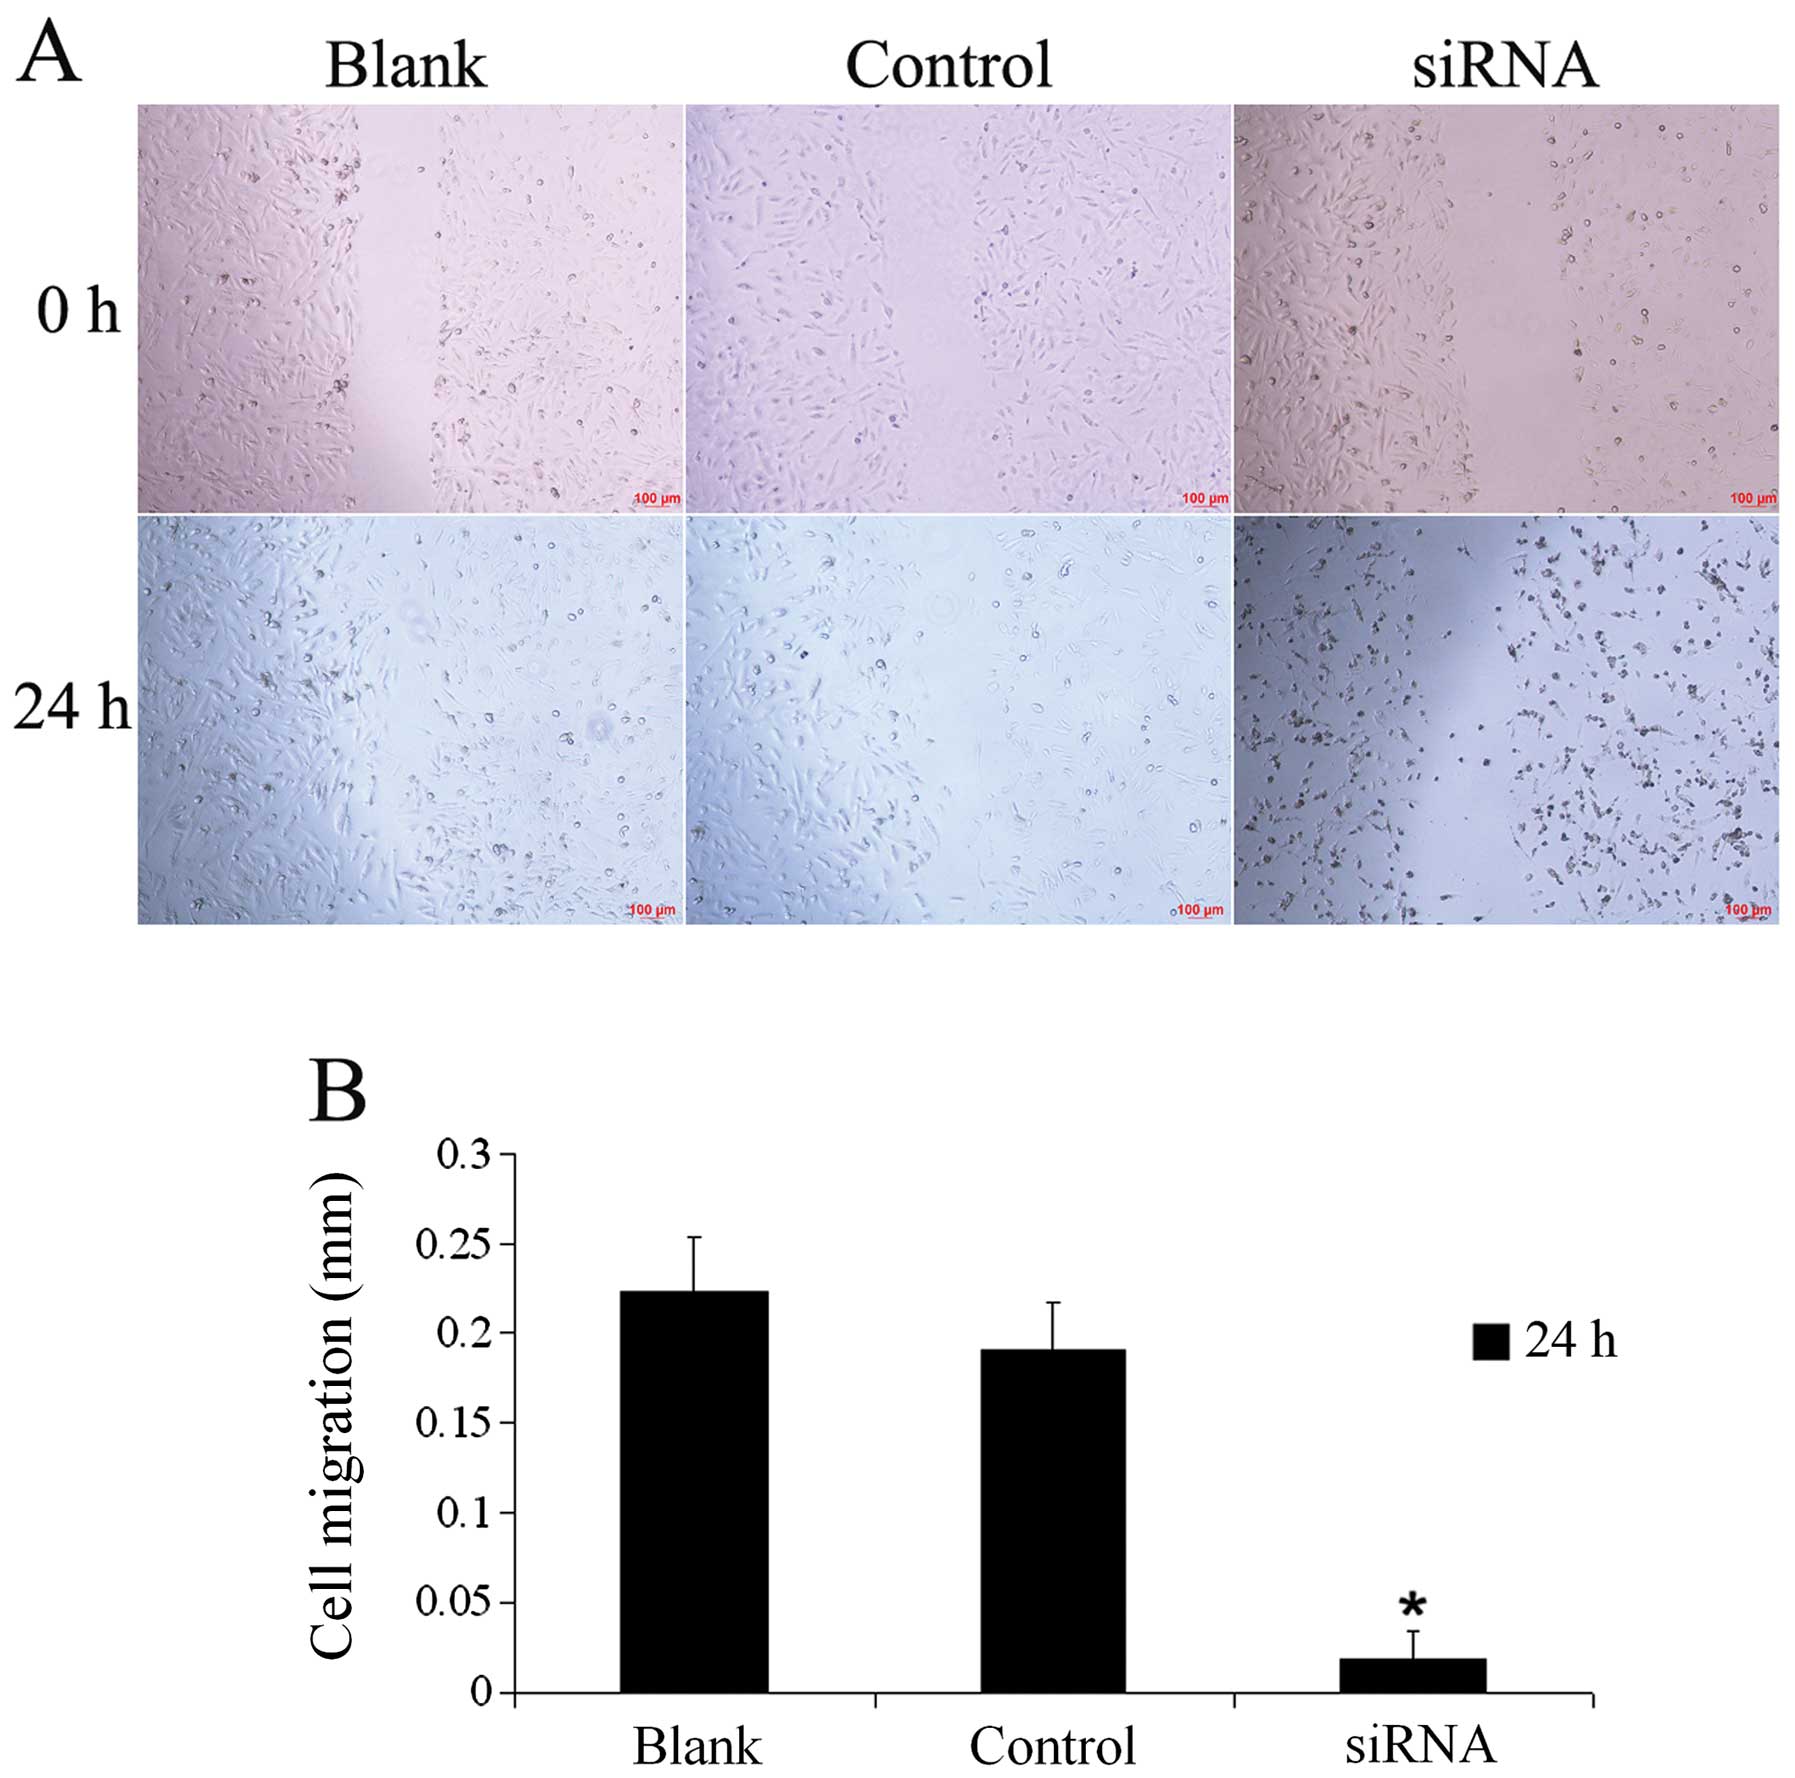
nNav1.5 siRNA reduces the migratory
ability of U251 cells
The wound healing assay (Fig. 4A) revealed that the distance of
migration of the cells in the siRNA group at 24 h (0.019±0.015 mm)
was significantly shorter than the distances in the blank group
(0.223±0.031 mm) and control group (0.190±0.027 mm), and the
differences were statistically significant (Fig. 4B). Compared with the control group,
the migration distance in the siRNA group was decreased by
91.6%.
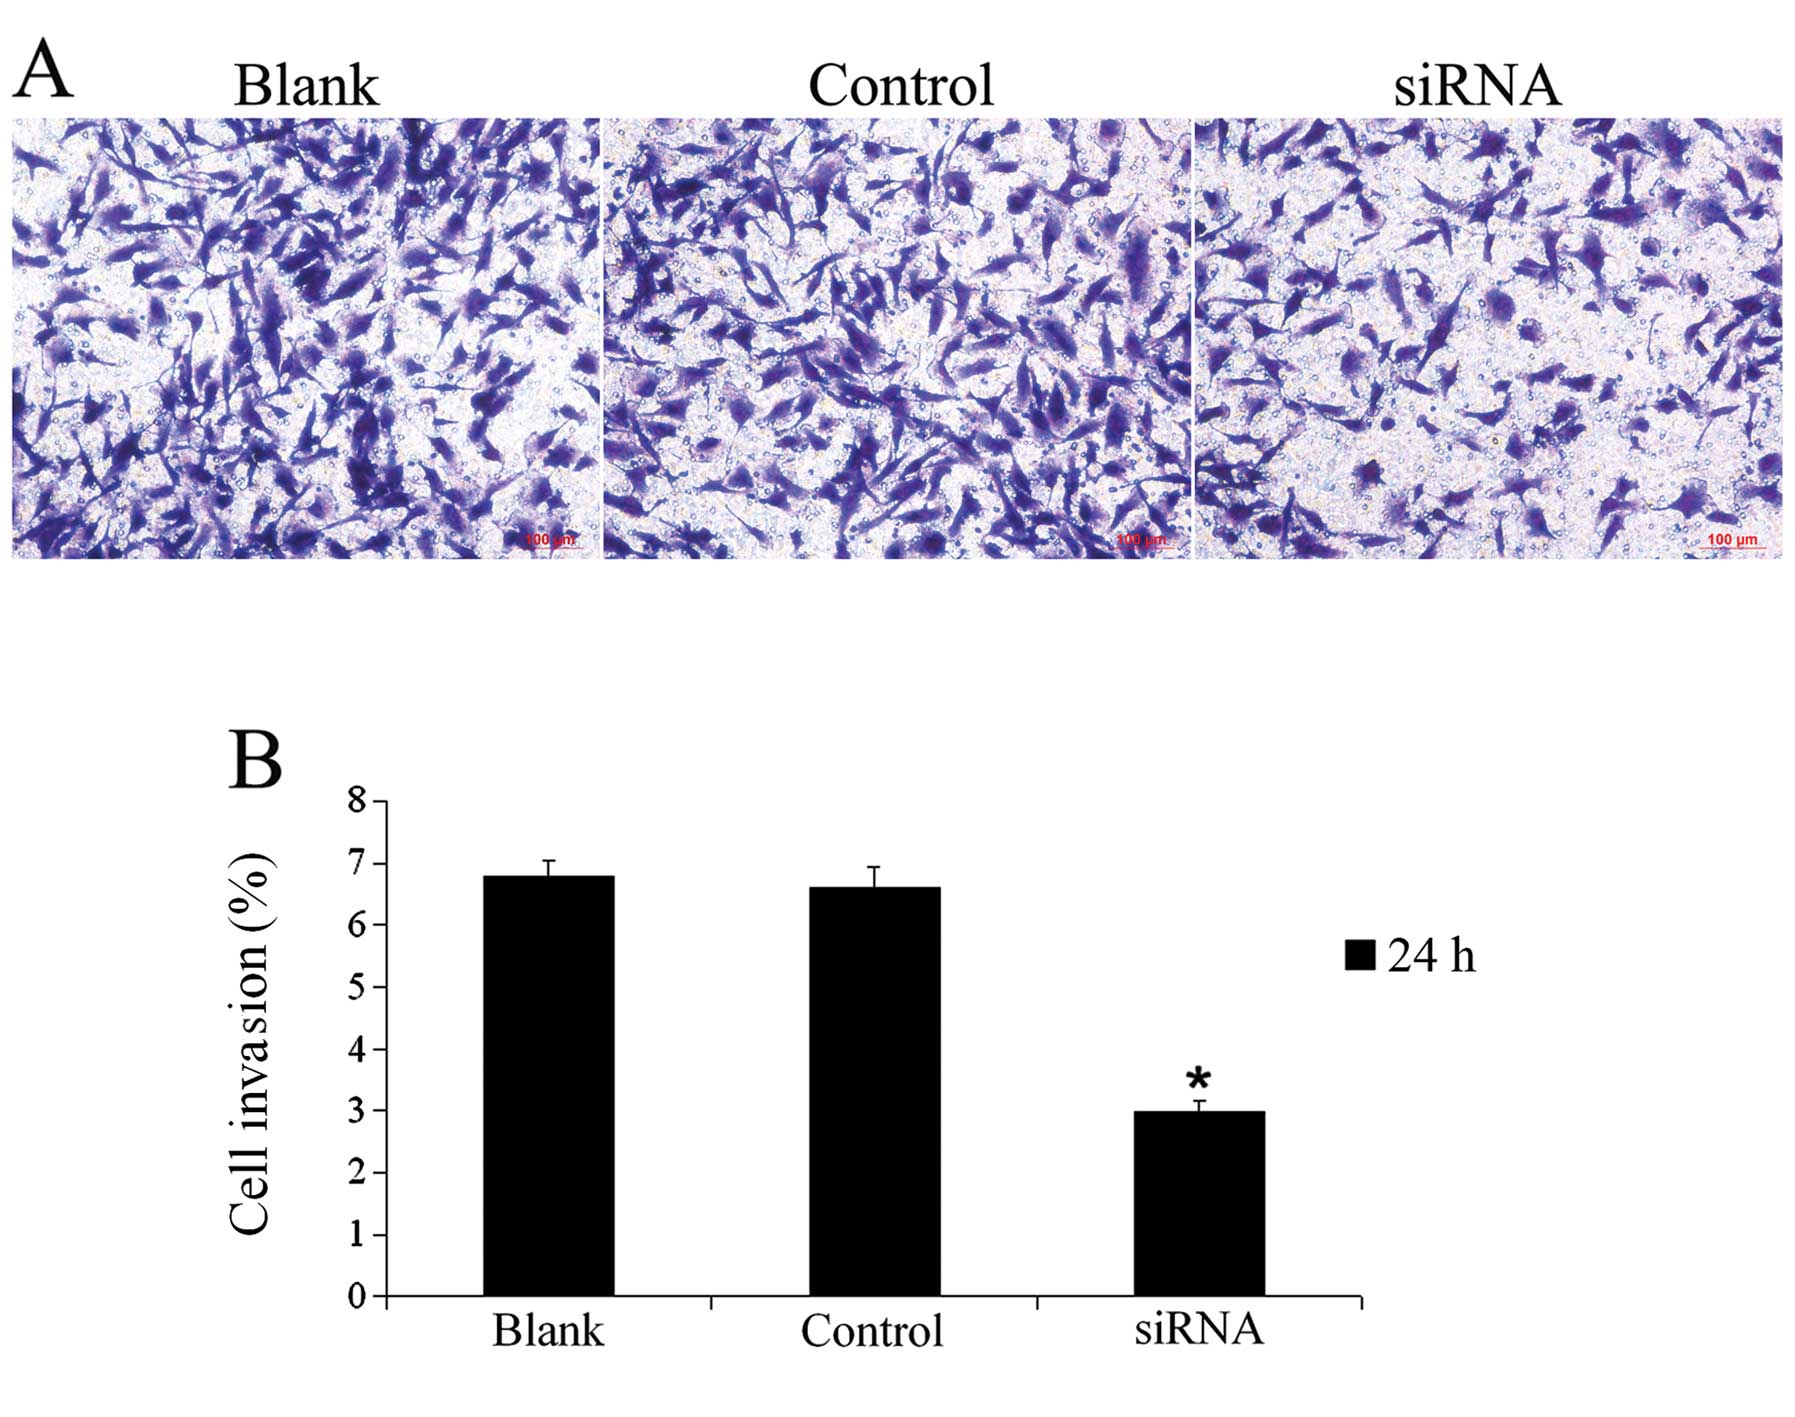
nNav1.5 siRNA inhibits the invasiveness
of U251 cells
The Matrigel invasion assay (Fig. 5) showed that the invasion index of
the U251 cells in the siRNA group (2.99±0.15%) was significantly
lower than the indices in the blank group (6.77±0.26%) and control
group (6.60±0.33%). The cell invasiveness in the siRNA group was
decreased by 55.83% compared with the invasiveness of the blank
group.
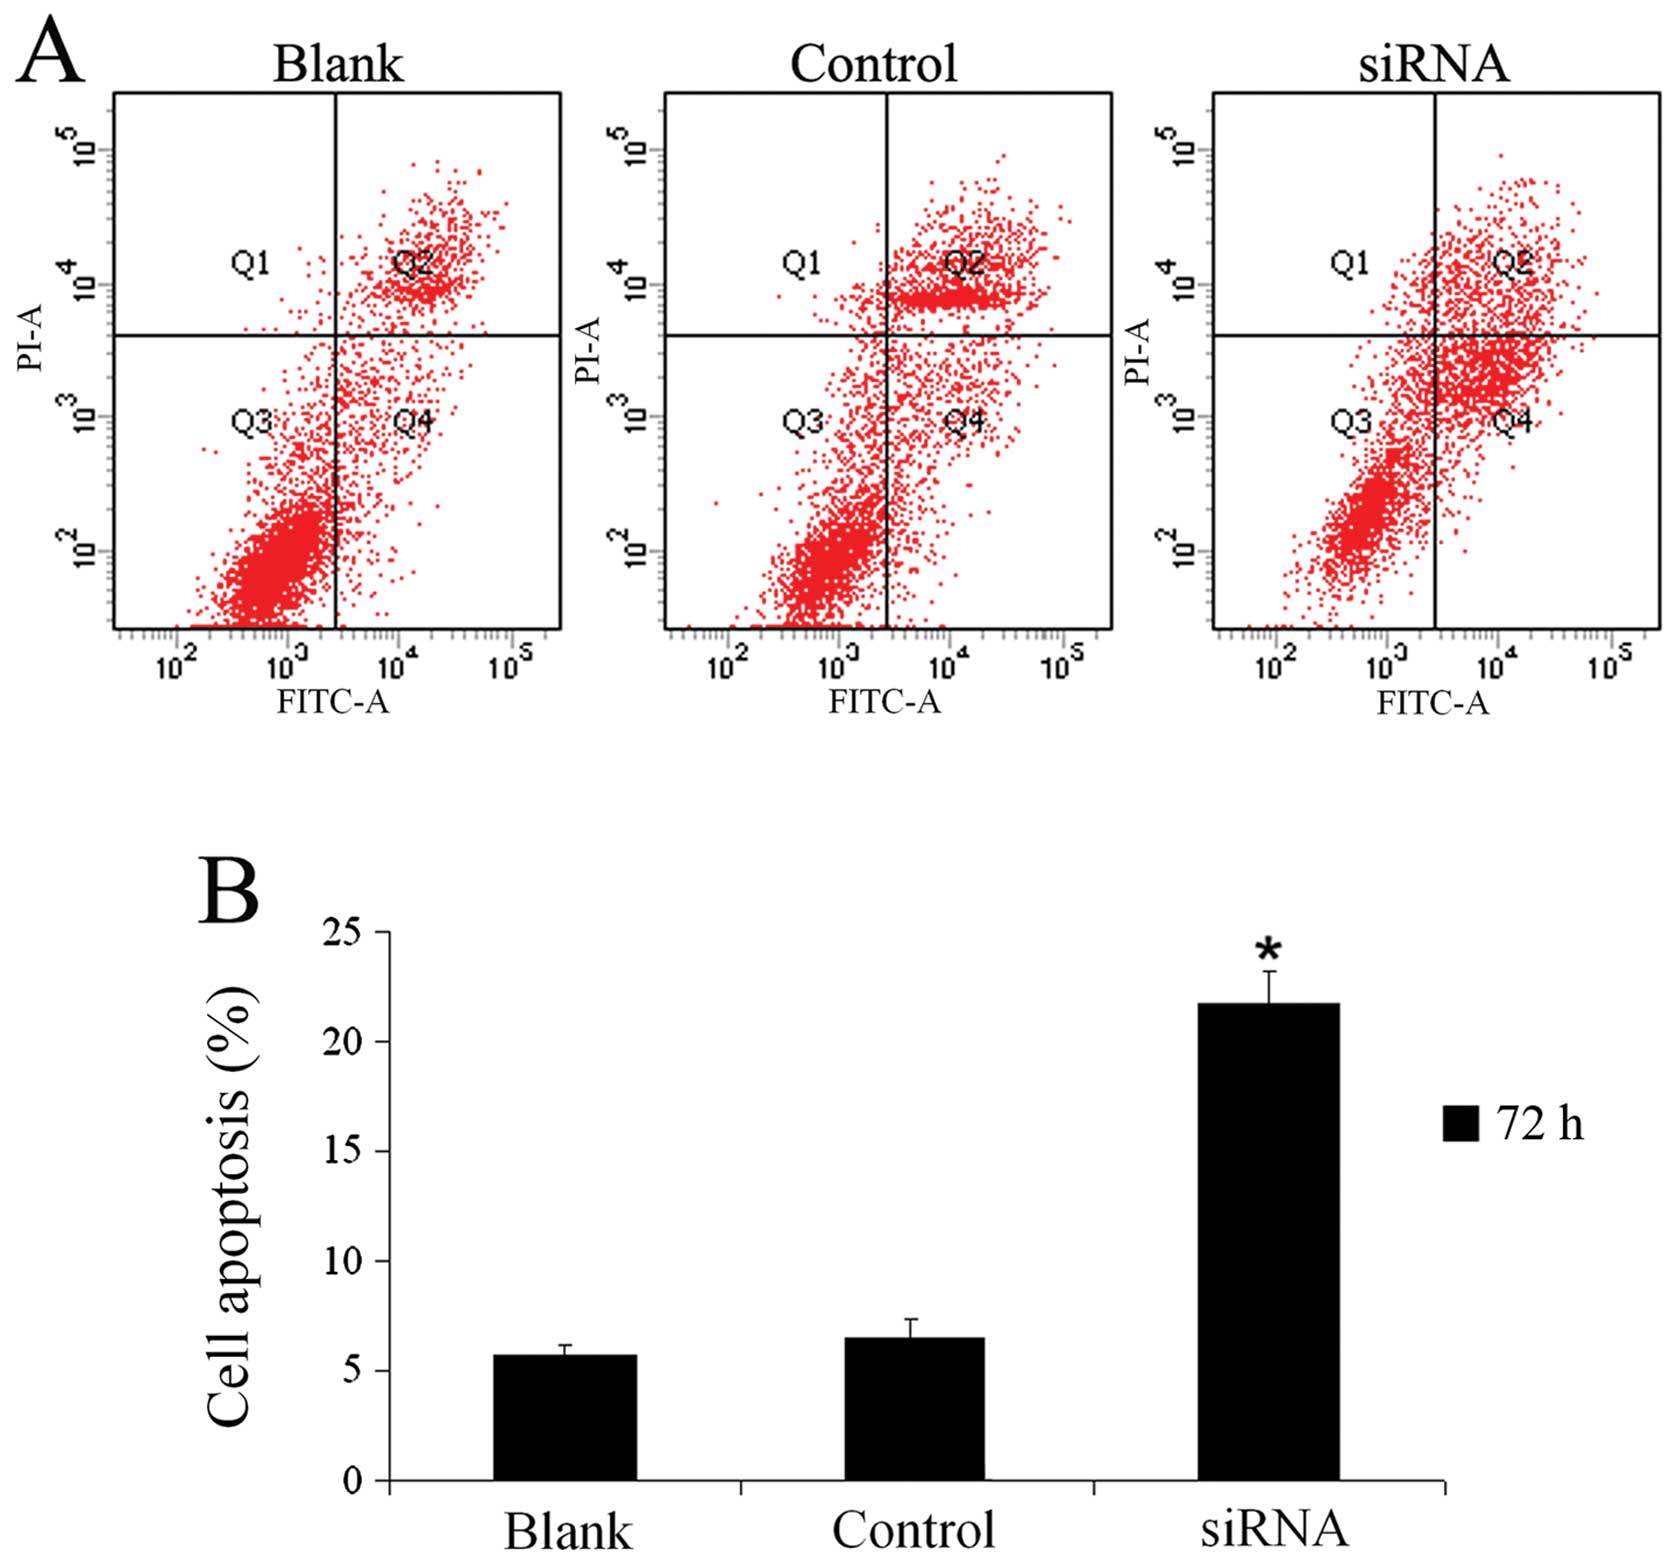
nNav1.5 siRNA promotes the apoptosis of
U251 cells
U251 cells were harvested 72 h after transfection to
measure the apoptotic rates. As shown in Fig. 6, the apoptotic rates were
21.66±1.55, 5.71±0.42 and 6.54±0.86% in the siRNA, blank and
control groups, respectively. The apoptotic rate was significantly
lower than that in either the blank group or the control group.
Discussion
Astrocytoma is the most common primary CNS malignant
tumor and is frequently infiltrative and recurs easily, with poor
patient prognosis (15). Treatment
for astrocytoma involves combined therapies including surgery,
chemotherapy, radiotherapy and immunotherapy. However, the outcome
of astrocytoma is still dismal. Currently, progress in
immunotherapy holds hope for the treatment of astrocytoma and has
become a promising option (16–18).
Thus, it is necessary to search for new therapeutic targets for
astrocytoma.
Studies have found that various ion channels,
including Na+, K+, Cl− and
Ca2+ are widely distributed in the membrane structures
of astrocytoma cells. These channels not only play important roles
in various physiological activities such as growth and metabolism
in glial cells (19), but also in
cell cycle regulation, proliferation, metastasis, invasion and
apoptosis of astrocytoma cells (8,19–25).
VGSCs are mainly expressed in tumors of epithelial origin, and can
participate in the biological behaviors of tumor cells, including
direct spread, lateral movement, galvanotaxis, invasion and the
secretory activity of the membrane (8,26,27).
In the present study, we proposed that various VGSC subtypes may be
related to the occurrence and development of astrocytoma, and we
carried out a series of assays to confirm this hypothesis. Our
preliminary findings confirmed that Nav1.5 is widely distributed in
the CNS. Therefore, we first cloned the complete sequence of the
Nav1.5 gene expressed in human cortical neurons and identified its
function (8). The results showed
that the SCN5A gene which encodes Nav1.5 in brain tissue is
different than that in human cardiomyocytes, and they belong to two
different subtypes. The former is a neonatal isoform (6,7,9,28–31),
namely nNav1.5 (neonatal Nav1.5), while the latter is a mature
isoform. Our and various other studies suggest that the Nav1.5
subtype of VGSCs encoded by the SCN5A gene could potentially serve
as a marker of tumor metastasis and as a therapeutic target
(8,10–12,26,30–36).
Recent studies have found that the functions of VGSCs may vary with
changes in mRNA splicing (2). Exon
6, located in the DI: S3 segment plays an important role in
regulating development. The 5′ neonatal isoform can be expressed at
birth, while the 3′ mature isoform is expressed later in
development (37). Our study
confirmed that the nNav1.5 Na+ channel is widely
expressed in rat CNS (9,28). However, it is worth noting that the
average expression level of nNav1.5 showed a downward trend as the
age of the rats increased (7,9,27,30),
indicating that it is mainly expressed in immature neurons or glial
cells, further suggesting that the expression of nNav1.5 may be the
result of the re-expression of an embryonic gene or oncogene.
As the power pump of cellular activity,
Na+ channels play an important role in maintaining the
physiological activities of cells (38–40).
Several studies found that the Nav1.5 protein encoded by the SCN5A
gene was mainly expressed in the cell membrane and cytoplasm of
other tumors (32,41). In the present study, the expression
levels of nNav1.5 mRNA and protein in astrocytoma and normal brain
tissues were first assessed in detail. Furthermore, cytological
immunofluorescence studies found that nNav1.5 protein was expressed
in the nucleus, membrane and cytoplasm of U251 cells, while the
immunohistochemistry also confirmed the expression of nNav1.5 in
the various locations described above. However, its expression
level in astrocytoma cells was significantly higher than that in
brain tissues. With reduced differentiation of the astrocytoma
nucleus, nNav1.5 expression became more significant. The levels of
expression of SCN5A/nNav1.5 in high-grade astrocytoma with a low
degree of differentiation and in the low-grade astrocytoma with a
high degree of differentiation were also significantly different,
suggesting that the expression level of nNav1.5 is positively
correlated with the degree of malignancy. The expression of nNav1.5
protein in cell nuclei suggested that the VGSC isoform nNav1.5 may
play an important role in the processes of tumor cell division and
malignant proliferation. These data revealed upregulation of
nNav1.5 expression in astrocytoma and a positive correlation with
pathological grade. These findings further suggest that nNav1.5
encoded by the SCN5A gene may be the re-expression of an embryonic
gene or oncogene that could be a novel diagnostic or therapeutic
target for astrocytoma. Moreover, no study concerning the
regulation of nNav1.5 in the occurrence and development of
astrocytoma has been reported to date. To further understand the
specific role of nNav1.5 in the occurrence and development of
astrocytoma, RNAi technology was used to knock down the expression
of the SCN5A/nNav1.5 gene in U251 cells. Effective transfection of
the cells and significant inhibition of nNav1.5 mRNA and protein
expression were observed, indicating that the RNAi interference
sequence specifically inhibited the expression of nNav1.5. After
RNAi knockdown, suppressed expression of nNav1.5 inhibited
proliferation, reduced migration and invasiveness, and induced a
higher apoptosis rate compared with the blank and negative control
groups, indicating that the downregulation of nNav1.5 expression
significantly inhibited the proliferation, migration and invasion
of U251 cells and played a significant role in promoting tumor cell
apoptosis. Therefore, nNav1.5 has the potential to be a novel
molecular therapeutic target for astrocytoma, with great
significance in cancer prognosis and clinical treatment, although
the mechanism remains unclear. According to a recent report, VGSCs
most likely enhance the invasion and metastatic behavior in tumor
cells through three types of regulatory mechanisms: pH adjustment,
regulation of gene expression and intracellular Ca2+
regulation (42). It has been
reported that Na+ influx can promote the proliferation
of cancer cells. If a spontaneous Na+ influx occurs in
the early proliferative phase, controlling the external
concentration of Na+ could effectively inhibit cell
proliferation (43). Another study
revealed that the Nav1.5 and Nav1.7 subtypes are found in
endothelial cells of the human umbilical vein, and the inhibition
of Nav1.5 expression in these cells by RNAi inhibited cell
proliferation (44). However, in
the prostate cancer Mat-Lylu cell line and breast cancer MDA-MB-231
cells with high metastatic potential, VGSC activity was not related
to cell proliferation (11,45). These differences may be due to
differences between the cell types.
In summary, the nNav1.5 encoded by the SCN5A gene
was functionally highly expressed in human brain astrocytoma, and
the expression levels were correlated with the degree of
malignancy. Following downregulation of its expression level, the
proliferation, migration and invasion of the astrocytoma cells were
significantly inhibited, and their apoptotic rate was markedly
increased. However, the underlying mechanisms are still unclear and
further investigation is needed. To our knowledge, this is the
first study to detect the expression and function of nNav1.5 in
astrocytoma.
Acknowledgements
This study was supported by the National Natural
Science Foundation of China (no. 31100770 to J.W.) and the Liaoning
Provincial Natural Science Foundation of China (no. 2013021075 to
B.Q.). We thank all the staff members of the Neurosurgery
Department of the First Hospital of China Medical University for
their technical help.
Abbreviations:
|
VGSC
|
voltage-gated sodium channel
|
|
nNav1.5
|
neonatal Nav1.5
|
|
CNS
|
central nervous system
|
|
RNAi
|
RNA interference
|
|
WHO
|
World Health Organization
|
|
PI
|
propidium iodide
|
|
DAPI
|
4,6-diamidino-2-phenylindole
|
References
|
1
|
Binello E and Germano IM: Targeting glioma
stem cells: a novel framework for brain tumors. Cancer Sci.
102:1958–1966. 2011. View Article : Google Scholar : PubMed/NCBI
|
|
2
|
Diss JK, Fraser SP and Djamgoz MB:
Voltage-gated Na+ channels: multiplicity of expression,
plasticity, functional implications and pathophysiological aspects.
Eur Biophys J. 33:180–193. 2004.
|
|
3
|
Monk M and Holding C: Human embryonic
genes re-expressed in cancer cells. Oncogene. 20:8085–8091. 2001.
View Article : Google Scholar : PubMed/NCBI
|
|
4
|
Kunzelmann K: Ion channels and cancer. J
Membr Biol. 205:159–173. 2005. View Article : Google Scholar
|
|
5
|
McFerrin MB and Sontheimer H: A role for
ion channels in glioma cell invasion. Neuron Glia Biol. 2:39–49.
2006. View Article : Google Scholar : PubMed/NCBI
|
|
6
|
Brackenbury WJ, Djamgoz MB and Isom LL: An
emerging role for voltage-gated Na+ channels in cellular
migration: regulation of central nervous system development and
potentiation of invasive cancers. Neuroscientist. 14:571–583.
2008.PubMed/NCBI
|
|
7
|
Wang J, Ou SW, Wang YJ, et al: New
variants of Nav1.5/SCN5A encode Na+ channels in the
brain. J Neurogenet. 22:57–75. 2008. View Article : Google Scholar : PubMed/NCBI
|
|
8
|
Ou SW, Kameyama A, Hao LY, et al:
Tetrodotoxin-resistant Na+ channels in human
neuroblastoma cells are encoded by new variants of Nav1.5/SCN5A.
Eur J Neurosci. 22:793–801. 2005.PubMed/NCBI
|
|
9
|
Wang J, Ou SW, Wang YJ, Kameyama M,
Kameyama A and Zong ZH: Analysis of four novel variants of
Nav1.5/SCN5A cloned from the brain. Neurosci Res.
64:339–347. 2009. View Article : Google Scholar : PubMed/NCBI
|
|
10
|
Fraser SP, Diss JK, Lloyd LJ, et al:
T-lymphocyte invasiveness: control by voltage-gated Na+
channel activity. FEBS Lett. 569:191–194. 2004. View Article : Google Scholar : PubMed/NCBI
|
|
11
|
Fraser SP, Diss JK, Chioni AM, et al:
Voltage-gated sodium channel expression and potentiation of human
breast cancer metastasis. Clin Cancer Res. 11:5381–5389. 2005.
View Article : Google Scholar : PubMed/NCBI
|
|
12
|
Brackenbury WJ, Chioni AM, Diss JK and
Djamgoz MB: The neonatal splice variant of Nav1.5 potentiates in
vitro invasive behaviour of MDA-MB-231 human breast cancer cells.
Breast Cancer Res Treat. 101:149–160. 2007. View Article : Google Scholar : PubMed/NCBI
|
|
13
|
Qiu B, Sun X, Zhang D, Wang Y, Tao J and
Ou S: TRAIL and paclitaxel synergize to kill U87 cells and
U87-derived stem-like cells in vitro. Int J Mol Sci. 13:9142–9156.
2012. View Article : Google Scholar : PubMed/NCBI
|
|
14
|
Yan X, Liang H, Deng T, et al: The
identification of novel targets of miR-16 and characterization of
their biological functions in cancer cells. Mol Cancer. 12:922013.
View Article : Google Scholar : PubMed/NCBI
|
|
15
|
Han G, Zhao W, Wang L, et al: Leptin
enhances the invasive ability of glioma stem-like cells depending
on leptin receptor expression. Brain Res. 1543:1–8. 2014.
View Article : Google Scholar : PubMed/NCBI
|
|
16
|
Murphy KA, Erickson JR, Johnson CS, et al:
CD8+ T cell-independent tumor regression induced by
Fc-OX40L and therapeutic vaccination in a mouse model of glioma. J
Immunol. 192:224–233. 2014.
|
|
17
|
Ning J, Wakimoto H and Rabkin SD:
Immunovirotherapy for glioblastoma. Cell Cycle. 13:175–176. 2014.
View Article : Google Scholar
|
|
18
|
van Gool S: Immunotherapy for high-grade
glioma: how to go beyond Phase I/II clinical trials. Immunotherapy.
5:1043–1046. 2013.PubMed/NCBI
|
|
19
|
Kawaguchi A, Asano H, Matsushima K, Wada
T, Yoshida S and Ichida S: Enhancement of sodium current in
NG108-15 cells during neural differentiation is mainly due to an
increase in NaV1.7 expression. Neurochem Res.
32:1469–1475. 2007. View Article : Google Scholar : PubMed/NCBI
|
|
20
|
Ross SB, Fuller CM, Bubien JK and Benos
DJ: Amiloride-sensitive Na+ channels contribute to
regulatory volume increases in human glioma cells. Am J Physiol
Cell Physiol. 293:C1181–C1185. 2007.
|
|
21
|
Weiss RE and Sidell N: Sodium currents
during differentiation in a human neuroblastoma cell line. J Gen
Physiol. 97:521–539. 1991. View Article : Google Scholar : PubMed/NCBI
|
|
22
|
Olsen ML, Schade S, Lyons SA, Amaral MD
and Sontheimer H: Expression of voltage-gated chloride channels in
human glioma cells. J Neurosci. 23:5572–5582. 2003.PubMed/NCBI
|
|
23
|
Ducret T, Vacher AM and Vacher P:
Voltage-dependent ionic conductances in the human malignant
astrocytoma cell line U87-MG. Mol Membr Biol. 20:329–343. 2003.
View Article : Google Scholar : PubMed/NCBI
|
|
24
|
Vila-Carriles WH, Kovacs GG, Jovov B, et
al: Surface expression of ASIC2 inhibits the amiloride-sensitive
current and migration of glioma cells. J Biol Chem.
281:19220–19232. 2006. View Article : Google Scholar : PubMed/NCBI
|
|
25
|
Wang WX and Ji YH: Scorpion venom induces
glioma cell apoptosis in vivo and inhibits glioma tumor growth in
vitro. J Neurooncol. 73:1–7. 2005. View Article : Google Scholar : PubMed/NCBI
|
|
26
|
Onganer PU and Djamgoz MB: Small-cell lung
cancer (human): potentiation of endocytic membrane activity by
voltage-gated Na+ channel expression in vitro. J Membr
Biol. 204:67–75. 2005. View Article : Google Scholar : PubMed/NCBI
|
|
27
|
Mycielska ME, Fraser SP, Szatkowski M and
Djamgoz MB: Contribution of functional voltage-gated Na+
channel expression to cell behaviors involved in the metastatic
cascade in rat prostate cancer: II. Secretory membrane activity. J
Cell Physiol. 195:461–469. 2003.PubMed/NCBI
|
|
28
|
Ren CT, Li DM, Ou SW, et al: Cloning and
expression of the two new variants of Nav1.5/SCN5A in rat brain.
Mol Cell Biochem. 365:139–148. 2012. View Article : Google Scholar : PubMed/NCBI
|
|
29
|
Catterall WA: From ionic currents to
molecular mechanisms: the structure and function of voltage-gated
sodium channels. Neuron. 26:13–25. 2000. View Article : Google Scholar : PubMed/NCBI
|
|
30
|
Roger S, Besson P and Le Guennec JY:
Involvement of a novel fast inward sodium current in the invasion
capacity of a breast cancer cell line. Biochim Biophys Acta.
1616:107–111. 2003. View Article : Google Scholar : PubMed/NCBI
|
|
31
|
Roger S, Rollin J, Barascu A, et al:
Voltage-gated sodium channels potentiate the invasive capacities of
human non-small-cell lung cancer cell lines. Int J Biochem Cell
Biol. 39:774–786. 2007. View Article : Google Scholar : PubMed/NCBI
|
|
32
|
House CD, Vaske CJ, Schwartz AM, et al:
Voltage-gated Na+ channel SCN5A is a key regulator of a
gene transcriptional network that controls colon cancer invasion.
Cancer Res. 70:6957–6967. 2010.PubMed/NCBI
|
|
33
|
Gao R, Shen Y, Cai J, Lei M and Wang Z:
Expression of voltage-gated sodium channel α subunit in human
ovarian cancer. Oncol Rep. 23:1293–1299. 2010.
|
|
34
|
Diaz D, Delgadillo DM, Hernández-Gallegos
E, et al: Functional expression of voltage-gated sodium channels in
primary cultures of human cervical cancer. J Cell Physiol.
210:469–478. 2007. View Article : Google Scholar : PubMed/NCBI
|
|
35
|
Diss JK, Stewart D, Pani F, et al: A
potential novel marker for human prostate cancer: voltage-gated
sodium channel expression in vivo. Prostate Cancer Prostatic Dis.
8:266–273. 2005. View Article : Google Scholar : PubMed/NCBI
|
|
36
|
Yang M, Kozminski DJ, Wold LA, et al:
Therapeutic potential for phenytoin: targeting Nav1.5
sodium channels to reduce migration and invasion in metastatic
breast cancer. Breast Cancer Res Treat. 134:603–615.
2012.PubMed/NCBI
|
|
37
|
Onkal R, Mattis JH, Fraser SP, et al:
Alternative splicing of Nav1.5: an electrophysiological comparison
of ‘neonatal’ and ‘adult’ isoforms and critical involvement of a
lysine residue. J Cell Physiol. 216:716–726. 2008.PubMed/NCBI
|
|
38
|
Aman TK, Grieco-Calub TM, Chen C, et al:
Regulation of persistent Na current by interactions between β
subunits of voltage-gated Na channels. J Neurosci. 29:2027–2042.
2009.
|
|
39
|
Leterrier C, Brachet A, Fache MP and
Dargent B: Voltage-gated sodium channel organization in neurons:
protein interactions and trafficking pathways. Neurosci Lett.
486:92–100. 2010. View Article : Google Scholar : PubMed/NCBI
|
|
40
|
Corry B and Thomas M: Mechanism of ion
permeation and selectivity in a voltage gated sodium channel. J Am
Chem Soc. 134:1840–1846. 2012. View Article : Google Scholar : PubMed/NCBI
|
|
41
|
Chioni AM, Shao D, Grose R and Djamgoz MB:
Protein kinase A and regulation of neonatal Nav1.5 expression in
human breast cancer cells: activity-dependent positive feedback and
cellular migration. Int J Biochem Cell Biol. 42:346–358. 2010.
View Article : Google Scholar : PubMed/NCBI
|
|
42
|
Brackenbury WJ: Voltage-gated sodium
channels and metastatic disease. Channels. 6:352–361. 2012.
View Article : Google Scholar : PubMed/NCBI
|
|
43
|
Abdul M and Hoosein N: Voltage-gated
potassium ion channels in colon cancer. Oncol Rep. 9:961–964.
2002.PubMed/NCBI
|
|
44
|
Andrikopoulos P, Fraser SP, Patterson L,
et al: Angiogenic functions of voltage-gated Na+
channels in human endothelial cells: modulation of vascular
endothelial growth factor (VEGF) signaling. J Biol Chem.
286:16846–16860. 2011.
|
|
45
|
Fraser SP, Grimes JA and Djamgoz MB:
Effects of voltage-gated ion channel modulators on rat prostatic
cancer cell proliferation: comparison of strongly and weakly
metastatic cell lines. Prostate. 44:61–76. 2000. View Article : Google Scholar : PubMed/NCBI
|