Introduction
Breast cancer is the most common type of cancer
among women, accounting for ~10% of all types of cancer diagnosed
annually and 23% of all new cancer cases worldwide. It was
estimated that 1.4 million new cases were diagnosed in 2008. More
than a 13-fold increase was globally estimated in the incidence of
female breast cancer in 2008 (1,2). In
addition, breast cancer is an extremely common type of cancer in
Turkey, which is consistent with worldwide statistics. The
estimated number of breast cancer cases was 44,253 in 2007 in
Turkey (3,4). The incidence of the disease is 20% in
women younger than 40 years, while it has been estimated to be
approximately 5% in Western Europe and the US (5). The pathophysiology of breast cancer is
highly complex, and several factors have been reported to be
associated with the development and prognosis of the disease,
including genetic, hormonal, environmental, sociobiological and
physiological factors (6,7). Targeting the underlying causes of
breast cancer will offer a better understanding of the etiology of
the disease. The introduction of novel management approaches based
on recent technological developments is also highly useful to
investigate the underlying causes of such diseases with a
heterogeneous nature. Omics-based recent approaches, in particular,
have allowed an integrated evaluation of the system and have
elucidated the underlying mechanisms behind the disease. Omics
technology encompasses high-throughput assays of major systems such
as genomics, proteomics and metabolomics. Whole genomic and
proteomic studies have demonstrated that the major and minor
factors which play a role in the development of complex diseases
are likely to be assessed concomitantly (8,9). In
addition, studies integrating genomic, proteomic and metabolomic
datasets have provided further information concerning systems
biology, allowing us to accurately identify the underlying factors
and evaluate the functions within a conceptual framework.
In the present study, we aimed to investigate
biomarkers which play a role in the development of breast cancer
using tissue samples through omics-based whole-genome trancriptomic
and whole proteomic profiling. The present study results
demonstrated that hemopexin (HPX), prostate, ovary,
testis-expressed protein E (POTEE), apolipoprotein A1
(Apo-A1), matrix metalloproteinase-9 (MMP-9) molecule and
nuclear factor-κB (NF-κB) gene networks may play a role in the
etiology of this disease. We believe that significant differences
in HPX, POTEE and Apo-A1 molecules,
particularly in whole-genome trancriptomic and whole proteomic
studies advocate further research on these molecules.
Materials and methods
Tissue collection
Tissue samples from malignant tumors and their
normal counterparts were obtained from patients who underwent
surgery for breast cancer at the Department of General Surgery of
Kocaeli University in the period 2009–2010. Tissue samples were
snap-frozen immediately and then stored at −80°C. A total of 20
samples from tumors were analyzed. Most of the samples were
invasive ductal carcinomas (12 samples) and others were invasive
lobular (1 sample), ductal carcinoma in situ (1 sample) and
invasive micropapillary carcinoma (1 sample). The mean patient age
at surgery was 52.8 years with a median age of 52 years (range
38–73). Tumors were evaluated by a breast pathologist to confirm
the diagnosis. ER, PR and c-erbB2 status were determined by
immunohistochemistry (IHC) at the Department of Pathology, Kocaeli
University. Nine samples were estrogen-positive, 5 samples were
progesterone-positive and 8 samples were positive for c-erbB2.
Fourteen normal appearing breast tissues were obtained from women
undergoing surgery. The mean age of these women was 54.2 years,
with a median age of 56 years (range 38–73). The study was approved
by the Kocaeli University Ethics Committee.
Total RNA isolation
Frozen breast tissues were sectioned for RNA
extraction. Total RNA was isolated from cells of each patient using
the Qiagen RNeasy Mini kit (Qiagen, Hilden, Germany) and treated
with DNase I according to the manufacturer’s instructions. Sample
purity was confirmed by measuring A260/A280 ratios. The quality of
the RNA was assessed by loading 300 ng of total RNA onto an RNA
LabChip, followed by analysis (Agilent 2100 Bioanalyzer) (both from
Agilent Technologies, Waldbronn, Germany). An RNA integrity value
(RIN) of ≥6.10 was considered as acceptable.
Microarray and statistical analysis
Microarray analysis was performed using the Whole
Human Genome Oligo Microarray (Agilent Technologies), encompassing
>44,000 human DNA probes. The full list of cDNAs is available
online (http://www.agilent.com). Protocols for
sample preparation and hybridization of the cells were adaptations
of those in the Agilent technical manual. Briefly, first strand
cDNA was transcribed from 200 ng of total RNA using T7-Oligo(dT)
promoter primer. Samples were transcribed in vitro and
Cy-3-labeled using a Quick Amp labeling kit (Agilent Technologies).
Following a further clean-up round (Qiagen), cRNA was fragmented
into pieces ranging from 35 to 200 bases in size. Fragmented cRNA
samples (1.65 mg) were hybridized onto chips by means of 17 h of
incubation at 65°C with constant rotation, followed by a two-step
microarray wash of 1 min in two washing buffers (Agilent
Technologies). Hybridized microarrays were scanned in an Agilent
Technologies scanner (model G2505B), and numerical results were
extracted with Feature Extraction version 9.5.1.1 using
014850_D_F_20060807 grid, GE1-v5_95_Feb07 protocol and
GE1_QCM_Feb07 QC metric set. The microarray data were analyzed
using GeneSpring software version 11.0 (Agilent Technologies, Santa
Clara, CA, USA). The fold-changes were analyzed by filtering the
dataset using P-value <0.05 and a signal-to-noise ratio ≥2 for
use in t-test statistical analysis. Additional filtering (minimum
2.00-fold-change) was applied to extract most genes, which were
analyzed using Ingenuity Pathway Analysis (IPA) software (Ingenuity
Systems, Redwood City, CA, USA). Those genes with known gene
symbols (HUGO) and their corresponding expression values were
uploaded into the software. Each gene symbol was mapped to its
corresponding gene object in the Ingenuity Pathways Knowledge Base.
Networks of these genes were algorithmically generated based on
their connectivity and assigned a score. The score is a numerical
value used to rank networks according to how relevant they are to
the genes in the input dataset but may not be an indication of the
quality or significance of the network. The score takes into
account the number of focus genes in the network and the size of
the network to approximate how relevant this network is to the
original list of focus genes. The network identified was then
presented as a graph indicating the molecular relationships between
genes/gene products. Genes were represented as nodes, and the
biological relationship between two nodes was represented as an
edge (line). The intensity of the node color indicates the degree
of upregulation or downregulation. The node shapes are provided in
corresponding legends. Canonical pathway analysis identified the
pathways from the IPA library of canonical pathways, which were
most significant to the input dataset. The significance of the
association between the dataset and the canonical pathway was
determined based on two parameters: i) a ratio of the number of
genes from the dataset that map to the pathway divided by the total
number of genes that map to the canonical pathway; and ii) a
P-value calculated using Fischer’s exact test determining the
probability that the association between the genes in the dataset
and the canonical pathway is due to chance alone.
Quantitative real-time PCR (qRT-PCR)
cDNA was synthesized using RevertAid First Strand
cDNA Synthesis kit (Fermentas Inc., Glen Burnie, MD, USA). qRT-PCR
was performed as described previously for determination of
Apo-A1 and HPX gene expression. Standard curves were
obtained using serial dilutions of the β-globulin gene (DNA Control
kit; Roche). Gene-specific primers were obtained from Integrated
DNA Technologies (Coralville, IA, USA). Obtained gene expression
values were normalized using a housekeeping gene of β2
microglobulin. Gene expression ratios were compared in patient and
control groups using relative expression software tool (REST).
Proteomic analysis
Extraction and trypsin digestion of
proteins
Tissue samples were frozen with liquid nitrogen and
pulverized with a bead beater (Retsch MM301). UPX extraction buffer
(500 μl) (Expedeon) spiked with 5 μl protease inhibitor cocktail
(Sigma-Aldrich) was added to the samples and boiled at 100°C for 5
min and subsequently centrifuged at 14,000 rpm for 15 min to remove
debris. The supernatant was transferred to a clean Eppendorf tube,
and protein concentration measurement was carried out with a
Nanodrop spectrophotometer at a wavelength of 280 nm (Thermo
ND-1000). Tryptic peptides were generated according to the
filter-aided sample preparation protocol (FASP) (1). Briefly, 50 mg protein was washed with
6 M urea in a 30-kDa cut-off spin column and then alkylated with 10
mM iodoactamide (IAA) in the dark at room temperature for 20 min.
Subsequently, the samples were first washed with 6 M urea to remove
IAA and later with ammonium bicarbonate solution to remove the urea
from the samples and finally tripsinized overnight (1:100, trypsin
to protein ratio). Peptides were eluted from the spin column, and
the concentration was measured with a Nanodrop spectrometer and
adjusted to a concentration of 100 ng/μl and spiked with 50 fmol
internal standard (MassPREP Enolase Digestion Standard; Waters,
Milford, MA, USA).
LC-MS/MS analysis and database
search
The LC-MS/MS analysis and protein identifications
were carried out according to a previously published protocol
(2). Briefly, 500 ng tryptic
peptides in 5 μl for each experimental condition was analyzed by
the nLC-MS/MS system [(nanoAcquity ultra pressure liquid
chromatography (UPLC) and Synapt high definition mass spectrometer
with NanoLockSpray ion source (Waters)]. Columns were equilibrated
with 97% mobile phase A [0.1% formic acid in LC-MS grade water
(Merck)] and the column temperature was set to 45°C. Peptides were
separated from the trap column (Symmetry C18, 5 μm, 180 μm i.d. ×
20 mm) by gradient elution onto an analytical column (BEH C18, 1.7
μm, 75 μm i.d. × 250 mm) (both from Waters) at 300 nl/min flow rate
with a linear gradient from 5 to 40% mobile phase B [0.1 formic
acid in hypergrade acetonitrile (Merck)] over 90 min.
Data independent acquisition mode (MSE)
was carried out by operating the instrument at positive ion V mode,
applying the MS and MS/MS functions over 1.5 sec intervals with 6 V
low energy and 15–40 V high energy collusion. Glu-fibrinopeptide
(internal mass calibrant) was infused every 45 sec at 300 nl/min
flow rate. m/z values over 50–1,600 were recorded. Tandem mass data
extraction, charge state deconvolution and deisotoping were carried
out with ProteinLynx Global Server v2.5 (Waters) and searched with
the IDENTITYE algorithm with a fragment ion mass
tolerance of 0.025 Da and a parent ion tolerance of 0.0100 Da
against the reviewed Homo sapiens protein database from
Uniprot (June 1, 2012, 25,899 entries). The amino acid sequence of
the internal standard (yeast enolase, Uniprot accession no: P00924)
was included in the FASTA file of the database. The Apex3D data
preparation parameters were set to 0.2 min chromatographic peak
width, 10.000 MS TOF resolution, 150 counts for low energy
threshold, 50 counts for elevated energy threshold, and 1,200
counts for the intensity threshold. Databank search query was set
to minimum 3 fragment ion matches/peptide, minimum 7 fragment ion
matches/protein, minimum 1 peptide matches/protein and 1 missed
cleavage. Carbamidomethyl-cysteine fixed modification and
N-terminal acetyl, deamidation of asparagine and glutamine, and
oxidation of methionine variable modifications were set.
Quantification of the protein expression changes was carried out
with Progenesis LC-MS software v4.0 (Nonlinear Dynamics).
Normalization across the sample set was based on total ion signal.
Protein quantification was carried out with only the
non-conflicting peptide features.
Results
Microarray analysis
Differentially expressed genes were determined as
upregulated or downregulated. After data analysis, we identified
585 downregulated and 413 upregulated genes. A selected 10
upregulated and downregulated genes are shown in Tables I and II. Both sets of results were obtained
based on a minimum 2.00-fold-change using GeneSpring software
version 11.0 (Agilent Technologies). The gene expression results of
3 genes; HPX, POTEE and Apo-A1, performed by
real-time PCR and microarray methods were verified. We investigated
interactions using IPA software and found 4 gene networks including
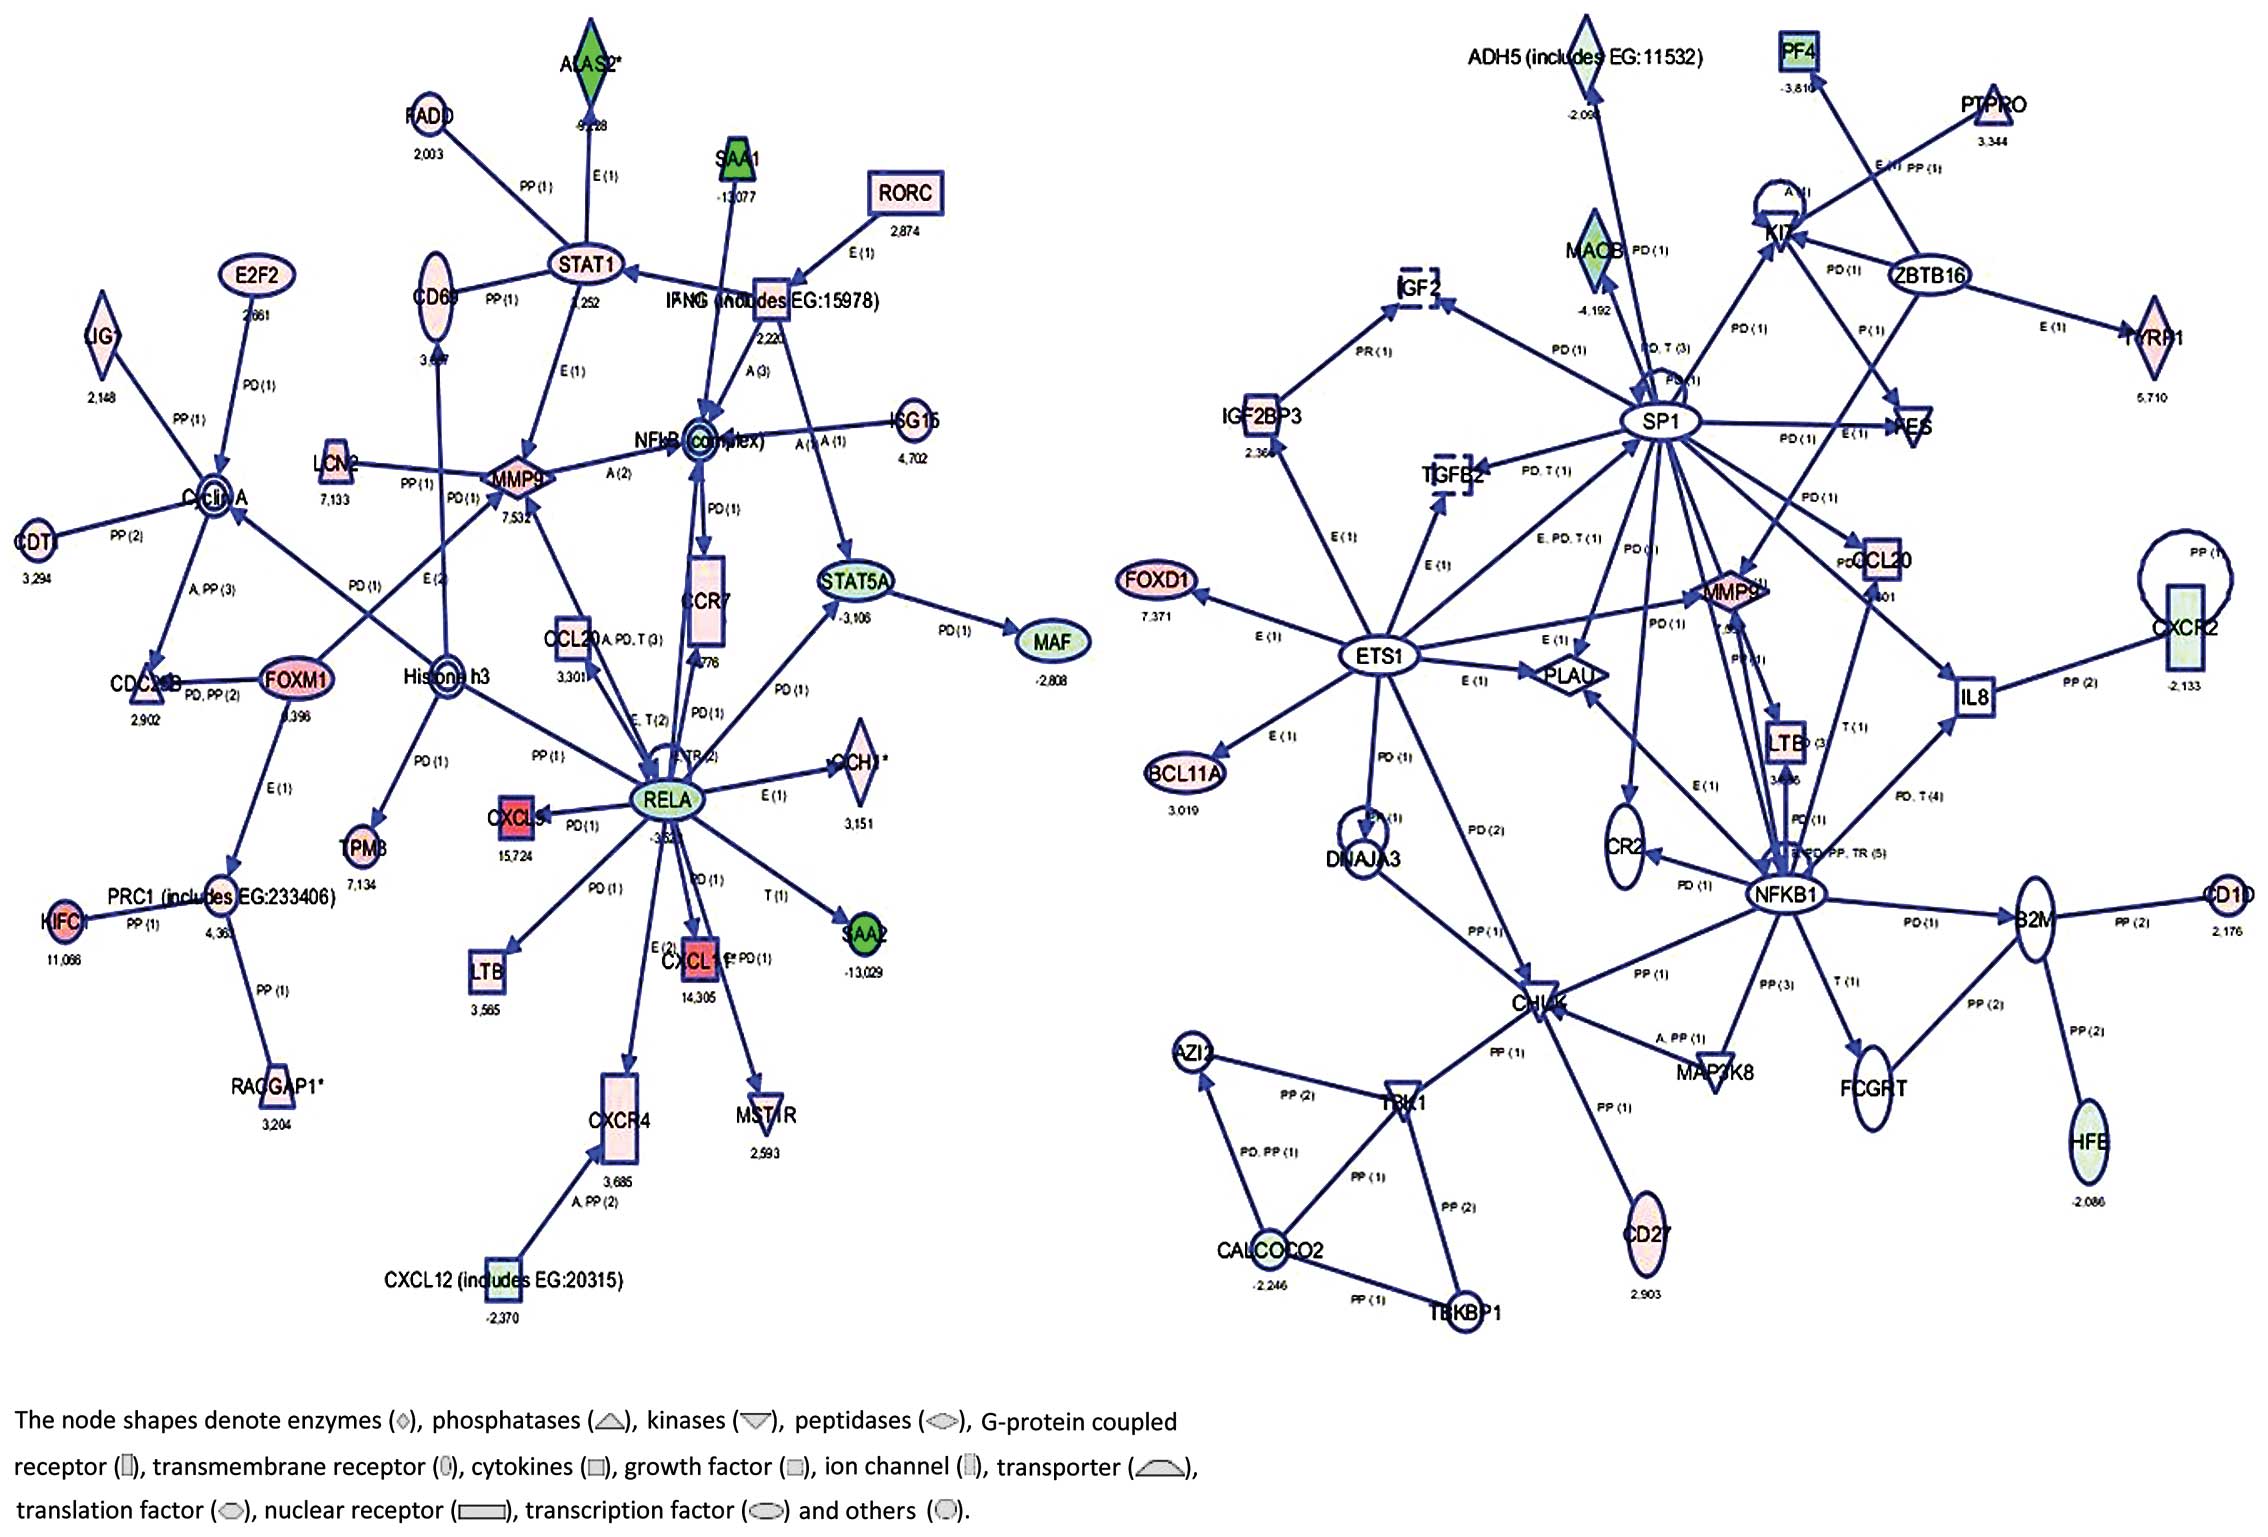
both downregulated and upregulated genes. Fig. 1 shows the most significant 4 gene
networks in the breast cancer samples. Top functions of these genes
were found to be related to inflammatory response, hematological
system development and function, hematopoiesis, genetic disorder,
hematological disease, cancer, embryonic development, lymphoid
tissue structure and development, organ development, tissue
morphology, cellular growth and proliferation. These gene networks
are identified around NF-κB1 and MMP-9. Table III lists the top 5 canonical
pathways including downregulated and upregulated genes.
 | Table ISelected genes were detected as
upregulated in the whole genome expression array dataset. |
Table I
Selected genes were detected as
upregulated in the whole genome expression array dataset.
| Gene symbol | Fold-change (Tumor
vs. normal) | Log fold-change
(Tumor vs. normal) | Absolute
fold-change (Tumor vs. normal) | Regulation (Tumor
vs. normal) | Description |
|---|
| CXCL9 | 15.723808 | 3.9748788 | 15.723808 | Up | Chemokine (C-X-C
motif) ligand 9, [mRNA NM_002416] |
| KIFC1 | 11.06615 | 3.4680815 | 11.06615 | Up | Kinesin family
member C1, mRNA [NM_002263] |
| FOXM1 | 9.396099 | 3.2320619 | 9.396099 | Up | Forkhead box M1,
mRNA [NM_202002] |
| MMP-9 | 7.5315833 | 2.9129531 | 7.5315833 | Up | Matrix
metallopeptidase-9, mRNA [NM_004994] |
| TPM3 | 7.133844 | 2.8346796 | 7.133844 | Up | Tropomyosin 3, mRNA
[NM_001043352] |
| HPX | 5.06874 | 2.3416271 | 5.06874 | Up | Hemopexin, mRNA
[NM_000613] |
| RRM2 | 3.7532458 | 1.9081388 | 3.7532458 | Up | Ribonucleotide
reductase M2, mRNA [NM_001034] |
| E2F2 | 2.6612885 | 1.4121249 | 2.6612885 | Up | E2F transcription
factor 2, mRNA [NM_004091] |
| SREBF1 | 2.3270373 | 1.2184944 | 2.3270373 | Up | Sterol regulatory
element binding transcription factor 1, mRNA [NM_001005291] |
| POTEE | 2.3189814 | 1.2134912 | 2.3189814 | Up | POTE ankyrin domain
family member E, mRNA [NM_001083538] |
| Table IISelected genes were detected as
downregulated in the whole genome expression array dataset. |
Table II
Selected genes were detected as
downregulated in the whole genome expression array dataset.
| Gene symbol | Fold-change (Tumor
vs. normal) | Log fold-change
(Tumor vs. normal) | Absolute
fold-change (Tumor vs. normal) | Regulation (Tumor
vs. normal) | Description |
|---|
| APOA1 | −2.0003383 | −1.000244 | 2.0003383 | Down | Apolipoprotein A-I,
mRNA [NM_000039] |
| CSDA | −2.0459063 | −1.03274 | 2.0459063 | Down | Cold shock domain
protein A, transcript variant 1, mRNA [NM_003651] |
| NFAT5 | −2.128091 | −1.0895599 | 2.128091 | Down | Nuclear factor of
activated T-cells 5, tonicity-responsive, transcript variant 1,
mRNA [NM_138714] |
| MSC | −2.1575832 | −1.1094162 | 2.1575832 | Down | Musculin (activated
B-cell factor-1), mRNA [NM_005098] |
| NRP2 | −2.1909428 | −1.1315519 | 2.1909428 | Down | Neuropilin 2,
transcript variant 6, mRNA [NM_201264] |
| LMO2 | −2.2316236 | −1.1580938 | 2.2316236 | Down | LIM domain only 2
(rhombotin-like 1), transcript variant 1, mRNA [NM_005574] |
| CXCL12 | −2.3697665 | −1.2447449 | 2.3697665 | Down | Chemokine (C-X-C
motif) ligand 12 (stromal cell-derived factor 1), transcript
variant 2, mRNA [NM_000609] |
| MAF | −2.808239 | −1.4896657 | 2.808239 | Down | V-maf
musculoaponeurotic fibrosarcoma oncogene homolog (avian),
transcript variant 2, mRNA [NM_001031804] |
| STAT5A | −3.106449 | −1.6352663 | 3.106449 | Down | Signal transducer
and activator of transcription 5A, mRNA [NM_003152] |
| RELA | −3.5231855 | −1.8168805 | 3.5231855 | Down | V-rel
reticuloendotheliosis viral oncogene homolog A (avian), transcript
variant 2, mRNA [NM_001145138] |
| Table IIIGene set enrichment analysis. |
Table III
Gene set enrichment analysis.
| Pathway | −Log (P-value) | Ratio | Molecules |
|---|
| LXR/RXR
activation | 1.00 E-03 | 9.50 E-02 | AMBP, APOA1, APOA4,
APOC1, HPX, MMP-9, RELA, SAA1, SAA2, SAA4, SCD, SREBF1 |
| PKCθ signaling in T
lymphocytes | 5.43 E-04 | 9.40 E-02 | CARD11, CD3D,
HLA-DOA, HLA-DQA1, RAC2, RELA, SOS1, ZAP70 |
| T cell receptor
signaling | 4.79 E-04 | 1.08 E-01 | BMX, CARD11, CD3D,
LCK, NFAT5, PIK3CD, PTPRH, RASGRP1, RELA, SOS1, ZAP70 |
| Atherosclerosis
signaling | 1.89 E-04 | 1.04 E-01 | APOA4, APOC1,
COL10A1, CXCL12, CXCR4, IFNG, MMP-9, PLA2G10, PLA2R1, RELA,
SAA4 |
| CTLA4 signaling in
cytotoxic T lymphocytes | 6.17 E-05 | 1.26 E-01 | AP1G2, AP1M2, CD3D,
HLA-DOA, HLA-DQA1, LCK, PIK3CD, PPP2CB, PPP2R2C, PTPN22 |
Proteomic analysis by label-free
LC-MS/MS
Label-free shotgun proteomic analysis was applied to
compare the differential proteome expression of the cancer and
control samples. Typical coefficient of variations observed for the
nanoLC-MS/MS analysis with the nanoAcquity UPLC system coupled to a
Synapt high definition mass spectrometer was ~10–14%. Only protein
expression changes above 40% were considered to be statistically
significant. Thirty-four tissue samples were homogenized, proteins
extracted and analyzed by nanoLC/MS/MS and 683 proteins in 357
protein groups were identified and 291 proteins out of 357 were
quantified. Power analysis was also performed for the analysis that
indicated whether the sample set had enough replicates to determine
real differences among the sample groups. The data (89.5%) had a
power value of >0.8, indicating that the number of replicates in
each group was satisfactory to represent the group. One hundred and
forteen proteins showed >40% expression change and were
statistically significant. We were most interested in 4 of the
statistically significantly altered proteins. Apo-A1, POTEE and HPX
were identified with 28, 36 and 8 unique peptide sequences,
respectively. Protein quantification was based on non-conflicting
features and Apo-A1, POTEE and HPX were quantified based on 14.2
and 5 peptide sequences, respectively. Given the high number of
unique peptide sequences identified for each protein, it was
confirmed that the protein identification was stringent and
accurate (Table IV).
| Table IVProtein profiling studies performed
in control and breast cancer tissues by label-free shotgun
proteomic analysis. |
Table IV
Protein profiling studies performed
in control and breast cancer tissues by label-free shotgun
proteomic analysis.
| Protein | Peptides | Score | ANOVA
(P-value) | Fold | Description | Average normalized
abundance |
|---|
|
|---|
| Cancer | Control |
|---|
| EF1A3 | 27 (1) | 160.51 | 1.13E-05 | 3.52 | EF1A3 HUMAN
putative elongation factor 1α like 3 OS Homo sapiens GN
EEF1A1P5 PE 5 SV 1 | 1571.57 | 446.63 |
| CAH1 | 7 (4) | 72.74 | 5.35E-06 | 2.69 | CAH1 HUMAN carbonic
anhydrase 1 OS Homo sapiens GN CA1 PE 1 SV 2 | 2240.24 | 6018.94 |
| POTEE | 36 (2) | 246.87 | 6.94E-08 | 2.57 | POTEE HUMAN POTE
ankyrin domain family member E OS Homo sapiens GN
POTEE PE 1 SV 3 | 515.9 | 201.04 |
| ACTG | 44 (2) | 322.46 | 9.20E-09 | 2.51 | ACTG HUMAN actin
cytoplasmic 2 OS Homo sapiens GN ACTG1 PE 1 SV 1 | 1952.78 | 778.64 |
| Hemopexin | 8 (5) | 68.2 | 4.88E-08 | 2.11 | HEMO HUMAN
hemopexin OS Homo sapiens GN HPX PE 1 SV 2 | 3280.94 | 1552.96 |
| IGHA2 | 10 (1) | 70.72 | 4.87E-06 | 1.88 | IGHA2 HUMAN Ig α 2
chain C region OS Homo sapiens GN IGHA2 PE 1 SV 3 | 1076.4 | 2020.74 |
| IGHG2 | 22 (4) | 135.6 | 1.59E-05 | 1.83 | IGHG2 HUMAN Ig γ 2
chain C region OS Homo sapiens GN IGHG2 PE 1 SV 2 | 4238.46 | 7765.97 |
| APOA1 | 28 (14) | 209.27 | 1.14E-06 | 1.77 | APOA1 HUMAN
apolipoprotein AI OS Homo sapiens GN APOA1 PE 1 SV 1 | 1.62E+04 | 2.87E+04 |
| IGHA1 | 13 (4) | 90.63 | 2.80E-06 | 1.69 | IGHA1 HUMAN Ig α1
chain C region OS Homo sapiens GN IGHA1 PE 1 SV 2 | 3917.9 | 6617.12 |
| POTEF | 32 (1) | 215.04 | 0.01 | 1.53 | POTEF HUMAN POTE
ankyrin domain member F OS Homo sapiens family GN POTEF PE 1
SV 2 | 38.28 | 24.95 |
Discussion
In parallel with various types of studies, the
primary goal of cancer research is to understand the underlying
mechanisms of the disease. It has been well-established that cancer
involves several mechanisms including cell proliferation,
differentiation, apoptosis and inflammation (10–12).
Each of these mechanisms has a highly complex gene-protein
relationship. Major mutations may induce the development of cancer,
while minor factors with sequential networks and pathways may
contribute to the development of the disease (13–16).
High-throughput assays offer several advantages in such diseases
with a heterogeneous nature. Recent omics-based approaches, in
particular, integrate expression and proteomic and metabolomics
data, allowing us to assess major and minor diseases concomitantly
(9,17).
In the present study, we evaluated breast cancer
within the framework of omics science. We performed whole-genome
expression array analysis and proteomic studies using the same
tissue samples obtained from patients with breast cancer. In the
present study, we observed significant networks and demonstrated a
significant correlation among, HPX and POTEE
molecules using both array and proteomic data.
Apolipoprotein A-1 (Apo-A1) is the major
protein component of high density lipoprotein (HDL) (18–20).
It is synthesized mainly in the liver and small intestine (21). As confirmed by several studies,
Apo-A1 suppresses inflammation, tumor growth, angiogenesis,
invasion and metastasis (22).
Studies have found that Apo-A1 is a potential biomarker for
many types of cancer including breast and pancreatic carcinomas
(23–27). It is usually thought that the role
of the Apo-A1 molecule in cancer pathophysiology is
associated with the phospholipid binding ability.
Lysophospholipids, in particular, have been shown to play a
critical role in the development of cancer and have been reported
to be major biomarkers for cancerous diseases (28,29).
Animal studies have also shown that overexpression of the
Apo-A1 gene led to the inhibition of tumor growth in mice
and prolonged survival (30). In
the present study, we found reduced Apo-A1 gene expression
in the patients with breast cancer as determined by microarray
analyses. We also found reduced Apo-A1 in tumor tissues
based on proteomic studies. Our study results which were consistent
with the literature data indicate that reduced Apo-A1 may
play a role in the development of tumors. The examination of tissue
samples obtained from the patients with breast cancer also
suggested that Apo-A1 may play an active role in the
development of breast cancer. In addition, it is well-known that
Apo-A1, an anti-apoptotic and antioxidant molecule,
functions in transporting other antioxidant molecules and may
directly affect the intracellular signaling pathways (27,31).
Similarly, we confirmed that Apo-A1 is a critical candidate
biomarker for the development of cancer. We also observed a
significant increase in MMP-9 gene expression according to
the microarray analyses. This finding, which indicates the role of
MMP-9 alone and in combination with Apo-A1 in the
development of cancer, is important. Apo-A1 was found to
inhibit MMP-9 (30). The
MMP-9 is a zinc-dependent endopeptidase which is responsible
for the degradation of the extracellular matrix (32). It plays a major role in cellular
behaviors such as tumor angiogenesis, invasion and metastasis.
Higher levels of active MMP-9 were observed in highly
invasive and metastatic melanoma tumors (33–35).
Degradation of the extracellular matrix results in invasion and
metastasis of the disease. Matrix metalloproteinases are
synthesized by epithelial and mesenchymal cells including
leukocytes, keratinocytes, fibroblasts, macrophages, chondrocytes
and smooth muscle cells (36–38).
MMP expression was found in endometrial vessels during the
involution of mammary glands and inflammation in adult women. MMPs
play an important role in the pathology of many diseases, although
their roles in the underlying mechanisms of cell proliferation and
differentiation, remodeling, ovulation, cellular migration and
angiogenesis remain to be elucidated (39). MMPs, which are initially secreted in
the form of inactive zymogens, are inhibited by specific tissue
inhibitors (TIMPs) and Apo-A1 (35). MMP-9 is one of the matrix
metalloproteinases which is mostly found in malignant tissues with
high tumor aggressiveness and metastatic potential (32,33).
In the present study, we obtained similar results with reduced
Apo-A1 expression and increased MMP-9 expression.
MMP-9 was previously shown to be increased in plasma and
urinary samples, as well as cancer tissues in patients with breast
cancer (33,38,39).
In the present study, we also observed overexpression of
MMP-9, which is consistent with the literature data. It is
known that MMP-9 is inhibited by Apo-A1 in healthy
tissues. However, we found an inverse relationship between
MMP-9 inhibition and Apo-A1 with a significant
difference between the breast cancer and healthy tissues. These
findings were inconsistent with the literature data, suggesting the
critical role of the relationship between MMP-9 and
Apo-A1 in the development of breast cancer. According to the
literature data, it can be concluded that the ability of
Apo-A1 to inhibit MMP-9 is deactivated in the
development of breast cancer without negative control for
MMP-9 through Apo-A1.
In the present study, we assessed all data at the
network level. We aimed to investigate upregulated and
downregulated networks and identify major genes. The presence of
the NF-κB gene family and MMP-9 gene in both
upregulated and downregulated analyses is important. Based on the
upregulated analysis data, we found a large-sized and integrated
gene network in which REL-A was in the center. Overexpressed
MMP-9 was associated with this gene network. Based on the
downregulated analysis data, we found a gene network in which the
NF-κB1 gene was relatively in the center with overexpressed
MMP-9. NF-κB is a transcription factor which plays a
major role in immunity, cell proliferation, cell survival and
cancer (40). Activation of
NF-κB is increased in many types of cancers, and is
associated with various steps in the development of malignancy,
such as expression of anti-apoptotic genes, angiogenesis, tumor
growth and metastasis (41,42). NF-κB regulates several genes
such as cyclooxygenase-2 (COX-2), nuclear factor-κB
inhibitor α (IκBα), tumor necrosis factor α (TNF-α),
cyclin D1, intercellular adhesion molecule 1 (ICAM-1),
c-myc, Bcl-2, inducible nitric oxide synthase
(iNOS), and interleukins including IL-6 and
IL-8 and also MMP-9 (43–45).
The present study results were consistent with previous study
findings which indicate the role of NF-κB in the development
of cancer. All data obtained from the array and proteomic data
along with the network analysis suggest that MMP-9, in
particular, is a critical player in the development of breast
cancer. We also found a significant relationship between
MMP-9, and gene expression of other genes in the network.
Our findings highlighted the crucial role of NF-κB in the
gene network analyses in the development of breast cancer.
In the present study, HPX was another
molecule which was consistent with the proteomic and transcriptomic
data. We observed that HPX was upregulated based on the
whole-genome cDNA array and proteomic analyses. The human
HPX protein is a 60-kDa plasma glycoprotein, which consists
of two domains joined by a linker sequence (46). HPX represents the primary
line of defense against heme-related oxidative stress and toxicity
(47). The HPX molecule is
capable of binding heme with high affinity and acting as a
heme-specific carrier from the bloodstream to the liver (48). Heme, which is the functional group
of diverse hemoproteins, is critical for many cellular processes.
Excessive free heme may be detrimental to tissues by mediating
oxidative and inflammatory injury (46,49).
Murrell demonstrated that, similar to free oxygen radicals,
chemical carcinogens may also result in damage to mammary
epithelial cells, fibroblastic proliferation, epithelial
hyperplasia, cellular atypia and, thereby, breast cancer (50). Similarly, an increased HPX
rate may be an indicator of actual oxidative stress in the breast
tumors in this study. Experimental and epidemiological studies have
shown that free oxygen radicals play a role in the pathogenesis of
cancer (50). Free oxygen radicals,
in the presence of metal ions particularly, may lead to oxidative
damage, interacting with cellular proteins, lipids and
macromolecules with DNA. Improved defense mechanisms with
antioxidants may reduce oxidative damage. It is well-established
that molecules such as heme oxygenase-1 (HO-1) and
glucose-6-phosphate dehydrogenase (G6PD) act as antioxidants
against free oxygen radicals and offer a cellular defense against
oxidative stress (51,52). In the present study, overexpressed
HPX may be rationalized by the cellular defense of this
molecule, similar to HO-1 and G6PD. We believe that HPX was
overexpressed due to oxidative stress during the development of
breast cancer, exhibiting a preventive role against oxidative
damage with its cellular defense mechanism. Overexpression of
HPX may be an indicator of actual oxidative stress in breast
cancer. As a result, a novel diagnostic approach based on the
prediction of oxidative damage using several molecules including
HPX may be developed for patients with breast cancer.
In the present study, POTEE was another
molecule which was significantly increased based on both array and
proteomic data. Recent studies suggest that POTEE family
proteins may be involved in signal transmission across the plasma
membrane. POTEE was initially found to be expressed in
normal prostate, ovary, testis and placenta tissues, as well as in
prostate cancer (53). Recently,
POTEE was identified in a variety of human cancers as a
novel tumor-associated antigen (53–55).
POTE was shown to be expressed in a wide variety of human cancers
(53). Published studies revealed
that POTEE genes were expressed not only in prostate cancer,
but also in a wide variety of human malignancies, including breast,
colon, lung, ovaran and pancreatic cancer (54). The amount of POTEE molecules
which are produced is very low in normal tissues. Increased
expression of these molecules has been shown in prostate and breast
cancer (54,55). Low levels of these molecules in
normal tissues and higher levels in tumor cells alone make the
POTEE molecule a critical immunotherapeutic biomarker
(56). It is thought that
POTEE can be a suitable antibody for radiotherapy and
immunotherapy in patients with cancer, as it is only increased in
cancer tissues. In the present study, we observed POTEE
overexpression based on the whole-genome expression array analysis
and proteomic studies using breast cancer tissue samples. This
finding, consistent with previous study findings, supports the
opinion that POTEE protein is a critical player in breast
cancer. On the other hand, there is a limited number of studies
indicating increased expression of POTEE. We believe that
our study contributes to the literature. In addition, we
demonstrated that increased expression of POTEE was
accompanied by increased gene expression. Therefore, novel
diagnostic and monitoring technologies should be developed within
the framework of gene expression, as well as antibody therapy.
In conclusion, in the present study, which was
conducted in the light of the literature data, we found that
MMP-9, in particular, and its biological mechanisms are of
utmost importance for breast cancer. Identification of
Apo-A1 and overexpression of MMP-9 in both the array
and proteomic studies underline the role of Apo-A1 and
MMP-9 in the pathophysiology of the disease. These findings
also highlight the importance of omics-based approaches in
elucidating the underlying mechanisms behind complex diseases such
as cancer. Previous studies implicate these three molecules,
Apo-A1, HPX and POTEE, in the development of
breast cancer. The present study results were also consistent with
previous findings, highlighting their major role in the underlying
pathology. Apo-A1, in particular, was associated with breast
cancer and is considered to be a critical player in the development
of the disease due to its molecular characteristics. POTEE
and HPX, in contrast, are indicators of existing pathology and may
be considered for further diagnostic and therapeutic applications.
We conclude that molecular targeting studies may produce
significant improvements in the diagnosis and treatment of breast
cancer.
Acknowledgements
This study was generously supported by Kocaeli
University BAP (no. 2009/022). Label-free shotgun proteomic
analysis and data analysis were designed and performed at the
Department of Medical Biochemistry, School of Medicine, Istanbul
Medipol University, Istanbul, Turkey and the Genetic Engineering
and Biotechnology Institute, Marmara Research Center, TUBITAK,
Kocaeli, Turkey. All microarray studies, gene network and gene set
enrichments were analyzed at the Department of Medical Genetics,
Faculty of Medicine, Kocaeli University, Kocaeli, Turkey.
References
|
1
|
Ferlay J, Shin HR, Bray F, Forman D,
Mathers C and Parkin D: Globocan 2008: Cancer Incidence and
Mortality Worldwide: IARC Cancer Base No. 10. Lyon: pp. 1027–5614.
2008
|
|
2
|
Parkin DM, Bray F, Ferlay J and Pisani P:
Global cancer statistics, 2002. CA Cancer J Clin. 55:74–108. 2005.
View Article : Google Scholar
|
|
3
|
Tuncer M: Significance of Cancer in
Turkey, the Burden of Disease and Cancer Control Policies Cancer
Control in Turkey. 74. Onur Press, Health Ministry Publication;
Ankara: pp. 5–9. 2008
|
|
4
|
Statistical Analyses of National Breast
Cancer Registry Program of Turkish Federation of Breast Societies.
2008 Executive Summary of the National Cancer Control Programmes:
Policies and Managerial Guidelines. World Health Organization;
Geneva: 2002
|
|
5
|
Héry C, Ferlay J, Boniol M and Autier P:
Quantification of changes in breast cancer incidence and mortality
since 1990 in 35 countries with Caucasian-majority populations. Ann
Oncol. 19:1187–1194. 2008.PubMed/NCBI
|
|
6
|
Ruder EH1, Dorgan JF, Kranz S,
Kris-Etherton PM and Hartman TJ: Examining breast cancer growth and
lifestyle risk factors: early life, childhood, and adolescence.
Clin Breast Cancer. 8:334–342. 2008. View Article : Google Scholar : PubMed/NCBI
|
|
7
|
Setiawan VW, Monroe KR, Wilkens LR,
Kolonel LN, Pike MC and Henderson BE: Breast cancer risk factors
defined by estrogen and progesterone receptor status: the
multiethnic cohort study. Am J Epidemiol. 169:1251–1259. 2009.
View Article : Google Scholar : PubMed/NCBI
|
|
8
|
Martin DB and Nelson PS: From genomics to
proteomics: techniques and applications in cancer research. Trends
Cell Biol. 11:S60–S65. 2001. View Article : Google Scholar : PubMed/NCBI
|
|
9
|
Bhati A, Garg H, Gupta A, Chhabra H,
Kumari A and Patel T: Omics of cancer. Asian Pac J Cancer Prev.
13:4229–4233. 2012. View Article : Google Scholar
|
|
10
|
Dupont WD and Page DL: Risk factors for
breast cancer in women with proliferative disease. N Engl J Med.
312:146–151. 1985. View Article : Google Scholar : PubMed/NCBI
|
|
11
|
Collaborative Group on Hormonal Factors in
Breast Cancer. Breast cancer and hormonal contraceptives:
collaborative reanalysis of individual data on 53,297 women with
breast cancer and 100,239 women without breast cancer from 54
epidemiological studies. Lancet. 347:1713–1727. 1996. View Article : Google Scholar
|
|
12
|
Bièche I and Lidereau R: Genome-based and
transcriptome-based molecular classification of breast cancer. Curr
Opin Oncol. 23:93–99. 2011.PubMed/NCBI
|
|
13
|
Marcotte R and Muller WJ: Signal
transduction in transgenic mouse models of human breast cancer -
implications for human breast cancer. J Mammary Gland Biol
Neoplasia. 13:323–335. 2008. View Article : Google Scholar : PubMed/NCBI
|
|
14
|
D’Alessio A, De Luca A, Maiello MR, Lamura
L, Rachiglio AM, Napolitano M, Gallo M and Normanno N: Effects of
the combined blockade of EGFR and ErbB-2 on signal transduction and
regulation of cell cycle regulatory proteins in breast cancer
cells. Breast Cancer Res Treat. 123:387–396. 2010.PubMed/NCBI
|
|
15
|
Reese DM and Slamon DJ: HER-2/neu
signal transduction in human breast and ovarian cancer. Stem Cells.
15:1–8. 1997.
|
|
16
|
Shen Q and Brown PH: Novel agents for the
prevention of breast cancer: targeting transcription factors and
signal transduction pathways. J Mammary Gland Biol Neoplasia.
8:45–73. 2003. View Article : Google Scholar : PubMed/NCBI
|
|
17
|
Hyduke DR, Lewis NE and Palsson BØ:
Analysis of omics data with genome-scale models of metabolism. Mol
Biosyst. 9:167–174. 2013. View Article : Google Scholar : PubMed/NCBI
|
|
18
|
Grundy SM and Vega GL: Role of
apolipoprotein levels in clinical practice. Arch Intern Med.
8:1579–1582. 1990. View Article : Google Scholar : PubMed/NCBI
|
|
19
|
Nissen SE, Tsunoda T, Tuzcu EM,
Schoenhagen P, Cooper CJ, Yasin M, Eaton GM, Lauer MA, Sheldon WS,
Grines CL, Halpern S, Crowe T, Blankenship JC and Kerensky R:
Effect of recombinant ApoA-I Milano on coronary atherosclerosis in
patients with acute coronary syndromes: a randomized controlled
trial. JAMA. 290:2292–2300. 2003. View Article : Google Scholar : PubMed/NCBI
|
|
20
|
Moore RE, Navab M, Millar JS, Zimetti F,
Hama S, Rothblat GH and Rader DJ: Increased atherosclerosis in mice
lacking apolipoprotein A-I attributable to both impaired reverse
cholesterol transport and increased inflammation. Circ Res.
97:763–771. 2005. View Article : Google Scholar : PubMed/NCBI
|
|
21
|
Jahangiri A: High-density lipoprotein and
the acute phase response. Curr Opin Endocrinol Diabetes Obes.
17:156–160. 2010. View Article : Google Scholar : PubMed/NCBI
|
|
22
|
Moore LE, Fung ET, McGuire M, Rabkin CC,
Molinaro A, Wang Z, Zhang F, Wang J, Yip C, Meng XY and Pfeiffer
RM: Evaluation of apolipoprotein A1 and posttranslationally
modified forms of transthyretin as biomarkers for ovarian cancer
detection in an independent study population. Cancer Epidemiol
Biomarkers Prev. 15:1641–1646. 2006. View Article : Google Scholar
|
|
23
|
Kozak KR, Su F, Whitelegge JP, Faull K,
Reddy S and Farias-Eisner R: Characterization of serum biomarkers
for detection of early stage ovarian cancer. Proteomics.
5:4589–4596. 2005. View Article : Google Scholar : PubMed/NCBI
|
|
24
|
Ehmann M, Felix K, Hartmann D, Schnölzer
M, Nees M, Vorderwülbecke S, Bogumil R, Büchler MW and Friess H:
Identification of potential markers for the detection of pancreatic
cancer through comparative serum protein expression profiling.
Pancreas. 34:205–214. 2007. View Article : Google Scholar : PubMed/NCBI
|
|
25
|
Takaishi S and Wang TC: Gene expression
profiling in a mouse model of Helicobacter-induced gastric
cancer. Cancer Sci. 98:284–293. 2007. View Article : Google Scholar : PubMed/NCBI
|
|
26
|
Nosov V, Su F, Amneus M, Birrer M, Robins
T, Kotlerman J, Reddy S and Farias-Eisner R: Validation of serum
biomarkers for detection of early-stage ovarian cancer. Am J Obstet
Gynecol. 200:639.e1–639.e5. 2009. View Article : Google Scholar : PubMed/NCBI
|
|
27
|
Hamrita B, Ben Nasr H, Gabbouj S,
Bouaouina N, Chouchane L and Chahed K: Apolipoprotein A1 −75 G/A
and +83 C/T polymorphisms: susceptibility and prognostic
implications in breast cancer. Mol Biol Rep. 38:1637–1643.
2011.
|
|
28
|
Lv GM, Li P, Wang WD, Wang ShK, Chen JF
and Gong YL: Lysophosphatidic acid (LPA) and endothelial
differentiation gene (Edg) receptors in human pancreatic cancer. J
Surg Oncol. 104:685–691. 2011. View Article : Google Scholar : PubMed/NCBI
|
|
29
|
Panupinthu N, Lee HY and Mills GB:
Lysophosphatidic acid production and action: critical new players
in breast cancer initiation and progression. Br J Cancer.
102:941–946. 2010. View Article : Google Scholar : PubMed/NCBI
|
|
30
|
Zamanian-Daryoush M, Lindner D, Tallant
TC, Wang Z, Buffa J, Klipfell E, Parker Y, Hatala D,
Parsons-Wingerter P, Rayman P, Yusufishaq MS, Fisher EA, Smith JD,
Finke J, DiDonato JA and Hazen SL: The cardioprotective protein
apolipoprotein A1 promotes potent anti-tumorigenic effects. J Biol
Chem. 288:21237–21252. 2013. View Article : Google Scholar : PubMed/NCBI
|
|
31
|
Hyka N, Dayer JM, Modoux C, Kohno T,
Edwards CK III, Roux-Lombard P and Burger D: Apolipoprotein A-I
inhibits the production of interleukin-1β and tumor necrosis
factor-α by blocking contact-mediated activation of monocytes by T
lymphocytes. Blood. 97:2381–2389. 2001.
|
|
32
|
Nagase H, Visse R and Murphy G: Structure
and function of matrix metalloproteinases and TIMPs. Cardiovasc
Res. 69:562–573. 2006. View Article : Google Scholar : PubMed/NCBI
|
|
33
|
Bendrik C, Robertson J, Gauldie J and
Dabrosin C: Gene transfer of matrix metalloproteinase-9 induces
tumor regression of breast cancer in vivo. Cancer Res.
68:3405–3412. 2008. View Article : Google Scholar : PubMed/NCBI
|
|
34
|
Kato K, Hara A, Kuno T, et al: Matrix
metalloproteinases 2 and 9 in oral squamous cell carcinomas:
manifestation and localization of their activity. J Cancer Res Clin
Oncol. 131:340–346. 2005. View Article : Google Scholar : PubMed/NCBI
|
|
35
|
Groblewska M, Siewko M, Mroczko B and
Szmitkowski M: The role of matrix metalloproteinases (MMPs) and
their inhibitors (TIMPs) in the development of esophageal cancer.
Folia Histochem Cytobiol. 50:12–19. 2012. View Article : Google Scholar : PubMed/NCBI
|
|
36
|
Galis ZS and Khatri JJ: Matrix
metalloproteinases in vascular remodeling and atherogenesis: the
good, the bad, and the ugly. Circ Res. 90:251–262. 2002.PubMed/NCBI
|
|
37
|
Holmbeck K, Bianco P, Caterina J, Yamada
S, Kromer M, Kuznetsov SA, Mankani M, Robey PG, Poole AR, Pidoux I,
Ward JM and Birkedal-Hansen H: MT1-MMP-deficient mice develop
dwarfism, osteopenia, arthritis, and connective tissue disease due
to inadequate collagen turnover. Cell. 99:81–92. 1999. View Article : Google Scholar : PubMed/NCBI
|
|
38
|
Catania JM, Chen G and Parrish AR: Role of
matrix metalloproteinases in renal pathophysiologies. Am J Physiol
Renal Physiol. 292:F905–F911. 2007. View Article : Google Scholar : PubMed/NCBI
|
|
39
|
Labrie M and St-Pierre Y: Epigenetic
regulation of mmp-9 gene expression. Cell Mol Life Sci.
70:3109–3124. 2013. View Article : Google Scholar : PubMed/NCBI
|
|
40
|
Hayden MS and Ghosh S: Shared principles
in NF-κB signaling. Cell. 132:344–362. 2008.
|
|
41
|
Sovak MA, Bellas RE, Kim DW, Zanieski GJ,
Rogers AE, Traish AM and Sonenshein GE: Aberrant nuclear
factor-kappaB/Rel expression and the pathogenesis of breast cancer.
J Clin Invest. 100:2952–2960. 1997. View Article : Google Scholar : PubMed/NCBI
|
|
42
|
Nakshatri H and Goulet RJ Jr: NF-kappaB
and breast cancer. Curr Probl Cancer. 26:282–309. 2002. View Article : Google Scholar : PubMed/NCBI
|
|
43
|
Plummer SM, Holloway KA, Manson MM, Munks
RJ, Kaptein A, Farrow S and Howells L: Inhibition of
cyclo-oxygenase 2 expression in colon cells by the chemopreventive
agent curcumin involves inhibition of NF-κB activation via the
NIK/IKK signalling complex. Oncogene. 18:6013–6020. 1999.PubMed/NCBI
|
|
44
|
Barnes PJ and Karin M: Nuclear factor-κB:
a pivotal transcription factor in chronic inflammatory diseases. N
Engl J Med. 336:1066–1071. 1997.
|
|
45
|
Wertz IE, O’Rourke KM, Zhou H, Eby M,
Aravind L, Seshagiri S, Wu P, Wiesmann C, Baker R, Boone DL, Ma A,
Koonin EV and Dixit VM: De-ubiquitination and ubiquitin ligase
domains of A20 downregulate NF-κB signalling. Nature. 430:694–699.
2004.PubMed/NCBI
|
|
46
|
Tolosano E and Altruda F: Hemopexin:
structure, function, and regulation. DNA Cell Biol. 21:297–306.
2002. View Article : Google Scholar
|
|
47
|
Kumar S and Bandyopadhyay U: Free heme
toxicity and its detoxification systems in human. Toxicol Lett.
157:175–188. 2005. View Article : Google Scholar : PubMed/NCBI
|
|
48
|
Tolosano E, Fagoonee S, Morello N, Vinchi
F and Fiorito V: Heme scavenging and the other facets of hemopexin.
Antioxid Redox Signal. 12:305–320. 2010. View Article : Google Scholar : PubMed/NCBI
|
|
49
|
Balla J, Vercellotti GM, Jeney V, Yachie
A, Varga Z, Eaton JW and Balla G: Heme, heme oxygenase and ferritin
in vascular endothelial cell injury. Mol Nutr Food Res.
49:1030–1043. 2005. View Article : Google Scholar : PubMed/NCBI
|
|
50
|
Murrell TG: Epidemiological and
biochemical support for a theory on the cause and prevention of
breast cancer. Medical Hypotheses. 36:389–396. 1991. View Article : Google Scholar : PubMed/NCBI
|
|
51
|
Ferris CD, Jaffrey SR, Sawa A, Takahashi
M, Brady SD, Barrow RK, Tysoe SA, Wolosker H, Barañano DE, Doré S,
Poss KD and Snyder SH: Haem oxygenase-1 prevents cell death by
regulating cellular iron. Nat Cell Biol. 1:152–157. 1999.PubMed/NCBI
|
|
52
|
Ho HY, Cheng ML and Chiu DT:
Glucose-6-phosphate dehydrogenase - from oxidative stress to
cellular functions and degenerative diseases. Redox Rep.
12:109–118. 2007. View Article : Google Scholar : PubMed/NCBI
|
|
53
|
Bera TK, Zimonjic DB, Popescu NC,
Sathyanarayana BK, Kumar V, Lee BK and Pastan I: POTE, a
highly homologous gene family located on numerous chromosomes and
expressed in prostate, ovary, testis, placenta and prostate cancer.
Proc Natl Acad Sci USA. 99:16975–16980. 2002. View Article : Google Scholar : PubMed/NCBI
|
|
54
|
Bera TK, Huynh N, Maeda H, Sathyanarayana
BK, Lee BK and Pastan I: Five POTE paralogs and their splice
variants are expressed in human prostate and encode proteins of
different lengths. Gene. 337:45–53. 2004. View Article : Google Scholar : PubMed/NCBI
|
|
55
|
Liu XF, Bera TK, Liu LJ and Pastan I: A
primate-specific POTE-actin fusion protein plays a role in
apoptosis. Apoptosis. 14:1237–1244. 2009. View Article : Google Scholar : PubMed/NCBI
|
|
56
|
Bera TK, Saint Fleur A, Ha D, Yamada M,
Lee Y, Lee B, Hahn Y, Kaufman DS, Pera M and Pastan I: Selective
POTE paralogs on chromosome 2 are expressed in human embryonic stem
cells. Stem Cells Dev. 17:325–332. 2008. View Article : Google Scholar : PubMed/NCBI
|