Introduction
The main cause of chemotherapeutic failure is drug
resistance in solid tumors. In many cases, resistance to
chemotherapy already exists before drug treatment (intrinsic
resistance), which usually further develops into broad spectrum
resistance (acquired resistance) following treatments.
Chemotherapeutic resistance can be induced through various
mechanisms, e.g., metabolic inactivation and efflux of drugs;
however, recent studies have reported that the tumor
microenvironment is an additional cause of drug resistance
(1,2). All efforts to overcome chemoresistance
have not been successful thus far, owing not only to the complex
biology of cancer cells but also to the use of inappropriate models
that do not exhibit the type of drug resistance encountered in
patients.
For a long time, most studies have relied on two
dimensional (2D)-culture models. Although 2D cultures have yielded
significant insights into the study of drug resistance as well as
cancer biology, they are critically limited by clinical
irrelevance. Drug resistance studies using 2D cultures focus on
changes at the single cell level such as mutations in genes that
regulate cellular processes related to proliferation and/or
apoptosis and modified accumulation and metabolism of drugs
(3,4). However, substantial evidence has
accumulated that the tumor microenvironment should also be
considered, as it is definitely involved in the resistance of solid
tumors to chemotherapy. Actually, the translation of research
outcomes from in vitro 2D-based culture models has shown a
poor success rate of <5% (5,6). In
vivo, cancer cells grow together to form lump-like structures
and are surrounded by extracellular matrix (ECM) and
microenvironmental stromal cells. In three dimensional (3D)
architecture, tumor cells interact with adjacent cells and ECM
which can alter their behavior. The interaction between tumor cells
and the microenvironment plays a significant role in anticancer
drug resistance (7,8). The conventional 2D culture models may
not be suitable for representing the in vivo
microenvironment such as cell-cell interactions, cell-ECM
interactions, non-uniform distribution of oxygen and nutrients as
well as other physical and chemical stresses, resulting in
so-called multicellular resistance (MCR). Three-dimensional models
in vitro such as multicellular spheroids (MCSs) and
histocultures have been used successfully to elucidate tumor growth
kinetics as well as the mechanisms involved in the resistance of
tumor cells to anticancer drugs, cytokines and radiation. The
significance of 3D models in the study of tumor biology and
oncopharmacology has recently been emphasized, hence they have been
exploited in new anti-cancer drug discovery (9,10).
In recent years, 3D culture models of several cancer
types have been vigorously utilized in studies of anticancer drugs.
It has been reported that the molecular features of 3D culture
models of ovarian and endometrial cancers showed a higher level of
similarity to in vivo primary tumors in terms of response
and resistance to anticancer drugs than 2D monolayer cultures
(11,12). Pancreatic tumor 3D spheroids also
showed higher matrix-rich chemoresistance phenotypes compared to 2D
monolayers (13,14) and a higher expression of the
membrane protein, Cav-1, causing radio-resistance (15). The reduced sensitivity to anticancer
drugs in 3D spheroid cultures of lung cancer has been attributed to
a significant decrease in apoptotic signals after drug exposure was
decreased (16,17).
Colorectal cancer is one of the most common tumors
worldwide. 5-Fluorouracil (5-FU) is a widely used agent for
colorectal cancers, particularly metastatic colorectal cancer
(mCRC) (18,19). Despite the increase in the
understanding of the mechanisms of 5-FU, the resistance to 5-FU
remains a significant limitation to the treatment of patients
(20,21). Our rationale for the present study
was that intrinsic drug resistance is more clinically relevant, and
the 3D structure is the most suitable model for simulating drug
resistance in vivo. Hence, we evaluated the differential
expression of proteins presumably associated with 5-FU resistance
and investigated novel potential biomarkers in 3D cultures of human
colorectal cancer cells.
Materials and methods
Chemicals and reagents
5-Fluorouracil (5-FU) and cell culture reagents were
purchased from Sigma-Aldrich and Gibco BRL, respectively.
Antibodies were purchased from Santa Cruz Biotechnology (p53, PLD,
EGFR, caspase-3, ERK, p-Akt and HSP70), Zymed Laboratories
Inc. (E-cadherin, PTEN and p27kip1) and Cell Signaling
Technology (p-mTOR).
Cell culture
All the cancer cell lines utilized were obtained
from the Korea Cell Line Bank (Seoul, Korea). Monolayer cultures
were maintained in RPMI-1640. All cell lines were grown under 5%
CO2 at 37°C in a humidified atmosphere.
Formation of spheroids
Multicellular spheroids (MCSs) were cultured using a
liquid overlay technique as described previously (14) with some modification. The morphology
and structure of spheroids were evaluated by scanning electron
microscopy (SEM, Model JSM-5410 LV, Jeol, Japan) and transmission
electron microscopy (TEM, Model 1010, Jeol). Paraffin-embedded
sections (5 μm) were also prepared and stained with H&E to
examine 3D heterogeneity within the spheroids.
Cytotoxicity assay
Cell viability was assessed by MTS. For monolayers,
cells were plated into 96-well plates at 1,500 cells/well followed
by drug exposure for 96 h. For spheroids, 7 day-grown spheroids
were transferred to non-coated 96-well plates and then 100 μl of
fresh media was added to each well. Spheroids were treated with
various concentrations of 5-FU for 96 h. The IC50 value
was determined as the drug concentration required to reduce the
absorbance value to 50% as compared to the control by fitting the
data to a classic sigmoid Emax model using
SigmaPlot.
Cell cycle analysis and apoptosis
Cells were stained using PI and subjected to FACS
analysis (FACSVantage™, Becton-Dickinson Immunocytometry Systems,
San Jose, CA). For simultaneous determination of cell cycle phase
and percentage of apoptosis, experiments were carried out according
to the User’s Manual included in the Apo-Direct™ kit (BD
Pharmingen). For each sample, 10,000 events were recorded.
Western blot analysis and 2-DE &
MALDI-TOF analysis
Proteins (50 μg) were electrophoresed on 8–14% SDS
gels for western blot analysis. The blots were obtained and
visualized using specific antibodies (as listed in Chemicals and
reagents) for each protein of interest and HRP-conjugated secondary
antibodies followed by enhanced chemiluminescence detection
(Amersham Pharmacia Biotech, UK). For 2-DE, 200 μg of proteins was
electrophoresed. Quantitative analysis of digitized images was
carried out using PDQuest software (version 7.0, Bio-Rad). Protein
spots were selected for significant expression variation when they
deviated >2-fold in their expression level compared with the
control or normal sample. Protein analysis was performed using an
Ettan MALDI-ToF (Amersham Biosciences). ProFound, developed by The
Rockefeller University, was used for protein identification.
Results
Characteristics of the DLD-1 MCS
model
Firstly, we evaluated a three dimensional
multicellular spheroid (3D MCS) culture of various human cancer
cell lines including DLD-1, and their characteristics in regards to
aggregation and compact conditions are summarized in Table I. DLD-1 cells along with SNU-484,
PCI-1 and A432 formed MCSs with a fully compact structure. Among
the fully compact MCSs, DLD-1, a human colon carcinoma cell line,
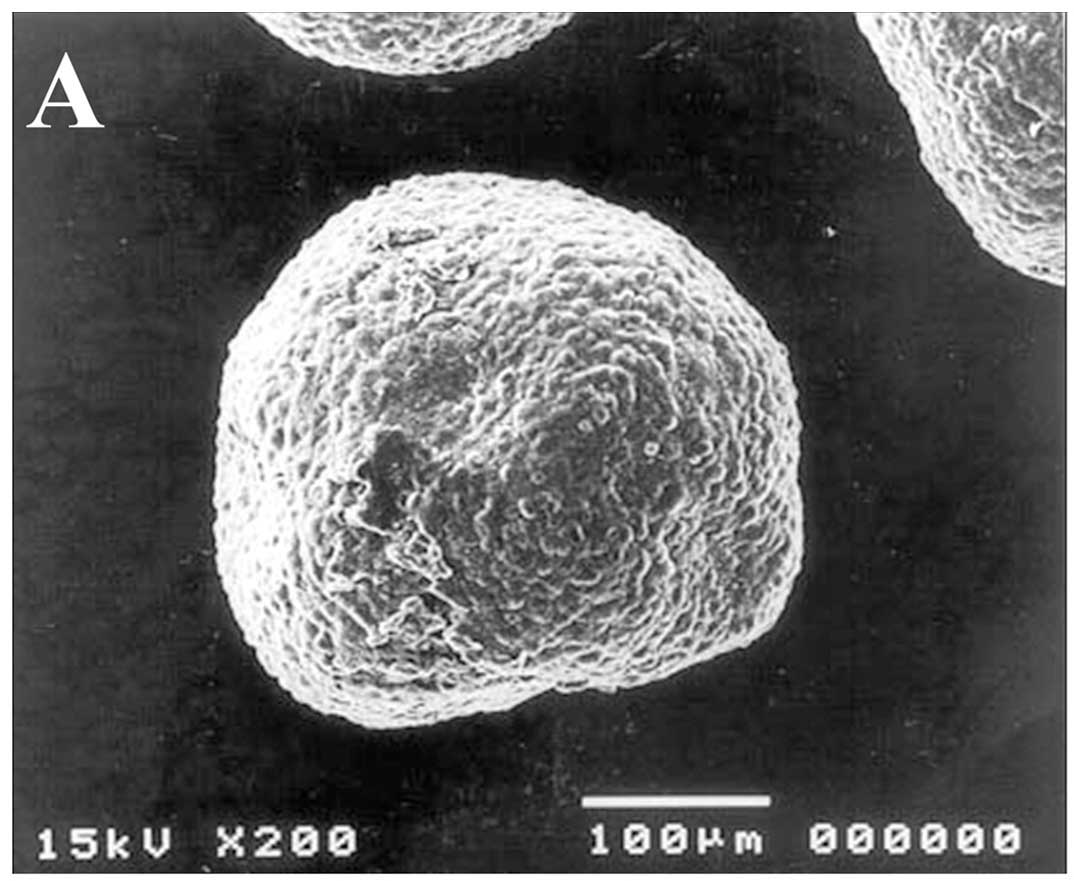
was selected for further study. Representative images of
morphologic and microstructure characteristics of the DLD-1
spheroids are shown in Fig. 1.
DLD-1 MCSs showed a compact structure as shown by the smooth
surface of the MCSs resulting from tight interactions between the
cells. After 7 days of culture, DLD-1 MCSs reached ~580 μm in
diameter, which was quite large in size, but neither necrotic nor
apoptotic cells were found within the spheroids. Adhesion
structures such as desmosomes were observed in the TEM images
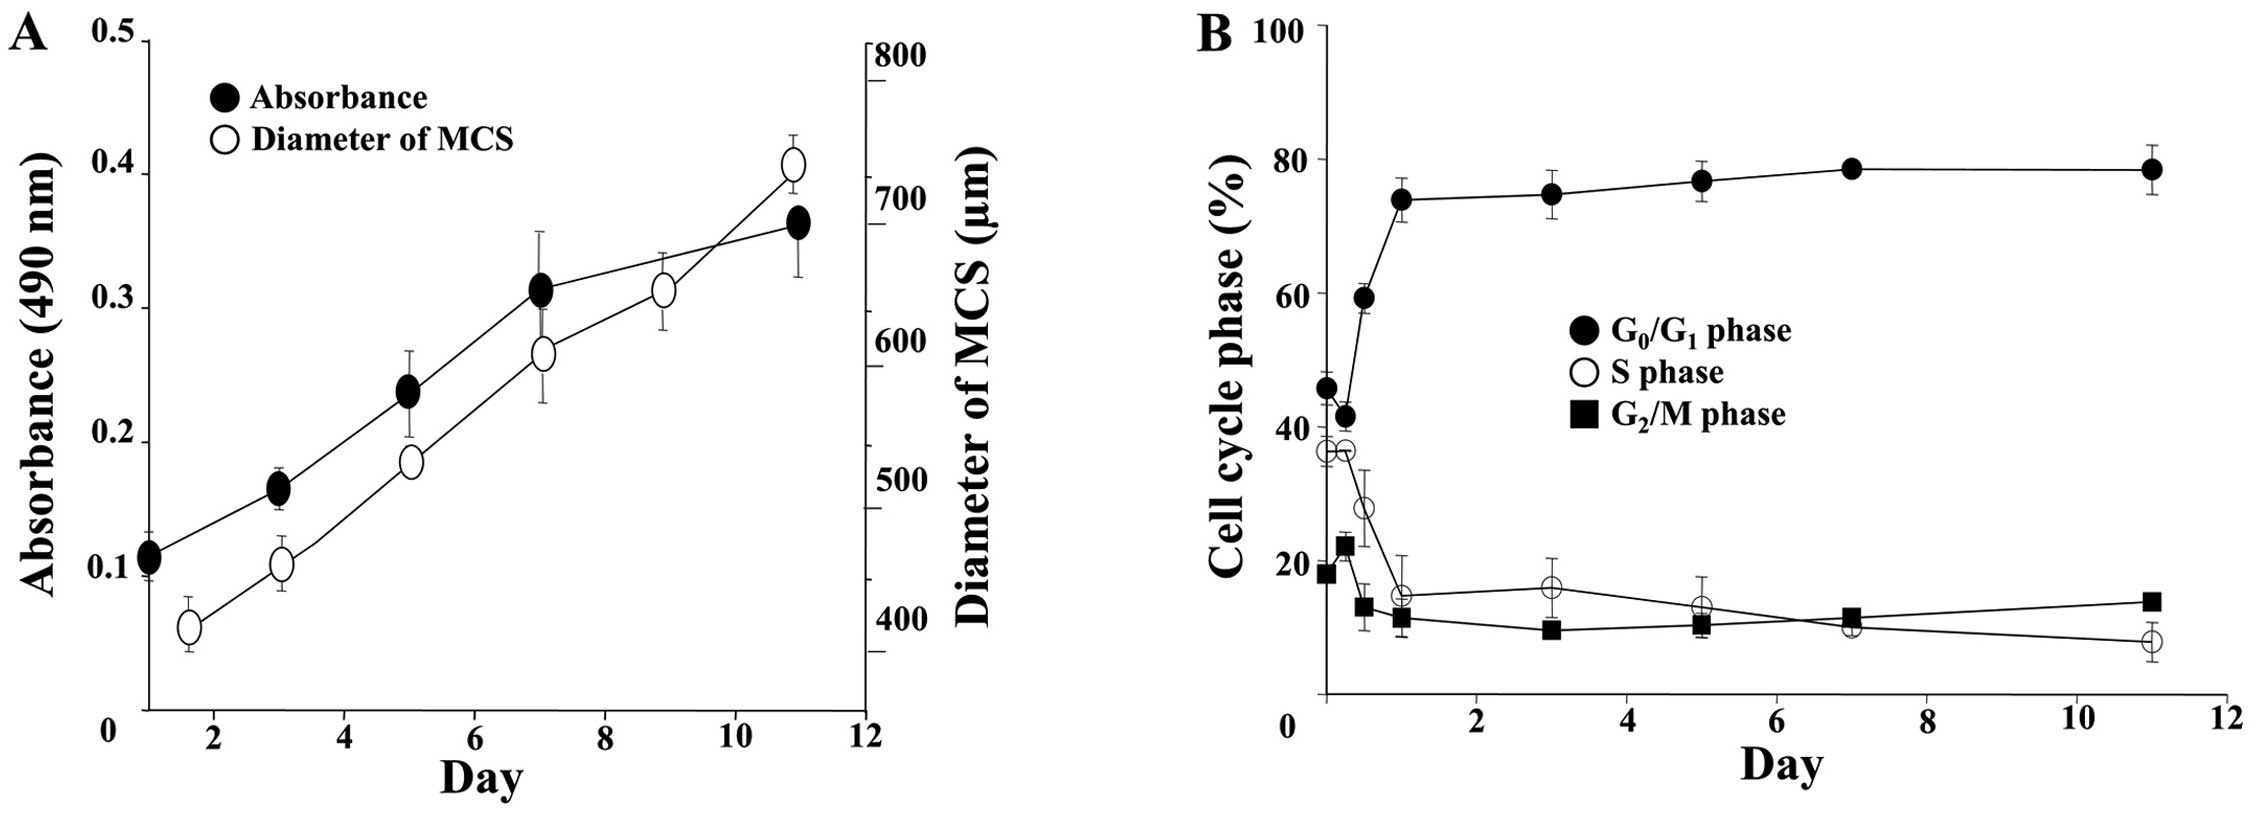
(Fig. 1D). The growth of the DLD-1
MCSs was examined by measuring size and by MTS assay (Fig. 2A). The spheroids showed a steady
growth profile for up to 11 days, reaching 700 μm in diameter. An
increase in OD for the MTS with time was parallel to that of the
size increase, indicating that the viability of cells within the
MCSs was sustained, although a subtle decrease was noticeable after
7 days. Cell cycle changes along with spheroid formation were
analyzed as shown in Fig. 2B. A
significant increase in the percentage of cell in the
G0/G1 phase and a concomitant decrease in the
percentage of cells in the S and G2/M phase were
observed in cells grown as MCSs. It is noted that the change in
cell cycle distribution was induced as early as 24 h and no further
changes were noted afterwards.
 | Table IFormation of MCSs using several
cancer cell lines. |
Table I
Formation of MCSs using several
cancer cell lines.
| Cell lines | Degree of
aggregation |
|---|
|
|---|
| Origin | Name |
|---|
| Lung | A549 |
Acluster |
| PC14 |
Aloose |
| Breast | MCF-7 |
Spartly |
| Vulva | A431 |
Sfull |
| Head and neck | PCI-1 |
Sfull |
| PCI-13 |
Spartly |
| PCI-50 |
Spartly |
| Colon | DLD-1 |
Sfull |
| Gastric | SNU-484 |
Sfull |
| SNU-216 |
Aloose |
| SNU-601 |
Aloose |
| AGS |
Aloose |
Effect of 5-FU on DLD-1 cells grown as
monolayers and MCSs
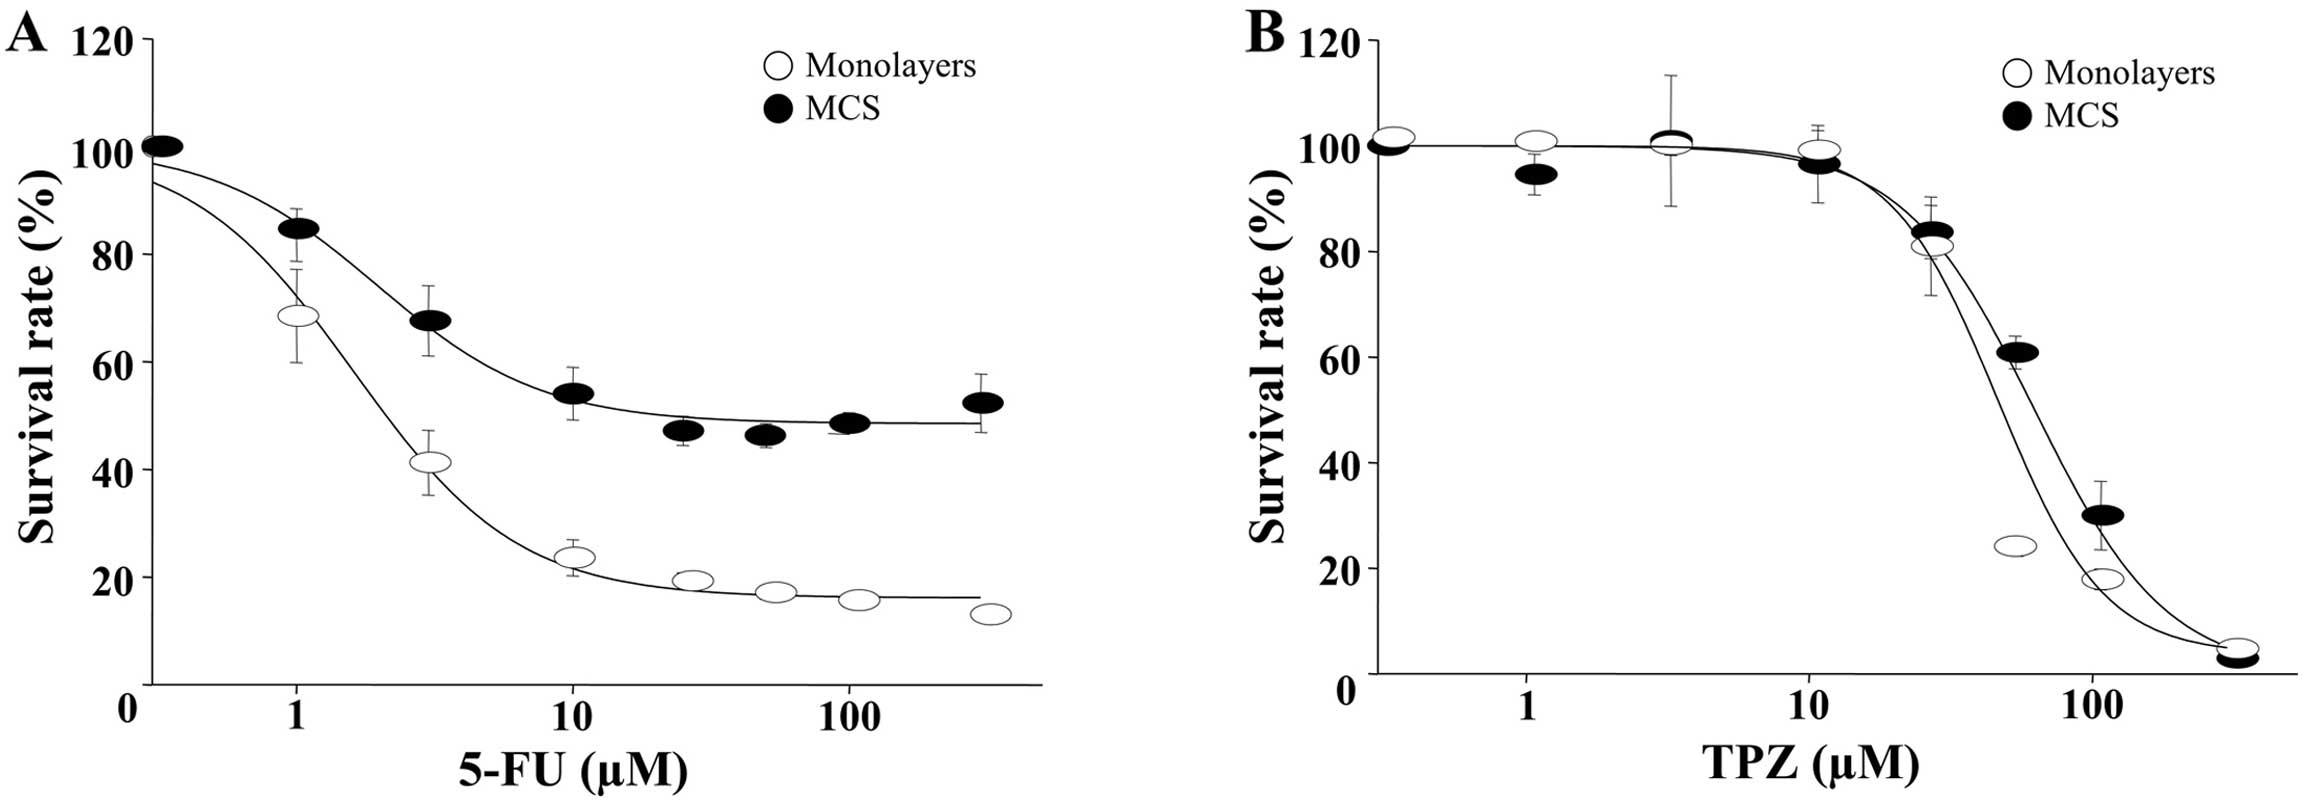
The growth inhibitory effects of 5-FU were evaluated
against various human colon cancer cell lines, DLD-1, HT-29, SW480,
HCT-15, KM1214 and KM12C. The IC50 value after 96 h of
continuous exposure to 5-FU showed a range of 2.6–9.3 μM (data not
shown), where DLD-1 showed the greatest sensitivity as indicated by
an IC50/96 h of 2.1 μM (Fig.
3A). As expected, MCSs showed a reduced sensitivity toward 5-FU
and the IC50 increased by 10-fold when compared to the
monolayers, i.e. an IC50/96 h/MCS of 21.6 μM vs.
IC50/96 h/monolayers of 2.1 μM (Fig. 3A). In contrast, the growth
inhibition induced by tirapazamine (TPZ, a hypotoxin) appeared
similar between the monolayers and the MCSs. TPZ is a cytotoxic
anticancer drug that is activated to a toxic radical only at very
low levels of oxygen (hypoxia) (22). TPZ was used as a reference drug to
indirectly assess the microenvironmental oxygen conditions, which
can offset 3D drug resistance in MCSs, i.e., for TPZ the
IC50/96 h/MCS was 62.6 vs. 48.0 μM for IC50/96
h/monolayers (Fig. 3B). The
DLD-1 cells were grown in monolayers or MCSs and exposed to 10 μM
of 5-FU for 24 and 72 h. When the monolayer cells were treated, the
percentage of cells in the S phase was markedly increased. In MCSs,
the percentage of cells in the S phase was slightly reduced and the
cell cycle profile was similarly maintained for 72 h post-treatment
(Fig. 3C). In contrast, there was
no evidence of a hypodiploid DNA peak in both cultures exposed to
10 μM of 5-FU for 72 h. Similar results were also obtained with the
TUNEL assay. Even though a slight increase in TUNEL-positive
apoptotic cells was shown in the MCSs at 72 h (5.7%), only a
minimal induction of apoptosis was noted in both cultures.
Comparison of protein expression
following 5-FU exposure between monolayers and the MCSs
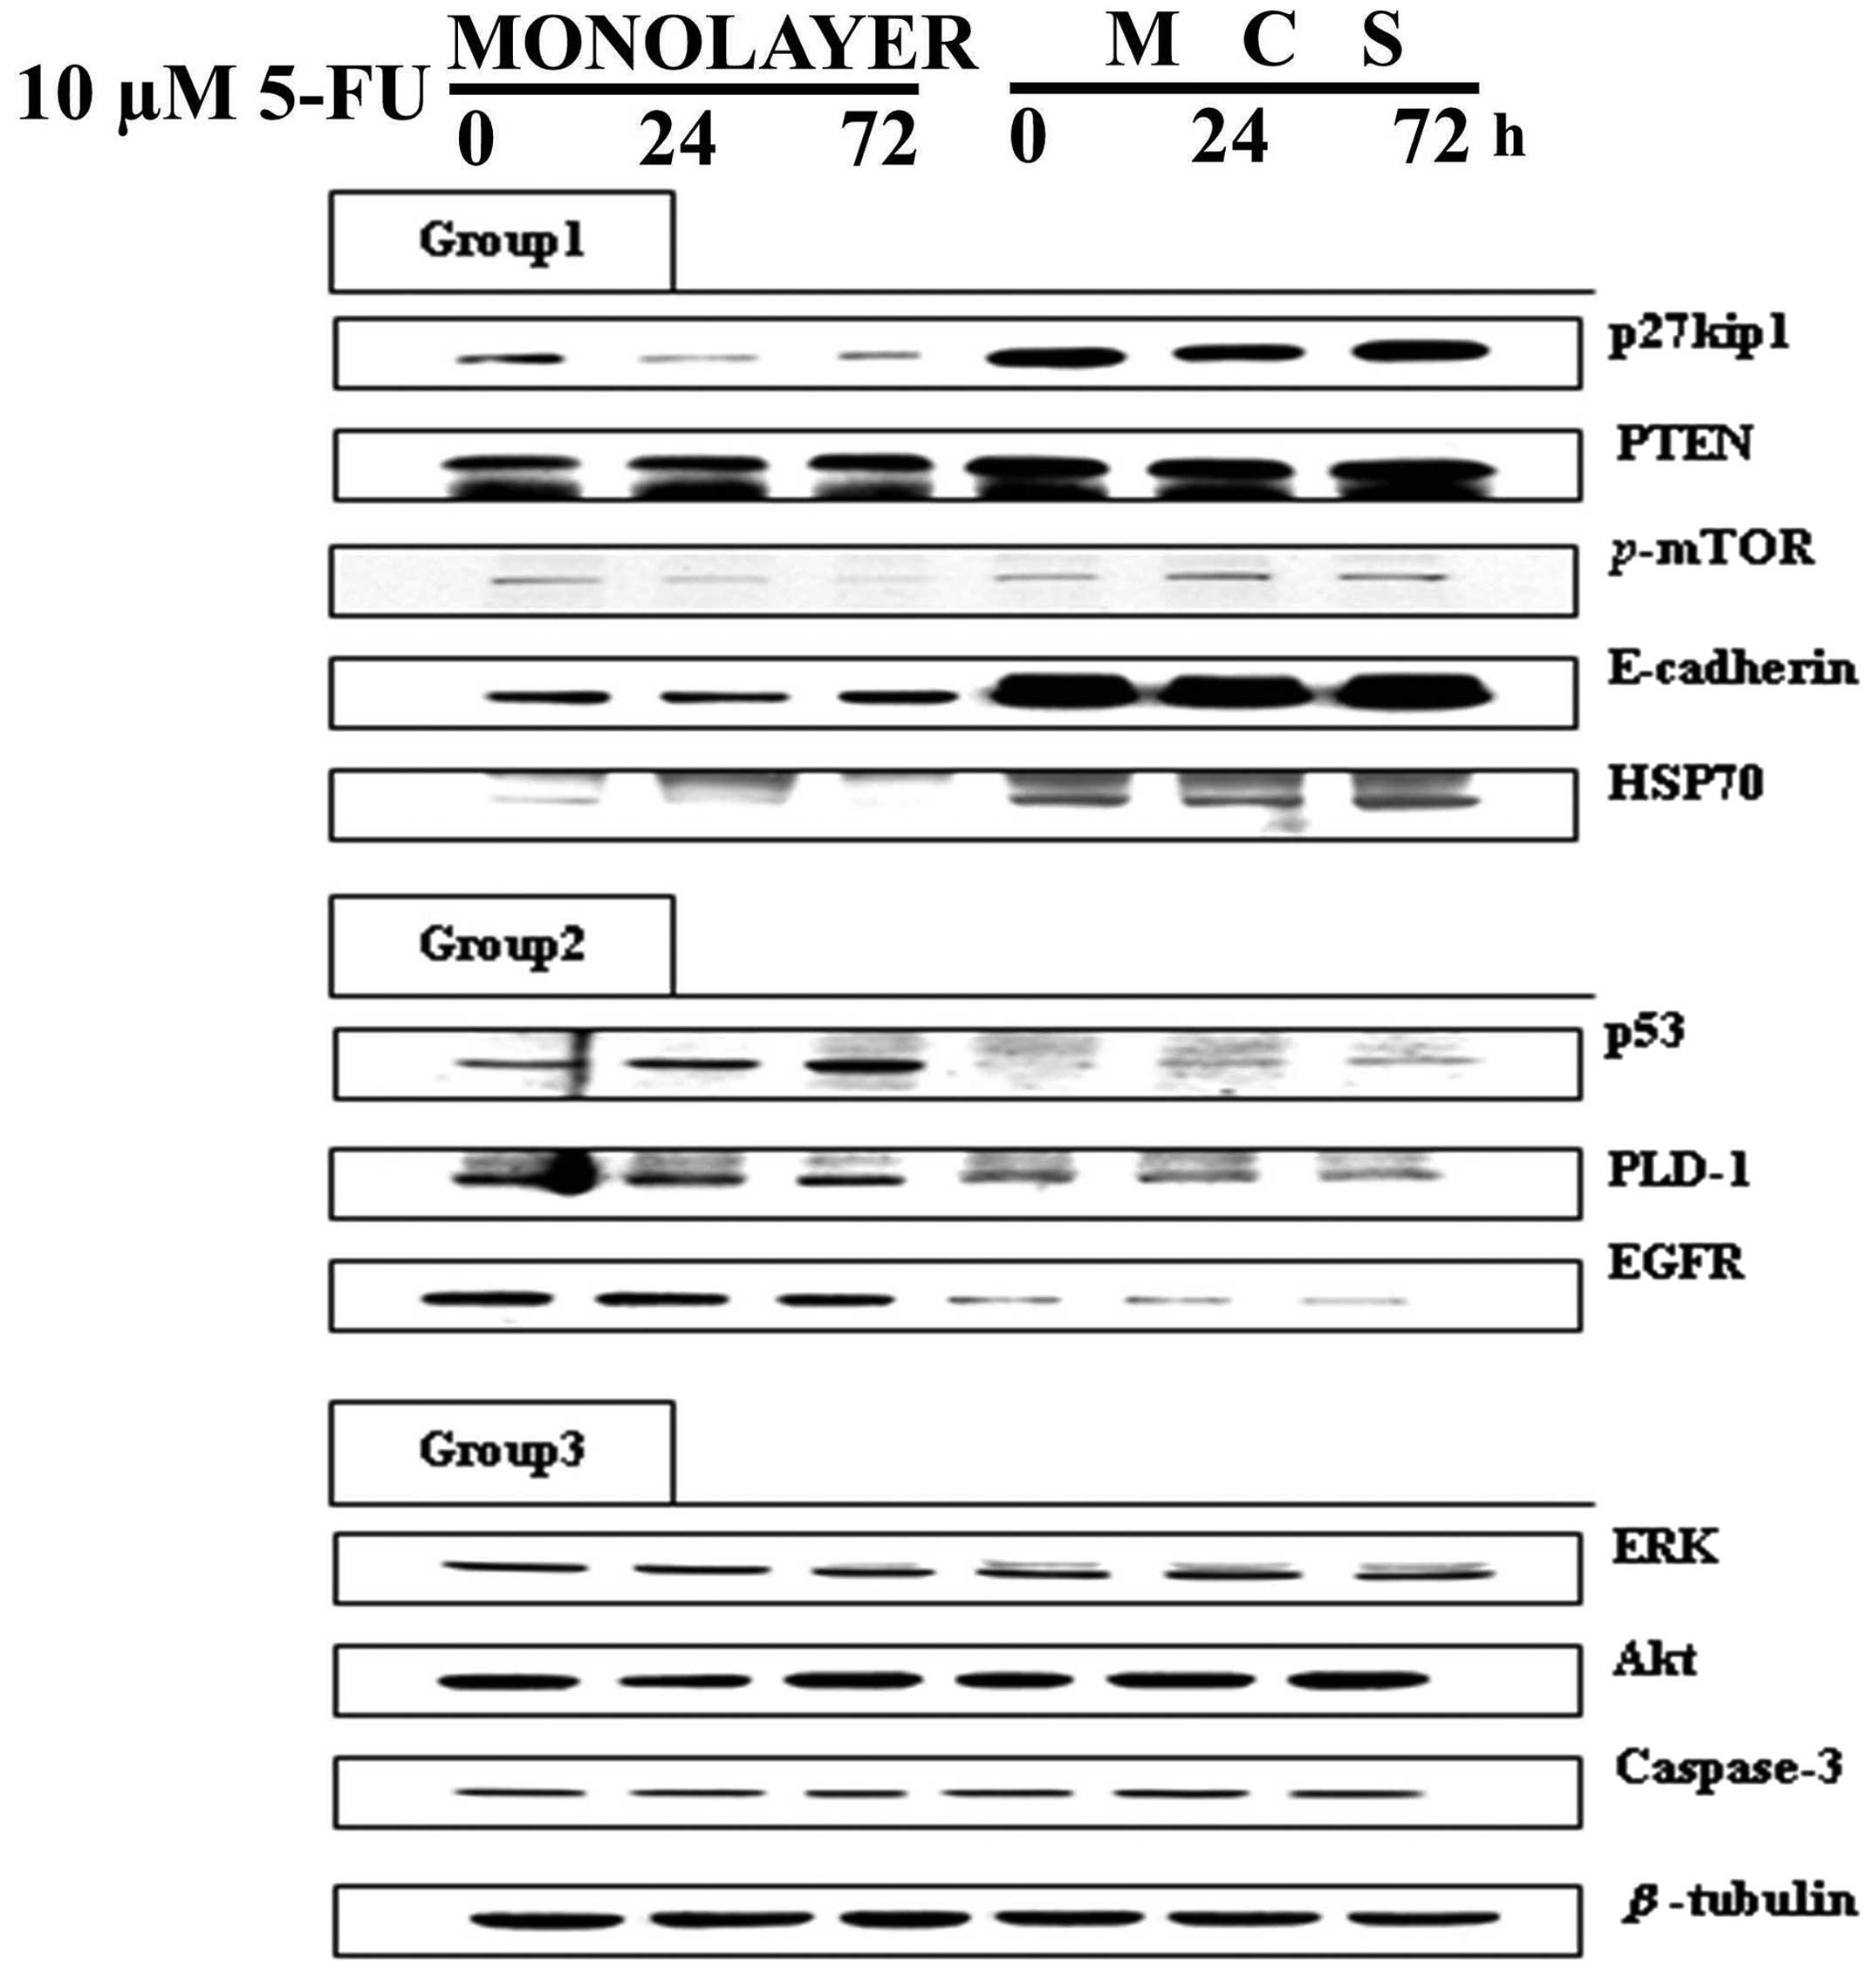
Western blot analysis was performed to determine
whether the 3D conditions in the MCSs induced any changes in the
expression of proteins associated with cell cycle check points and
intracellular signaling for proliferation. The analyzed proteins
were divided into three groups by a change in expression pattern:
one where the basal expression was higher in MCSs, another when it
was higher in monolayers and the other when expression was similar
in both (Fig. 4).
p27kip1, PTEN, p-mTOR, E-cadherin and HSP70
showed a significantly higher basal expression level in MCSs than
in the monolayers (Group 1 in Fig.
4). Among these, p27kip1 and p-mTOR showed
decreased expression upon 5-FU exposure in the monolayers whereas
no change (p27kip1) or even an increase (p-mTOR)
was observed in the MCSs. The other three proteins in Group 1,
PTEN, E-cadherin and HSP70, showed no changes upon drug exposure.
Based on these data, it can be suggested that 5-FU resistance in
MCSs can be attributed to increased expression of
p27kip1 and p-mTOR, which resulted from growth
under 3D conditions and is related with the increased expression of
PTEN, E-cadherin and HSP70. On the other hand, the basal expression
levels of p53, PLD-1 and EGFR were higher in the monolayers than
levels in the MCSs, which were assigned in Group 2 (Group 2 in
Fig. 4). The expression level of
p53 showed a time-dependent increase in both the monolayers and
MCSs upon 5-FU treatment. The other two proteins, PLD-1 and EGFR,
did not show any change. Regardless of the unchanged level of
expression upon 5-FU treatment, the significantly lower level of
p53, PLD-1 and EGFR in MCSs suggested their association with 3D
drug resistance. The remaining proteins, including ERK, Akt and
caspase-3, showed a similar level in the monolayers and MCSs and no
changes upon 5-FU treatment (Group 3 in Fig. 4).
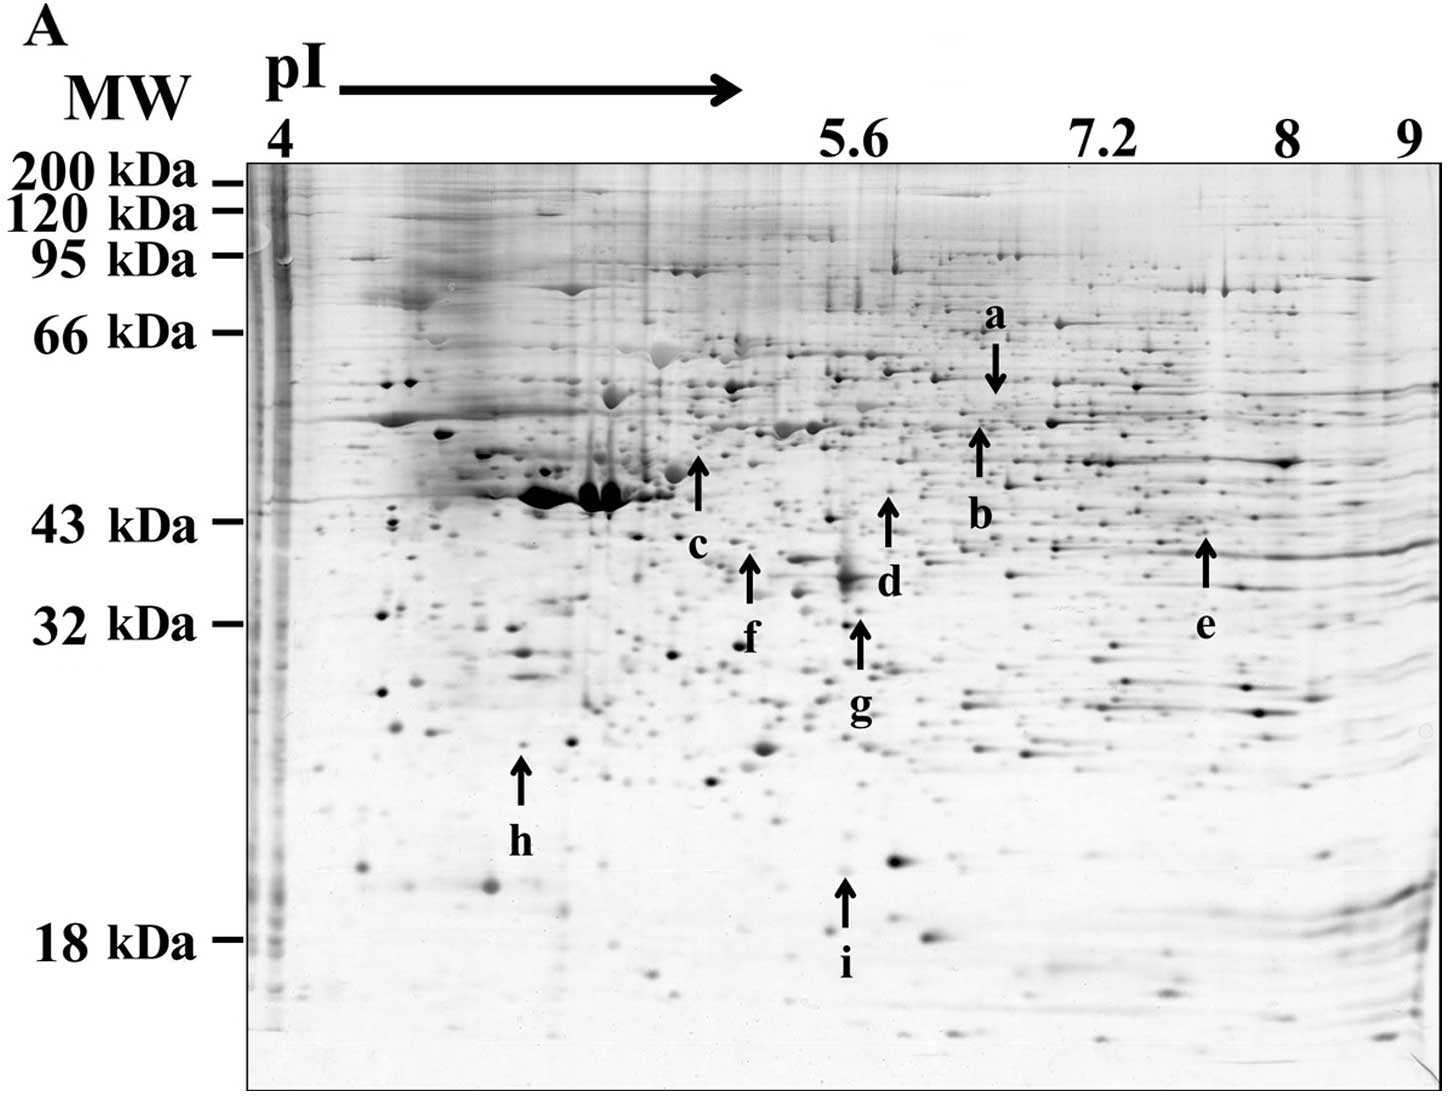
2D gel mapping and mass spectrometry for
novel biomarkers of 5-FU resistance
In order to identify novel protein markers for 5-FU
resistance, we carried out (2-DE) MALDI-TOF. Nine protein spots (a
through i) were selected based on differential expression profiles
between the monolayers and MCSs (Fig.
5A), and are listed in Table
II. Collapsin response mediator protein 2 (CRMP-2) (spot a in
Fig. 5 and Table II) and DNA replication complex GINS
protein PSF2 (spot h) were grouped into the first group, which
showed a higher expression in the monolayers than the MCSs and a
decreased level upon 5-FU (Group I). The other proteins (Group II)
showed higher expression in the MCSs than in the monolayers, with
accompanying changes upon 5-FU treatment and included selenium
binding protein-1 (SBP-1) (spot b), keratin 20 (spot c), β-succinyl
CoA synthetase (spot d), sialic acid synthase (spot e), Annexin A4
(spot f) and dimethylarginine dimethylaminohydrolase 1 (DDAH1)
(spot g). Among Group II, SBP-1 appeared to be downregulated by
5-FU exposure in both cultures. On the other hand, keratin 20,
β-succinyl CoA synthetase, DDAH1 and Annexin A4 were upregulated
after 5-FU treatment in the monolayers only.
| Table IIThe 9 proteins identified by
MALDI-TOF analysis following 2-DE. |
Table II
The 9 proteins identified by
MALDI-TOF analysis following 2-DE.
| | Parameters | MALDI-TOF |
|---|
| |
|
|---|
| ID | Protein | MW (kDa) | Coverage (%) |
|---|
| Group I |
| a | Collapsin response
mediator protein 2 | 62.73 | 23 |
| h | DNA replication
complex GINS protein PSF2 | 21.47 | 20 |
| Group II |
| b | Selenium-binding
protein 1 | 52.94 | 38 |
| c | K eratin 20 | 48.53 | 35 |
| d | β-succynyl CoA
synthetase | 43.93 | 34 |
| e | Sialic acid
synthase | 40.75 | 23 |
| f | Annexin A4 | 36.09 | 39 |
| g | Dimethylarginine
dimethylaminohydrolase 1 | 31.45 | 29 |
| i | Immunoglobulin
heavy chain VHDJ region | 13.03 | 34 |
Discussion
The detailed morphological structure of DLD-1
spheroids, observed using SEM and semi-thin sections after 7 days
of culture, clearly showed a tight compaction and a close
interaction among tumor cells. Neither necrotic areas nor signs of
nuclear damage throughout spheroids were observed (Fig. 1), indicating that for DLD-1 cells,
the MCS model was an appropriate 3D cell culture model to study
drug resistance. The changes in cell cycle distribution of the
growing DLD-1 MCSs were dramatic within 12 h after seeding, showing
G1 cell cycle arrest with a significant decrease in the percentage
of S and G2/M phase cells. Despite the slow growth
expected from this cell cycle arrest, the diameters of spheroids
gradually increased from 350 μm at 24 h up to ~700 μm at 11 days
(Fig. 2). It is well known that
cell cycle arrest in the inner regions of 3D spheroids is induced
in response to microenvironmental stresses and is closely related
to the p53 signaling network. Since the upregulation of p53 was not
observed in the DLD-1 MCSs, these quiescent (Q) cells could
possibly be due to marked cell contact-dependent upregulation of
cyclin-dependent kinase inhibitors such as p27kip1
(Fig. 4). These Q cells are
expected to be viable yet insensitive to chemotherapeutic drugs
(23,24) as demonstrated in our study (Fig. 3C).
Our results indicated that DLD-1 was much more
resistant to 5-FU in MCSs compared to the monolayers; the
differential sensitivity to 5-FU was shown by a significantly
(10-fold) higher IC50/96 h (21.6 vs. 2.1 μM in MCSs vs.
monolayers, respectively Fig. 3A)
and the absence of S phase arrest after 5-FU treatment in the MCSs
(Fig. 3C). Hence, it may be caused
by certain specific changes induced in a cellular signaling pathway
related to drug response. This prompted us to investigate changes
in major proteins involved in drug-induced cytotoxicity as well as
the differential expression between the two culture models for
novel biomarkers for 5-FU resistance in the MCS model.
The analyzed 11 proteins by western blot analyses
were divided into three groups (Fig.
4). Proteins in Group 1 (p27kip1, PTEN,
p-mTOR, E-cadherin, HSP-70) showed a higher level of
expression in the MCSs, yet no changes were detected upon 5-FU
exposure except a weak increase in p-mTOR expression in the
MCSs (Fig. 4). Reports have
discussed the association of E-cadherin and p27kip1 with
3D chemoresistance to cisplatin, fluorouracil and adriamycin in
breast cancer cell lines, and an anti-E-cadherin neutralizing
antibody was shown to successfully decrease p27kip1
expression resulting in restoration of chemosensitivity in 3D
(25). Although upregulation of
p27kip1 is often induced by p53, our results showed
suppressed expression of p53 in the DLD-1 3D cultures, suggesting
that the increased p27kip1 in MCSs may be associated
with a p73-related pathway rather than a p53-related pathway
(26). Our data also suggest that
resistance to 5-FU in MCSs can be attributed to the increased
expression of PTEN and p-mTOR (Fig. 4). PTEN is known to be involved in
the regulation of Akt activity, leading to broad-spectrum
chemoresistance (27,28). The level of p-mTOR decreased
after 5-FU exposure in the monolayers, probably in response to
reduced proliferative activity of the cells. In contrast, its level
increased in the MCSs. Although this response was weak, it still
suggests that p-mTOR may be a novel biomarker for 5-FU
resistance in 3D conditions (29).
Proteins in Group 2 (p53, PLD-1 and EGFR) showed a
higher level of expression in the 2D cultures than the 3D cultures.
In this group, only p53 showed a weak increase upon 5-FU exposure
(Fig. 4). The role of p53 is to
induce damage repair or apoptosis upon exposure to genotoxic agents
such as 5-FU (30); hence, the
decreased sensitivity (avoidance of drug-induced apoptosis) may be
associated with the lower level of p53 in the DLD-1 MCS model
observed in this study (Fig. 5).
Reports have recently discussed the roles of EGFR and its
downstream effector, PLD1, in tumor survival, both of which showed
decreased levels of expression in MCSs (Fig. 4). With this suppressed signaling via
EGFR and PLD-1, cells may not have sufficient levels of
proliferative activity, by which cells may show resistance to cell
cycle-specific drugs such as 5-FU (31,32).
Using (2-DE) MALDI-TOF, we identified 9 important
proteins: collapsin response mediator protein 2 (CRMP-2), DNA
replication complex GINS protein PSF2 (PSF2) and selenium binding
protein 1 (SBP1). In our study, CRMP-2 and PSF2 showed decreased
expression after 5-FU treatment in both cultures, and the relative
level of expression was lower in the MCSs than in the monolayers.
These two proteins have recently been reported to have oncogenic
properties. CRMP-2 is known to mediate microtubule polymerization.
Recently, phosphorylated CRMP-2 has been suggested as a candidate
therapeutic target for NSCLC based on a correlation between a high
level of nuclear phosphorylated CRMP-2 and poor prognosis (33). PSF2 is a member of the GINS complex.
In cancer cells, PSF2 is frequently upregulated, but the
elimination of PSF2 provokes chromosome missegregation (34,35).
Although it has not been determined whether these two proteins are
associated with the mechanism of action of 5-FU, decreased
expression after 5-FU exposure in both cultures may suggest their
involvement in the antiproliferative activity of 5-FU in cancer
cells. In addition, the relatively low expression in MCSs warrants
further study regarding its role as a 5-FU resistance
biomarker.
SBP-1 showed a significant decrease after 5-FU
treatment (Fig. 5). SBP-1 is a
cytoplasmic selenium binding protein that is abundantly expressed
in most normal tissues. Several recent studies have reported that
the expression level of SBP-1 is markedly reduced in many cancer
tissues, including colorectal, breast and gastric, when compared to
their normal counterparts, suggesting its role as a tumor
suppressor (36,37). Its low expression has even been
suggested as a survival predictor in stage III colorectal cancer
patients (38). Although it is not
clear whether SBP-1 is associated with resistance to 5-FU, its
decreased expression after 5-FU treatment in both cultures and its
significantly higher level of expression in MCSs may support its
potential role as a 5-FU resistance biomarker and is thus worthy of
further study.
In the present study, we demonstrated greater 5-FU
resistance in human colorectal DLD-1 cells grown as MCSs compared
to monolayers, and showed that cell cycle deregulation accompanied
by the altered expression of several signaling molecules may be
related to 5-FU resistance in a 3D MCS model of colorectal cancer.
In addition, our data suggest p-mTOR as a candidate factor
and CRMP-2, PSF2 and SBP-1 as potential biomarkers of 5-FU
chemosensitivity/resistance in a 3D model of colorectal cancer,
which warrants further study.
Acknowledgements
The present study was supported by the National
Research Foundation of Korea (NRF) grant funded by MEST (nos.
2012R1A2A2A01003361 and 2012R1A5A2047939).
References
|
1
|
Gottesman MM: Mechanisms of cancer drug
resistance. Annu Rev Med. 53:615–627. 2002. View Article : Google Scholar : PubMed/NCBI
|
|
2
|
Jorfi S and Inal JM: The role of
microvesicles in cancer progression and drug resistance. Biochem
Soc Trans. 41:293–298. 2013. View Article : Google Scholar : PubMed/NCBI
|
|
3
|
Nyga A, Cheema U and Loizidou M: 3D tumour
models: novel in vitro approaches to cancer studies. J Cell Commun
Signal. 5:239–248. 2011. View Article : Google Scholar : PubMed/NCBI
|
|
4
|
Fridman WH, Dieu-Nosjean MC, Pages F,
Cremer I, Damotte D, Sautes-Fridman C and Galon J: The immune
microenvironment of human tumors: general significance and clinical
impact. Cancer Microenviron. 6:117–122. 2013. View Article : Google Scholar : PubMed/NCBI
|
|
5
|
Fennema E, Rivron N, Rouwkema J, van
Blitterswijk C and de Boer J: Spheroid culture as a tool for
creating 3D complex tissues. Trends Biotechnol. 31:108–115. 2013.
View Article : Google Scholar : PubMed/NCBI
|
|
6
|
McMillin DW, Negri JM and Mitsiades CS:
The role of tumour-stromal interactions in modifying drug response:
challenges and opportunities. Nat Rev Drug Discov. 12:217–228.
2013. View
Article : Google Scholar : PubMed/NCBI
|
|
7
|
Morin PJ: Drug resistance and the
microenvironment: nature and nurture. Drug Resist Updat. 6:169–172.
2003. View Article : Google Scholar : PubMed/NCBI
|
|
8
|
Wartenberg M, Gronczynska S, Bekhite MM,
Saric T, Niedermeier W, Hescheler J and Sauer H: Regulation of the
multidrug resistance transporter P-glycoprotein in multicellular
prostate tumor spheroids by hyperthermia and reactive oxygen
species. Int J Cancer. 113:229–240. 2005. View Article : Google Scholar : PubMed/NCBI
|
|
9
|
Yamada KM and Cukierman E: Modeling tissue
morphogenesis and cancer in 3D. Cell. 130:601–610. 2007. View Article : Google Scholar : PubMed/NCBI
|
|
10
|
Horning JL, Sahoo SK, Vijayaraghavalu S,
Dimitrijevic S, Vasir JK, Jain TK, Panda AK and Labhasetwar V: 3-D
tumor model for in vitro evaluation of anticancer drugs. Mol Pharm.
5:849–862. 2008. View Article : Google Scholar : PubMed/NCBI
|
|
11
|
Chitcholtan K, Sykes PH and Evans JJ: The
resistance of intracellular mediators to doxorubicin and cisplatin
are distinct in 3D and 2D endometrial cancer. J Transl Med.
10:382012. View Article : Google Scholar : PubMed/NCBI
|
|
12
|
Lee JM, Mhawech-Fauceglia P, Lee N,
Parsanian LC, Lin YG, Gayther SA and Lawrenson K: A
three-dimensional microenvironment alters protein expression and
chemosensitivity of epithelial ovarian cancer cells in vitro. Lab
Invest. 93:528–542. 2013. View Article : Google Scholar : PubMed/NCBI
|
|
13
|
Longati P, Jia X, Eimer J, Wagman A, Witt
MR, Rehnmark S, Verbeke C, Toftgard R, Lohr M and Heuchel RL: 3D
pancreatic carcinoma spheroids induce a matrix-rich, chemoresistant
phenotype offering a better model for drug testing. BMC Cancer.
13:952013. View Article : Google Scholar : PubMed/NCBI
|
|
14
|
Yeon SE, No da Y, Lee SH, Nam SW, Oh IH,
Lee J and Kuh HJ: Application of concave microwells to pancreatic
tumor spheroids enabling anticancer drug evaluation in a clinically
relevant drug resistance model. PLoS One. 8:e733452013. View Article : Google Scholar : PubMed/NCBI
|
|
15
|
Hehlgans S, Eke I, Storch K, Haase M,
Baretton GB and Cordes N: Caveolin-1 mediated radioresistance of 3D
grown pancreatic cancer cells. Radiother Oncol. 92:362–370. 2009.
View Article : Google Scholar : PubMed/NCBI
|
|
16
|
Nirmalanandhan VS, Duren A, Hendricks P,
Vielhauer G and Sittampalam GS: Activity of anticancer agents in a
three-dimensional cell culture model. Assay Drug Dev Technol.
8:581–590. 2010. View Article : Google Scholar : PubMed/NCBI
|
|
17
|
Godugu C, Patel AR, Desai U, Andey T, Sams
A and Singh M: AlgiMatrix™ based 3D cell culture system as an
in-vitro tumor model for anticancer studies. PLoS One.
8:e537082013.
|
|
18
|
Lombardi L, Gebbia V, Silvestris N, Testa
A, Colucci G and Maiello E: Adjuvant therapy in colon cancer.
Oncology. 77:50–56. 2009. View Article : Google Scholar
|
|
19
|
Neuman HB, Park J and Weiser MR:
Randomized clinical trials in colon cancer. Surg Oncol Clin N Am.
19:183–204. 2010. View Article : Google Scholar : PubMed/NCBI
|
|
20
|
Kinoshita M, Kodera Y, Hibi K, Nakayama G,
Inoue T, Ohashi N, Ito Y, Koike M, Fujiwara M and Nakao A: Gene
expression profile of 5-fluorouracil metabolic enzymes in primary
colorectal cancer: potential as predictive parameters for response
to fluorouracil-based chemotherapy. Anticancer Res. 27:851–856.
2007.
|
|
21
|
Zhang N, Yin Y, Xu SJ and Chen WS:
5-Fluorouracil: mechanisms of resistance and reversal strategies.
Molecules. 13:1551–1569. 2008. View Article : Google Scholar : PubMed/NCBI
|
|
22
|
Reddy SB and Williamson SK: Tirapazamine:
a novel agent targeting hypoxic tumor cells. Expert Opin Investig
Drugs. 18:77–87. 2009. View Article : Google Scholar : PubMed/NCBI
|
|
23
|
LaRue KE, Khalil M and Freyer JP:
Microenvironmental regulation of proliferation in multicellular
spheroids is mediated through differential expression of
cyclin-dependent kinase inhibitors. Cancer Res. 64:1621–1631. 2004.
View Article : Google Scholar
|
|
24
|
Chari NS, Pinaire NL, Thorpe L, Medeiros
LJ, Routbort MJ and McDonnell TJ: The p53 tumor suppressor network
in cancer and the therapeutic modulation of cell death. Apoptosis.
14:336–347. 2009. View Article : Google Scholar : PubMed/NCBI
|
|
25
|
Nakamura T, Kato Y, Fuji H, Horiuchi T,
Chiba Y and Tanaka K: E-cadherin-dependent intercellular adhesion
enhances chemoresistance. Int J Mol Med. 12:693–700.
2003.PubMed/NCBI
|
|
26
|
Tomasini R, Mak TW and Melino G: The
impact of p53 and p73 on aneuploidy and cancer. Trends Cell Biol.
18:244–252. 2008. View Article : Google Scholar : PubMed/NCBI
|
|
27
|
Hafsi S, Pezzino FM, Candido S, Ligresti
G, Spandidos DA, Soua Z, McCubrey JA, Travali S and Libra M: Gene
alterations in the PI3K/PTEN/AKT pathway as a mechanism of
drug-resistance (Review). Int J Oncol. 40:639–644. 2012.PubMed/NCBI
|
|
28
|
Lee EC, Lee YS, Park NH, So KS, Chun YJ
and Kim MY: Ceramide induces apoptosis and growth arrest of human
glioblastoma cells by inhibiting akt signaling pathways. Biomol
Therap. 19:21–26. 2011. View Article : Google Scholar
|
|
29
|
Burris HA III: Overcoming acquired
resistance to anticancer therapy: focus on the PI3K/AKT/mTOR
pathway. Cancer Chemother Pharmacol. 71:829–842. 2013. View Article : Google Scholar : PubMed/NCBI
|
|
30
|
Lane DP: Cancer. p53, guardian of the
genome. Nature. 358:15–16. 1992. View
Article : Google Scholar : PubMed/NCBI
|
|
31
|
Lee CS, Kim KL, Jang JH, Choi YS, Suh PG
and Ryu SH: The roles of phospholipase D in EGFR signaling. Biochim
Biophys Acta. 1791:862–868. 2009. View Article : Google Scholar : PubMed/NCBI
|
|
32
|
Kang DW, Choi KY and Min do S:
Phospholipase D meets Wnt signaling: a new target for cancer
therapy. Cancer Res. 71:293–297. 2011. View Article : Google Scholar : PubMed/NCBI
|
|
33
|
Oliemuller E, Pelaez R, Garasa S, Pajares
MJ, Agorreta J, Pio R, Montuenga LM, Teijeira A, Llanos S and
Rouzaut A: Phosphorylated tubulin adaptor protein CRMP-2 as
prognostic marker and candidate therapeutic target for NSCLC. Int J
Cancer. 132:1986–1995. 2013. View Article : Google Scholar : PubMed/NCBI
|
|
34
|
Barkley LR, Song IY, Zou Y and Vaziri C:
Reduced expression of GINS complex members induces hallmarks of
pre-malignancy in primary untransformed human cells. Cell Cycle.
8:1577–1588. 2009. View Article : Google Scholar : PubMed/NCBI
|
|
35
|
Obama K, Ura K, Satoh S, Nakamura Y and
Furukawa Y: Up-regulation of PSF2, a member of the GINS
multiprotein complex, in intrahepatic cholangiocarcinoma. Oncol
Rep. 14:701–706. 2005.PubMed/NCBI
|
|
36
|
Kim H, Kang HJ, You KT, Kim SH, Lee KY,
Kim TI, Kim C, Song SY, Kim HJ, Lee C, et al: Suppression of human
selenium-binding protein 1 is a late event in colorectal
carcinogenesis and is associated with poor survival. Proteomics.
6:3466–3476. 2006. View Article : Google Scholar : PubMed/NCBI
|
|
37
|
Zhang S, Li F, Younes M, Liu H, Chen C and
Yao Q: Reduced selenium-binding protein 1 in breast cancer
correlates with poor survival and resistance to the
anti-proliferative effects of selenium. PLoS One. 8:e637022013.
View Article : Google Scholar : PubMed/NCBI
|
|
38
|
Li T, Yang W, Li M, Byun DS, Tong C,
Nasser S, Zhuang M, Arango D, Mariadason JM and Augenlicht LH:
Expression of selenium-binding protein 1 characterizes intestinal
cell maturation and predicts survival for patients with colorectal
cancer. Mol Nutr Food Res. 52:1289–1299. 2008. View Article : Google Scholar : PubMed/NCBI
|