Introduction
The incidence of renal cell carcinoma (RCC) has
increased steadily over the past 5 decades, and there are
well-known demographic and lifestyle factors associated with
increased risk (1,2). Clear cell RCC (ccRCC) is the most
common type of RCC, and accounts for ~75–88% of all cases (3,4). ccRCC
cells have clear cytoplasms due to accumulation of glycogen and
lipids, and ccRCC tissue has high vascularity (2). Radical nephrectomy with removal of
Gerota’s fascia, perirenal fat and the ipsilateral adrenal gland is
the most common treatment for RCC; however, 20–30% of patients
receiving nephrectomy nonetheless develop metastasis (2). Patients with metastatic RCC may be
administered chemotherapy with FUDR, 5-FU, Taxol and carboplatin,
but the response rate is poor (5)
due to the development of multidrug resistance mediated by high
expression of P-glycoprotein (6),
an ABC-transporter that is responsible for drug efflux. Patients
with late stage disease or distant metastases may have radical
nephrectomy plus immunotherapy. Clinical studies have examined the
effect of various targeted therapies, but the overall response
rates were <40% (2).
Solid tumors have reduced oxygen concentration, and
this induces the accumulation of hypoxia-inducible factor (HIF) and
increased expression of vascular endothelial growth factor (VEGF)
(7). Recent studies have indicated
that angiogenesis plays a key role in the pathogenesis of many
solid tumors, including RCC (2).
Accumulation and increased activity of HIF, and increased
expression of VEGF and PDGF, are associated with increased
angiogenesis and metastatic potential of RCC (8,9). Thus,
several clinical studies of RCC have examined drugs that inhibit
VEGF and PDGF receptors, such as sunitinib (10) and sorafenib (11).
Previous studies indicated that miRNAs are also
involved in tumor angiogenesis (12,13).
In particular, many urologic tumors have altered levels of numerous
miRNAs (14). Thus, altered
expression of miRNAs may be useful for diagnosis, prediction of
prognosis and treatment selection in patients with certain urologic
cancers (15,16). Notably, targeted disruption of
angiogenesis-related miRNAs may be a potential treatment for RCC
and other cancers (17). Previous
research identified miR-210 as a hypoxia-regulated miRNA that was
upregulated in RCC (18). Other
research indicated that miR-29b, a negative regulator of VEGF, was
also overexpressed in RCC (19).
However, Hauser et al (20)
studied RCC patients from Germany and reported that the serum
levels of miR-26a-2, miR-191, miR-337-3p and miR-378 did not
provide useful diagnostic or prognostic information. They also
concluded that the level of miR-378 was unrelated to pT-stage,
lymph node/distant metastasis, vascular invasion and tumor
grade.
Our long-term purpose is to identify miRNAs that may
be used as targets for novel ccRCC therapies. In the present study,
we compared the expression of miRNAs and angiogenesis-related genes
in the renal tumors and adjacent normal renal tissues of patients
with ccRCC.
Materials and methods
Sample collection
The consecutive patients, who were admitted to the
Second Affiliated Hospital of Xi’an Jiaotong University for
treatment of ccRCC from October 2012 to July 2013, were included in
the present study. In part I, tumor specimens and adjacent normal
kidney tissues were isolated from 4 patients with stage T1a/b ccRCC
and were examined by immunohistochemistry (IHC) and quantitative
PCR (qPCR). The normal tissue of the fourth patient was used up in
the pilot study, therefore no PCR data of this patient were
available. In part II, biopsies from 30 consecutive ccRCC patients
(23 with stage T1a/b cancer, 5 with stage T2a/b cancer, and 2 with
stage T3a cancer) were used for qPCR analysis. All diagnoses and
staging were made by ultrasonography and histological examination
following established guidelines (21). Clinical data of these patients were
collected from hospitalization and follow-up records. Samples were
stored at −80°C until RNA isolation. The medical ethics committee
of the Second Affiliated Hospital of Xi’an Jiaotong University
approved this study on March 8, 2010 (no. 2010029), and all
patients provided written informed consent.
IHC
Samples (3×3×3 mm3) were fixed with 10%
neutral buffered formalin at room temperature (RT) for 24 h, and
then embedded in paraffin for IHC analysis. For IHC staining of the
vascular basement membrane, 7-μm-thick sections were prepared and
the EnVision™ + System-HRP (DAB+) (DakoCytomation, France) was used
for staining. Slides were incubated for 10 min with 3% hydrogen
peroxide in distilled water to block endogenous peroxidase
activity. After three washes with phosphate-buffered saline (PBS),
sections were incubated for 30 min with 5% BSA in PBS to reduce
non-specific binding. Sections were then incubated at RT for 1 h
with monoclonal mouse anti-human CD34, CD31 or collagen-IV
antibodies (IgG1, 1:50; DakoCytomation), washed in PBS, and then
incubated in EnVision Polymer for 30 min. A substrate-chromogen
solution (DAB) was applied for 5 min and reactions were stopped by
washing with distilled water. Finally, slides were counterstained
with Mayer’s hematoxylin for 1 min.
IHC was also used to assess microvasculature density
(MVD). For this analysis, 3-μm sections were subjected to epitope
demarcation, and then IHC staining with a monoclonal antibody
against CD34 (mouse anti-human CD34, code no. M7165, 1:50 dilution;
Dako). After washing, a biotin-conjugated secondary anti-mouse IgG
antibody was applied at RT for 15 min. Then, sections were exposed
to the streptavidin-biotin-HRP complex and rinsed with the
chromogen for 10 min. After rinsing in water, sections were
counter-stained with hematoxylin to visualize nuclei.
Quantification of MVD
An endothelial cell cluster or endothelial cell that
was stained brown-yellow in IHC was considered as a single
microvessel; undefined endothelial cell fragments and the visible
vascular lumen were not counted as microvessels. A branching
structure was considered to be a single vessel if there was no
break in the continuity of the structure. Initially, the entire
section was scanned for high-MVD areas at low magnification (×40
and ×100) to identify hot spots (representing the highest vascular
density). Then, stained endothelial clusters were counted under
light microscopy at ×200. The results are reported as mean
microvessel counts of three hot spots under ×200 magnification
(20).
RNA extraction
Small (<200 bp) and large RNAs (>200 bp) were
isolated from tissue using the miRNeasy Mini kit and RNeasy
MinElute Cleanup kit (Qiagen). The concentration of RNA was
determined by a NanoDrop ND-1000 spectrophotometer (Thermo
Scientific). RNA quality was assessed by the 18S/28S pattern, and
RNA was quantified by a NanoDrop-2000 spectrophotometer (Thermo
Scientific, Wilmington, DE, USA).
Messenger RNA reverse transcription and
real-time PCR quantification
A total of 2 μg of large RNA (>200 bp) was
reverse transcribed in a total volume of 25 μl by use of 200 U of
M-MLV, 25 U of RNase inhibitor, 2 μM of random primer, 0.5 mM
dNTPs, and 1X RT buffer from Promega (Madison, WI, USA). The
reaction was incubated at 37°C for 1 h. Then, 2 μl of RT products
were subjected to SYBR-Green real-time PCR and the expression of
VEGF, PDGF and HIF-1α were determined relative to the housekeeping
gene GAPDH: sense, 5′-CGGAGTCAACGGATTTGGTCGTATTGG-3′ and antisense,
5′-GCTCCTGGAAGATGGTGATGGGATTTCC-3′. The following primer sequences
were used: VEGF sense, 5′-ATCTGCATGGTGATGTTGGA-3′ and antisense,
5′-GGGCAGAATCATCACGAAGT-3′; PDGF-A sense,
5′-CACACCTCCTCGCTGTAGTATTTA-3′ and antisense,
5′-GTTATCGGTGTAAATGTCATCCAA-3′; PDGF-B sense,
5′-TCCCGAGGAGCTTTATGAGA-3′ and antisense, 5′-ACTGCACGTTGCGGTTGT-3′;
HIF-1α sense, 5′-TTCACCTGAGCCTAATAGTCC-3′ and antisense,
5′-CAAGTCTAAATCTGTGTCCTG-3′. The relative expression levels of
target RNAs were determined by the equation Ratio =
2−ΔΔCT, with normalization to GAPDH. Expression in
adjacent normal tissue was compared with expression in the
carcinoma tissue.
miRNA reverse transcription and
quantization
The levels of targeted angiogenesis-related miRNAs
were quantified using SYBR-Green real-time PCR. Briefly, 100 ng of
isolated small RNA was reverse-transcribed using a stem-loop primer
as described by Li et al (22). The RT product was subjected to
real-time PCR to determine the level of miRNA expression. Ten
miRNAs (miR-221, miR-222, miR-130a, let-7f-1, miR-27b, miR-378,
miR-210, miR-15a, miR-16-1 and miR-126) were detected in the
biopsies of patients in the first part of this study. Of the above
10 miRNAs, five highly expressed miRNAs (miR-15, miR-126, miR-210,
miR-221 and miR-378) in the biopsies of the first part of this
study were quantified in the 30 patients during the second part of
the present study.
The PCR reactions were performed in triplicate, in
two separate experiments. The housekeeping gene RNU44 snRNA was
used for normalization (23). The
relative expression of target miRNAs were determined as above
(Ratio = 2−ΔΔCT). Expression in adjacent normal tissue
was compared with expression in the carcinoma tissue.
Statistical analysis
Continuous variables are presented as means ±
standard deviations (SDs) and were compared by the independent two
sample t-test. Categorical variables are presented as counts and
percentages and were compared by Fisher’s exact test. All
statistical assessments were two-sided and evaluated at the 0.05
level of significance. Only 2 patients had stage T3 cancer,
therefore patients who had stage T2 and T3 cancer (n=7) were
compared with patients who had stage T1 cancer (n=26) for
assessment of the association of the miRNA expression in tumor and
normal tissues and TNM classification. SAS software version 9.2
(SAS Institute Inc., Cary, NC, USA) was used for all statistical
analysis.
Results
Part I: pilot study of 4 ccRCC
patients
Angiogenesis in ccRCC tumors and
adjacent normal tissues
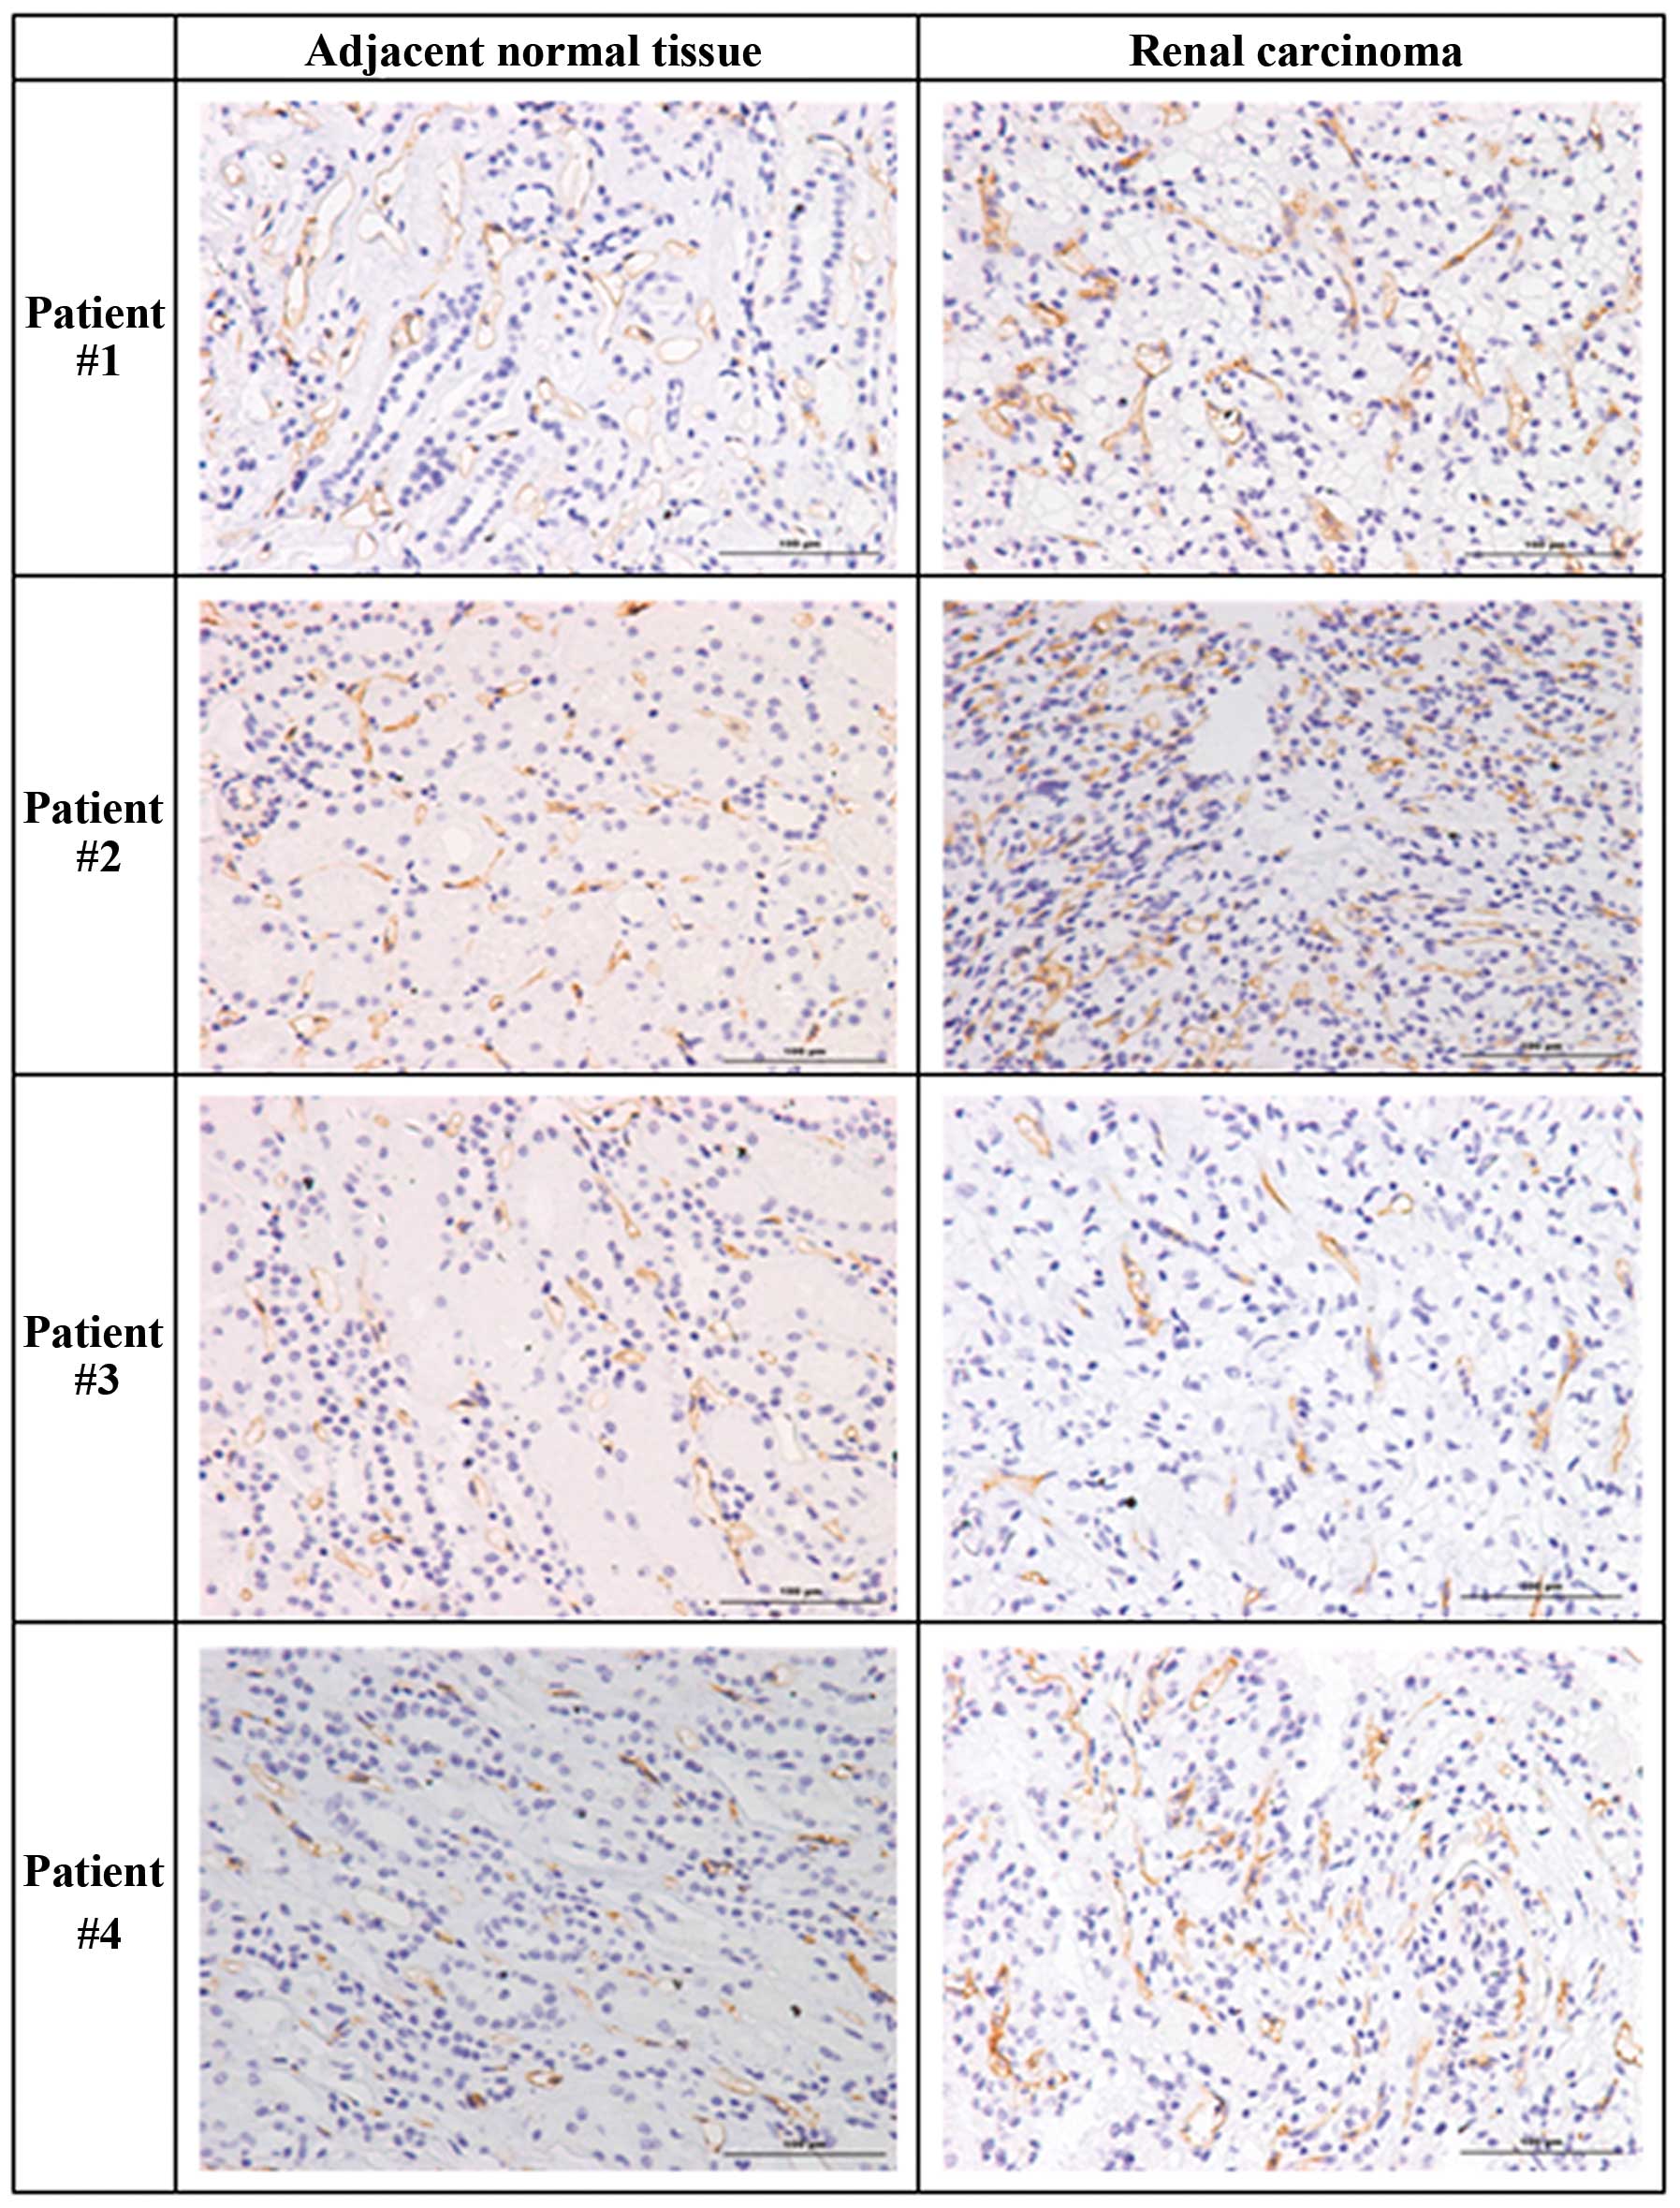
We initially measured angiogenesis and the levels of
angiogenesis-related genes in renal tumors and adjacent normal
renal tissues in 4 patients with stage T1a/b ccRCC by use of IHC
(Table I). Compared to adjacent
normal tissues, the tumors of the first three patients had
increased levels of CD34, indicative of increased angiogenesis
(Fig. 1, Table II). However, the normal tissue of
the fourth patient had a slightly higher level of CD34. Analysis of
MVD indicated greater counts in the tumors of patients #1 and #3,
comparable counts in the normal and tumor tissues of patient #4,
but a markedly greater count in the normal tissue of patient #2
(Table II).
 | Table IDemographic characteristics of 4
patients with ccRCC (part I). |
Table I
Demographic characteristics of 4
patients with ccRCC (part I).
| Patient | Gender | Age (years) | Affected kidney | TNM
classification |
|---|
| #1 | Male | 58 | Left | T1a |
| #2 | Female | 49 | Left | T1b |
| #3 | Male | 49 | Right | T1b |
| #4 | Male | 54 | Right | T1a |
| Table IIMicrovessel density (MVD) and CD34
expression in normal renal tissue and renal tumor tissue of 4
patients with ccRCC (part I). |
Table II
Microvessel density (MVD) and CD34
expression in normal renal tissue and renal tumor tissue of 4
patients with ccRCC (part I).
| Patient | Tissue | MVD count | CD34 (avg. OD) |
|---|
| #1 | Normal | 68.33±16.62 | 4.54±0.30 |
| Tumor | 99.33±13.65 | 6.38±0.53 |
| #2 | Normal | 150.33±7.37 | 4.91±0.46 |
| Tumor | 56.67±3.06 | 5.81±1.54 |
| #3 | Normal | 37.67±14.01 | 4.43±1.77 |
| Tumor | 59.67±15.01 | 6.16±2.45 |
| #4 | Normal | 79.67±8.08 | 4.59±1.38 |
| Tumor | 75.00±17.09 | 3.84±0.32 |
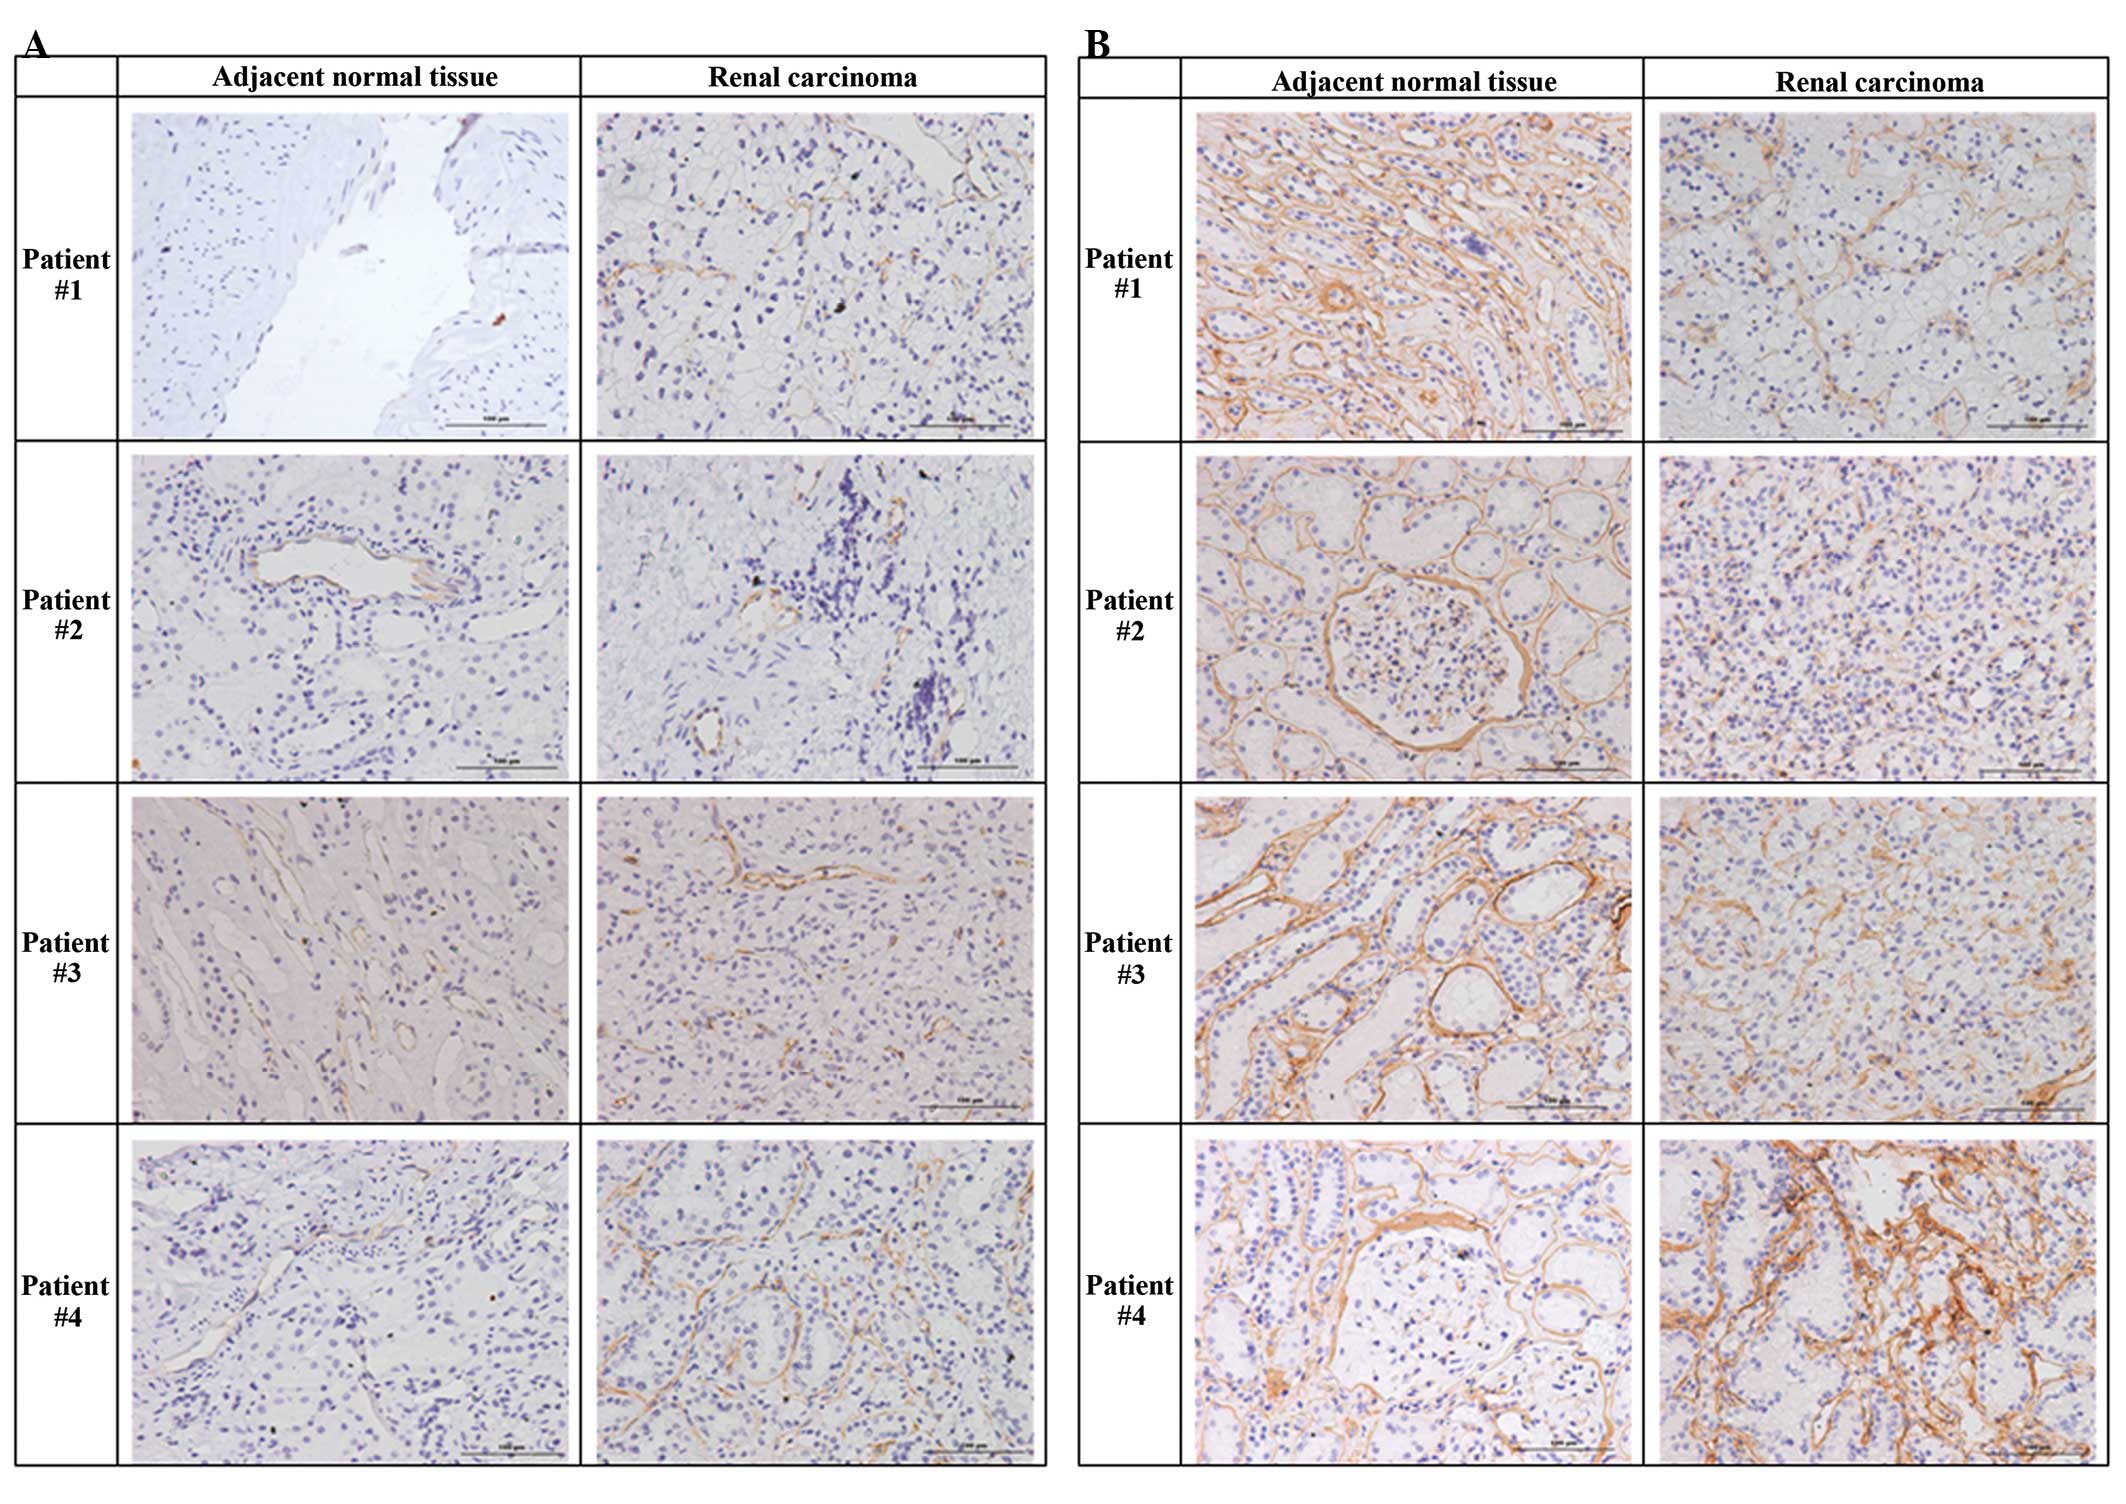
Venule basement membranes in ccRCC
tumors and adjacent normal tissues
Next, we used antibodies against CD31 (Fig. 2A) and collagen IV (Fig. 2B) to evaluate the integrity of the
venule basement membranes of renal tumors and adjacent normal renal
tissues. The results indicated that collagen IV staining was
stronger in the basement membranes of normal tissues and that the
basement membranes of renal tumor tissues were less intact than
adjacent normal tissues. In particular, there were no regular
circular structures and only small luminal regions in the tumor
tissues (Fig. 2).
Expression of HIF-1a, PDGF-A, PDGF-B
and VEGF-A in ccRCC tumors and adjacent normal tissues
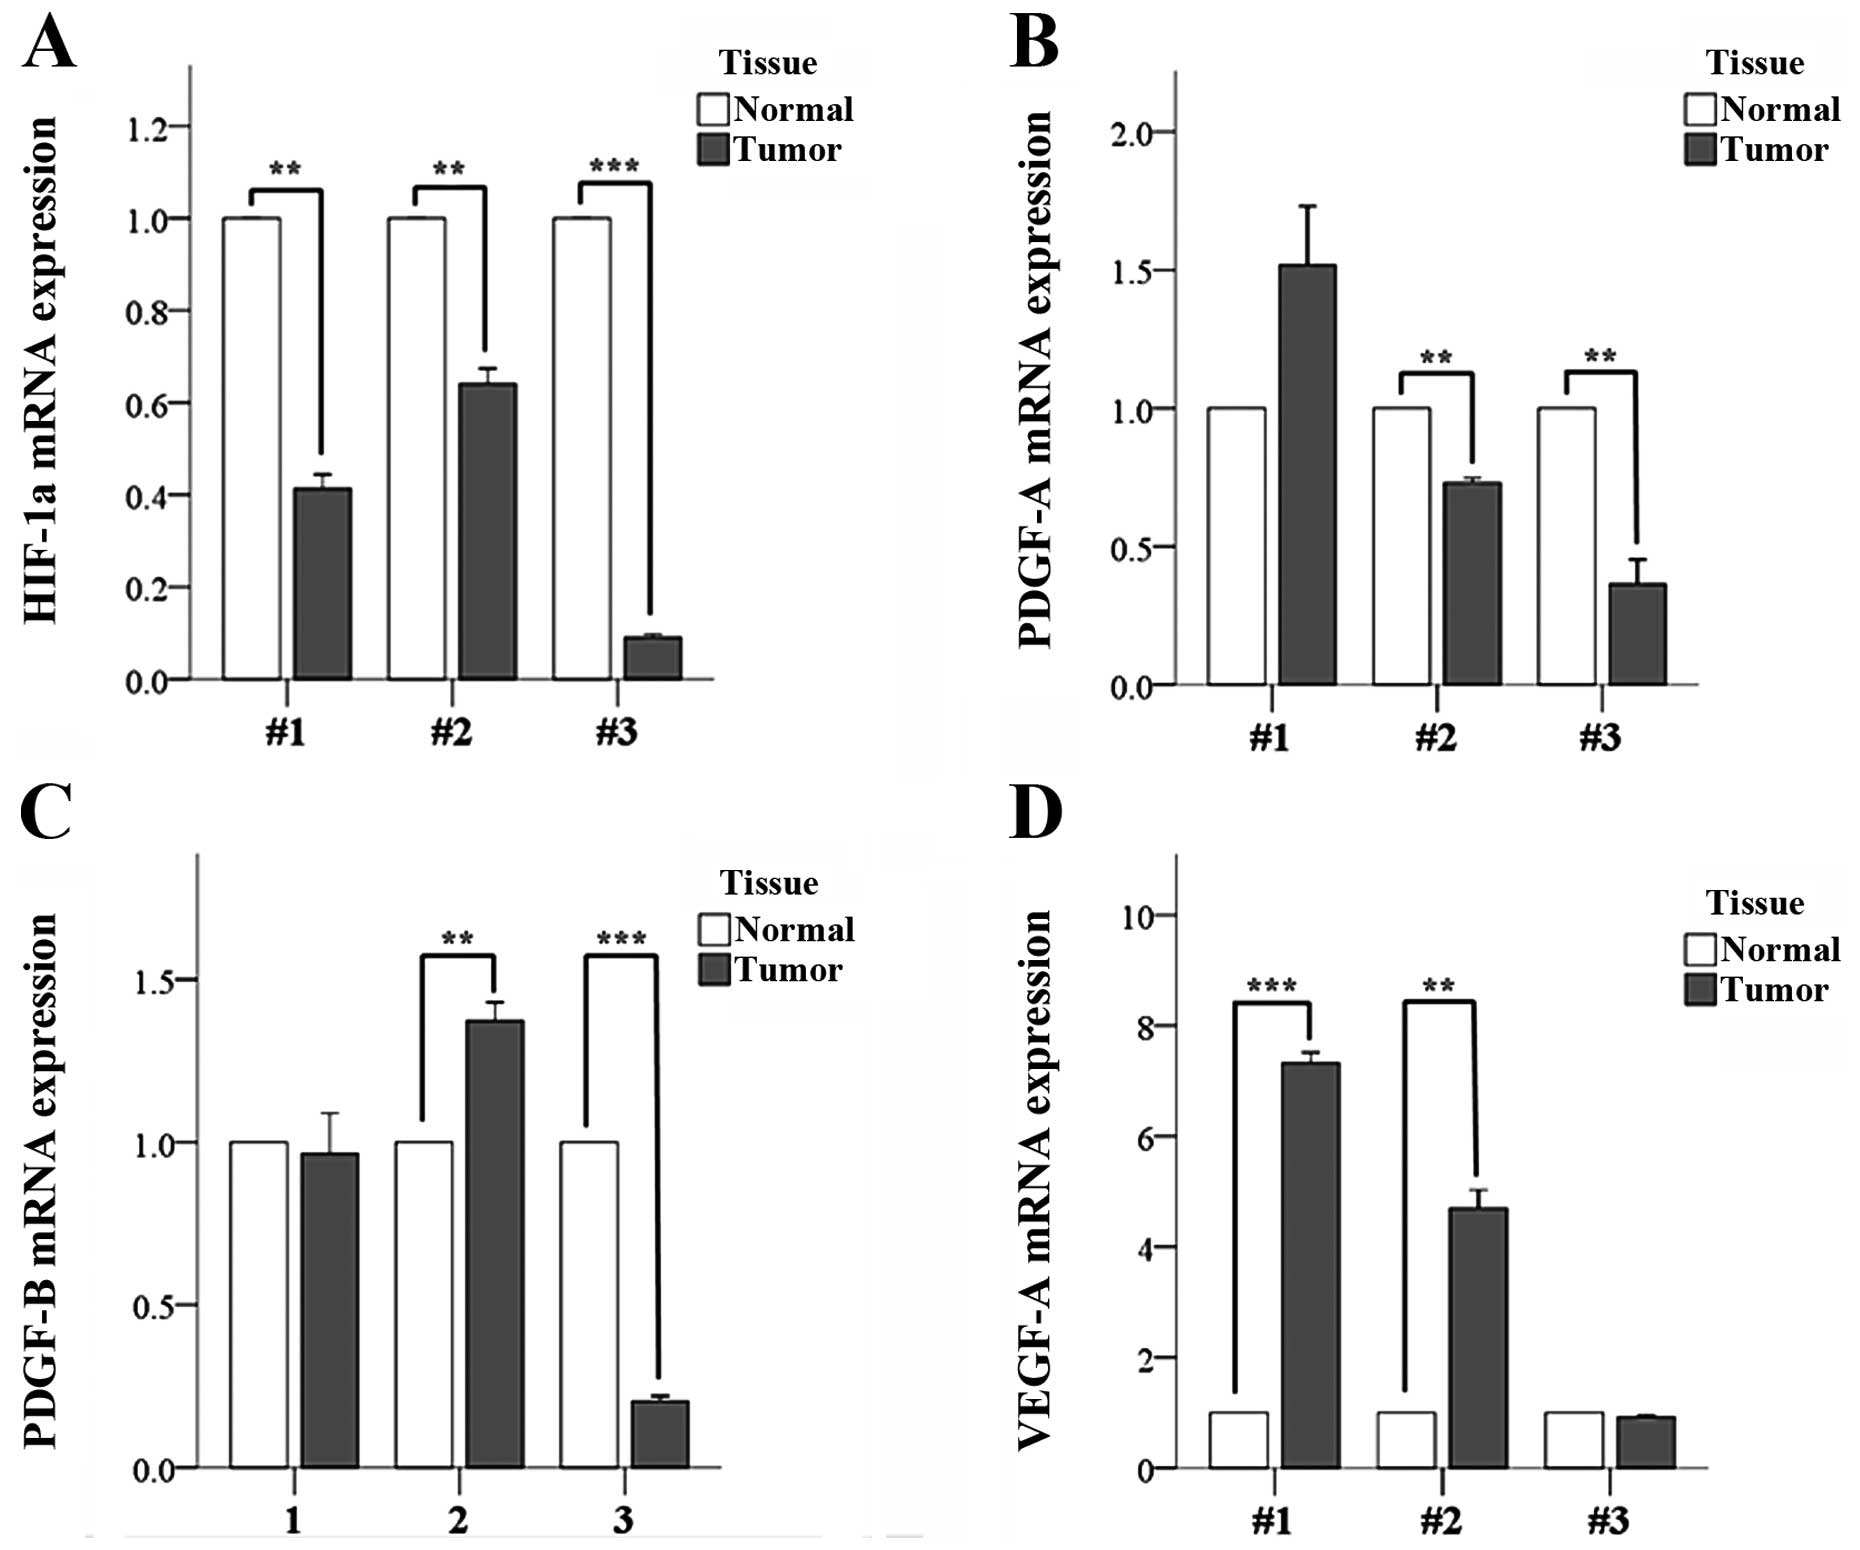
We measured the expression of angiogenesis-related
genes in renal tumors and adjacent normal renal tissues from 3 of
these 4 ccRCC patients by use of qPCR (Fig. 3). There was no remaining normal
tissue of the fourth patient, therefore these qPCR data are not
available. The results indicated significantly lower expression of
HIF-1α in the tumors of all 3 patients (Fig. 3A). This was somewhat unexpected
since tumors have reduced oxygen concentration and this has been
shown to induce HIF accumulation.
The expression of PDGF-A was significantly lower in
the tumor tissues of patients #2 and #3, but was not significantly
different in the tumor and normal tissues of patient #1 (Fig. 3B). The expression of PDGF-B was
similar in the tumor and normal tissues of patient #1, higher in
the tumor tissues of patient #2, and higher in the normal tissues
of patient #3 (Fig. 3C). The
expression of VEGF-A was higher in the tumor tissues of patients #1
and #2, but similar in the tumor and normal tissues of patient #3
(Fig. 3D). Collectively, these data
indicate significant inter-individual variation in the expression
of these 4 angiogenesis-related genes.
Angiogenesis-related miRNA
expression
A comparison of the differential expression of
miRNAs in normal and cancer tissues of these 3 patients led to
identification of 2 miRNAs, Hsa-miR-210 and Hsa-miR-378 (Table III). The results indicated
significantly lower expression of Hsa-miR-378 in the tumor of
patient #1. In addition, all 3 patients had higher expression of
Hsa-miR-210 in the tumor tissues, although these differences were
not significant.
| Table IIIExpression of miRNAs in tumor tissue
relative to adjacent normal tissue in 3 patients with ccRCC (part
I). |
Table III
Expression of miRNAs in tumor tissue
relative to adjacent normal tissue in 3 patients with ccRCC (part
I).
| Patient | miRNA | Tumor tissue/normal
tissue | P-value |
|---|
| #1 | Hsa-miR-210 | 1.57±0.34 | 0.253 |
| Hsa-miR-378 |
(3.7±3.6)x10−5 | 0.017a |
| #2 | Hsa-miR-210 | 7.87±5.86 | 0.179 |
| #3 | Hsa-miR-210 | 20.82±20.4 | 0.235 |
Part II: validation study with 30 ccRCC
patients
Subsequently, we extended the results of the pilot
study by analyzing miRNA expression in 30 additional ccRCC
patients, 23 with stage T1a/b cancer, 5 with stage T2a/b cancer,
and 2 with stage T3a cancer (Table
IV). Table V shows the relative
expression (tumor tissue/normal tissue) of 5 selected miRNAs
(miR-15, miR-126, miR-210, miR-221 and miR-378) in each of the 30
patients.
| Table IVDemographic characteristics of 30
patients with ccRCC (part II). |
Table IV
Demographic characteristics of 30
patients with ccRCC (part II).
|
Characteristics | Mean ± SD or n
(%) |
|---|
| Age, years | 57.0±11.3 |
| Gender |
| Male | 19 (36.7) |
| Female | 11 (63.3) |
| Affected
kidney |
| Left | 18 (40.0) |
| Right | 12 (60.0) |
| TNM
classification |
| T1a | 6 (20.0) |
| T1b | 17 (56.7) |
| T2a | 4 (13.3) |
| T2b | 1 (3.3) |
| T3a | 2 (6.7) |
| Table VExpression of 5 different miRNAs in
tumor tissue relative to adjacent normal tissue (mean ± SD) in 30
patients with ccRCC (part II). |
Table V
Expression of 5 different miRNAs in
tumor tissue relative to adjacent normal tissue (mean ± SD) in 30
patients with ccRCC (part II).
| Patient | Tumor tissue/normal
tissue | P-value |
|---|
| #1 |
| Hsa-miR-15 |
(40.88±25.25)×10−1 | 0.168 |
| Hsa-miR-126 | 0.14±0.07 | 0.002a |
| Hsa-miR-210 | 11.88±1.37 | 0.005a |
| Hsa-miR-221 |
(2.29±1.84)×10−1 | 0.018a |
| Hsa-miR-378 |
(10.67±1.77)×10−5 | <0.001a |
| #2 |
| Hsa-miR-15 |
(1.02±0.53)×10−1 | 0.001a |
| Hsa-miR-126 | 0.18±0.18 | 0.016 |
| Hsa-miR-210 | 1.96±0.4 | 0.053 |
| Hsa-miR-221 |
(0.67±0.46)×10−1 | 0.001a |
| Hsa-miR-378 | (7.52±2.05)
×10−5 | <0.001a |
| #3 |
| Hsa-miR-15 |
(4.68±4.61)×10−1 | 0.184 |
| Hsa-miR-126 | 0.12±0.07 | 0.002a |
| Hsa-miR-210 | 6.18±2.13 | 0.052 |
| Hsa-miR-221 |
(3.39±1.35)×10−1 | 0.014a |
| Hsa-miR-378 |
(27.33±9.72)×10−5 | 0.006a |
| #4 |
| Hsa-miR-210 | 6.2±1.14 | 0.016a |
| Hsa-miR-378 |
(7.99±6.7)×10−5 | 0.002a |
| #5 |
| Hsa-miR-210 | 0.09±0.01 | <0.001a |
| Hsa-miR-378 |
(0.18±0.09)×10−5 | <0.001a |
| #6 |
| Hsa-miR-210 | 39.97±4.72 | 0.005a |
| Hsa-miR-378 |
(546.99±179.83)×10−5 | 0.050a |
| #7 |
| Hsa-miR-210 | 3.84±1.1 | 0.047a |
| Hsa-miR-378 |
(375.4±109.99)×10−5 | 0.049a |
| #8 |
| Hsa-miR-126 | 0.11±0.03 | <0.001a |
| Hsa-miR-210 | 1.13±0.04 | 0.035a |
| Hsa-miR-378 |
(20.59±4.88)×10−5 | 0.001a |
| #9 |
| Hsa-miR-15 |
(14.83±2.99)×10−1 | 0.263 |
| Hsa-miR-126 | 0.28±0.08 | 0.004a |
| Hsa-miR-210 | 7.18±0.25 | 0.001a |
| Hsa-miR-221 |
(3.41±2.33)×10−1 | 0.039a |
| Hsa-miR-378 |
(4.9±0.78)×10−5 | <0.001a |
| #10 |
| Hsa-miR-15 | (86.91±26.36)
×10−1 | 0.151 |
| Hsa-miR-210 | 5.84±1.5 | 0.031a |
| Hsa-miR-378 |
(78.61±32.97)×10−5 | 0.378 |
| #11 |
| Hsa-miR-210 | 0.14±0.02 | <0.001a |
| Hsa-miR-378 |
(2372.67±472.7)×10−5 | 0.014a |
| #12 |
| Hsa-miR-210 | 0.58±0.12 | 0.026a |
| Hsa-miR-378 |
(763.96±67.22)×10−5 | 0.003a |
| #13 |
| Hsa-miR-210 | 17.85±2.27 | 0.006a |
| Hsa-miR-378 |
(234.96±38.94)×10−5 | 0.027a |
| #14 |
| Hsa-miR-15 |
(1.68±1.23)×10−1 | 0.066 |
| Hsa-miR-126 | 0.68±0.42 | 0.477 |
| Hsa-miR-210 | 14.13±5.32 | 0.051 |
| Hsa-miR-378 |
(14.25±2.13)×10−5 | <0.001a |
| #15 |
| Hsa-miR-126 | 0.6±0.34 | 0.178 |
| Hsa-miR-210 | 5.3±0.77 | 0.010a |
| Hsa-miR-378 |
(0.38±0.03)×10−5 | <0.001a |
| #16 |
| Hsa-miR-126 | 60.46±26.13 | 0.059 |
| Hsa-miR-210 | 0.42±0.04 | 0.002a |
| Hsa-miR-221 |
(48.46±16.84)×10−1 | 0.058 |
| Hsa-miR-378 |
(427.57±117.62)×10−5 | 0.040a |
| #17 |
| Hsa-miR-126 | 1.15±0.64 | 0.718 |
| Hsa-miR-210 | 4.98±0.4 | 0.003a |
| Hsa-miR-221 |
(1.38±0.95)×10−1 | 0.004a |
| Hsa-miR-378 |
(6.95±2.38)×10−5 | <0.001a |
| #18 |
| Hsa-miR-126 | 0.38±0.21 | 0.151 |
| Hsa-miR-210 | 8.37±0.27 | <0.001a |
| Hsa-miR-221 |
(0.35±0.03)×10−1 | 0.001a |
| Hsa-miR-378 |
(21.9±5.48)×10−5 | 0.002a |
| #19 |
| Hsa-miR-126 | 0.87±1.34 | 0.880 |
| Hsa-miR-210 | 24.4±2.04 | 0.003a |
| Hsa-miR-221 |
(1.61±0.75)×10−1 | 0.003a |
| Hsa-miR-378 |
(51.92±24.64)×10−5 | 0.078 |
| #20 |
| Hsa-miR-15 |
(7.66±8.3)×10−1 | 0.758 |
| Hsa-miR-126 | 0.24±0.16 | 0.093 |
| Hsa-miR-210 | 10.9±0.49 | 0.001a |
| Hsa-miR-221 |
(1.75±0.99)×10−1 | 0.005a |
| Hsa-miR-378 |
(21.8±7.91)×10−5 | 0.003a |
| #21 |
| Hsa-miR-210 | 5.66±0.23 | 0.001a |
| Hsa-miR-378 |
(135.14±57.35)×10−5 | 0.400 |
| #22 |
| Hsa-miR-210 | 37.32±3.94 | 0.004a |
| Hsa-miR-378 |
(1.4±0.84)×10−5 | <0.001a |
| #23 |
| Hsa-miR-210 | 4.4±0.26 | 0.002a |
| Hsa-miR-378 |
(5.27±0.5)×10−5 | <0.001a |
| #24 |
| Hsa-miR-210 | 5.44±0.33 | 0.002a |
| Hsa-miR-378 |
(6.82±1.79)×10−5 | <0.001a |
| #25 |
| Hsa-miR-210 | 46.69±3.06 | 0.001a |
| Hsa-miR-378 |
(648.45±122.55)×10−5 | 0.016a |
| #26 |
| Hsa-miR-15 |
(3.67±2.66)×10−1 | 0.184 |
| Hsa-miR-210 | 8.64±0.25 | <0.001a |
| Hsa-miR-378 |
(16.7±3.24)×10−5 | 0.001a |
| #27 |
| Hsa-miR-210 | 6.79±0.57 | 0.003a |
| Hsa-miR-378 |
(31.05±5.32)×10−5 | 0.002a |
| #28 |
| Hsa-miR-15 |
(13.2±11.75)×10−1 | 0.683 |
| Hsa-miR-126 | 0.73±0.4 | 0.358 |
| Hsa-miR-210 | 0.57±0.02 | 0.001a |
| Hsa-miR-221 |
(5.4±3.52)×10−1 | 0.152 |
| Hsa-miR-378 |
(69.89±21.32)×10−5 | 0.134 |
| #29 |
| Hsa-miR-15 |
(0.33±0.39)×10−1 | 0.001a |
| Hsa-miR-126 | 0.23±0.09 | 0.005a |
| Hsa-miR-210 | 7.27±0.49 | 0.002a |
| Hsa-miR-221 |
(0.09±0.06)×10−1 | <0.001a |
| Hsa-miR-378 |
(11.35±1.66)×10−5 | <0.001a |
| #30 |
| Hsa-miR-15 |
(99.34±159.82)×10−1 | 0.435 |
| Hsa-miR-126 | 0.74±0.53 | 0.492 |
| Hsa-miR-210 | 3.87±0.49 | 0.010a |
| Hsa-miR-221 |
(2.72±3.79)×10−1 | 0.080 |
| Hsa-miR-378 |
(4.77±0.92)×10−5 | <0.001a |
Statistical analysis of pooled data from
both parts
In order to increase the sample size, the data of
both parts were pooled together. Table
VI shows the expression of 5 miRNAs (miR-15, miR-126, miR-210,
miR-221 and miR-378) in all 33 ccRCC patients, with classification
into 5 categories (normal > tumor, tumor > normal, undetected
in tumor, undetected in normal tissue, and undetected in both
tissues).
| Table VIDifferential expression of 5 miRNAs
in normal and tumor tissues of 33 patients with ccRCC. |
Table VI
Differential expression of 5 miRNAs
in normal and tumor tissues of 33 patients with ccRCC.
| Expression in
normal vs. tumor tissue |
|---|
|
|
|---|
| miRNA | Normal >
tumor | Tumor >
normal | Undetected in tumor
tissue | Undetected in
normal tissue | Undetected in both
tissues |
|---|
| Hsa-miR-15 | 6 | 7 | 5 | 8 | 7 |
| Hsa-miR-126 | 15 | 4 | 4 | 1 | 9 |
| Hsa-miR-210 | 6 | 27 | 0 | 0 | 0 |
| Hsa-miR-221 | 11 | 2 | 8 | 3 | 9 |
| Hsa-miR-378 | 23 | 8 | 1 | 1 | 1 |
Finally, we separated these 33 patients into two
groups, one with stage T1 ccRCC (n=26) and one with stage T2/T3
ccRCC (n=7) (Table VII).
Statistical analysis of these results indicated that expression of
Hsa-miR-126 and Hsa-miR-378 were associated with pathological
status, although the p-values only indicated marginal significance
(p=0.042 and p=0.047). In particular, more patients with stage I
ccRCC had higher expression of both miRNAs in their normal tissues,
and more patients with stage T2/T3 ccRCC had higher expression of
both miRNAs in their tumors.
| Table VIIAssociation between expression of
specific miRNAs in tumor and normal tissues and TNM classification
of 33 patients with ccRCC. |
Table VII
Association between expression of
specific miRNAs in tumor and normal tissues and TNM classification
of 33 patients with ccRCC.
| miRNA | T1n (%) | T2 and T3 n
(%) | P-value |
|---|
| Hsa-miR-15 | | | 0.128 |
| Normal >
tumora | 7 (33.3) | 4 (80.0) | |
| Tumor >
normalb | 14 (66.7) | 1 (20.0) | |
| Hsa-miR-126 | | | 0.042c |
| Normal >
tumora | 17 (89.5) | 2 (40.0) | |
| Tumor >
normalb | 2 (10.5) | 3 (60.0) | |
| Hsa-miR-210 | | | 0.093 |
| Normal >
tumora | 3 (11.5) | 3 (42.9) | |
| Tumor >
normalb | 23 (88.5) | 4 (57.1) | |
| Hsa-miR-221 | | | 0.179 |
| Normal >
tumora | 17 (85.0) | 2 (50.0) | |
| Tumor >
normalb | 3 (15.0) | 2 (50.0) | |
| Hsa-miR-378 | | | 0.047c |
| Normal >
tumora | 21 (84.0) | 3 (42.9) | |
| Tumor >
normalb | 4 (16.0) | 4 (57.1) | |
Discussion
The initial study of 4 patients with ccRCC indicated
increased levels of CD34 in the tumors of all patients, consistent
with the presence of increased angiogenesis. In agreement with this
result, the venual basement membranes in their tumor tissues were
disrupted and had greatly reduced lumens, reduced expression of
collagen, and reduced expression of CD31. However, quantitative
analysis of microvessel density (MVD) and expression of miRNAs in
the same patients produced variable results. Three of the 4
patients had higher microvessel density in their tumors, but 1
patient had markedly higher MVD in the normal tissue. In addition,
there were similar levels of miR-210 in the tumor and normal
tissues of all tested patients, and only 1 patient had
significantly lower expression of miR-378 in the tumor tissue
relative to normal tissue. The second part of this study indicated
that more patients with stage T1a/b cancer had higher expression of
miR-126 and miR-378 in their normal tissues, and that more patients
with stage T2/T3 cancer had higher expression of these miRNAs in
their cancerous tissues.
Previous studies have also documented differential
expression of angiogenesis-related molecules in ccRCC tumors. In
particular, Esteban et al (24) reported that the level of HIF-1α mRNA
was lower in ccRCC tumor tissues than in adjacent normal tissues.
Our results also indicated significantly lower expression of HIF-1α
in the tumor tissues of 3 tested patients. These results apparently
contradict the hypothesis that reduced oxygen concentration in
tumor tissue induces accumulation of HIF (7). However, the study of Esteban et
al (24) demonstrated the loss
of function of the von Hippel-Lindau (VHL) tumor suppressor gene in
the majority of patients with ccRCC, and that this led to
downregulation of HIF-1α mRNA through epigenetic regulation. The
results of this study are consistent with this.
Redova et al (25) used TaqMan low-density arrays to
identify differentially expressed miRNAs in tumor and adjacent
normal tissues of patients with ccRCC. They identified 667 miRNAs,
78 of which were differentially expressed (73 miRNAs were
downregulated in tumors and 5 miRNAs were upregulated in tumors).
Other research identified 10 miRNAs (miR-221, miR-222, miR-130a,
let-7f-1, miR-27b, miR-378, miR-210, miR-15a, miR-16-1 and miR-126)
that were putatively involved in angiogenesis based on analysis of
tumor and adjacent normal tissues of patients with ccRCC (22). In agreement with this result, we
found that the tumors of patients with stage T1 ccRCC had
significantly lower tumor expression of 2 of the same miRNAs
(miR-126 and miR-378) than the tumors of patients with stage T2/T3
ccRCC. Our results are also consistent with the report of Redova
et al (25) who found that
more miRNAs were downregulated in ccRCC tissues than in normal
tissues (73 of 78 miRNAs). Notably, several studies of non-small
cell lung cancer (NSCLC) have also indicated an important role for
miR-378 in tumor progression and angiogenesis (26,27).
This miRNA appears to target the tumor suppressors Sufu and Fus-1
(28). Another study on NSCLC
indicated an important role of miR-126 (29) which targets EGFL7 in metastasis and
angiogenesis.
Our results are also consistent with previous
studies that reported disrupted miR-378 expression in tumor
tissues. One study reported increased levels of miR-378 in the
serum of patients with ccRCC (20)
and another study reported overexpression of miR-378 in human
non-small cell lung carcinoma and an association of expression with
enhanced tumor proliferation and migration (26). However, in the present study,
miR-378 levels were lower in tumor samples than in normal tissues.
This observation raises the possibility that miR-378 may play a
role that is unrelated to angiogenesis in the pathogenesis of
ccRCC.
The initial study of 4 patients with ccRCC indicated
marked differences in the expression of angiogenesis-related genes
among these patients, although they all had stage T1a/b cancer.
This suggests the importance of using large sample sizes, and
indicates that the results we obtained with 33 patients may not be
generalizable to other populations. A large-scale study is required
to confirm the findings presented here.
In conclusion, the tumor tissues of patients who had
ccRCC in the present study had decreased expression of miR-126 and
miR-378 during the early stages of cancer (T1), but increased
expression miR-126 and miR-378 during the later stages of disease
(T2/T3). These results suggest that these miRNAs play a role in the
pathogenesis of ccRCC.
Acknowledgements
This study was supported by a grant from the Natural
Science Foundation of China (General Program) no. 81072106. The
authors are grateful to Dr Qin from the Department of Urology, The
Second Affiliated Hospital, Xi’an Jiaotong University for
assistance with biopsy collection.
References
|
1
|
Parkin DM, Pisani P and Ferlay J:
Estimates of the worldwide incidence of 25 major cancers in 1990.
Int J Cancer. 80:827–841. 1999. View Article : Google Scholar : PubMed/NCBI
|
|
2
|
Koul H, Huh JS, Rove KO, Crompton L, Koul
S, Meacham RB and Kim FJ: Molecular aspects of renal cell
carcinoma: a review. Am J Cancer Res. 1:240–254. 2011.PubMed/NCBI
|
|
3
|
Patard JJ, Leray E, Rioux-Leclercq N,
Cindolo L, Ficarra V, Zisman A, De La Taille A, et al: Prognostic
value of histologic subtypes in renal cell carcinoma: a multicenter
experience. J Clin Oncol. 23:2763–2771. 2005. View Article : Google Scholar : PubMed/NCBI
|
|
4
|
Schachter LR, Cookson MS, Chang SS, Smith
JA Jr, Dietrich MS, Jayaram G and Herrell SD: Second prize:
frequency of benign renal cortical tumors and histologic subtypes
based on size in a contemporary series: what to tell our patients.
J Endourol. 21:819–823. 2007. View Article : Google Scholar
|
|
5
|
Rini BI, Vogelzang NJ, Dumas MC, Wade JL
III, Taber DA and Stadler WM: Phase II trial of weekly intravenous
gemcitabine with continuous infusion fluorouracil in patients with
metastatic renal cell cancer. J Clin Oncol. 18:2419–2426. 2000.
|
|
6
|
Yagoda A, Abi-Rached B and Petrylak D:
Chemotherapy for advanced renal-cell carcinoma: 1983–1993. Semin
Oncol. 22:42–60. 1995.
|
|
7
|
Sarkar S and Suresh MR: An overview of
tuberculosis chemotherapy-a literature review. J Pharm Pharm Sci.
14:148–161. 2011.PubMed/NCBI
|
|
8
|
Billemont B, Méric JB, Izzedine H, et al:
Angiogenesis and renal cell carcinoma. Bull Cancer. 94:S232–S240.
2007.(In French).
|
|
9
|
Lainakis G and Bamias A: Targeting
angiogenesis in renal cell carcinoma. Curr Cancer Drug Targets.
8:349–358. 2008. View Article : Google Scholar : PubMed/NCBI
|
|
10
|
Rini BI: VEGF-targeted therapy in
metastatic renal cell carcinoma. Oncologist. 10:191–197. 2005.
View Article : Google Scholar : PubMed/NCBI
|
|
11
|
Ahmad T and Eisen T: Kinase inhibition
with BAY 43-9006 in renal cell carcinoma. Clin Cancer Res.
10:6388S–6392S. 2004. View Article : Google Scholar : PubMed/NCBI
|
|
12
|
Suárez Y and Sessa WC: MicroRNAs as novel
regulators of angiogenesis. Circ Res. 104:442–454. 2009.
|
|
13
|
Bridge G, Monteiro R, Henderson S, et al:
The microRNA-30 family targets DLL4 to modulate endothelial
cell behavior during angiogenesis. Blood. 120:5063–5072.
2012.PubMed/NCBI
|
|
14
|
Catto JW, Alcaraz A, Bjartell AS, et al:
MicroRNA in prostate, bladder, and kidney cancer: a systematic
review. Eur Urol. 59:671–681. 2011. View Article : Google Scholar : PubMed/NCBI
|
|
15
|
Schaefer A, Jung M, Kristiansen G, et al:
MicroRNAs and cancer: current state and future perspectives in
urologic oncology. Urol Oncol. 28:4–13. 2010. View Article : Google Scholar : PubMed/NCBI
|
|
16
|
Ru Y, Dancik GM and Theodorescu D:
Biomarkers for prognosis and treatment selection in advanced
bladder cancer patients. Curr Opin Urol. 21:420–427. 2011.
View Article : Google Scholar : PubMed/NCBI
|
|
17
|
Fendler A, Stephan C, Yousef GM and Jung
K: MicroRNAs as regulators of signal transduction in urological
tumors. Clin Chem. 57:954–968. 2011. View Article : Google Scholar : PubMed/NCBI
|
|
18
|
Weng L, Wu X, Gao H, et al: MicroRNA
profiling of clear cell renal cell carcinoma by whole-genome small
RNA deep sequencing of paired frozen and formalin-fixed,
paraffin-embedded tissue specimens. J Pathol. 222:41–51.
2010.PubMed/NCBI
|
|
19
|
Sinha S, Dutta S, Datta K, Ghosh AK and
Mukhopadhyay D: Von Hippel-Lindau gene product modulates TIS11B
expression in renal cell carcinoma: impact on vascular endothelial
growth factor expression in hypoxia. J Biol Chem. 284:32610–32618.
2009. View Article : Google Scholar
|
|
20
|
Hauser S, Wulfken LM, Holdenrieder S, et
al: Analysis of serum microRNAs (miR-26a-2*, miR-191, miR-337-3p
and miR-378) as potential biomarkers in renal cell carcinoma.
Cancer Epidemiol. 36:391–394. 2012. View Article : Google Scholar : PubMed/NCBI
|
|
21
|
Martínez-Salamanca JI1, Huang WC, Millán
I, Bertini R, Bianco FJ, Carballido JA, Ciancio G, Hernández C,
Herranz F, Haferkamp A, Hohenfellner M, Hu B, Koppie T,
Martínez-Ballesteros C, Montorsi F, Palou J, Pontes JE, Russo P,
Terrone C, Villavicencio H, Volpe A and Libertino JA; International
Renal Cell Carcinoma-Venous Thrombus Consortium. Prognostic impact
of the 2009 UICC/AJCC TNM staging system for renal cell carcinoma
with venous extension. Eur Urol. 59:120–127. 2011.PubMed/NCBI
|
|
22
|
Xu J, Wang B, Xu Y, et al: Epigenetic
regulation of HIF-1α in renal cancer cells involves HIF-1α/2α
binding to a reverse hypoxia-response element. Oncogene.
31:1065–1072. 2012.
|
|
23
|
Youssef YM, White NM, Grigull J, et al:
Accurate molecular classification of kidney cancer subtypes using
microRNA signature. Eur Urol. 59:721–730. 2011. View Article : Google Scholar : PubMed/NCBI
|
|
24
|
Esteban MA, Tran MG, Harten SK, et al:
Regulation of E-cadherin expression by VHL and
hypoxia-inducible factor. Cancer Res. 66:3567–3575. 2006.
View Article : Google Scholar : PubMed/NCBI
|
|
25
|
Redova M, Poprach A, Besse A, et al:
MiR-210 expression in tumor tissue and in vitro effects of its
silencing in renal cell carcinoma. Tumour Biol. 34:481–491. 2013.
View Article : Google Scholar : PubMed/NCBI
|
|
26
|
Skrzypek K, Tertil M, Golda S, et al:
Interplay between heme oxygenase-1 and miR-378 affects non-small
cell lung carcinoma growth, vascularization, and metastasis.
Antioxid Redox Signal. 19:644–660. 2013. View Article : Google Scholar
|
|
27
|
Chen LT, Xu SD, Xu H, Zhang JF, Ning JF
and Wang SF: MicroRNA-378 is associated with non-small cell lung
cancer brain metastasis by promoting cell migration, invasion and
tumor angiogenesis. Med Oncol. 29:1673–1680. 2012. View Article : Google Scholar : PubMed/NCBI
|
|
28
|
Lee DY, Deng Z, Wang CH and Yang BB:
MicroRNA-378 promotes cell survival, tumor growth, and angiogenesis
by targeting SuFu and Fus-1 expression. Proc Natl Acad Sci USA.
104:20350–20355. 2007. View Article : Google Scholar : PubMed/NCBI
|
|
29
|
Jusufović E, Rijavec M, Keser D, et al:
let-7b and miR-126 are down-regulated in tumor tissue and correlate
with microvessel density and survival outcomes in non-small-cell
lung cancer. PLoS One. 7:e455772012.PubMed/NCBI
|