Introduction
Matrine is a major alkaloid extracted from
Sophora flavescens that has been used clinically in the
treatment of gastric cancer. Matrine exhibits antitumor activity in
several types of cancer including gastric (1–5), lung
cancer (6,7), acute myeloid leukemia (8,9),
breast (10), prostate (11), hepatocellular (12), pancreatic (13), colon cancer (14) and gallbladder carcinomas (15). The anticancer properties of matrine
are associated with its ability to suppress proliferation and
induce apoptosis in tumor cell lines through a variety of different
pathways (2,7–10,16).
However, in the case of gastric cancer the mechanism of action has
yet to be clarified.
Matrine injections have been found to inhibit the
migration, invasion and adhesion capacity of SGC-7901 gastric
cancer cells in vitro. This inhibition may be correlated
with the downregulation of CD44 (V6) protein expression (2). Matrine injections are also able to
induce apoptosis of SGC-7901 cells by upregulating Fas/FasL
expression and activating caspase-3 (3). Furthermore, matrine can induce
apoptosis in MKN45 gastric cancer cells via an increase in
pro-apoptotic molecules from the Bcl-2 family (5). Matrine has been found to modulate
NF-κB, XIAP, CIAP and p-ERK protein expression in the MNK45 cell
line, resulting in antitumor effects (4). In addition, matrine inhibits the
adhesion and migration of BGC823 gastric cancer cells by affecting
the structure and function of the vasodilator-stimulated
phosphoprotein (VASP) (17).
It has recently been reported that matrine
suppresses breast cancer by downregulating miR-21, leading to the
dephosphorylation of Akt and resulting in an accumulation of Bad,
p21(/WAF1/CIP1) and p27(/KIP1) (10). Thus, miRNA may act as a mediator,
contributing to the therapeutic efficacy of matrine. The aim of the
present study was to examine the effects of matrine on miRNA
expression profiles of the SGC7901 gastric cancer cell line and to
identify the putative target genes by analyzing differentially
expressed miRNAs and the enrichment pathways of target genes. To
the best of our knowledge, this is the first study to examine the
effect of treatment with matrine on miRNA expression profiles in
gastric cancer cells.
Materials and methods
Cell line and cell culture
The SGC7901 cell line was obtained from the Cancer
Institute and Hospital, Chinese Academy of Medical Sciences (CAMS)
(Beijing, China). The cells were grown in 90% RPMI-1640,
supplemented with 10% FBS, 100 U/ml penicillin, and 100 mg/ml
streptomycin and incubated at 37°C in a humidified atmosphere of 5%
CO2.
Matrine treatment
Matrine (Baoji Fangsheng Pharmaceutical Co., Ltd.,
Xian, China) was analyzed by HPLC assay and dissolved in
phosphate-buffered saline (PBS; Invitrogen-Gibco, Grand Island, NY,
USA). SGC-7901 cell cultures were then treated for 24 h with 0.5,
1.0, 1.5, 2.0 and 2.5 mg/ml concentrations of matrine.
Subsequently, 20 μl of 5 mg/ml MTT in PBS was added to each well
and the plate was incubated at 37°C for 4 h. The plate was then
centrifuged at 1,000 × g for 2 min and followed by removal of the
medium. One-hundred and fifty microliter of dimethyl sulfoxide
(DMSO; Sigma, St. Louis, MO, USA) was then added. After incubation
at 37°C for 5 min, absorbance in the control and matrine-treated
cells was measured spectrophotometrically at 570 nm using a
benchmark microtiter plate reader (Bio-Rad Laboratories, Hercules,
CA, USA). Microarray array was subsequently conducted on the
control (blank) vs. 1.5 mg/ml matrine (MA) treatment groups.
miRNA microarray analysis
Total RNA, including miRNA, was isolated using the
miRNeasy mini kit (Qiagen, Hilgen, Germany), according to the
manufacturer’s instructions. RNA quality and quantity was measured
via a NanoDrop spectrophotometer (ND-1000; NanoDrop Technologies,
Wilmington, DE, USA) and RNA integrity was determined by gel
electrophoresis. The concentration and purity of total RNA were
assessed at absorbance readings of 260 and 280 nm, using an
ultraviolet spectrophotometer. Only the RNA samples with ratios of
A260/A280 >1.8 were used in the present study. After isolating
the RNA, the miRCURY Hy3™/Hy5™ Power labeling kit (Exiqon,
Copenhagen, Denmark) was used for miRNA labeling, according to the
manufacturer’s instructions. One microgram of each sample was
3′-end-labeled with a Hy3™ fluorescent label using T4 RNA ligase,
as follows: RNA was placed in 2.0 μl of water and combined with 1.0
μl of CIP buffer and CIP (Exiqon, Vedbaek, Denmark). After
incubating for 30 min at 37°C the reaction was terminated by 5-min
incubation at 95°C. A volume of 3.0 μl labeling buffer, 1.5 μl
fluorescent label (Hy3™), 2.0 μl DMSO, and 2.0 μl labeling enzyme
were then added. The mixture was incubated for 1 h at 16°C for
labeling, followed by 15-min incubation at 65°C to terminate the
labeling reaction. After labeling, the Hy3™-labeled samples were
hybridized on the miRCURY™ LNA Array v.18.0 (Exiqon, Copenhagen,
Denmark), according to the array manual. A 25 μl volume of the
Hy3™-labeled sample mixture and 25 μl hybridization buffer were
denatured for 2 min at 95°C, incubated on ice for 2 min and then
hybridized to the microarray for 16–20 h at 56°C in a 12-Bay
hybridization system (NimbleGen Hybridization System 12; Roche
Applied Science, Madison, WI, USA), which provides an active mixing
action and constant incubation temperature to improve hybridization
uniformity and signal enhancement. Following hybridization, slides
were prepared, washed several times using a wash buffer kit
(Exiqon), and dried via centrifugation for 5 min at 400 rpm. The
slides were scanned using an Axon GenePix 4000B microarray scanner
(Axon Instruments, Foster City, CA, USA).
miRNA target gene prediction and
signaling pathway analyses
miRBase, miRanda and TargetScan were used to predict
the target genes of differentially expressed miRNAs following
matrine treatment. The prediction information from the three
databases that overlapped was considered the final result. The
miRNA target gene prediction databases miRFocus 2.0 (http://mirfocus.org/index.php) and miRWalk (http://www.umm.uni-heidelberg.de/apps/zmf/mirwalk/)
were also used to analyze plausible KEGG pathway enrichment of
dysregulated miRNA targets. The miRFocus 2.0 prediction tools
included miRanda, MirTarget2, PicTar, microT and TargetScanS. The
experimental validated target gene tools included miRecords,
miR2Disease, TarBase and miRTarBase. The prediction databases
support number was ≥3 and the Fisher test P-value cut-off was
0.01.
miRNA quantification by RT-qPCR
A SYBR-Green RT-PCR assay was used for miRNA
quantification. In brief, 1 μg of total RNA, containing miRNA, was
polyadenylated using poly(A) polymerase and was reverse transcribed
to cDNA using a miScript Reverse Transcription kit, according to
the manufacturer’s instructions (GeneCopoeia, Rockville, MD, USA).
The miScript Universal primer was provided by the manufacturer
(GeneCopoeia) and the miScript SYBR-Green PCR kit was used. RT-PCR
was performed using the Bio-Rad CFX96 real-time PCR system. Each
reaction was performed in a final volume of 10 μl containing 2 μl
cDNA, 0.5 mM of each primer and 1X SYBR-Green PCR Master Mix
(GeneCopoeia). The amplification program was as follows:
denaturation at 95°C for 10 min, followed by 45 cycles at 94°C for
15 sec, 55°C for 30 sec and 70°C for 30 sec, in which fluorescence
was obtained. After completion of the PCR cycles melting curve
analyses and electrophoresis, on 2.5% agarose gels were performed
to validate the specificity of the expected PCR product. Each
sample was analyzed in triplicate. The expression levels of miRNAs
were normalized to RNU6B and the relative gene expression was
calculated as
2−(CTmiRNA-CTRNU6B
RNA). Each sample was analyzed in triplicate. All the miRNA
PCR primers were purchased from GeneCopoeia.
Statistical analysis
Scanned images of the miRNA Array were imported into
GenePix Pro 6.0 software (Axon) for grid alignment and data
extraction. Replicated miRNAs were averaged and miRNAs with
intensities of ≥50 in all the samples were used to calculate the
normalization factor. Expressed data were normalized using the
Median normalization. After normalization, differentially expressed
miRNAs were identified through fold change filtering. Hierarchical
clustering was performed using MeV software (v4.9, TIGR). Results
of real-time RT-PCR experiments are expressed as means ± SD.
Results
MTT results
The antitumor reducing activity of matrine
cytotoxicity (0.5, 1.0, 1.5, 2.0 and 2.5 mg/ml) to SGC-7901 cells
culture is shown in Fig. 1. Matrine
showed a dose-dependent inhibition of the growth of SGC-7901
cells.
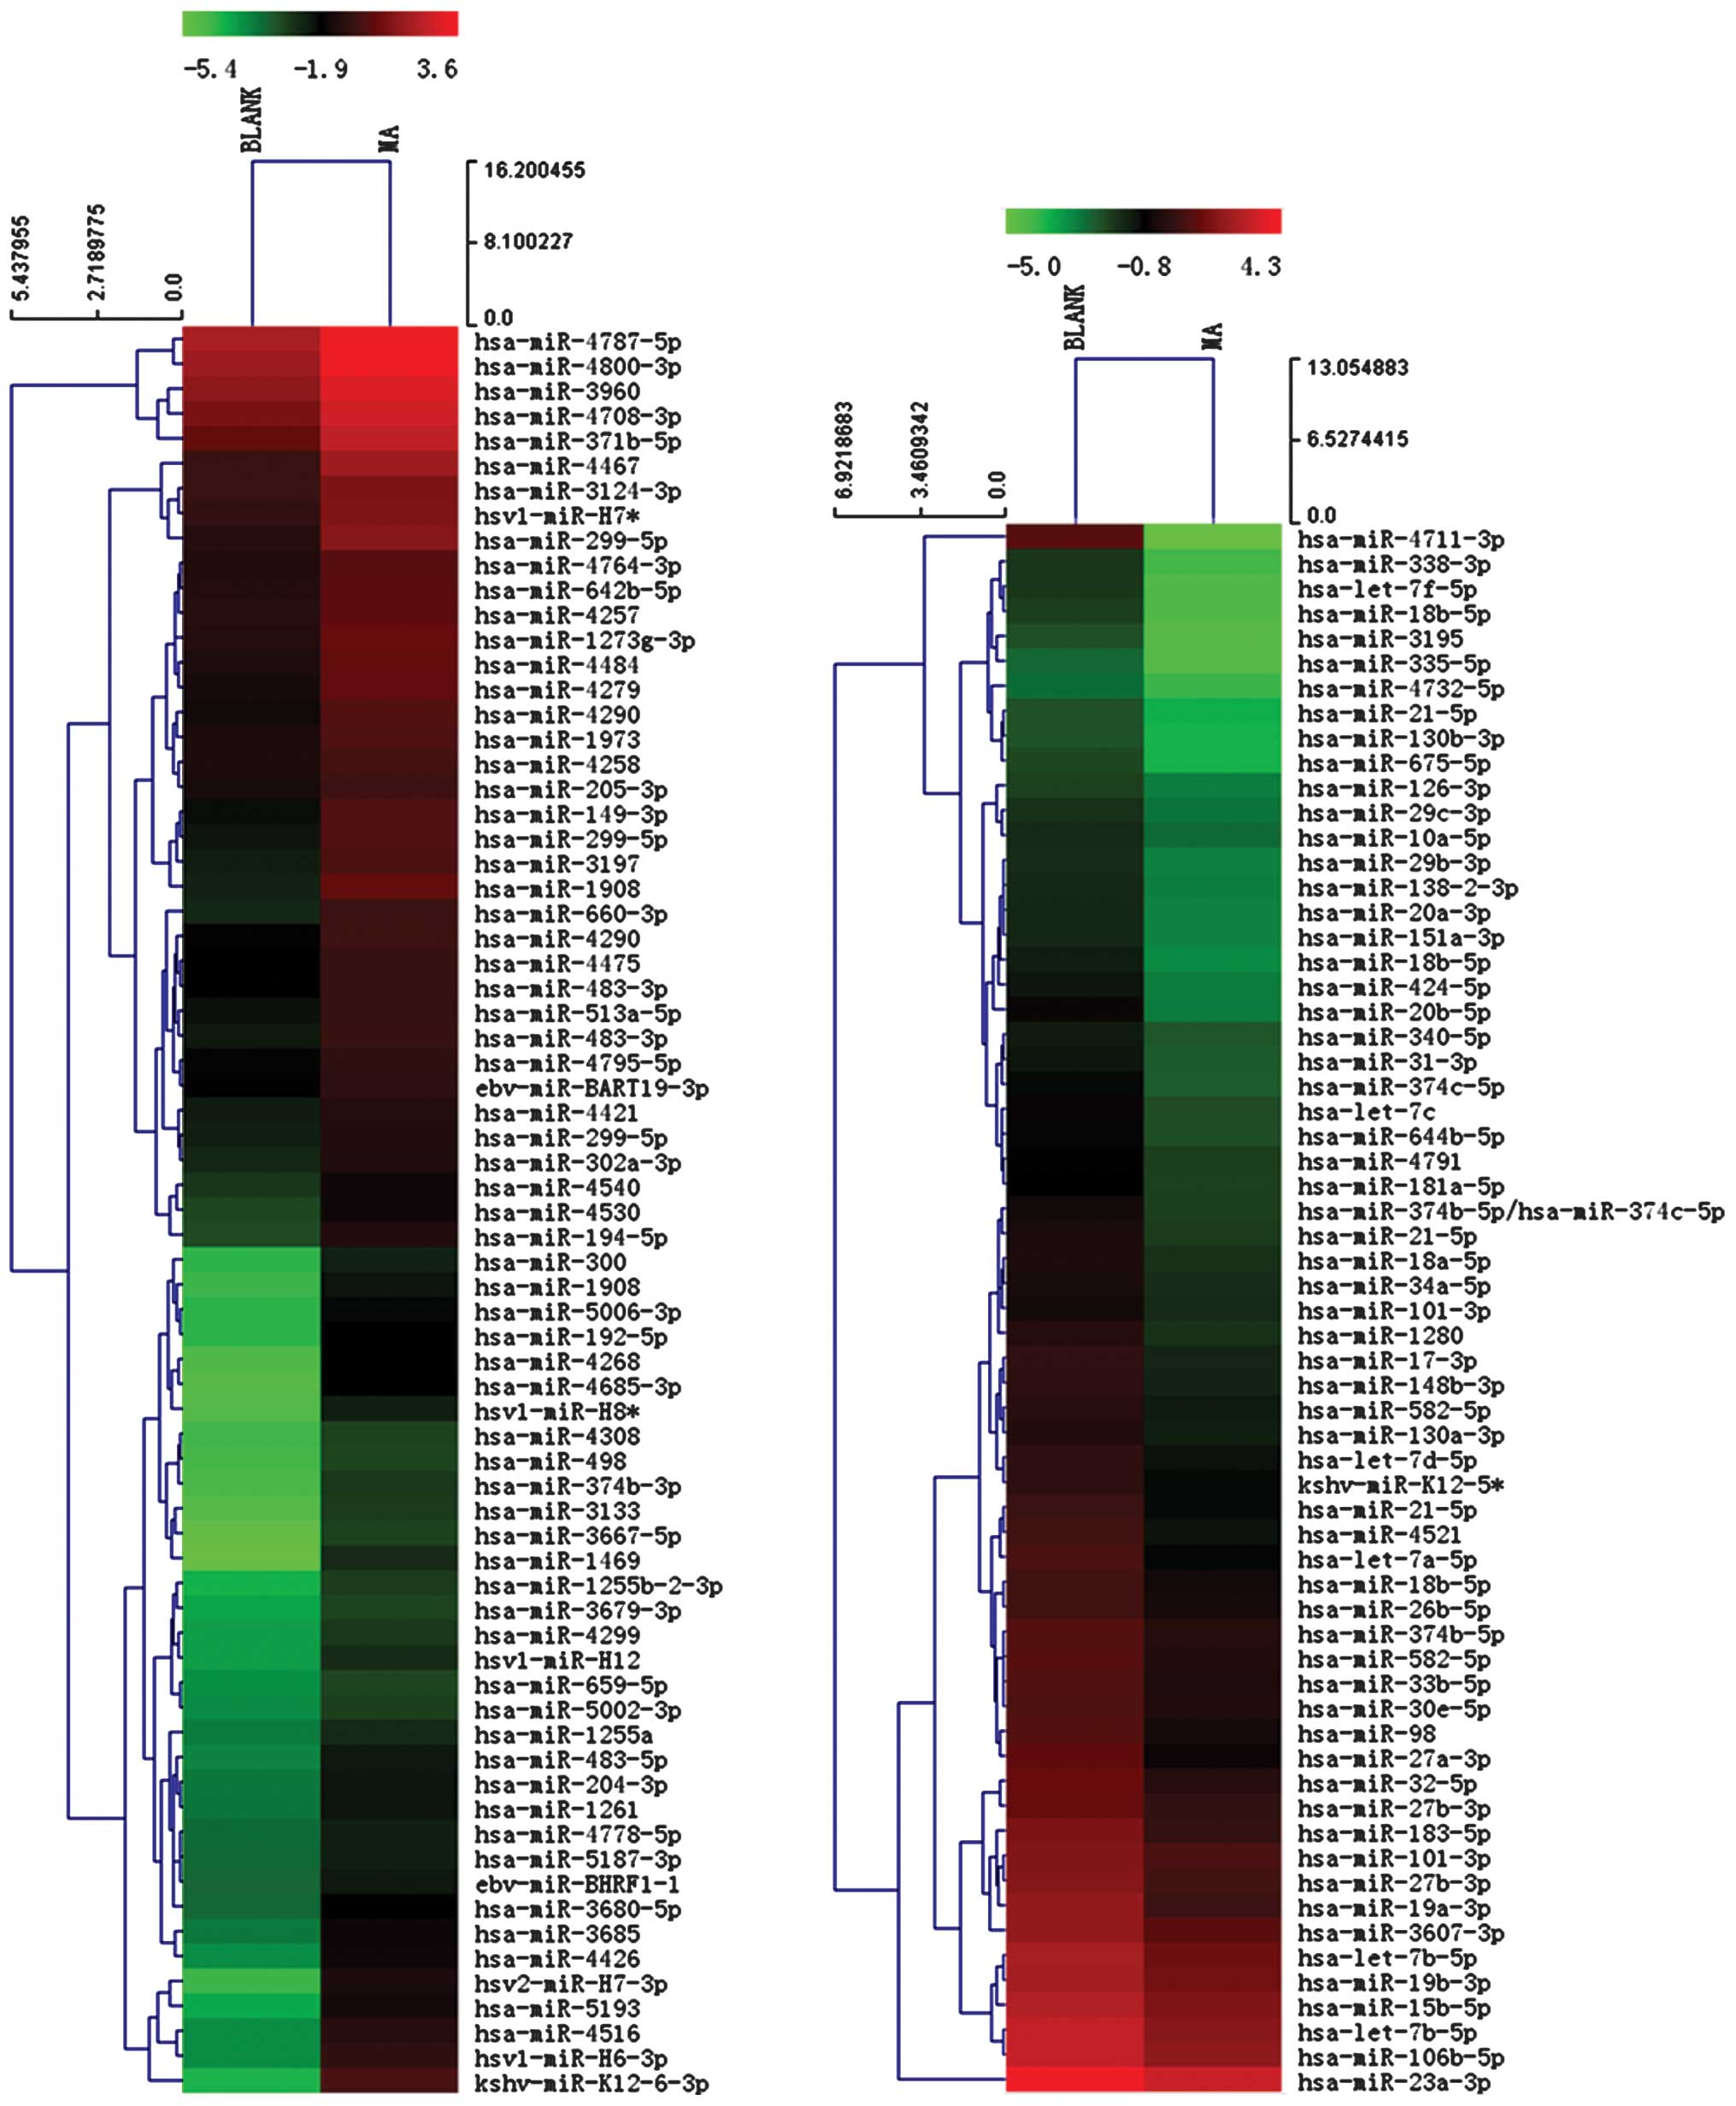
Effects of matrine on miRNA expression
profiling of SGC-7901 gastric cancer cells
After SGC-7901 cells were treated with 1.5 mg/ml
matrine for 24 h, 60 miRNAs were downregulated (fold change, ≤0.5)
and 68 miRNAs were upregulated (fold change, ≥2.0) (Fig. 2). By searching the miRFocus 2.0 and
miRWalk miRNA databases, only 38 of the 60 downregulated miRNAs and
8 of 68 upregulated miRNAs were annotated with their respective
expressions in cancer tissues or cells or the predicted and
validated target genes. Of the 46 annotated miRNAs, 25 were
upregulated and 6 were downregulated in gastric cancer tissue or
gastric cancer cell lines by miRNA microarray or RT-PCR (Tables I–III).
 | Table IExpression of 8 upregulated miRNAs
altered by microarray experiment and RT-qPCR experiment validation
after matrine treatment (1.50 mg/ml). |
Table I
Expression of 8 upregulated miRNAs
altered by microarray experiment and RT-qPCR experiment validation
after matrine treatment (1.50 mg/ml).
| miRNA | Fold change,
microarray experiment | Fold change
compared with control; mean ± SD, RT-qPCR experiment |
|---|
| miR-192-5p | 6.352408 | 5.30±0.70 |
| miR-194-5p | 3.258979 | 3.71±0.29 |
| miR-299-5p | 4.094039 | 5.22±0.37 |
| miR-300 | 4.702027 | 5.53±0.59 |
| miR-302a-3p | 2.215804 | 4.28±0.81 |
| miR-483-5p | 2.921674 | 3.60±0.82 |
| miR-498 | 3.790496 | 5.34±0.40 |
| miR-513a-5p | 2.628494 | 3.24±0.96 |
| Table IIIMatrine-regulated miRNAs and the
related documentation of expression in gastric cancer tissue or
gastric cancer cell lines identified by microarray analysis or
RT-qPCR experiments. |
Table III
Matrine-regulated miRNAs and the
related documentation of expression in gastric cancer tissue or
gastric cancer cell lines identified by microarray analysis or
RT-qPCR experiments.
| miRNA name | Matrine treatment
response | Expression in
gastric cancer tissue or cell lines | (Refs.) |
|---|
| let-7b-5p | ↓ | ↑ | (18) |
| miR-10a-5p | ↓ | ↑ | (19,20) |
| miR-15b-5p | ↓ | ↑ | (18) |
| miR-18a-5p | ↓ | ↑ | (21,22) |
| miR-18b-5p | ↓ | ↑ | (21) |
| miR-19a-3p | ↓ | ↑ | (22,23) |
| miR-19b-3p | ↓ | ↑ | (18,20,24) |
| miR-20b-5p | ↓ | ↑ | (20,21,24,25) |
| miR-21-5p | ↓ | ↑ | (20,21,24,26–30) |
| miR-23a-3p | ↓ | ↑ | (20,26) |
| miR-26b-5p | ↓ | ↑ | (5,31) |
| miR-27a-3p | ↓ | ↑ | (20,25,26,32,33) |
| miR-29b-3p | ↓ | ↓ | (18,24) |
| miR-29c-3p | ↑ | ↓ | (18,24,34,35) |
| miR-30e-5p | ↓ | ↓ | (20) |
| miR-32-5p | ↓ | ↑ | (26) |
| miR-34a-5p | ↓ | ↑ | (20,22,36) |
| miR-98 | ↓ | ↑ | (22) |
| miR-101-3p | ↓ | ↑ | (37) |
| miR-106b-5p | ↓ | ↑ | (20,22,30,36) |
| miR-130a-3p | ↓ | ↓ | (30) |
| miR-130b-3p | ↓ | ↓ | (22,30) |
| miR-148b-3p | ↓ | ↓ | (24,37) |
| miR-181a-5p | ↓ | ↑ | (22,38,39) |
| miR-338-3p | ↓ | ↑ | (25) |
| miR-340-5p | ↑ | ↑ | (21,22) |
| miR-424-5p | ↑ | ↑ | (40) |
| let-7a-5p | ↓ | ↑ | (26,32,41–43) |
| miR-192-5p | ↑ | ↑ | (20,38,44) |
| miR-194-5p | ↑ | ↑ | (20,45) |
| miR-335-5p | ↑ | ↑ | (37,45) |
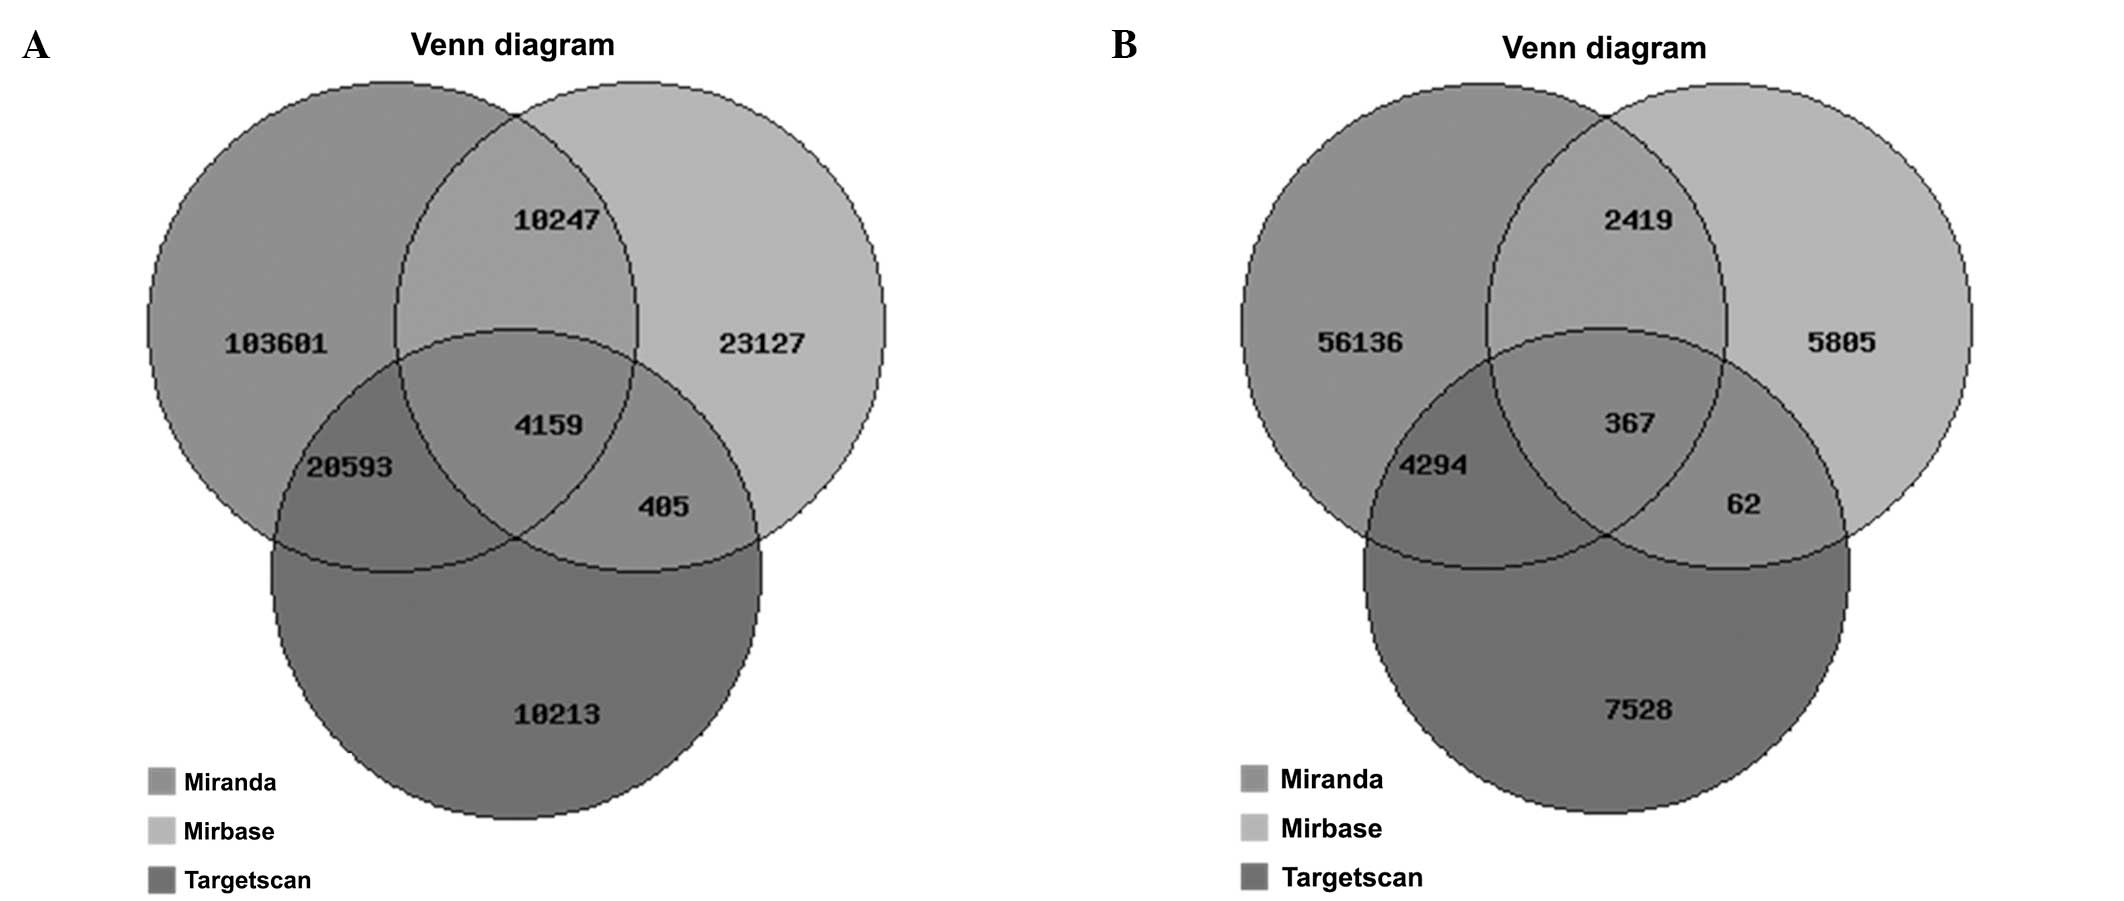
Signaling pathway analyses of
differentially expressed miRNA target genes
The miRBase, miRanda and TargetScan bioinformatical
databases were used to predict the target genes of 46 aberrantly
expressed miRNAs. The results showed that there are 4,159
overlapped target genes as predicted by the three tools for all the
downregulated miRNAs and 367 overlapped target genes for the
upregulated miRNAs that exhibited a >2-fold expression change
after matrine treatment (Fig. 3).
Possible regulation mechanisms of differentially expressed miRNAs
following matrine treatment were investigated using the
bioinformatics database, miRFocus 2.0, to select clustered
enrichment KEGG pathways of plausible targets for each miRNA. A
total of 57 enrichment pathways for predicted target genes were
identified, including 36 enrichment signaling pathways for
downregulated miRNAs. According to the Enrichment Score, the top 10
signaling pathways were the MAPK, focal adhesion, neurotrophin,
axon guidance, ECM-receptor interaction, Wnt, amino sugar and
nucleotide sugar metabolism, glycosaminoglycan biosynthesis-keratan
sulfate, and the p53 signaling pathway, as well as pathways in
cancer (Table IV).
| Table IVEnrichment KEGG pathway analysis of
downregulated miRNA target genes after matrine treatment. |
Table IV
Enrichment KEGG pathway analysis of
downregulated miRNA target genes after matrine treatment.
| ID | Pathway
definition | Fisher-P-value | FDR | Enrichment
score |
|---|
| hsa04010 | MAPK signaling
pathway, Homo sapiens | 8.71694E-07 | 0.000218795 | 6.059636 |
| hsa04510 | Focal adhesion,
Homo sapiens | 6.70214E-06 | 0.000841118 | 5.173787 |
| hsa04722 | Neurotrophin
signaling pathway, Homo sapiens | 4.59225E-05 | 0.00366527 | 4.337974 |
| hsa04360 | Axon guidance,
Homo sapiens | 6.48307E-05 | 0.00366527 | 4.18822 |
| hsa05200 | Pathways in cancer,
Homo sapiens | 7.30133E-05 | 0.00366527 | 4.136598 |
| hsa04512 | ECM-receptor
interaction, Homo sapiens | 0.000645354 | 0.02684024 | 3.190202 |
| hsa04310 | Wnt signaling
pathway, Homo sapiens | 0.000748533 | 0.02684024 | 3.125789 |
| hsa00520 | Amino sugar and
nucleotide sugar metabolism | 0.001141903 | 0.03582719 | 2.942371 |
| hsa00533 | Glycosaminoglycan
biosynthesis, keratan sulfate | 0.001916047 | 0.05343643 | 2.717594 |
| hsa04115 | p53 signaling
pathway, Homo sapiens | 0.003151918 | 0.07764395 | 2.501425 |
| hsa04930 | Type II diabetes
mellitus, Homo sapiens | 0.003402723 | 0.07764395 | 2.468173 |
| hsa04920 | Adipocytokine
signaling pathway, Homo sapiens | 0.003740387 | 0.07823643 | 2.427083 |
| hsa05211 | Renal cell
carcinoma, Homo sapiens | 0.004416889 | 0.08527994 | 2.354883 |
| hsa04141 | Protein processing
in endoplasmic reticulum | 0.007499238 | 0.1175604 | 2.124983 |
| hsa04330 | Notch signaling
pathway, Homo sapiens | 0.007665283 | 0.1175604 | 2.115472 |
| hsa04120 | Ubiquitin mediated
proteolysis, Homo sapiens | 0.008175015 | 0.1175604 | 2.087511 |
| hsa04070 |
Phosphatidylinositol signaling system | 0.008771364 | 0.1175604 | 2.056933 |
| hsa05014 | Amyotrophic lateral
sclerosis (ALS) | 0.008897519 | 0.1175604 | 2.050731 |
| hsa05202 | Transcriptional
misregulation in cancer | 0.008898995 | 0.1175604 | 2.050659 |
| hsa04974 | Protein digestion
and absorption | 0.0100545 | 0.126184 | 1.99764 |
| hsa04114 | Oocyte meiosis,
Homo sapiens | 0.01317126 | 0.1534031 | 1.880373 |
| hsa04728 | Dopaminergic
synapse, Homo sapiens | 0.01344569 | 0.1534031 | 1.871417 |
| hsa05164 | Influenza A,
Homo sapiens | 0.01526479 | 0.1599239 | 1.816309 |
| hsa03015 | mRNA surveillance
pathway, Homo sapiens | 0.01529153 | 0.1599239 | 1.815549 |
| hsa00770 | Pantothenate and
CoA biosynthesis, Homo sapiens | 0.0196612 | 0.1973984 | 1.70639 |
| hsa05219 | Bladder cancer,
Homo sapiens | 0.02059202 | 0.1987922 | 1.686301 |
| hsa05410 | Hypertrophic
cardiomyopathy (HCM) | 0.02616797 | 0.2405538 | 1.58223 |
| hsa04912 | GnRH signaling
pathway, Homo sapiens | 0.02683468 | 0.2405538 | 1.571304 |
| hsa04350 | TGF-β signaling
pathway, Homo sapiens | 0.02926174 | 0.2532654 | 1.5337 |
| hsa05216 | Thyroid cancer,
Homo sapiens | 0.03390439 | 0.2836667 | 1.469744 |
| hsa04020 | Calcium signaling
pathway, Homo sapiens | 0.03627392 | 0.2937018 | 1.440405 |
| hsa04664 | Fc ɛ RI signaling
pathway, Homo sapiens | 0.04012037 | 0.3046442 | 1.396635 |
| hsa04012 | ErbB signaling
pathway, Homo sapiens | 0.04018206 | 0.3046442 | 1.395968 |
| hsa04110 | Cell cycle, Homo
sapiens | 0.04126655 | 0.3046442 | 1.384402 |
| hsa04720 | Long-term
potentiation, Homo sapiens | 0.04408158 | 0.3161279 | 1.355743 |
| hsa00051 | Fructose and
mannose metabolism, Homo sapiens | 0.04561514 | 0.3180389 | 1.340891 |
The remaining 21 enrichment signaling pathways were
associated with the target genes of upregulated miRNAs. According
to the Enrichment Score, the top 10 signaling pathways were the
Legionellosis, notch, neurotrophin, protein processing in
endoplasmic reticulum, TGF-β, small cell lung cancer, epithelial
cell signaling in Helicobacter pylori infection, cell cycle,
RIG-I-like and pertussis signaling pathways (Table V).
| Table VEnrichment KEGG pathway analysis of
upregulated miRNA target genes after matrine treatment. |
Table V
Enrichment KEGG pathway analysis of
upregulated miRNA target genes after matrine treatment.
| ID | Pathway
definition | Fisher-P-value | FDR | Enrichment
score |
|---|
| hsa05134 | Legionellosis,
Homo sapiens | 0.000904176 | 0.2269482 | 3.043747 |
| hsa04330 | Notch signaling
pathway, Homo sapiens | 0.002738301 | 0.3436568 | 2.562519 |
| hsa04722 | Neurotrophin
signaling pathway, Homo sapiens | 0.004751378 | 0.3842182 | 2.32318 |
| hsa04141 | Protein processing
in endoplasmic reticulum | 0.007446489 | 0.3842182 | 2.128048 |
| hsa04350 | TGF-β signaling
pathway, Homo sapiens | 0.00777451 | 0.3842182 | 2.109327 |
| hsa05222 | Small cell lung
cancer, Homo sapiens | 0.009184498 | 0.3842182 | 2.036945 |
| hsa05120 | Epithelial cell
signaling in Helicobacter pylori infection | 0.01317173 | 0.4225359 | 1.880357 |
| hsa04110 | Cell cycle, Homo
sapiens | 0.01437375 | 0.4225359 | 1.84243 |
| hsa04622 | RIG-I-like receptor
signaling pathway | 0.01566376 | 0.4225359 | 1.805104 |
| hsa05133 | Pertussis, Homo
sapiens | 0.01845303 | 0.4225359 | 1.733932 |
| hsa04620 | Toll-like receptor
signaling pathway | 0.01905906 | 0.4225359 | 1.719898 |
| hsa05166 | HTLV-I infection,
Homo sapiens | 0.02046761 | 0.4225359 | 1.688933 |
| hsa04010 | MAPK signaling
pathway, Homo sapiens | 0.0231678 | 0.4225359 | 1.635115 |
| hsa04120 | Ubiquitin mediated
proteolysis, Homo sapiens | 0.02356774 | 0.4225359 | 1.627682 |
| hsa05110 | Vibrio cholerae
infection, Homo sapiens | 0.02532895 | 0.4238377 | 1.596383 |
| hsa04512 | ECM-receptor
interaction, Homo sapiens | 0.03141567 | 0.4711115 | 1.502854 |
| hsa04621 | NOD-like receptor
signaling pathway, Homo sapiens | 0.03190795 | 0.4711115 | 1.496101 |
| hsa04310 | Wnt signaling
pathway, Homo sapiens | 0.03732464 | 0.494149 | 1.428004 |
| hsa05131 | Shigellosis,
Homo sapiens | 0.03744232 | 0.494149 | 1.426637 |
| hsa05200 | Pathways in cancer,
Homo sapiens | 0.03937442 | 0.494149 | 1.404786 |
| hsa04721 | Synaptic vesicle
cycle, Homo sapiens | 0.04349567 | 0.5198769 | 1.361554 |
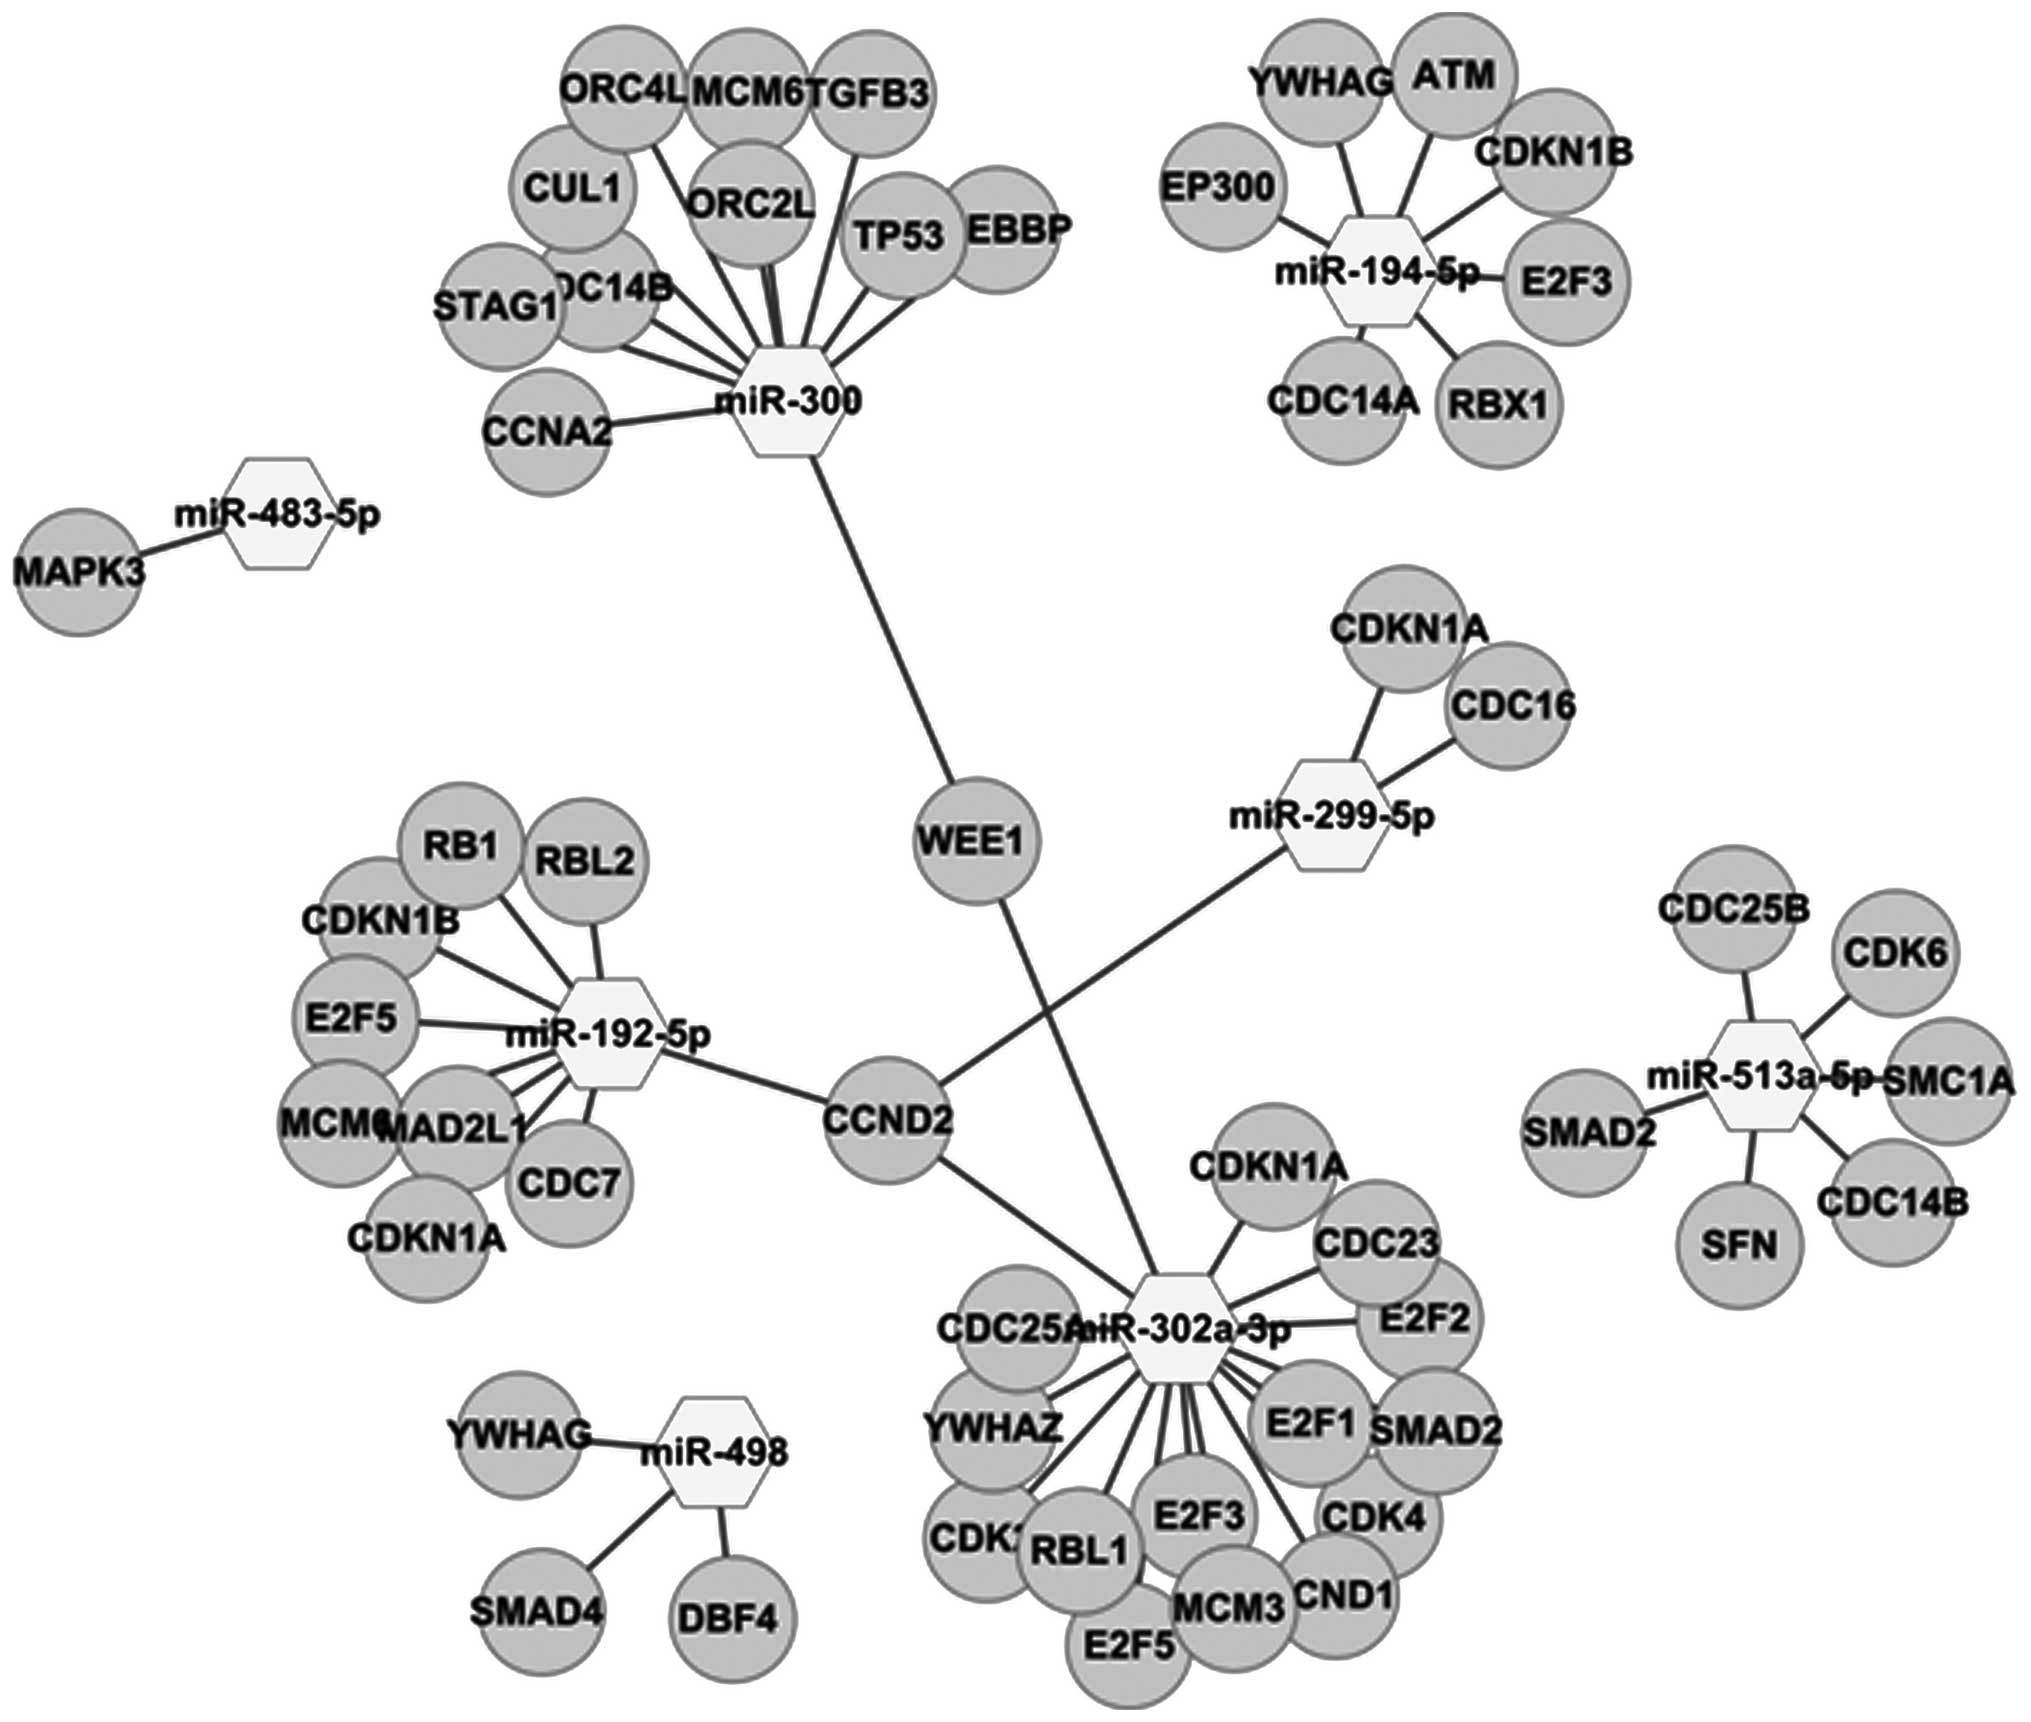
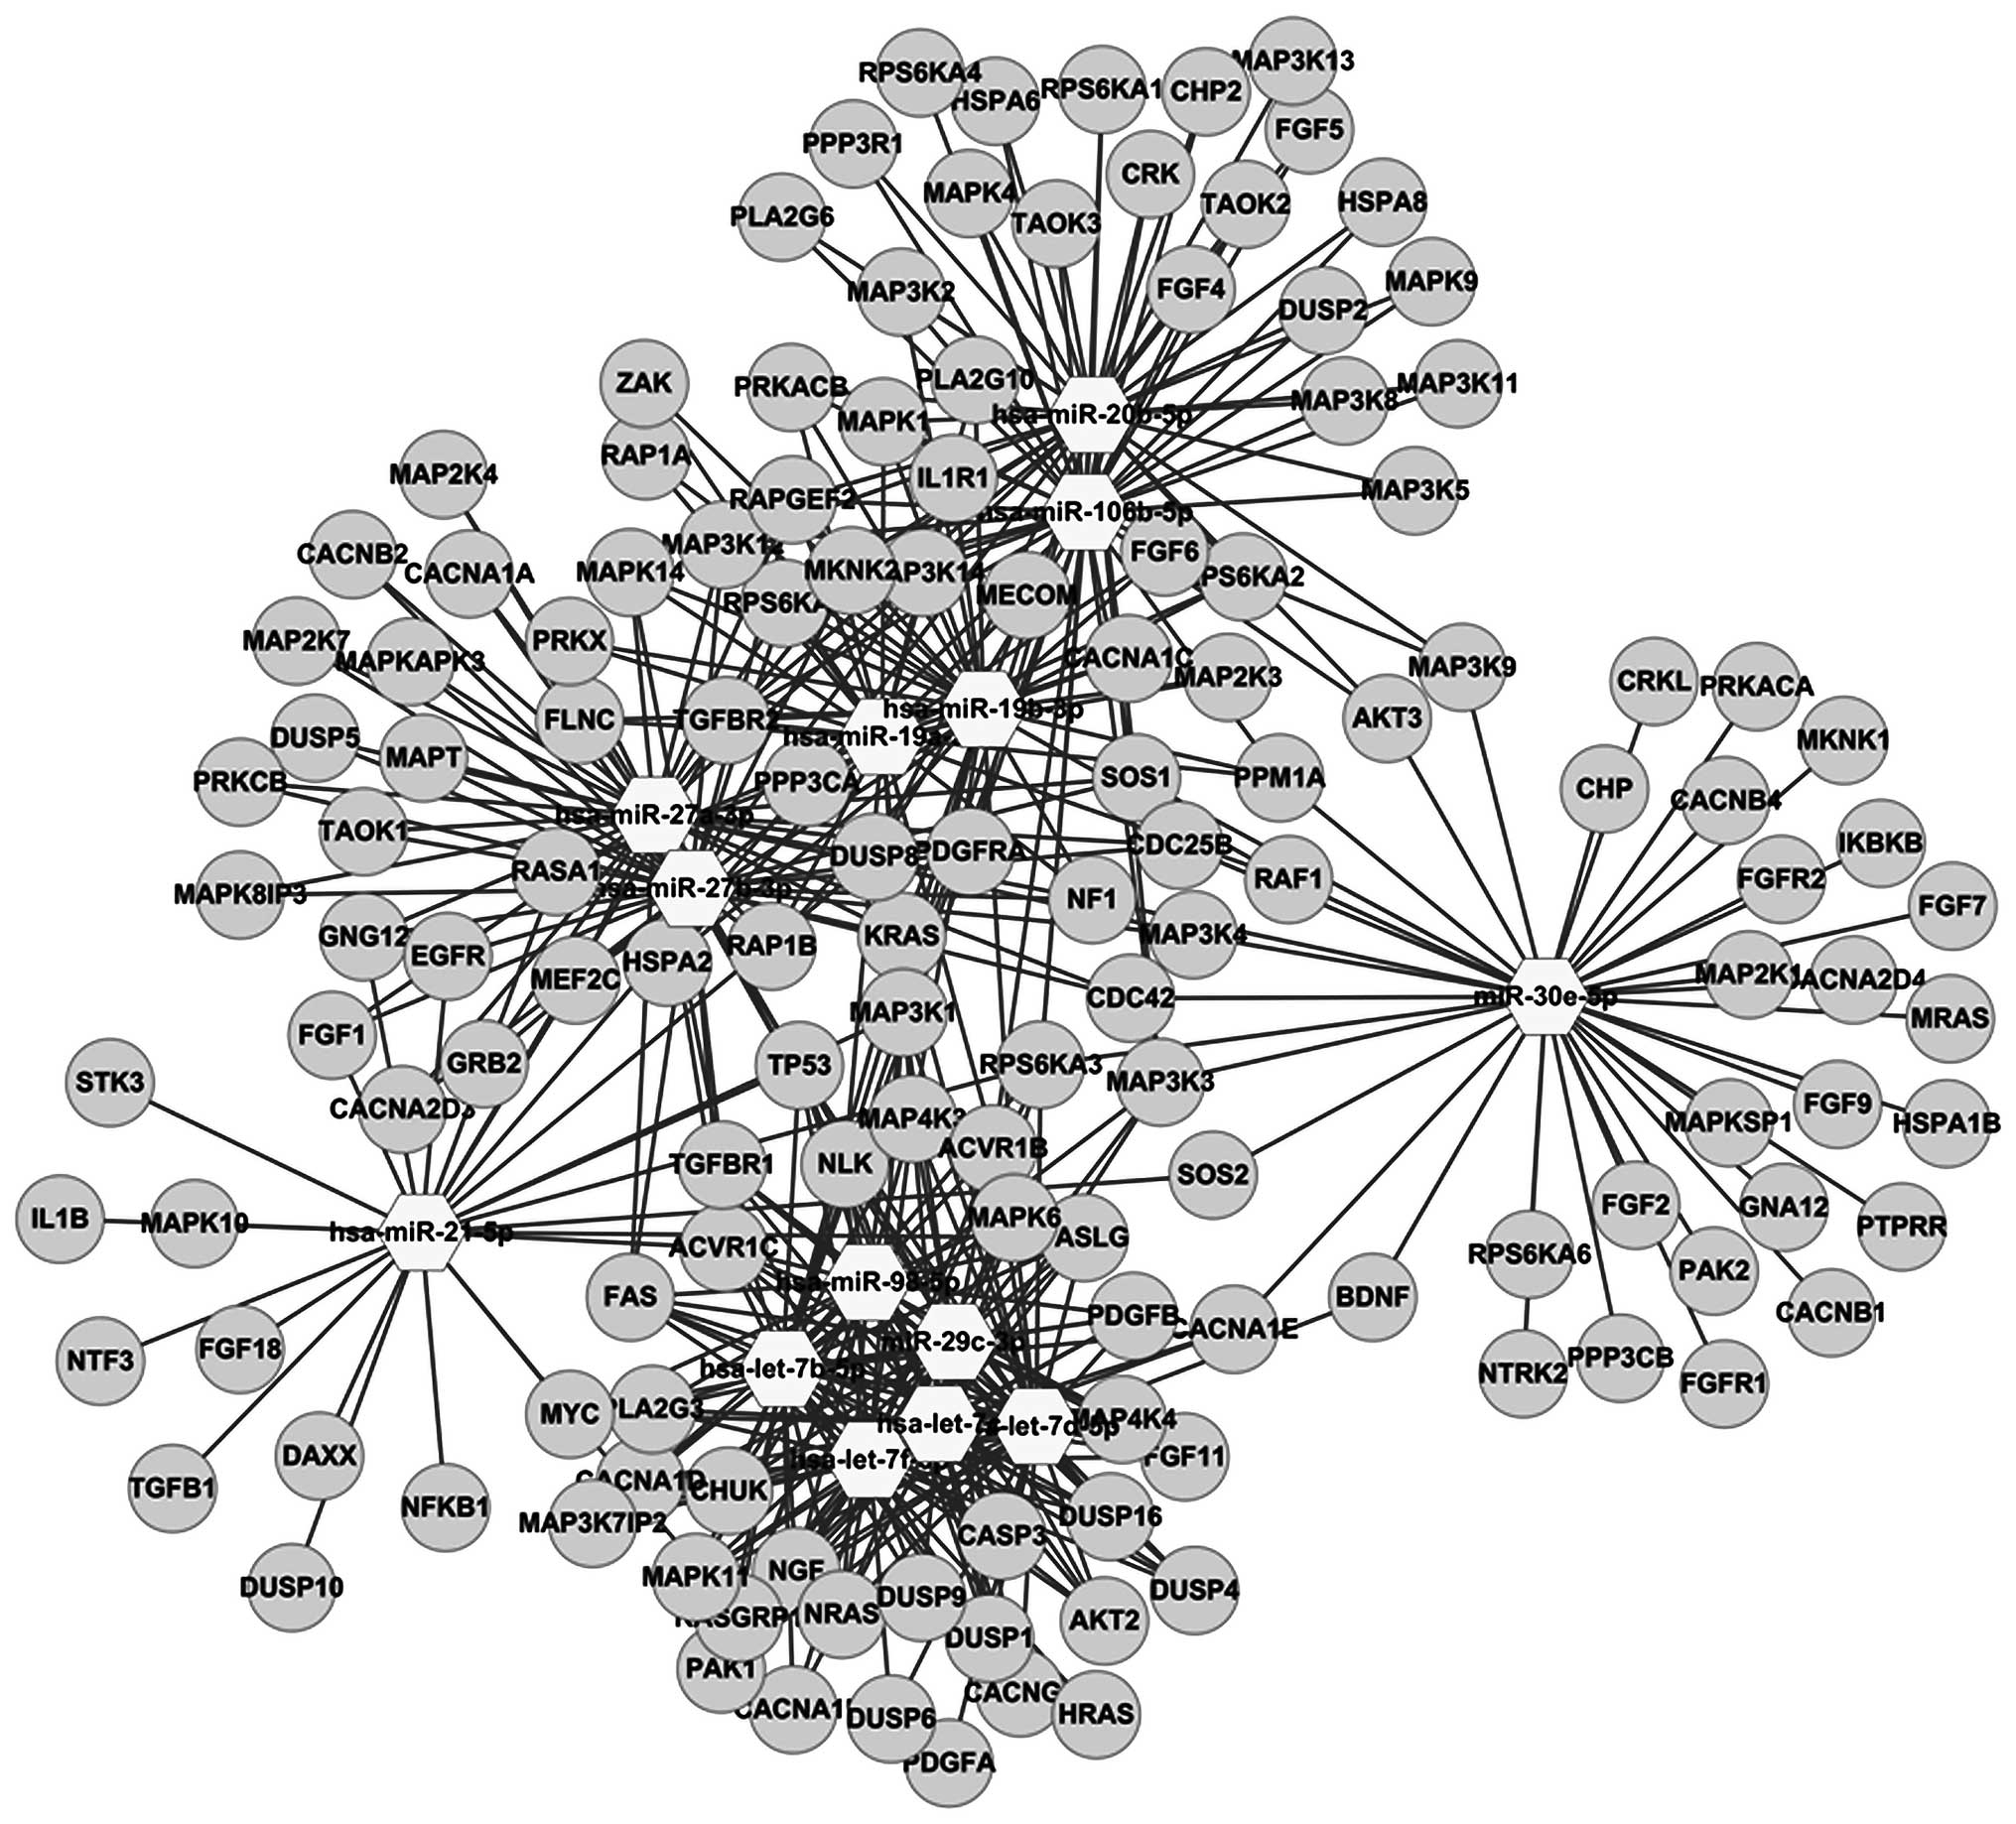
The miRFocus 2.0 database was thoroughly examined
for target genes of pathways for MAPK signaling and cell cycles.
The results showed that 196 genes are associated with MAPK
signaling pathways regulated by the 14 downregulated miRNAs, while
53 genes are associated with cell cycle pathways regulated by the 8
upregulated miRNAs. In this study, of the 159 genes 14 miRNAs were
downregulated (Figs. 4 and 5).
Quantification of dysregulated miRNAs
whose target genes are clustered in MAPK signaling pathway and cell
cycle by RT-qPCR
After SGC-7901 cells were treated with 1.5 mg/ml
matrine for 24 h, 14 miRNAs whose target genes were clustered in
the MAPK signaling pathway and 8 miRNAs whose target genes are
clustered in pathways of the cell cycle were selected to verify
their expression using RT-qPCR. The results showed the alterations
of 8 upregulated miRNAs, including miR-192-5p, miR-299-5p,
miR-194-5p, miR-300, miR-302a-3p, miR-483-5p, miR-498 and
miR-513a-5p whose target genes were clustered in the cell cycle
pathway following matrine treatment (1.5 mg/ml), were consistent
with alterations identified by miRNA microarray. However, for the
38 down-regulated miRNAs, the alterations of 14 miRNAs following
matrine treatment (1.5 mg/ml), including let-7b-5p, let-7c,
let-7d-5p, let-7f-5p, miR-19a-3p, miR-19b-3p, miR-20b-5p,
miR-21-5p, miR-27a-3p, miR-27b-3p, miR-29c-3p, miR-30e-5p,
miR-98-5p and miR-106b-5p whose target genes were clustered in the
MAPK signaling pathway, were consistent with alterations identified
by miRNA microarray (Tables I and
II).
| Table IIExpression of 14 downregulated miRNAs
altered by microarray experiment and qRT-PCR experiment validation
after matrine treatment (1.50 mg/ml). |
Table II
Expression of 14 downregulated miRNAs
altered by microarray experiment and qRT-PCR experiment validation
after matrine treatment (1.50 mg/ml).
| miRNA | Fold change,
microarray experiment | Fold change
compared with control; mean ± SD, qRT-PCR experiment |
|---|
| let-7b-5p | 0.458117 | 0.74±0.10 |
| let-7c | 0.376421 | 0.67±0.07 |
| let-7d-5p | 0.445587 | 0.09±0.01 |
| let-7f-5p | 0.145997 | 0.76±0.13 |
| miR-19a-3p | 0.327783 | 0.56±0.07 |
| miR-19b-3p | 0.498536 | 0.60±0.07 |
| miR-20b-5p | 0.218928 | 0.66±0.12 |
| miR-21-5p | 0.341840 | 0.58±0.08 |
| miR-27a-3p | 0.300471 | 0.56±0.04 |
| miR-27b-3p | 0.432703 | 0.51±0.05 |
| miR-29c-3p | 0.466145 | 0.78±0.07 |
| miR-30e-5p | 0.489503 | 0.82±0.05 |
| miR-98-5p | 0.386457 | 0.69±0.07 |
| miR-106b-5p | 0.475087 | 0.53±0.08 |
Discussion
Based on the miRNA microarray analysis, 128 miRNAs
with differential expression were identified after 24 h of
treatment with 1.5 mg/ml matrine. Of these, 68 were upregulated and
60 were downregulated following matrine treatment. The functions of
8 of the upregulated miRNAs and 38 of the downregulated miRNAs have
been annotated with their target genes in the miRbase miRNA
database. Of these 46 differentially expressed miRNAs with
annotations, results of RT-qPCR showed that 8 miRNAs whose target
genes were clustered in the cell cycle pathway were upregulated
after matrine treatment, while 14 miRNAs whose target genes were
clustered in the MAPK signaling pathway were downregulated after
matrine treatment.
The majority of the miRNAs that were affected by
matrine treatment were associated with the pathogenesis and
development of human gastric cancers. Of the 38 miRNAs that were
downregulated after matrine treatment, 20 were upregulated in human
gastric cancers and gastric cancer cell lines and act as oncogenes.
These include let-7b-5p, miR-10a-5p, miR-15b-5p, miR-18a-5p,
miR-18b-5p, miR-19a-3p, miR-19b-3p, miR-20b-5p, miR-21-5p,
miR-23a-3p, miR-26b-5p, miR-27a-3p, miR-27b-3p, miR-32-5p,
miR-34a-5p, miR-98, miR-106b-5p, miR-181a-5p, miR-183-5p and
miR-338-3p. Notably, matrine upregulated 5 miRNAs that have been
reported to be elevated in human gastric cancers and gastric cancer
cell lines. These include let-7a-5p, miR-192-5p, miR-194-5p,
miR-335-5p and miR-424-5p. In addition, matrine downregulated 6
miRNAs that have been reported to be reduced in human gastric
cancers and gastric cancer cell lines. These include miR-29b-3p,
miR-29c-3p, miR-30e-5p, miR-130a-3p, 130b-3p and 148b-3p (Table III) (7–34).
Bioinformatical analysis of differentially expressed miRNAs
revealed that the target genes were associated with cancer and cell
cycle pathways, as well as the MAPK, p53, TGF-β, mTOR, Wnt and
notch signaling pathways, which are involved in tumorigenesis. The
8 upregulated miRNAs and 14 downregulated miRNAs, in particular,
are involved in the cell cycle and MAPK signaling pathways and were
found to be regulated by matrine. Thus, gastric, as well as other
cancer cells may be mediated by miRNAs.
Since matrine promotes the apoptosis of Raji cells
by activated p38MAPK (46), it
suppressed the activity of ERK and increased the activities of p38
and JNK when inhibiting the proliferation of the U937 cell line,
inducing apoptosis in vitro (47). Furthermore, matrine inhibited the
migration of HUVECs induced by A549 by suppressing MAPK/ERK
signaling transduction (47). In
addition, matrine has been reported to reduce the percentage of
cells in the G2/M phase, and increase the percentage of cells
arrested in the G0/G1 phase of the cell cycle, resulting in
blocking of the cell cycle at the G0/G1 stage when treating cancer
cells, such as human SGC-7901 gastric cancer cell line (1), HT29 colon cancer cell line (14), human rhabdomyosarcoma cells
(48), PC-3 prostate cancer cell
line (11), HepG2 human hepatoma
cell line (12), human A549
adenocarcinoma lung cancer cell line (49) and the human K562 leukemia cell line
(50). Therefore, the aberrantly
expressed miRNAs whose target genes were clustered in the MAPK
signaling pathway and pathways selected for analysis of their
predicted and validated target genes by miRFocus 2.0 and miRWalk
provide further explanations of the underlying mechanism of action
and mechanisms involved in the SGC-7901 gastric cancer cell line
following matrine treatment.
Putative target miRNAs, along with target genes and
enriched KEGG pathways identified through analysis and validation
of the differentially expressed miRNAs in human SGC-7901 gastric
cancer cells that had been treated with matrine has facilitated the
possibility of finding the target of natural, chemopreventive
agents. This may provide insight into the antitumor mechanism of
action of matrine, particularly in the case of gastric cancer. In
recent years, there have been several reports of miRNA regulation
via natural, non-toxic, chemopreventive agents, including curcumin,
resveratrol, isoflavones, (−)-epigallocatechin-3-gallate (EGCG),
lycopene, 3,3′-diindolylmethane (DIM) and indole-3-carbinol (I3C)
(51,52). Thus, natural agents, including
matrine, may inhibit cancer progression, increase drug sensitivity,
reverse epithelial-mesenchymal transition (EMT), and prevent
metastasis though the modulation of miRNAs, providing promising new
therapies for the treatment of cancer.
In conclusion, matrine affects miRNA expression in
the SGC-7901 gastric cancer cell line as evidenced by miRNA
microarray and analysis of differentially expressed miRNA target
genes and enrichment pathways. These results, combined with RT-qPCR
validation and bioinformatical analyses, provide a novel and
promising approach to identify targets for matrine and/or other
natural substances, when treating cancer.
Acknowledgements
We would like to thank KangChen Bio-teck (Shanghai,
China) for microarray experiments. The present study was supported
by the Key Laboratory of TCM Pharmacology and Toxicology of Gansu
Province under the Grant Open Plan (no: ZDSYS-KJ-2012-003,
ZDSYS-KJ-2013-009).
References
|
1
|
Zhang J, Li Y, Chen X, et al: Autophagy is
involved in anticancer effects of matrine on SGC-7901 human gastric
cancer cells. Oncol Rep. 26:115–124. 2011.PubMed/NCBI
|
|
2
|
Dai ZJ, Gao J, Ji ZZ, et al: Matrine
induces apoptosis in gastric carcinoma cells via alteration of
Fas/FasL and activation of caspase-3. J Ethnopharmacol. 123:91–96.
2009. View Article : Google Scholar : PubMed/NCBI
|
|
3
|
Dai ZJ, Gao J, Wu WY, et al: [Effect of
matrine injections on invasion and metastasis of gastric carcinoma
SGC-7901 cells in vitro]. Zhong Yao Cai. 30:815–819. 2007.
|
|
4
|
Luo C, Zhong HJ, Zhu LM, et al: Inhibition
of matrine against gastric cancer cell line MNK45 growth and its
anti-tumor mechanism. Mol Biol Rep. 39:5459–5464. 2012. View Article : Google Scholar : PubMed/NCBI
|
|
5
|
Luo C, Zhu Y, Jiang T, et al: Matrine
induced gastric cancer MKN45 cells apoptosis via increasing
pro-apoptotic molecules of Bcl-2 family. Toxicology. 229:245–252.
2007. View Article : Google Scholar : PubMed/NCBI
|
|
6
|
Liu YQ, Li Y, Qin J, et al: Matrine
reduces proliferation of human lung cancer cells by inducing
apoptosis and changing miRNA expression profiles. Asian Pac J
Cancer Prev. 15:2169–2177. 2014. View Article : Google Scholar : PubMed/NCBI
|
|
7
|
Niu H, Zhang Y, Wu B, Zhang Y, Jiang H and
He P: Matrine induces the apoptosis of lung cancer cells through
downregulation of inhibitor of apoptosis proteins and the Akt
signaling pathway. Oncol Rep. 2014. View Article : Google Scholar : PubMed/NCBI
|
|
8
|
Jiang H, Hou C, Zhang S, et al: Matrine
upregulates the cell cycle protein E2F-1 and triggers apoptosis via
the mitochondrial pathway in K562 cells. Eur J Pharmacol.
559:98–108. 2007. View Article : Google Scholar : PubMed/NCBI
|
|
9
|
Zhang S, Zhang Y, Zhuang Y, et al: Matrine
induces apoptosis in human acute myeloid leukemia cells via the
mitochondrial pathway and Akt inactivation. PLoS One. 7:e468532012.
View Article : Google Scholar : PubMed/NCBI
|
|
10
|
Li LQ, Li XL, Wang L, et al: Matrine
inhibits breast cancer growth via miR-21/PTEN/Akt pathway in MCF-7
cells. Cell Physiol Biochem. 30:631–641. 2012. View Article : Google Scholar : PubMed/NCBI
|
|
11
|
Zhang P, Wang Z, Chong T and Ji Z: Matrine
inhibits proliferation and induces apoptosis of the
androgenindependent prostate cancer cell line PC-3. Mol Med Rep.
5:783–787. 2012.PubMed/NCBI
|
|
12
|
Zhang JQ, Li YM, Liu T, et al: Antitumor
effect of matrine in human hepatoma G2 cells by inducing apoptosis
and autophagy. World J Gastroenterol. 16:4281–4290. 2010.
View Article : Google Scholar : PubMed/NCBI
|
|
13
|
Liu T, Song Y, Chen H, Pan S and Sun X:
Matrine inhibits proliferation and induces apoptosis of pancreatic
cancer cells in vitro and in vivo. Biol Pharm Bull. 33:1740–1745.
2010. View Article : Google Scholar : PubMed/NCBI
|
|
14
|
Chang C, Liu SP, Fang CH, et al: Effects
of matrine on the proliferation of HT29 human colon cancer cells
and its antitumor mechanism. Oncol Lett. 6:699–704. 2013.PubMed/NCBI
|
|
15
|
Zhang Z, Wang X, Wu W, et al: Effects of
matrine on proliferation and apoptosis in gallbladder carcinoma
cells (GBC-SD). Phytother Res. 26:932–937. 2012. View Article : Google Scholar : PubMed/NCBI
|
|
16
|
Yang Z, Mu J, Chen J, et al: [Apoptosis of
U937 cell line promoted by matrine through MAPK signal transduction
pathway]. Zhongguo Zhong Yao Za Zhi. 34:1553–1556. 2009.
|
|
17
|
Zhang JW, Su K, Shi WT, et al: Matrine
inhibits the adhesion and migration of BCG823 gastric cancer cells
by affecting the structure and function of the
vasodilator-stimulated phosphoprotein (VASP). Acta Pharmacol Sin.
34:1084–1092. 2013. View Article : Google Scholar : PubMed/NCBI
|
|
18
|
Ribeiro-dos-Santos A, Khayat AS, Silva A,
et al: Ultra-deep sequencing reveals the microRNA expression
pattern of the human stomach. PLoS One. 5:e132052010. View Article : Google Scholar : PubMed/NCBI
|
|
19
|
Chen W, Tang Z, Sun Y, et al: miRNA
expression profile in primary gastric cancers and paired lymph node
metastases indicates that miR-10a plays a role in metastasis from
primary gastric cancer to lymph nodes. Exp Ther Med. 3:351–356.
2012.
|
|
20
|
Tsukamoto Y, Nakada C, Noguchi T, et al:
MicroRNA-375 is downregulated in gastric carcinomas and regulates
cell survival by targeting PDK1 and 14-3-3zeta. Cancer Res.
70:2339–2349. 2010. View Article : Google Scholar : PubMed/NCBI
|
|
21
|
Guo J, Miao Y, Xiao B, et al: Differential
expression of microRNA species in human gastric cancer versus
non-tumorous tissues. J Gastroenterol Hepatol. 24:652–657. 2009.
View Article : Google Scholar : PubMed/NCBI
|
|
22
|
Yao Y, Suo AL, Li ZF, et al: MicroRNA
profiling of human gastric cancer. Mol Med Rep. 2:963–970.
2009.PubMed/NCBI
|
|
23
|
Qin S, Ai F, Ji WF, Rao W, Zhang HC and
Yao WJ: miR-19a promotes cell growth and tumorigenesis through
targeting SOCS1 in gastric cancer. Asian Pac J Cancer Prev.
14:835–840. 2013. View Article : Google Scholar : PubMed/NCBI
|
|
24
|
Ueda T, Volinia S, Okumura H, et al:
Relation between microRNA expression and progression and prognosis
of gastric cancer: a microRNA expression analysis. Lancet Oncol.
11:136–146. 2010. View Article : Google Scholar : PubMed/NCBI
|
|
25
|
Katada T, Ishiguro H, Kuwabara Y, et al:
microRNA expression profile in undifferentiated gastric cancer. Int
J Oncol. 34:537–542. 2009.PubMed/NCBI
|
|
26
|
Li X, Luo F, Li Q, et al: Identification
of new aberrantly expressed miRNAs in intestinal-type gastric
cancer and its clinical significance. Oncol Rep. 26:1431–1439.
2011.PubMed/NCBI
|
|
27
|
Wang HJ, Ruan HJ, He XJ, et al:
MicroRNA-101 is down-regulated in gastric cancer and involved in
cell migration and invasion. Eur J Cancer. 46:2295–2303. 2010.
View Article : Google Scholar : PubMed/NCBI
|
|
28
|
Chan SH, Wu CW, Li AF, Chi CW and Lin WC:
miR-21 microRNA expression in human gastric carcinomas and its
clinical association. Anticancer Res. 28:907–911. 2008.PubMed/NCBI
|
|
29
|
Chen Z, Saad R, Jia P, et al: Gastric
adenocarcinoma has a unique microRNA signature not present in
esophageal adenocarcinoma. Cancer. 119:1985–1993. 2013. View Article : Google Scholar : PubMed/NCBI
|
|
30
|
Kim BH, Hong SW, Kim A, Choi SH and Yoon
SO: Prognostic implications for high expression of oncogenic
microRNAs in advanced gastric carcinoma. J Surg Oncol. 107:505–510.
2013. View Article : Google Scholar : PubMed/NCBI
|
|
31
|
Inoue T, Iinuma H, Ogawa E, Inaba T and
Fukushima R: Clinicopathological and prognostic significance of
microRNA-107 and its relationship to DICER1 mRNA expression in
gastric cancer. Oncol Rep. 27:1759–1764. 2012.PubMed/NCBI
|
|
32
|
Liu T, Tang H, Lang Y, Liu M and Li X:
MicroRNA-27a functions as an oncogene in gastric adenocarcinoma by
targeting prohibitin. Cancer Lett. 273:233–242. 2009. View Article : Google Scholar : PubMed/NCBI
|
|
33
|
Zhao X, Yang L and Hu J: Down-regulation
of miR-27a might inhibit proliferation and drug resistance of
gastric cancer cells. J Exp Clin Cancer Res. 30:552011. View Article : Google Scholar : PubMed/NCBI
|
|
34
|
Matsuo M, Nakada C, Tsukamoto Y, et al:
MiR-29c is downregulated in gastric carcinomas and regulates cell
proliferation by targeting RCC2. Mol Cancer. 12:152013. View Article : Google Scholar : PubMed/NCBI
|
|
35
|
Saito Y, Suzuki H, Imaeda H, et al: The
tumor suppressor microRNA-29c is downregulated and restored by
celecoxib in human gastric cancer cells. Int J Cancer.
132:1751–1760. 2013. View Article : Google Scholar : PubMed/NCBI
|
|
36
|
Osawa S, Shimada Y, Sekine S, et al:
MicroRNA profiling of gastric cancer patients from formalin-fixed
paraffin-embedded samples. Oncol Lett. 2:613–619. 2011.PubMed/NCBI
|
|
37
|
Song YX, Yue ZY, Wang ZN, et al:
MicroRNA-148b is frequently down-regulated in gastric cancer and
acts as a tumor suppressor by inhibiting cell proliferation. Mol
Cancer. 10:12011. View Article : Google Scholar : PubMed/NCBI
|
|
38
|
Chen G, Shen ZL, Wang L, Lv CY, Huang XE
and Zhou RP: Hsa-miR-181a-5p expression and effects on cell
proliferation in gastric cancer. Asian Pac J Cancer Prev.
14:3871–3875. 2013. View Article : Google Scholar : PubMed/NCBI
|
|
39
|
Zhang X, Nie Y, Du Y, Cao J, Shen B and Li
Y: MicroRNA-181a promotes gastric cancer by negatively regulating
tumor suppressor KLF6. Tumour Biol. 33:1589–1597. 2012. View Article : Google Scholar : PubMed/NCBI
|
|
40
|
Carvalho J, van Grieken NC, Pereira PM, et
al: Lack of microRNA-101 causes E-cadherin functional deregulation
through EZH2 up-regulation in intestinal gastric cancer. J Pathol.
228:31–44. 2012.PubMed/NCBI
|
|
41
|
Zhu YM, Zhong ZX and Liu ZM: Relationship
between let-7a and gastric mucosa cancerization and its
significance. World J Gastroenterol. 16:3325–3329. 2010. View Article : Google Scholar : PubMed/NCBI
|
|
42
|
Yang Q, Jie Z, Cao H, et al: Low-level
expression of let-7a in gastric cancer and its involvement in
tumorigenesis by targeting RAB40C. Carcinogenesis. 32:713–722.
2011. View Article : Google Scholar : PubMed/NCBI
|
|
43
|
Zhu Y, Xiao X, Dong L and Liu Z:
Investigation and identification of let-7a related functional
proteins in gastric carcinoma by proteomics. Anal Cell Pathol
(Amst). 35:285–295. 2012. View Article : Google Scholar : PubMed/NCBI
|
|
44
|
Chiang Y, Zhou X, Wang Z, et al:
Expression levels of microRNA-192 and -215 in gastric carcinoma.
Pathol Oncol Res. 18:585–591. 2012. View Article : Google Scholar : PubMed/NCBI
|
|
45
|
Song Y, Zhao F, Wang Z, et al: Inverse
association between miR-194 expression and tumor invasion in
gastric cancer. Ann Surg Oncol. 19(Suppl 3): S509–517. 2012.
View Article : Google Scholar : PubMed/NCBI
|
|
46
|
Liu ZS, Luo ZQ, Xie B, et al: [Effect and
mechanism of matrine on apoptosis of Raji cells]. Zhong Yao Cai.
34:576–579. 2011.
|
|
47
|
Lu J, Luo Q, Cheng P, Liu X, Bai M and Tu
M: [The Role of Matrine and Mitogen-Ativated Protein
Kinase/Extracellular Signal-Regulated Kinase Signal Transduction in
the Inhibition of the Proliferation and Migration of Human
Umbilical Veins Endothelial Cells Induced by Lung Cancer cells].
Zhongguo Fei Ai Za Zhi. 12:747–752. 2009.
|
|
48
|
Guo L, Xue TY, Xu W and Gao JZ: Matrine
promotes G0/G1 arrest and down-regulates cyclin D1 expression in
human rhabdomyosarcoma cells. Panminerva Med. 55:291–296.
2013.PubMed/NCBI
|
|
49
|
Chen Q, Liu L and Cao H: [Effects of
matrine on the growth inhibition, c-myc and hTERT protein
expression in human adenocarcinoma lung cancer cell line A549].
Zhongguo Fei Ai Za Zhi. 11:559–562. 2008.
|
|
50
|
Huang FX, Zhang Y and Wang WJ: [Effects of
matrine on cgi-100 gene expression and proliferation in K562
cells]. Zhongguo Shi Yan Xue Ye Xue Za Zhi. 16:525–530. 2008.
|
|
51
|
Bae S, Lee EM, Cha HJ, et al: Resveratrol
alters microRNA expression profiles in A549 human non-small cell
lung cancer cells. Mol Cells. 32:243–249. 2011. View Article : Google Scholar : PubMed/NCBI
|
|
52
|
Sethi S, Li Y and Sarkar FH: Regulating
miRNA by natural agents as a new strategy for cancer treatment.
Curr Drug Targets. 14:1167–1174. 2013. View Article : Google Scholar : PubMed/NCBI
|