Introduction
Osteosarcoma is a primary tumor of the bone that
accounts for 5% of all childhood cancers and represents the fifth
most common tumor in young adults (1). It usually arises in the metaphysis of
long bones such as the distal femur, proximal tibia and proximal
humerus (2). Modified chemotherapy
and surgical procedures, accompanied by the application of
radiotherapy, have not led to any major improvements in the
treatment outcome and quality of life of osteosarcoma patients
(3). Therfore, it is urgent to
further understand the mechanisms involved in the tumorigenesis of
osteosarcoma in order to identify new therapeutic targets (4).
The inhibitor of growth (ING) family proteins are
candidate tumor suppressors that associate with histone
acetyltransferase (HAT), histone deacetylase and factor
acetyltransferase complexes (5).
Inhibitor of growth 2 (ING2) is the second member of the ING family
of candidate tumor-suppressor genes ING1 to ING5 (6–8). ING2
consists of three exons, exon 1a, 1b, and 2, resulting in two
transcribed isoforms: ING2a and ING2b (9). Many studies have found that ING2
expression is decreased or lost in human tumors, which suggests a
role for ING2 as a tumor-suppressor gene. Borkosky et al
(10) found that ING2 LOH may occur
in late stages during head and neck squamous cell carcinoma
progression. In addition, Zhang et al (11) found that ING2 expression was
significantly decreased in hepatocellular carcinoma (HCC) and may
lead to an unfavorable prognosis. However, in a study by Kumamoto
et al (12), the authors
confirmed that ING2 is upregulated in colon cancer. To our
knowledge, no related study has demonstrated a relationship between
ING2 and osteosarcoma. Our results could help in elucidating the
functional role of ING2 in osteosarcoma.
Materials and methods
Tumor cells and osteosarcoma tissue
samples
The human osteosarcoma cell line, HOS, was obtained
from the American Tissue Type Collection (ATCC, Bethesda, MD, USA)
and was maintained in minimum essential medium (MEM; Life
Technologies, Gaithersburg, MD, USA) supplemented with 10% (v/v)
fetal bovine serum (FBS) and antibiotics (100 U/ml of penicillin
and 100 mg/ml of streptomycin) at 37°C in a 5% (v/v) CO2
incubator. All the samples of osteosarcoma tissues and adjacent
samples of non-tumorous tissues were obtained from the First
Hospital of China Medical University from July 2003 to July 2013,
following consent of each patient. The procedure was approved by
the China Medical University Ethics Committee.
Real-time PCR
Total RNA was isolated using an RNeasy Mini kit
(Biomed, Beijing, China). First-strand cDNA was reverse transcribed
with 1 μg of total RNA, using the Takara reverse transcription kit
(Takara, Dalian, China) and oligo (dT)15 primers (Takara). The
resultant cDNA was then used for quantitative PCR reactions. The
ING2 primers were: 5′-GCGAGAGCTGGACAACAAAT-3′ (sense) and
5′-GACACTTGGTTGCATAAGCAG-3′ (antisense). The housekeeping gene,
GAPDH, was used as an internal control for normalization of the
results. The GAPDH primers were: 5′-AGAAGGCTGGGGCTCATTTG-3′ (sense)
and 5′-CGATCCACACGGAGTACTTGC-3′ (antisense). Amplification of ING2
and GADPH was performed with 1 cycle at 95°C for 10 min, and 40
cycles of 95°C for 15 sec and 60°C for 60 sec. Calculation of the
relative expression of each transcript was performed using the
2−ΔΔCt method.
Plasmids and transfection
The plasmids, pcDNA3.1-ING2 and pcDNA3.1-ING2-ΔNLS,
were kindly provided by Mr. Xin-Yu Zhang (China Medical University,
Shenyang). Transfection of the plasmids into HOS cells was
performed using Lipofectamine™ 2000 (Invitrogen Gibco, Carlsbad,
CA, USA) according to the manufacturer’s instructions. Cell lines
transfected with pcDNA3.1 were used as a mock.
Western blot analysis
Nuclear and cytoplasmic proteins were isolated from
the cells using the PARIS™ (Protein and RNA Isolation System) kit
(Ambion Inc., Austin, TX, USA). Equal amounts (30 μg) of cell
lysates were separated by 10% SDS-polyacrylamide gel
electrophoresis and transferred to polyvinylidene difluoride
membranes, and incubated with the following specific antibodies.
The ING2 antibody (sc-67646; Santa Cruz Biotechnology, Santa Cruz,
CA, USA) was used to identify transfection efficiency. β-actin and
β-tubulin (sc-130675 and sc-9104, respectively; both from Santa
Cruz Biotechnology) were used as internal controls. The reaction
was followed by probing with peroxidase-coupled secondary
antibodies including anti-rabbit IgG or anti-mouse IgG at dilutions
ranging from 1:1,000 to 1:2,000 (Amersham Biosciences, Needham, MA,
USA), and the binding results were visualized by enhanced
chemiluminescence (Amersham Pharmacia, Piscataway, NJ, USA).
Immunofluorescence
Cells were washed with PBS, fixed in 4%
paraformaldehyde, permeabilized in 1% Triton X-100 for 5 min, and
blocked with 5% bovine serum albumin in PBS containing 0.5% Triton
X-100 for 1 h. ING2 was detected using anti-ING2 (Santa Cruz
Biotechnology) for 1 h at room temperature. Cells were washed with
PBS and incubated with Alexa Fluor® 488 donkey anti-goat
IgG (H+L) for 1 h at room temperature. Photographic images were
captured using an Olympus CX71 fluorescence microscope (Olympus,
Tokyo, Japan).
Physico-chemical profiles of ING2
Physico-chemical profiles, such as titration curve,
hydrophobicity (13), antigenicity
(14), fexibility (15), and solvent accessibility (16), were analyzed using Antheprot 5.0
software.
The PHYRE database was used to generate
predicted structural models
The protein sequence of ING2 was obtained from
Pubmed (http://www.ncbi.nlm.nih.gov/protein/AAQ13674.1) and
submitted to Protein Homology/analogY Recognition Engine (PHYRE
ver. 2). Based on the homology sequence in the PHYRE server, the
three-dimensional structure of ING2 protein was predicted.
Cell cycle and apoptosis analyses
Cells were collected in PBS and fixed on ice with 1%
paraformaldehyde, followed by 70% cold ethanol containing 10 μg/ml
RNase. Then the cells were stained with 50 μg/ml propidium iodide
(PI; KeyGen, Nanjing, China) for 15 min at room temperature for
cell cycle analysis. The apoptotic cells were detected with Annexin
V-FITC/PI double staining. Based on the manufacturer’s instructions
for the apoptosis assay kit (KeyGen), the stained cells were
analyzed by flow cytometry. Data analysis was performed with
CellQuest software (BD Biosciences, Rockville, MD, USA).
SA-β-gal analysis
For SA-β-gal staining, cells were washed twice in
PBS, fixed for 3–5 min at room temperature in 3% formaldehyde and
washed again with PBS. Then cells were incubated overnight at 37°C
without CO2 in a freshly prepared SA-β-gal-staining
solution as previously described (17).
DNA fiber spreading
Asynchronous cells were pulsed sequentially with 100
mM BrdU (Zymed Laboratories, San Francisco, CA, USA) and 100 mM IdU
(Sigma Aldrich, St. Louis, MO, USA) for 20 min each. Cells were
collected and DNA fibers were spread onto microscope slides as
described by Jackson and Pombo (18).
Affymetrix GeneChip technology
The total RNA was extracted from the cells as
described above. The total RNA samples were then analyzed by
CapitalBio Corp., for GeneChip (Affymetrix, Santa Clara, CA, USA)
assay, and each treatment had 3 biological replicates that were
measured in this manner. Gene expression analysis was performed
using the Affymetrix GeneChip, according to the laboratory methods
in the Affymetrix GeneChip expression manual. Gene expression
analysis was performed using triple arrays and triple independent
mRNA samples for each treatment. Microarray data were analyzed
using Bio MAS 3.0 software (CapitalBio, Beijing, China). Using the
criterion of cutoff limitation as a fold change ≥2 or ≤0.5 and
Q-value ≤5%, differentially expressed genes were screened and
clustered.
Statistics and survival analysis
Overall survival rates were determined using the
Kaplan-Meier estimator. Kaplan-Meier survival plots were generated,
and comparisons were made with log-rank statistics. For all
analyses, a P value <0.05 was considered to indicate a
statistically significant difference. All of the statistical
analyses and graphics were performed with GraphPad Prism 5.
Results
Reduced ING2 nuclear expression in
osteosarcoma
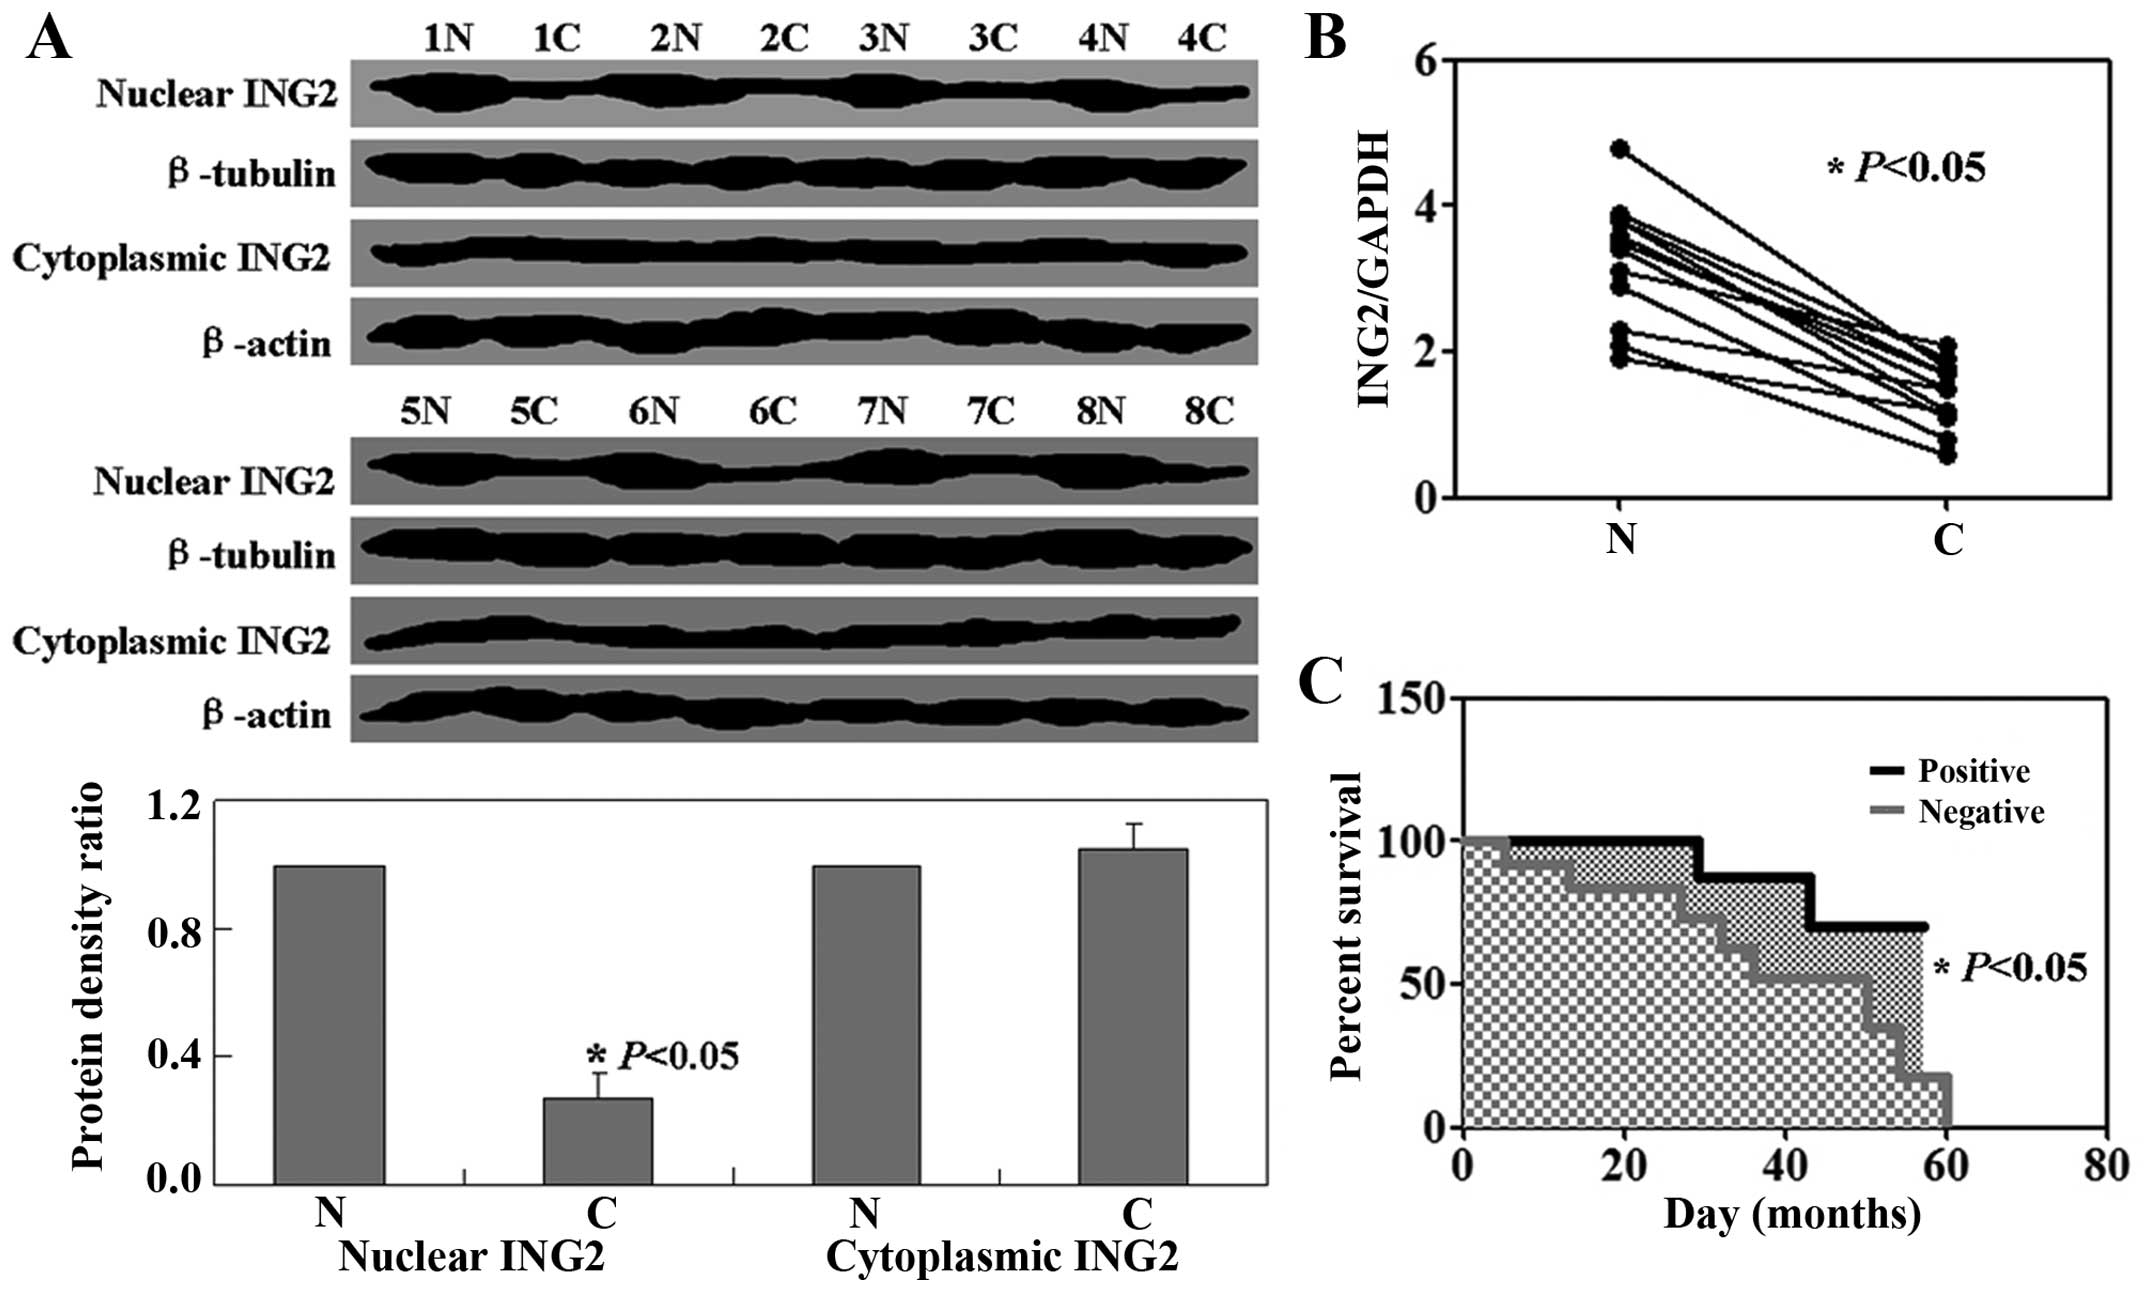
We examined ING2 expression in osteosarcoma by
western blot analysis and real-time PCR. Results showed that the
levels of ING2 mRNA and nuclear expression were decreased in tumor
tissues relative to the levels in the normal tissues (P<0.05,
Fig. 1A and B). There was no
significant difference in ING2 cytoplasmic expression between the
normal tissues and tumor tissues (P>0.05, Fig. 1A). Follow-up information was
available for the patients for periods ranging from 1 month to 5
years (median, 21 months). A Kaplan-Meier analysis showed that ING2
nuclear expression was closely correlated with the favorable
prognosis of patients with osteosarcoma, whereas negative ING2
nuclear expression was correlated with a poor prognosis (P<0.05,
Fig. 1C).
ING2 expression in HOS cells
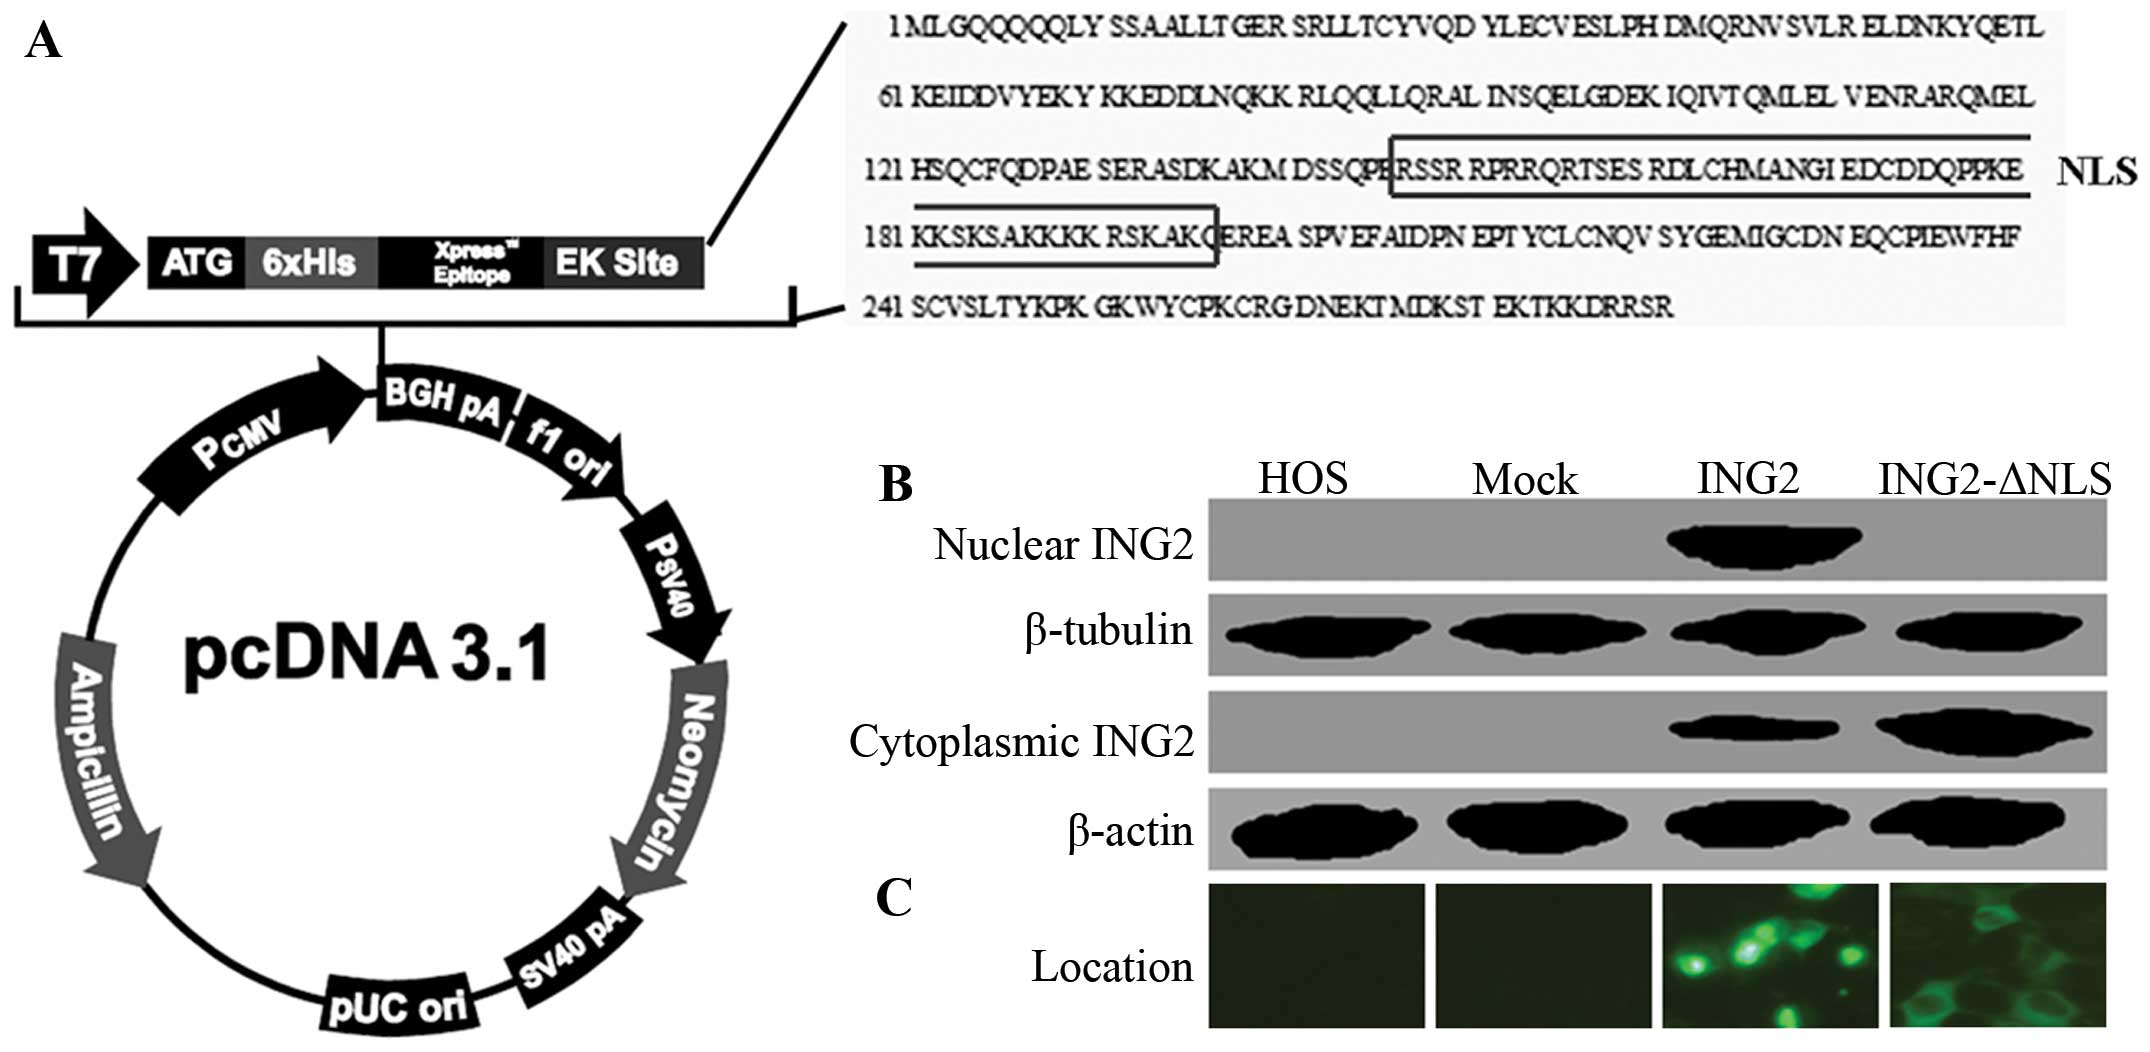
HOS cells were transfected with the pcDNA3.1-ING2 or
pcDNA3.1-ING2-ΔNLS expression vector. Schematic illustration of
pcDNA3.1-ING2 and pcDNA3.1-ING2-ΔNLS are shown in Fig. 2A. The levels of ING2 cytoplasmic and
nuclear expression were measured using western blotting (Fig. 2B). As shown in Fig. 2C, the results of immunofluorescence
confirmed the location of ING2 in the HOS cells after transfection.
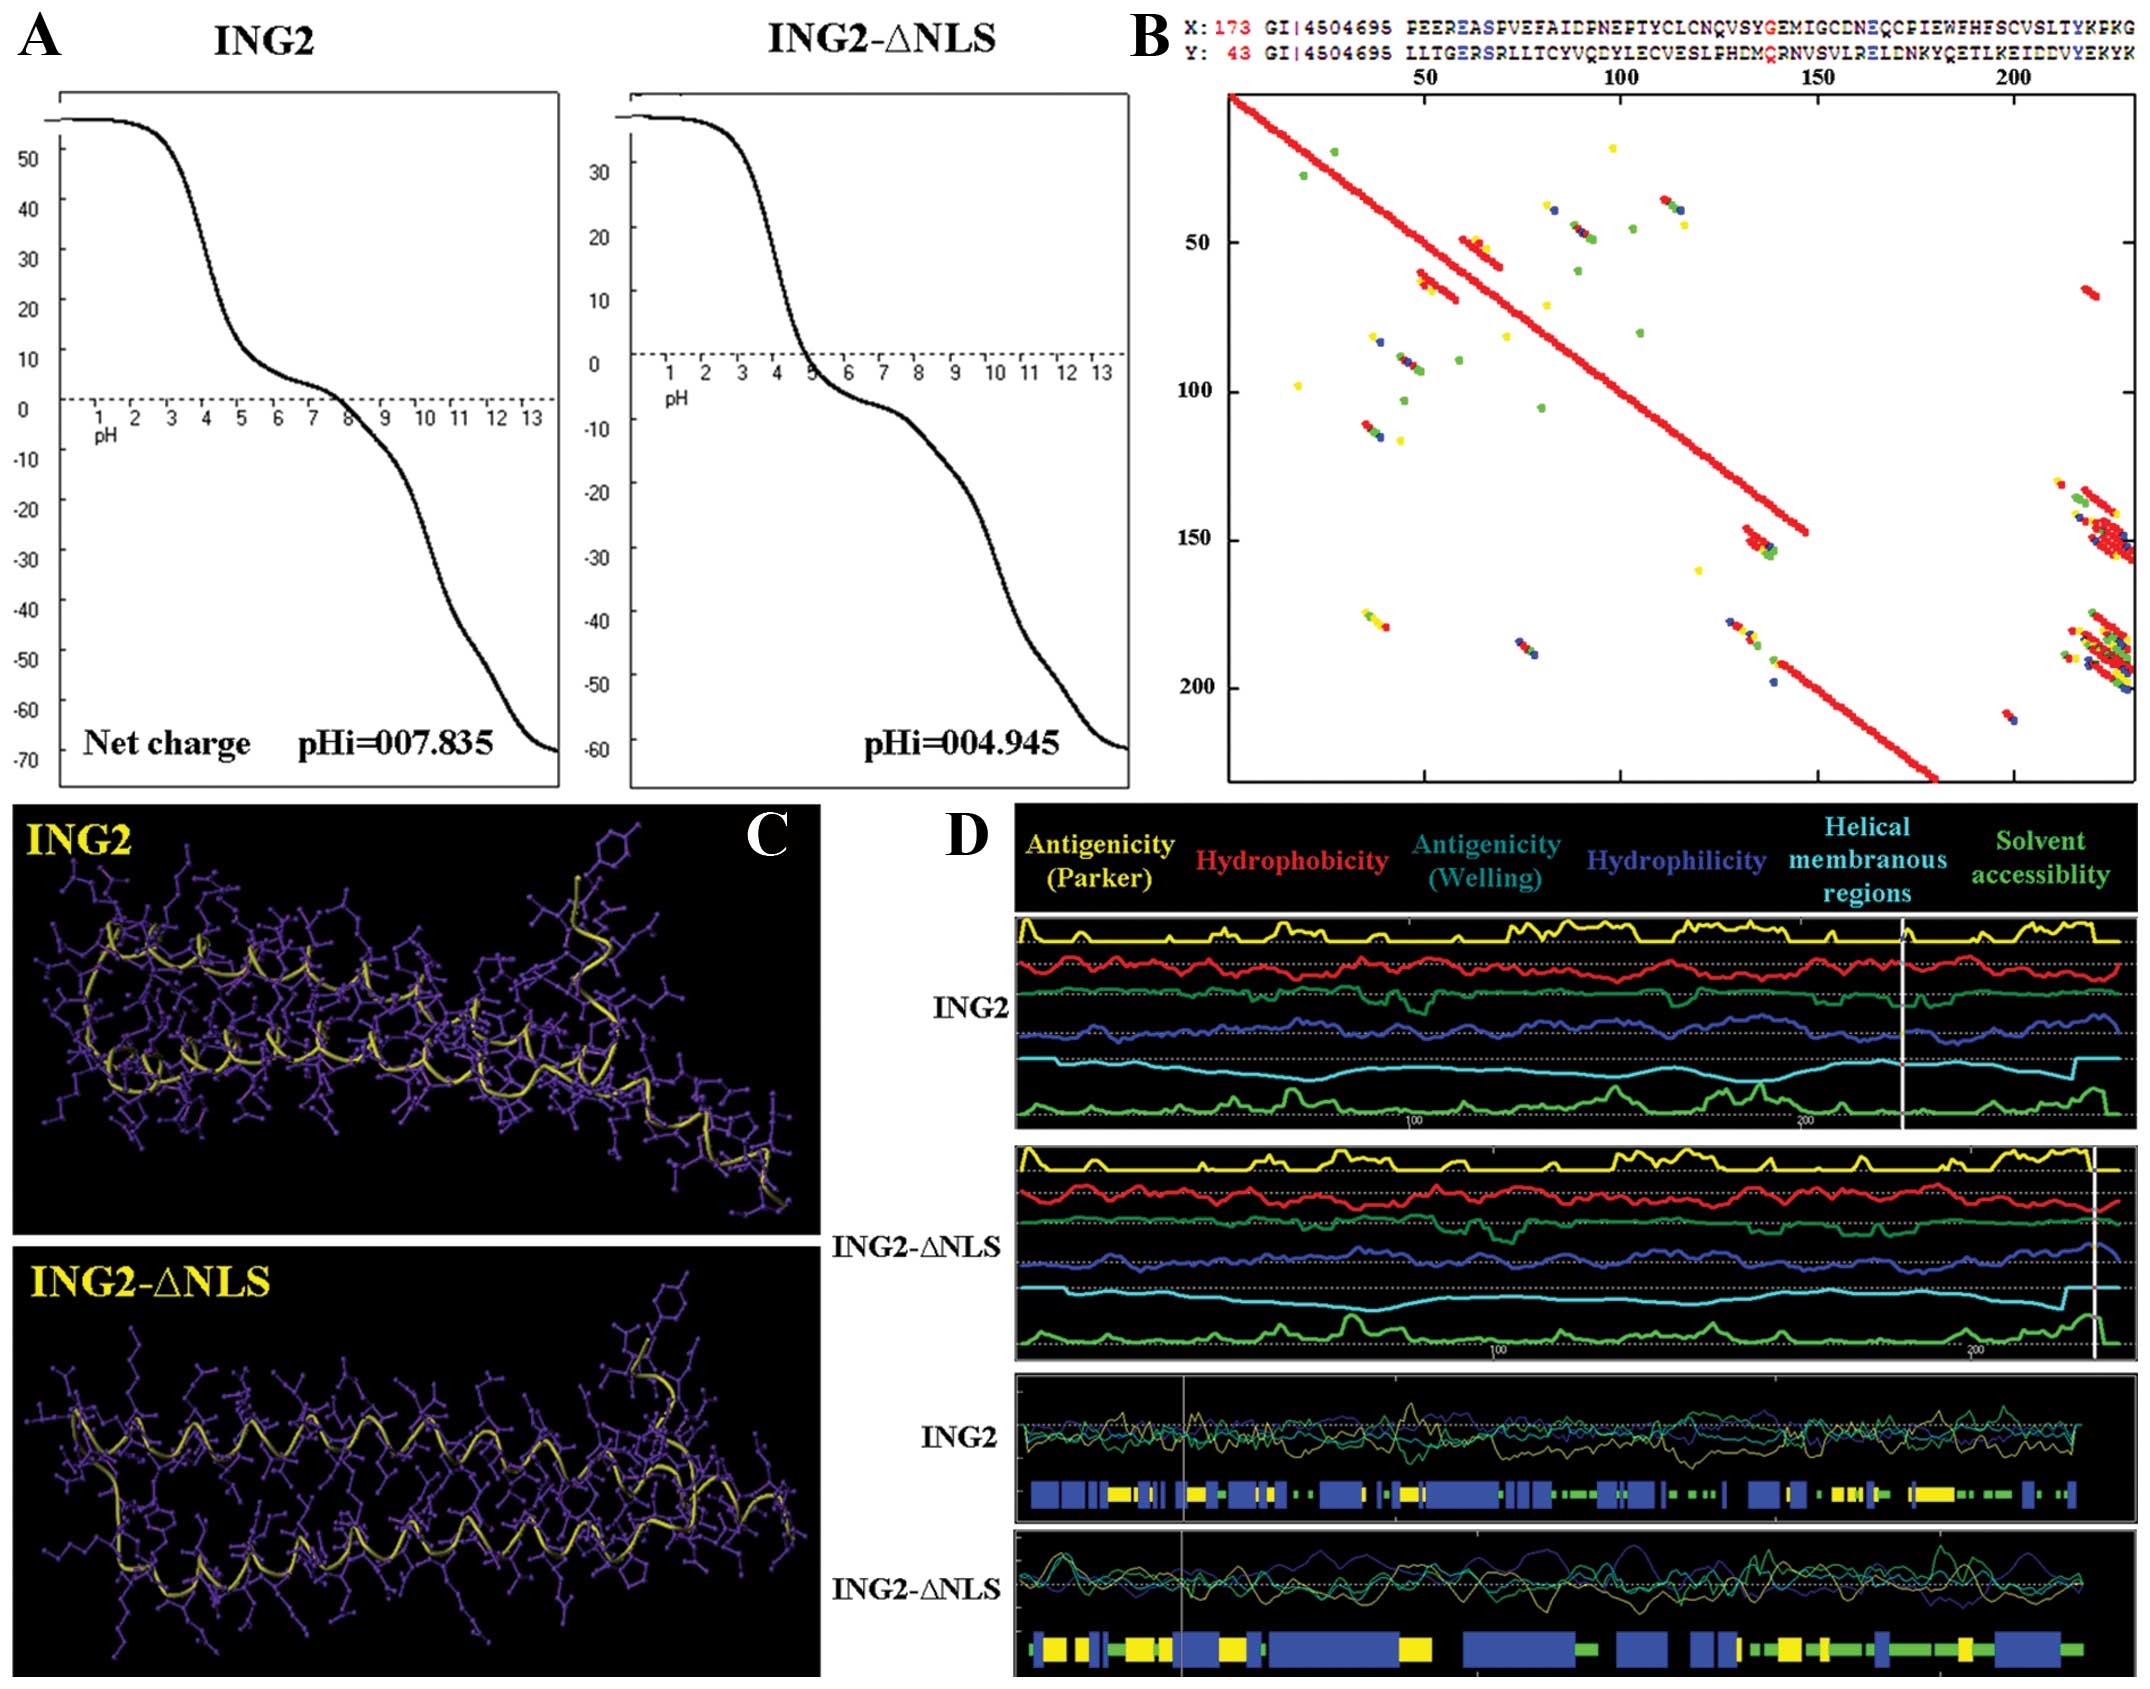
Furthermore, titration curve, hydrophobicity, antigenicity,
fexibility and solvent accessibility of the ING2 and ING2-ΔNLS
proteins did not have a significant difference as assessed using
Antheprot 5.0 software (Fig. 3A, B and
D). Moreover, the 3D-structures of the two proteins were
similar to each other (Fig.
3C).
Effect of ING2 expression on HOS cells in
vitro
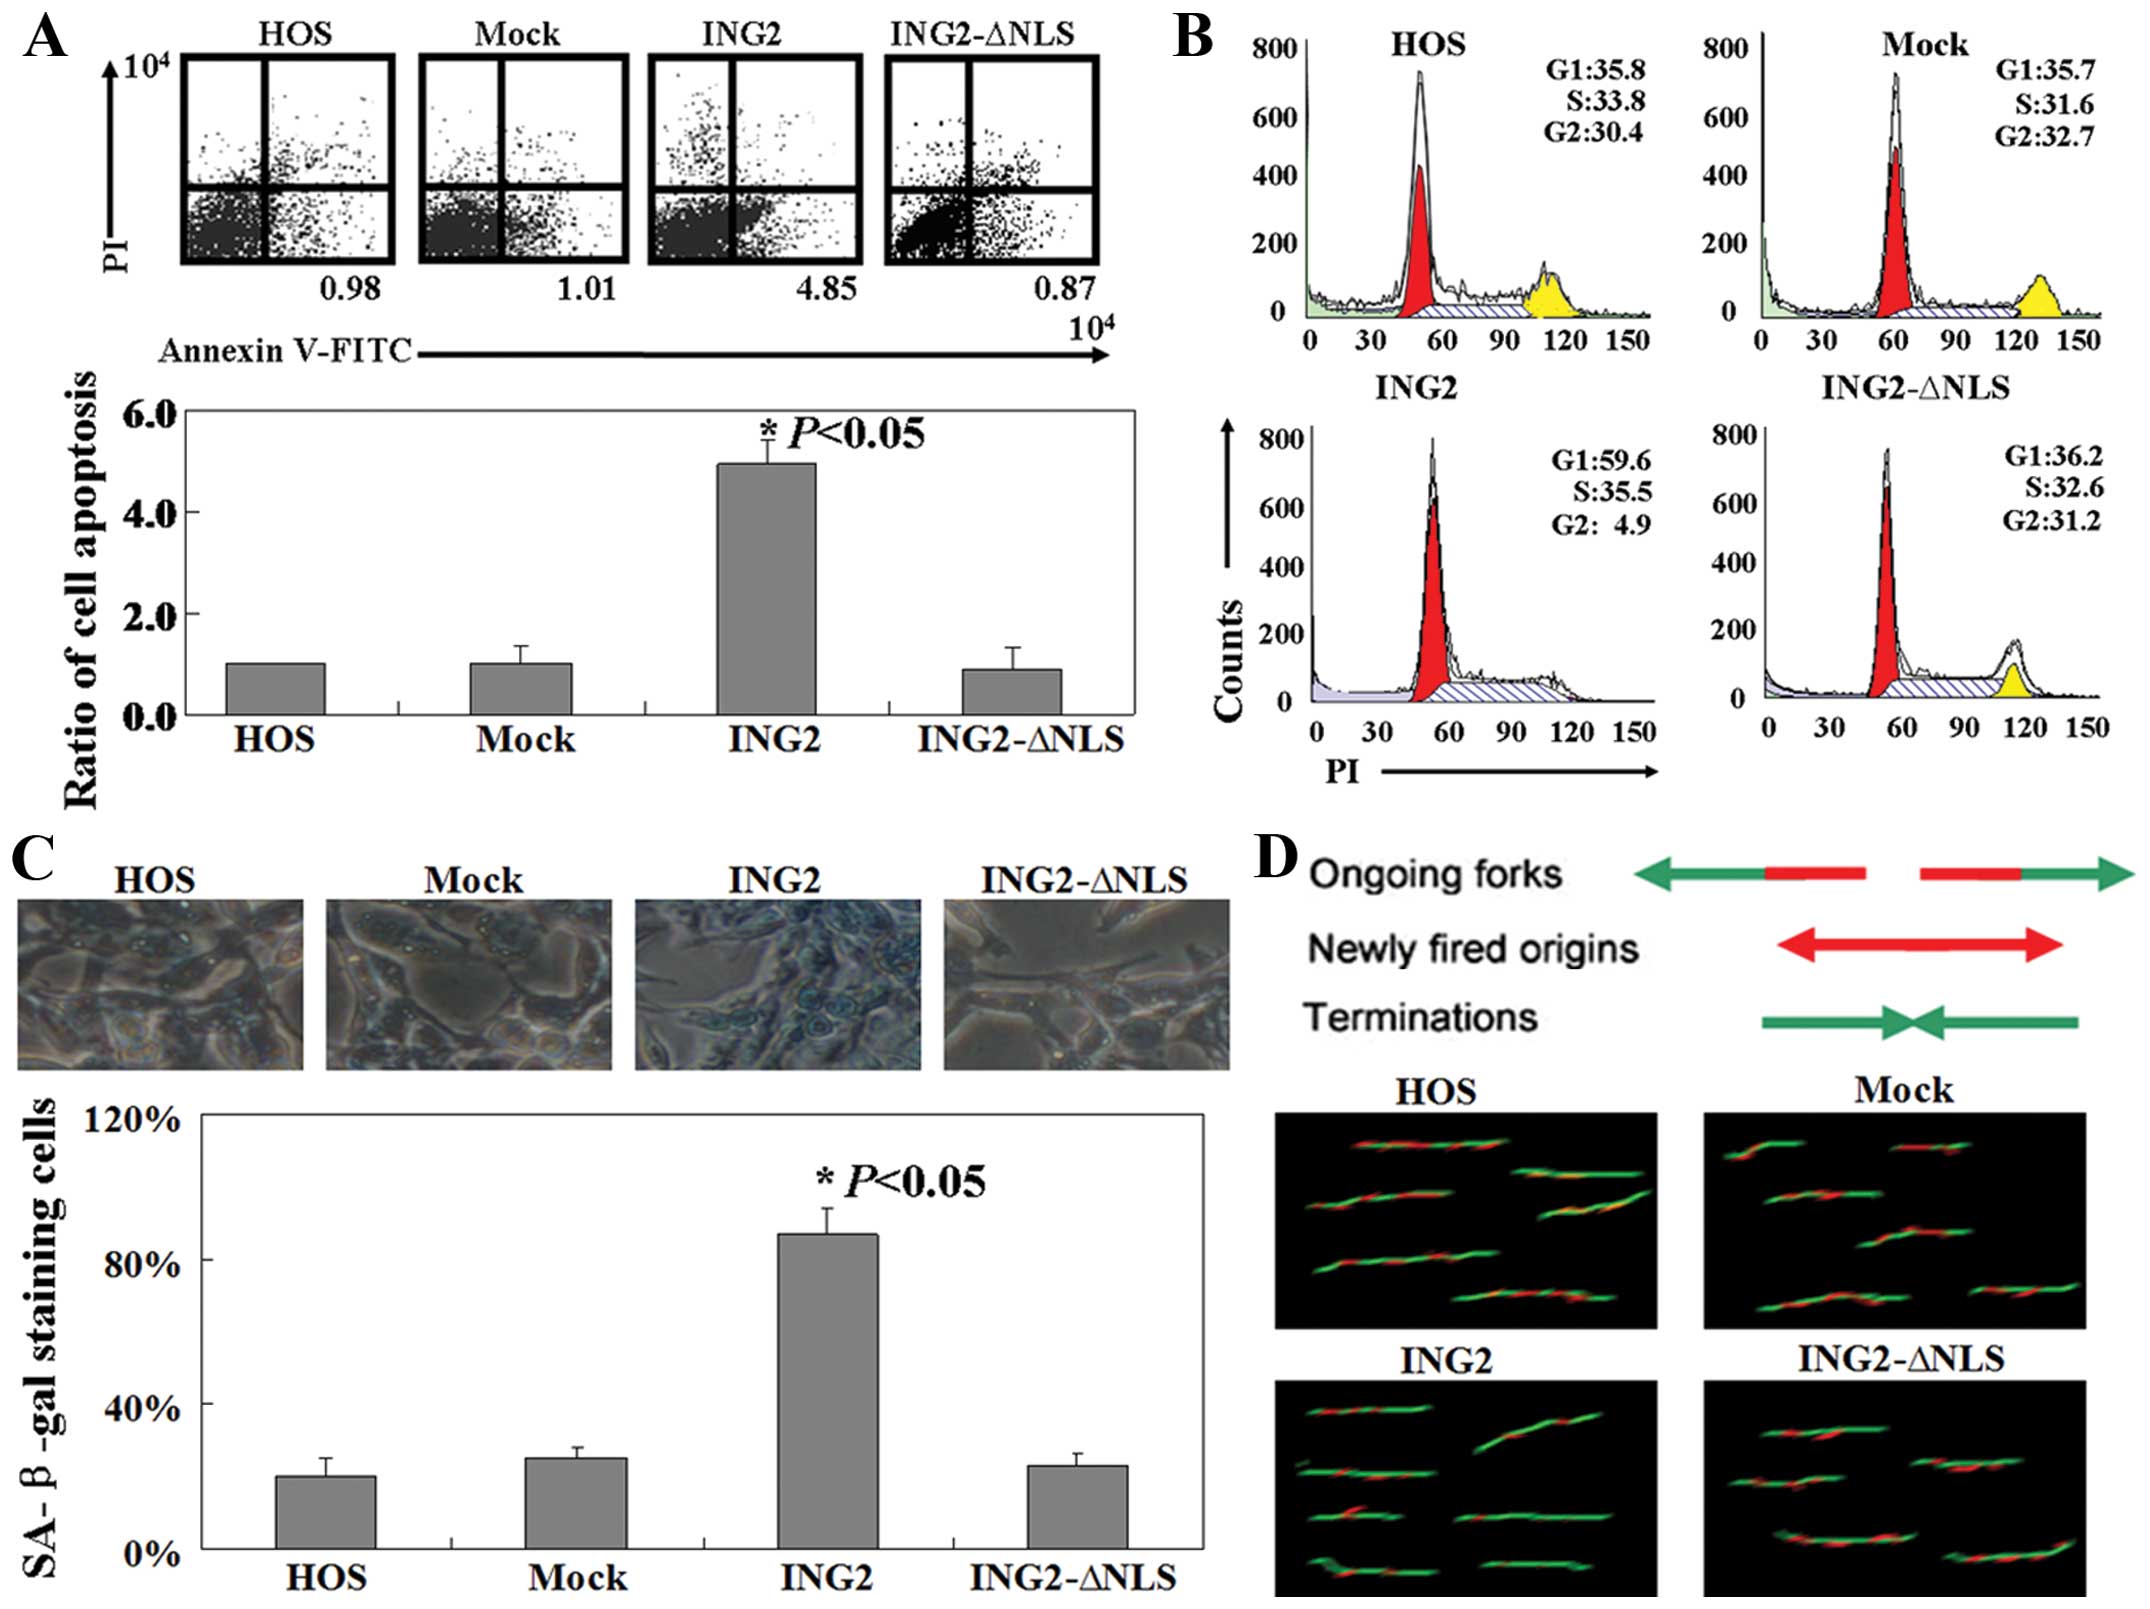
The ratio of the apoptotic cells present was
determined using flow cytometry. As shown in Fig. 4A, the percentage of apoptotic HOS
cells in the pcDNA3.1-ING2-transfected group was 4- to 6-times
higher than that in the untreated, mock or the
pcDNA3.1-ING2-ΔNLS-transfected group (P<0.05). Cell cycle
distribution of the transfected and untransfected cells was
examined using PI staining. The ratio of cells in the G1 phase was
found to be increased in cells in the pcDNA3.1-ING2-transfected
group when compared with the ratio in the other three groups
(P<0.05, Fig. 4B). Nearly all of
the HOS cells in the pcDNA3.1-ING2-transfected group showed strong
levels of blue SA-β-gal staining, while cells in the other three
groups showed a lower frequency of SA-β-gal staining (P<0.05,
Fig. 4C). Moreover, the results of
the BrdU/IdU double labeling method showed that less HOS cells in
the pcDNA3.1-ING2-transfected group were in the duplicate phase
when compared with the other three groups (Fig. 4D).
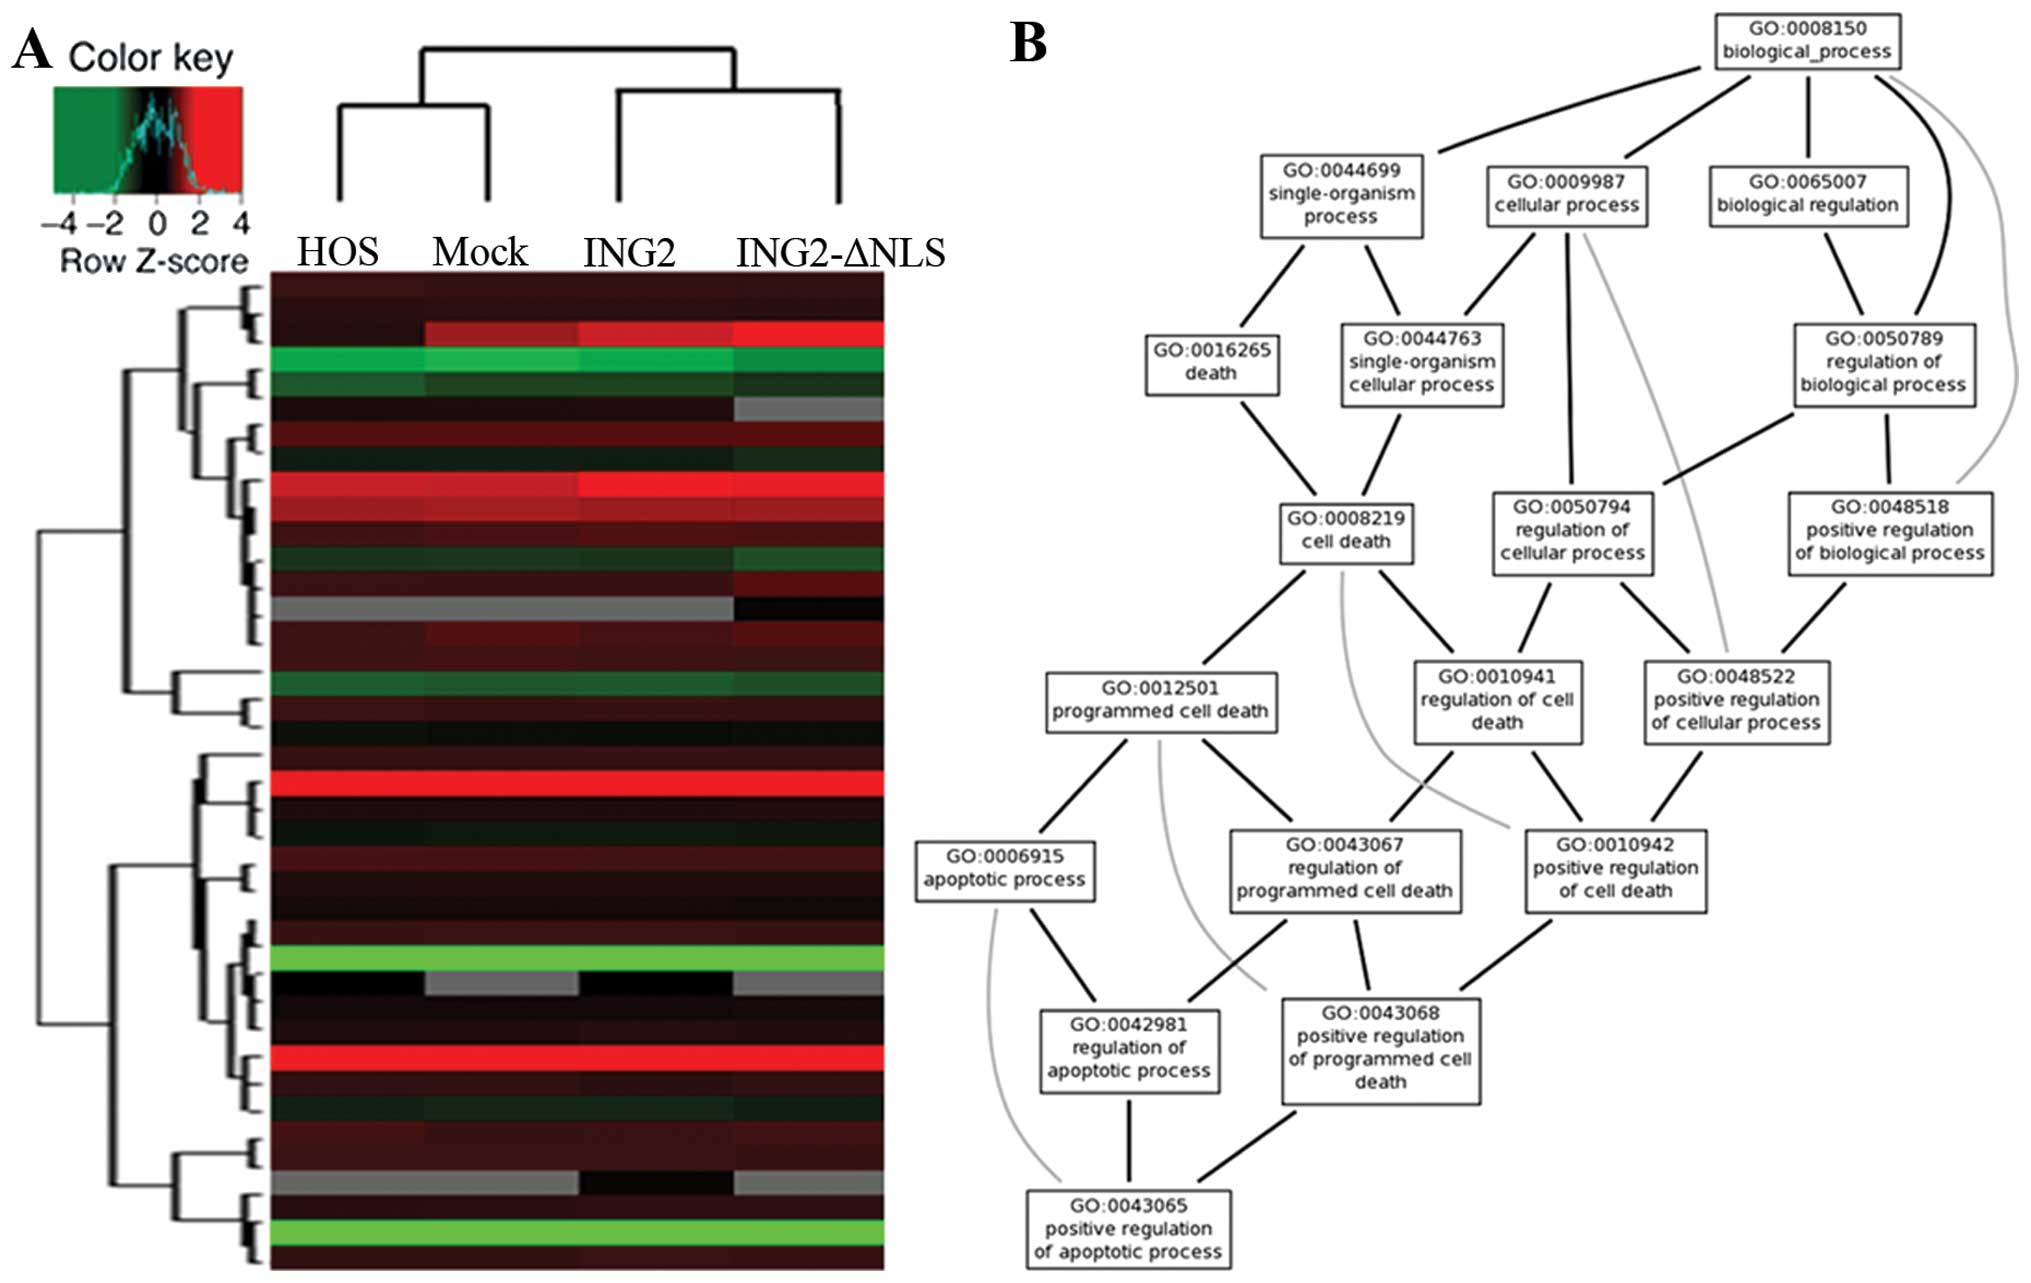
Affymetrix GeneChip analysis
Clustering of genes based on their relative
expression in the HOS cells with ING2 expression compared with the
untreated cells was carried out using the Affymetrix®
human expression array (Fig. 5A).
We arranged the networks of ING2 using Bio MAS (Molecule Annotation
System) 3.0 software. However, many of these networks were
consistent with the results that were predicted using Gene Ontology
(GO) software (http://www.geneontology.org/) (Fig. 5B).
Discussion
The main purpose of the present study was to
investigate the roles of the tumor suppressor ING2 in osteosarcoma.
We for the first time demonstrated that ING2 nuclear expression was
reduced in osteosarcoma. In previous studies, ING2 mRNA expression
was found to be reduced in HCCs and in non-small cell lung
carcinomas (19,20). Loss of ING2 nuclear expression has
been reported in melanoma (21).
Notably, in the present study, we found that ING2 was also
expressed in the cytoplasm.
In order to fully understand the function of ING2
nuclear and cytoplasmic expression, osteosarcoma cells were
transfected with an intact ING2 sequence or an ING2 sequence
without a nuclear localization signal (NLS). Firstly, we compared
the physico-chemical profiles of the nuclear and cytoplasmic ING2
protein. As shown in Fig. 3, the
biochemical and the structural characteristics of the ING2 protein
without NLS was similar to the intact ING2 protein. Secondly, we
confirmed that nuclear ING2 protein induced apoptosis, G1 phase
arrest and senescence in the osteosarcoma cells. Previous research
also showed similar functions for ING2. For example, ING2
overexpression in young fibroblasts was found to arrest cells in
the G1 phase and induce senescence (22). The PHD finger of ING2 has been
implicated in the negative regulation of cell proliferation through
modulation of p53 acetylation in response to DNA damage (23). Finally, we detected the mechanism of
ING2 in osteosarcoma cells using Affymetrix GeneChip analysis.
Previous reports have shown that ING2 interacts with HDAC1 and
mSin3A, and has the potential ability to bind to H3K4me3 (5,24).
Other studies also found that ING2 interacts with the p300
acetyltransferase to enhance p53 acetylation on lysine 382 to
increase transcription of p53 target genes, particularly p21 and
Bax to control cell cycle arrest, senescence and apoptosis
(6,22). Unfortunately, we did not identify
any new mechanism of ING2 in the present study.
Overall, this study provides novel biochemical,
structural and functional data on ING2 in osteosarcoma cells. These
results thus reinforce the role of ING2 as a tumor-suppressor gene,
acting by controlling cell cycle progression and cell
proliferation.
Acknowledgements
We are indebted to Mr. Xin-Yu Zhang for the
pcDNA3.1-ING2 and pcDNA3.1-ING2-ΔNLS plasmids.
References
|
1
|
Bielack SS, Kempf-Bielack B, Delling G, et
al: Prognostic factors in high-grade osteosarcoma of the
extremities or trunk: an analysis of 1,702 patients treated on
Neoadjuvant Cooperative Osteosarcoma Study Group protocols. J Clin
Oncol. 20:776–790. 2002. View Article : Google Scholar
|
|
2
|
Meyers PA and Gorlick R: Osteosarcoma.
Pediatr Clin North Am. 44:973–989. 1997. View Article : Google Scholar : PubMed/NCBI
|
|
3
|
Dai X, Ma W, He X and Jha RK: Review of
therapeutic strategies for osteosarcoma, chondrosarcoma, and
Ewing’s sarcoma. Med Sci Monit. 17:RA177–RHA190. 2011.
|
|
4
|
Watson RL, Spalding AC, Zielske SP, et al:
GSK3beta and beta-catenin modulate radiation cytotoxicity in
pancreatic cancer. Neoplasia. 12:357–365. 2010.PubMed/NCBI
|
|
5
|
Shi X, Hong T, Walter KL, et al: ING2 PHD
domain links histone H3 lysine 4 methylation to active gene
repression. Nature. 442:96–99. 2006.PubMed/NCBI
|
|
6
|
Nagashima M, Shiseki M, Miura K, et al:
DNA damage-inducible gene p33ING2 negatively regulates cell
proliferation through acetylation of p53. Proc Natl Acad Sci USA.
98:9671–9676. 2001. View Article : Google Scholar : PubMed/NCBI
|
|
7
|
Nagashima M, Shiseki M, Pedeux RM, et al:
A novel PHD-finger motif protein, p47ING3, modulates p53-mediated
transcription, cell cycle control and apoptosis. Oncogene.
22:343–350. 2003. View Article : Google Scholar : PubMed/NCBI
|
|
8
|
Shiseki M, Nagashima M, Pedeux RM, et al:
p29ING4 and p28ING5 bind to p53 and p300 and enhance p53 activity.
Cancer Res. 63:2373–2378. 2003.PubMed/NCBI
|
|
9
|
Guérillon C, Larrieu D and Pedeux R: ING1
and ING2: multifaceted tumor suppressor genes. Cell Mol Life Sci.
70:3753–3772. 2013.PubMed/NCBI
|
|
10
|
Borkosky SS, Gunduz M, Nagatsuka H, et al:
Frequent deletion of ING2 locus at 4q35.1 associates with advanced
tumor stage in head and neck squamous cell carcinoma. J Cancer Res
Clin Oncol. 135:703–713. 2009. View Article : Google Scholar : PubMed/NCBI
|
|
11
|
Zhang HK, Pan K, Wang H, et al: Decreased
expression of ING2 gene and its clinicopathological significance in
hepatocellular carcinoma. Cancer Lett. 261:183–192. 2008.
View Article : Google Scholar : PubMed/NCBI
|
|
12
|
Kumamoto K, Fujita K, Kurotani R, et al:
ING2 is upregulated in colon cancer and increases invasion by
enhanced MMP13 expression. Int J Cancer. 125:1306–1315. 2009.
View Article : Google Scholar : PubMed/NCBI
|
|
13
|
Kyte J and Doolittle RF: A simple method
for displaying the hydrophobic character of a protein. J Mol Biol.
157:105–132. 1982. View Article : Google Scholar
|
|
14
|
Hopp TP and Woods KR: Prediction of
protein antigenic determinants from amino acid sequences. Proc Natl
Acad Sci USA. 78:3824–3828. 1981. View Article : Google Scholar : PubMed/NCBI
|
|
15
|
Vihinen M, Torkkila E and Riikonen P:
Accuracy of protein flexibility predictions. Proteins. 19:141–149.
1994. View Article : Google Scholar : PubMed/NCBI
|
|
16
|
Trier NH, Hansen PR and Houen G:
Production and characterization of peptide antibodies. Methods.
56:136–144. 2012. View Article : Google Scholar : PubMed/NCBI
|
|
17
|
Dimri GP, Lee X, Basile G, et al: A
biomarker that identifies senescent human cells in culture and in
aging skin in vivo. Proc Natl Acad Sci USA. 92:9363–9367. 1995.
View Article : Google Scholar : PubMed/NCBI
|
|
18
|
Jackson DA and Pombo A: Replicon clusters
are stable units of chromosome structure: evidence that nuclear
organization contributes to the efficient activation and
propagation of S phase in human cells. J Cell Biol. 140:1285–1295.
1998. View Article : Google Scholar
|
|
19
|
Walzak AA, Veldhoen N, Feng X, Riabowol K
and Helbing CC: Expression profiles of mRNA transcript variants
encoding the human inhibitor of growth tumor suppressor gene family
in normal and neoplastic tissues. Exp Cell Res. 314:273–285. 2008.
View Article : Google Scholar
|
|
20
|
Ythier D, Brambilla E, Binet R, et al:
Expression of candidate tumor suppressor gene ING2 is lost in
non-small cell lung carcinoma. Lung Cancer. 69:180–186. 2010.
View Article : Google Scholar : PubMed/NCBI
|
|
21
|
Lu F, Dai DL, Martinka M, Ho V and Li G:
Nuclear ING2 expression is reduced in human cutaneous melanomas. Br
J Cancer. 95:80–86. 2006. View Article : Google Scholar : PubMed/NCBI
|
|
22
|
Pedeux R, Sengupta S, Shen JC, et al: ING2
regulates the onset of replicative senescence by induction of
p300-dependent p53 acetylation. Mol Cell Biol. 25:6639–6648. 2005.
View Article : Google Scholar : PubMed/NCBI
|
|
23
|
Gozani O, Karuman P, Jones DR, et al: The
PHD finger of the chromatin-associated protein ING2 functions as a
nuclear phosphoinositide receptor. Cell. 114:99–111. 2003.
View Article : Google Scholar : PubMed/NCBI
|
|
24
|
Pena PV, Davrazou F, Shi X, et al:
Molecular mechanism of histone H3K4me3 recognition by plant
homeodomain of ING2. Nature. 442:100–103. 2006.PubMed/NCBI
|