Introduction
Cancer biology has made a significant progress in
identifying molecules involved in mechanisms of carcinogenesis and
malignant progression. This has led to the development of a new
generation of therapeutics that target such molecules. In spite of
this progress, cancer treatments often fail to bring cure to many
patients who develop resistance to the therapy and therefore suffer
from metastases and/or recurrences. The success of a treatment
depends, at least in part, on a detailed understanding of unique
characteristics of cancer in each individual patient. In addition
to the analysis of biomarkers in blood and tumor samples, positron
emission tomography (PET) and other imaging techniques provide
valuable information about properties of each cancer and facilitate
treatment planning.
Recently, the role of the tumor microenvironment in
cancer has become a focus of numerous studies. Among factors
affecting the microenvironment, hypoxia is attracting major
attention. Hypoxia is known to cause cancer therapy resistance by
activating prosurvival reactions, upregulating angiogenesis,
stimulating metabolic adaptations and promoting tumor invasion and
formation of metastases. Some of these effects are mediated by the
HIF-1α activation, while in case of the radiation therapy the lack
of oxygen itself also plays an important part by reducing the
generation of free radicals (1–3).
Two classes of PET tracers have been tried for tumor
hypoxia imaging in humans. One class comprises nitroimidazole
compounds such as
1H-1-(3-[18F]-fluoro-2-hydroxy-propyl)-2-nitro-imidazole
(FMISO) and
1-(5-fluoro-5-deoxy-α-D-arabinofuranosyl)-2-nitroimidazole (FAZA),
while the other is represented by [62,64Cu]
copper-diacetyl-bis[N(4)-methylthiosemicarbazone)] (Cu-ATSM).
Accumulation of both classes of PET tracers inside tumors has been
reported to predict prognosis in cancer patients (4–7). The
intratumoral distribution of Cu-ATSM has been compared to that of
FMISO or FAZA previously (8–11) and
both similarities and differences have been reported. In the
present study, we analyzed intratumoral distributions of FAZA and
Cu-ATSM in xenograft tumors induced by cancer cell lines of various
origin and cancer tissue originated spheroids (CTOSs). CTOS
xenografts are reported to closely mimic properties of original
tumors (12). We have also compared
the cellular uptake of the two tracers by several cell lines in
order to elucidate possible reasons for differences in the
accumulation of FAZA and Cu-ATSM.
Materials and methods
FAZA and Cu-ATSM
[18F]FAZA was synthesized at the National
Institute of Radiological Sciences facility using the method
reported earlier (14). The
specific radioactivity was >300 GBq/µmol and the
radiochemical purity was over 95%. 64Cu (50–90
GBq/µmol) was produced at the National Institute of
Radiological Sciences facility and [64Cu]Cu-ATSM was
synthesized as described previously (13). The radiochemical purity was over 95%
as determined by silica gel thin layer chromatography.
CTOSs and cell lines
We used such CTOSs as C45, OMLC-147 and OMLC-145
derived from patients with a moderately differentiated colon
adenocarcinoma, lung squamous cell carcinoma and atypical lung
adenocarcinoma, correspondingly, that were prepared and maintained
as previously described (12,15).
The study protocol was approved by the Ethics Committees of both
the Osaka Medical Center for Cancer and Cardiovascular Diseases and
the National Institute of Radiological Sciences. The CTOSs were
cultured in StemPro human embryonic stem cells medium (Gibco,
Carlsbad, CA, USA) supplemented with 8 ng/ml basic fibroblast
growth factor (Invitrogen, Thermo Fisher Scientific, Waltham, MA,
USA), 0.1 mM β-mercaptoethanol (Wako, Osaka, Japan), 50 U/ml
penicillin, and 50 µg/ml streptomycin (Gibco) in a
non-treated dish (Iwaki, Tokyo, Japan) in a humidified atmosphere
of 95% air/5% CO2 at 37°C. The human cancer cell lines
HT29 (HTB-38; colon adenocarcinoma), HCT116 (CCL-247; colon
carcinoma), H441 (HTB-174; papillary adenocarcinoma), H520
(HTB-182; squamous cell carcinoma), A549 (CCL-185; lung carcinoma),
HCC1954 (CRL-2338; ductal carcinoma), MCF7 (HTB-22; mammary gland
adenocarcinoma) and U87MG (HTB-14; glioblastoma) were obtained from
the American Type Culture Collection (ATCC). They were cultured in
Dulbecco's modified Eagle's medium (DMEM 11995-065; Invitrogen)
supplemented with 10% fetal bovine serum and antibiotics.
Xenograft tumors
All animal experiments and procedures complied with
the Animal Treatment Regulations of the National Institute of
Radiological Sciences in Japan. Approximately 1,000 C45 CTOSs, 100
OMLC-145 CTOSs or 100 OMLC-147 CTOSs were suspended in 50 µl
of Matrigel growth factor reduced (GFR) (BD Biosciences, Bedford,
MA, USA) and transplanted subcutaneously into the flanks of
NOD/scid mice (NOD.CB17-Prkdcscid/J; Charles River
Japan, Yokohama, Japan). Cells of the cancer cell lines
(2–4×10⁶ cells/inoculate) were transplanted
subcutaneously into nude mice (BALB/c Slc-nu/nu; Japan SLC,
Inc, Hamamatsu, Japan). H520 cells were suspended in 50 µl
of Matrigel (BD Biosciences) and the others were suspended in 50
µl of phosphate-buffered saline (PBS). For each CTOS or cell
line, 3–5 tumor-bearing mice were prepared and used for further
experiments once the tumor diameter reached 10–15 mm. This usually
occurred 3–6 weeks after the transplantation.
Double-tracer autoradiography
Each mouse was administered 20 MBq
[18F]FAZA, 0.2 MBq [64Cu]Cu-ATSM and 15 mg of
pimonidazole (Hypoxyprobe-1 kit; Hypoxyprobe, Inc., Burlington, MA,
USA) intravenously. Two hours later, mice were sacrificed and
tumors were removed. The excised tumors were immediately embedded
in the optimal cutting temperature compound (Sakura Finetech,
Tokyo, Japan) and frozen in hexan (Wako) pre-cooled with dry ice.
Each tumor was sectioned, the cut surfaces were flattened using a
cryostat (Leica CM1950; Leica, Wetzlar, Germany) and subjected to
double-tracer autoradiography. [18F]FAZA images were
acquired over 15 min by exposing the frozen sections to an imaging
plate (BAS-IP MS 2025E; Fujifilm, Tokyo, Japan) in a freezer. Then,
the imaging plate was scanned by a bio-imaging analyzer (FLA7000;
Fujifilm). Following an interval of 30 h necessary for
18F decay after the first exposure, [64Cu]
Cu-ATSM images were acquired over a 3-day period and the imaging
plate was scanned thereafter.
[18F]FAZA and [64Cu]Cu-ATSM
distributions were visualized using Multi Gauge software
(Fujifilm). In each tumor section, the highest photostimulated
luminescent region was designated as 100%, while the background was
adopted as 0%. This 0 to 100% range was subsequently divided into a
32-part colored gradient ranging from dark blue (0) to red (100%)
and the image was then saved in a true color TIFF format. The high
photostimulated luminescent regions (75 to 100%) in each image were
selected and painted yellow ([18F]FAZA) or blue
([64Cu]Cu-ATSM) using Adobe Photoshop (Adobe Systems
Inc., San Jose, CA, USA). Images of identical tissue samples were
merged and areas demonstrating high levels of both
[18F]FAZA and [64Cu]Cu-ATSM accumulation
appeared green, indicating overlapped tracer distribution.
The area of regions enriched with
[18F]FAZA (yellow), [64Cu]Cu-ATSM (blue) or
both tracers (green) was measured using WinRoof software (Mitani
corporation, Fukui, Japan), and the extent of the overlap was
calculated as the percentage of the overlapped area divided by the
area exhibiting high levels of accumulation of FAZA or Cu-ATSM as
follows:
Overlap ratio = Area in green (Fig. 2C or F)/(Area in yellow (Fig. 2A or D) + Area in blue (Fig. 2B or E) − Area in green) × 100
(%)
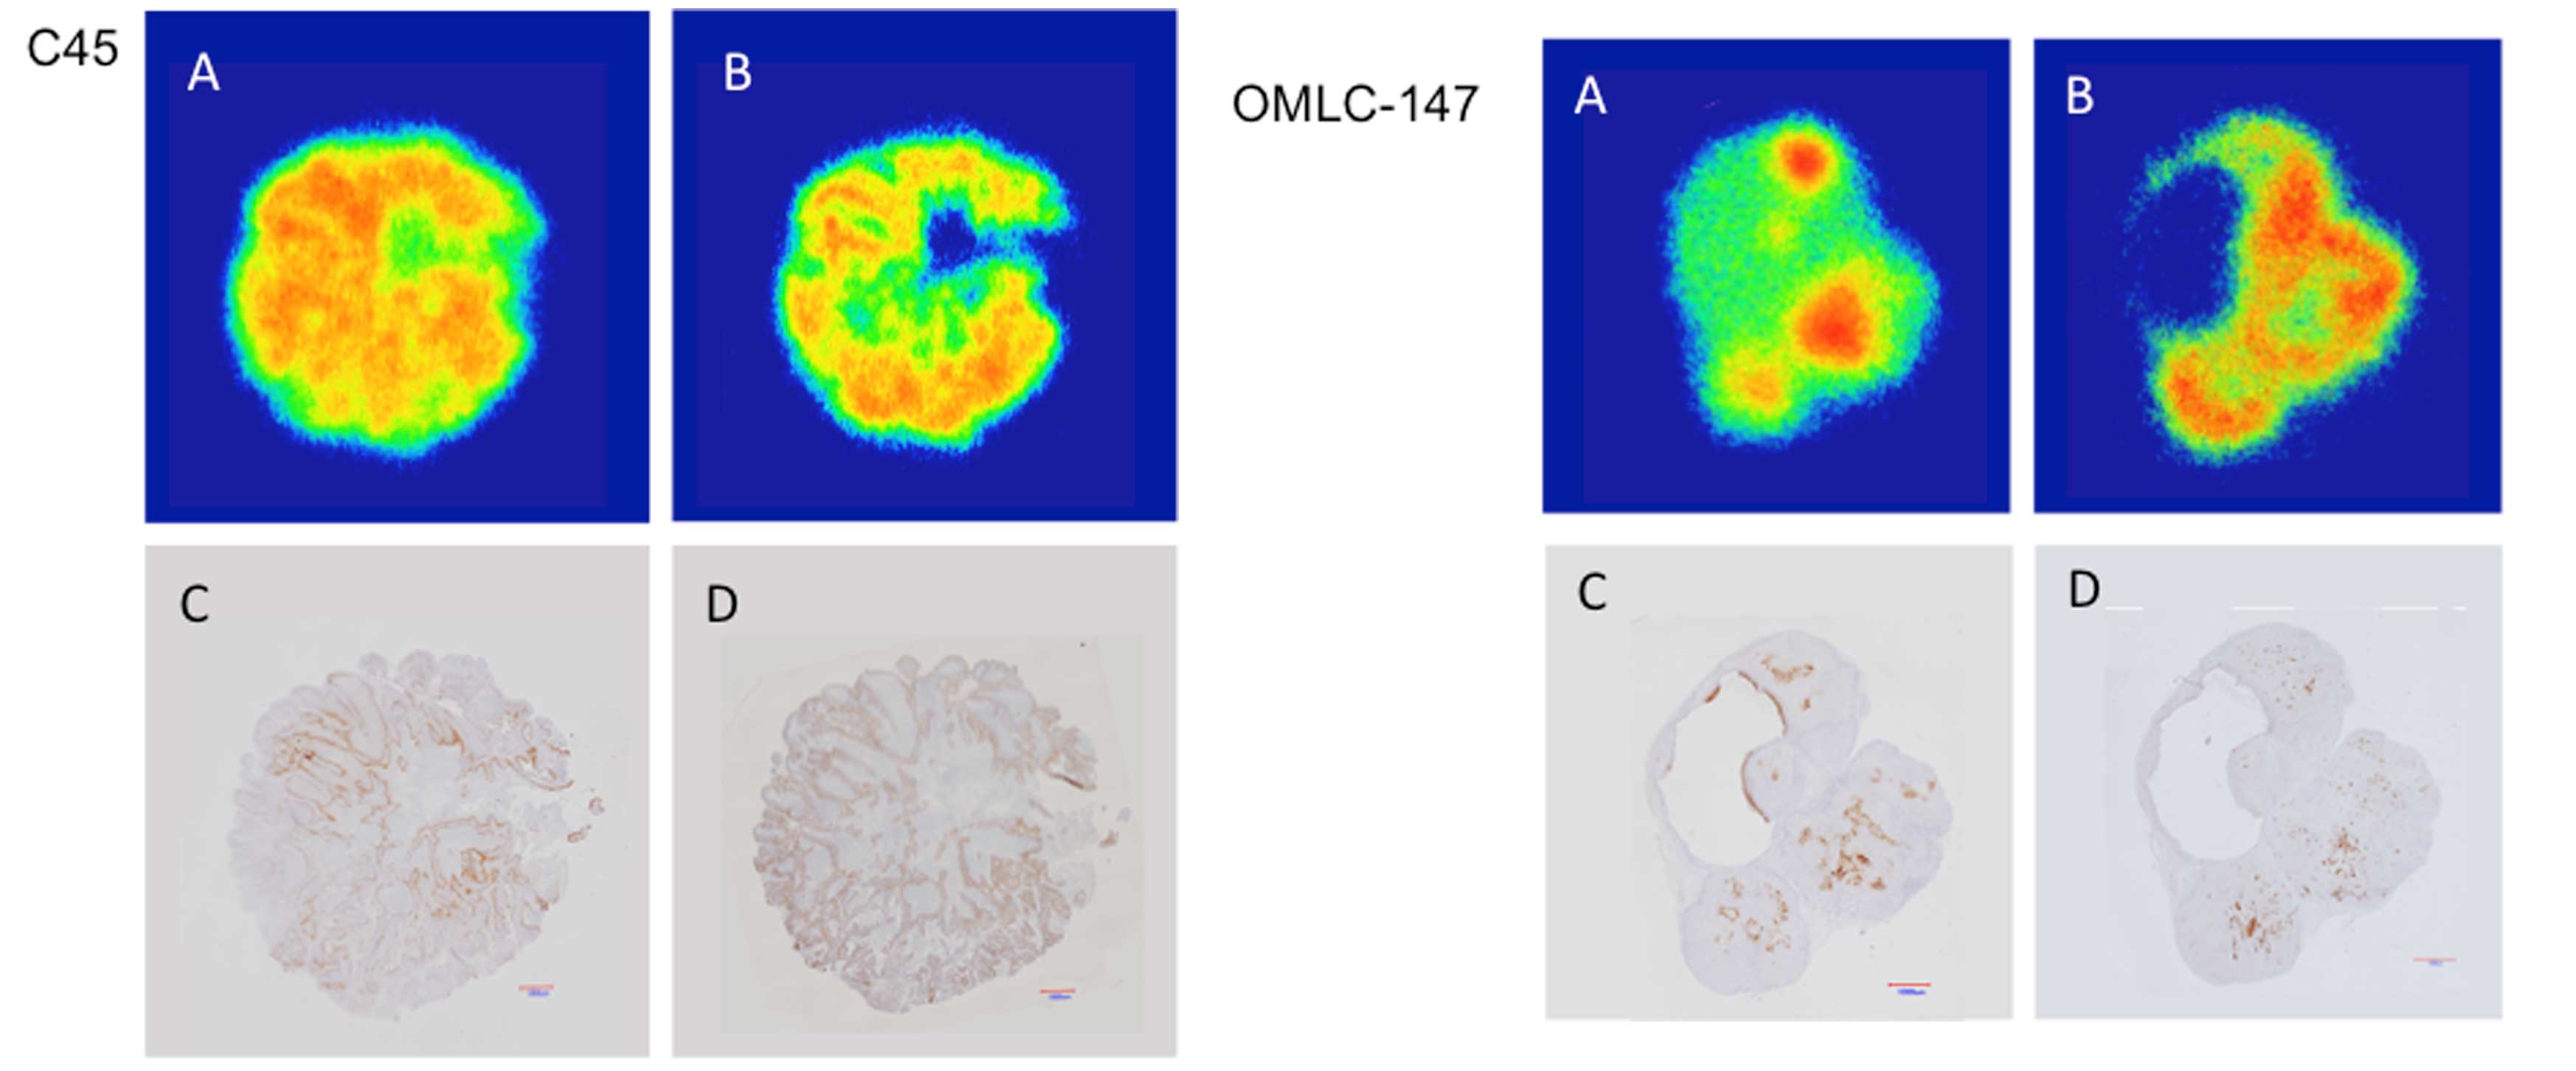
Immunohistochemical (IHC) staining
For CTOSs C45, OMLC-145 and OMLC-147, as well as for
cell lines HT29, HCT116, H441 and H520, 2–3 frozen samples
previously analyzed with double-tracer autoradiography were thawed,
fixed in 10% neutral-buffered formalin and embedded in paraffin.
Four micrometer thick sections were prepared from the region within
50 µm of the surface that was autoradiographed previously.
After deparaffinization and rehydration, sections were treated with
the 3% hydrogen peroxide, followed by heating in citrate buffer, pH
6.0, for IHC staining. Nonspecific binding was prevented using a
protein-blocking agent (Dako, Glostrup, Denmark).
For pimonidazole adduct staining, the sections were
incubated in 1:50 diluted hypoxyprobe Mab-1 (Hypoxyprobe-1 kit;
Hypoxyprobe, Inc.) for 1 h at room temperature. Sections were then
incubated with polyclonal rabbit anti-mouse immunoglobulins/HRP
(Dako). To stain for HIF-1α, an anti-HIF-1α antibody (clone
EP1215Y; Merck Millipore, Darmstadt, Germany) was used as the
primary antibody at a 1:100 dilution and EnVision+ System− HRP
Labelled Polymer Anti-Rabbit (Dako) was used as the secondary
antibody. Peroxidase color visualization was carried out using DAB
solution and counterstaining was performed using Mayer hematoxylin
solution. Images of sections with pimonidazole or HIF-1α staining
of C45 and OMLC-147 tumors were acquired with a microscope (BX50
microscope; Olympus, Tokyo, Japan) equipped with an image tiling
system (e-Tiling; Mitani Corporation) that enabled acquisition of
the whole tumor section image.
Six to nine photomicrographs of the HIF-1α- and
pimonidazole-stained samples were obtained for each CTOS- or cell
line-induced tumor focusing on regions (0.44×0.32 mm) with high
accumulation of FAZA or Cu-ATSM (BX50 microscope; Olympus).
Staining was evaluated using the WinROOF image analysis software
(Mitani Corporation) and expressed as the ratio (%) of the stained
area to the whole area of the image.
Cellular uptake of FAZA and Cu-ATSM
HT29, HCT116, H441 and H520 cells were plated on
12-well cell culture dishes (BD Falcon, Franklin Lakes, NJ, USA)
and cultured for 16–24 h to reach ~50% confluence. Culture medium
was then replaced with the solution containing [18F]FAZA
(80 kBq/ml of DMEM containing 10% fetal calf serum and antibiotics,
0.8 ml/well) or [64Cu]Cu-ATSM (20 kBq/ml) and culture
dishes were placed in a multi-gas incubator (Personal
CO2 Multi Gas Incubator APM-30D; Astec, Fukuoka, Japan)
equipped with an N2 generator (NGS-40; Juji Field, Inc.,
Tokyo, Japan) and incubated for 2 h, with the O2
concentration in the incubator set at 20, 2 or 1%. After the
incubation, the cells were rinsed twice with ice-cold PBS and lysed
with 0.2 M NaOH. The radioactivity and the protein concentration of
the lysate were measured using a gamma counter (Aloka, Tokyo,
Japan) and the DC protein assay (Bio-Rad, Hercules, CA, USA),
respectively. Fraction of the radioactivity taken up by the cells
in a well in relation to the total radioactivity added to a well
was calculated and normalized to 0.1 mg protein, as the amount of
protein found in a well was around 0.1 mg in most cases.
Statistical analysis
The significance of differences between the groups
was determined using the Student's t-test. P-values >0.05 were
considered significant.
Results
Regional overlap of FAZA and Cu-ATSM in
xenografts
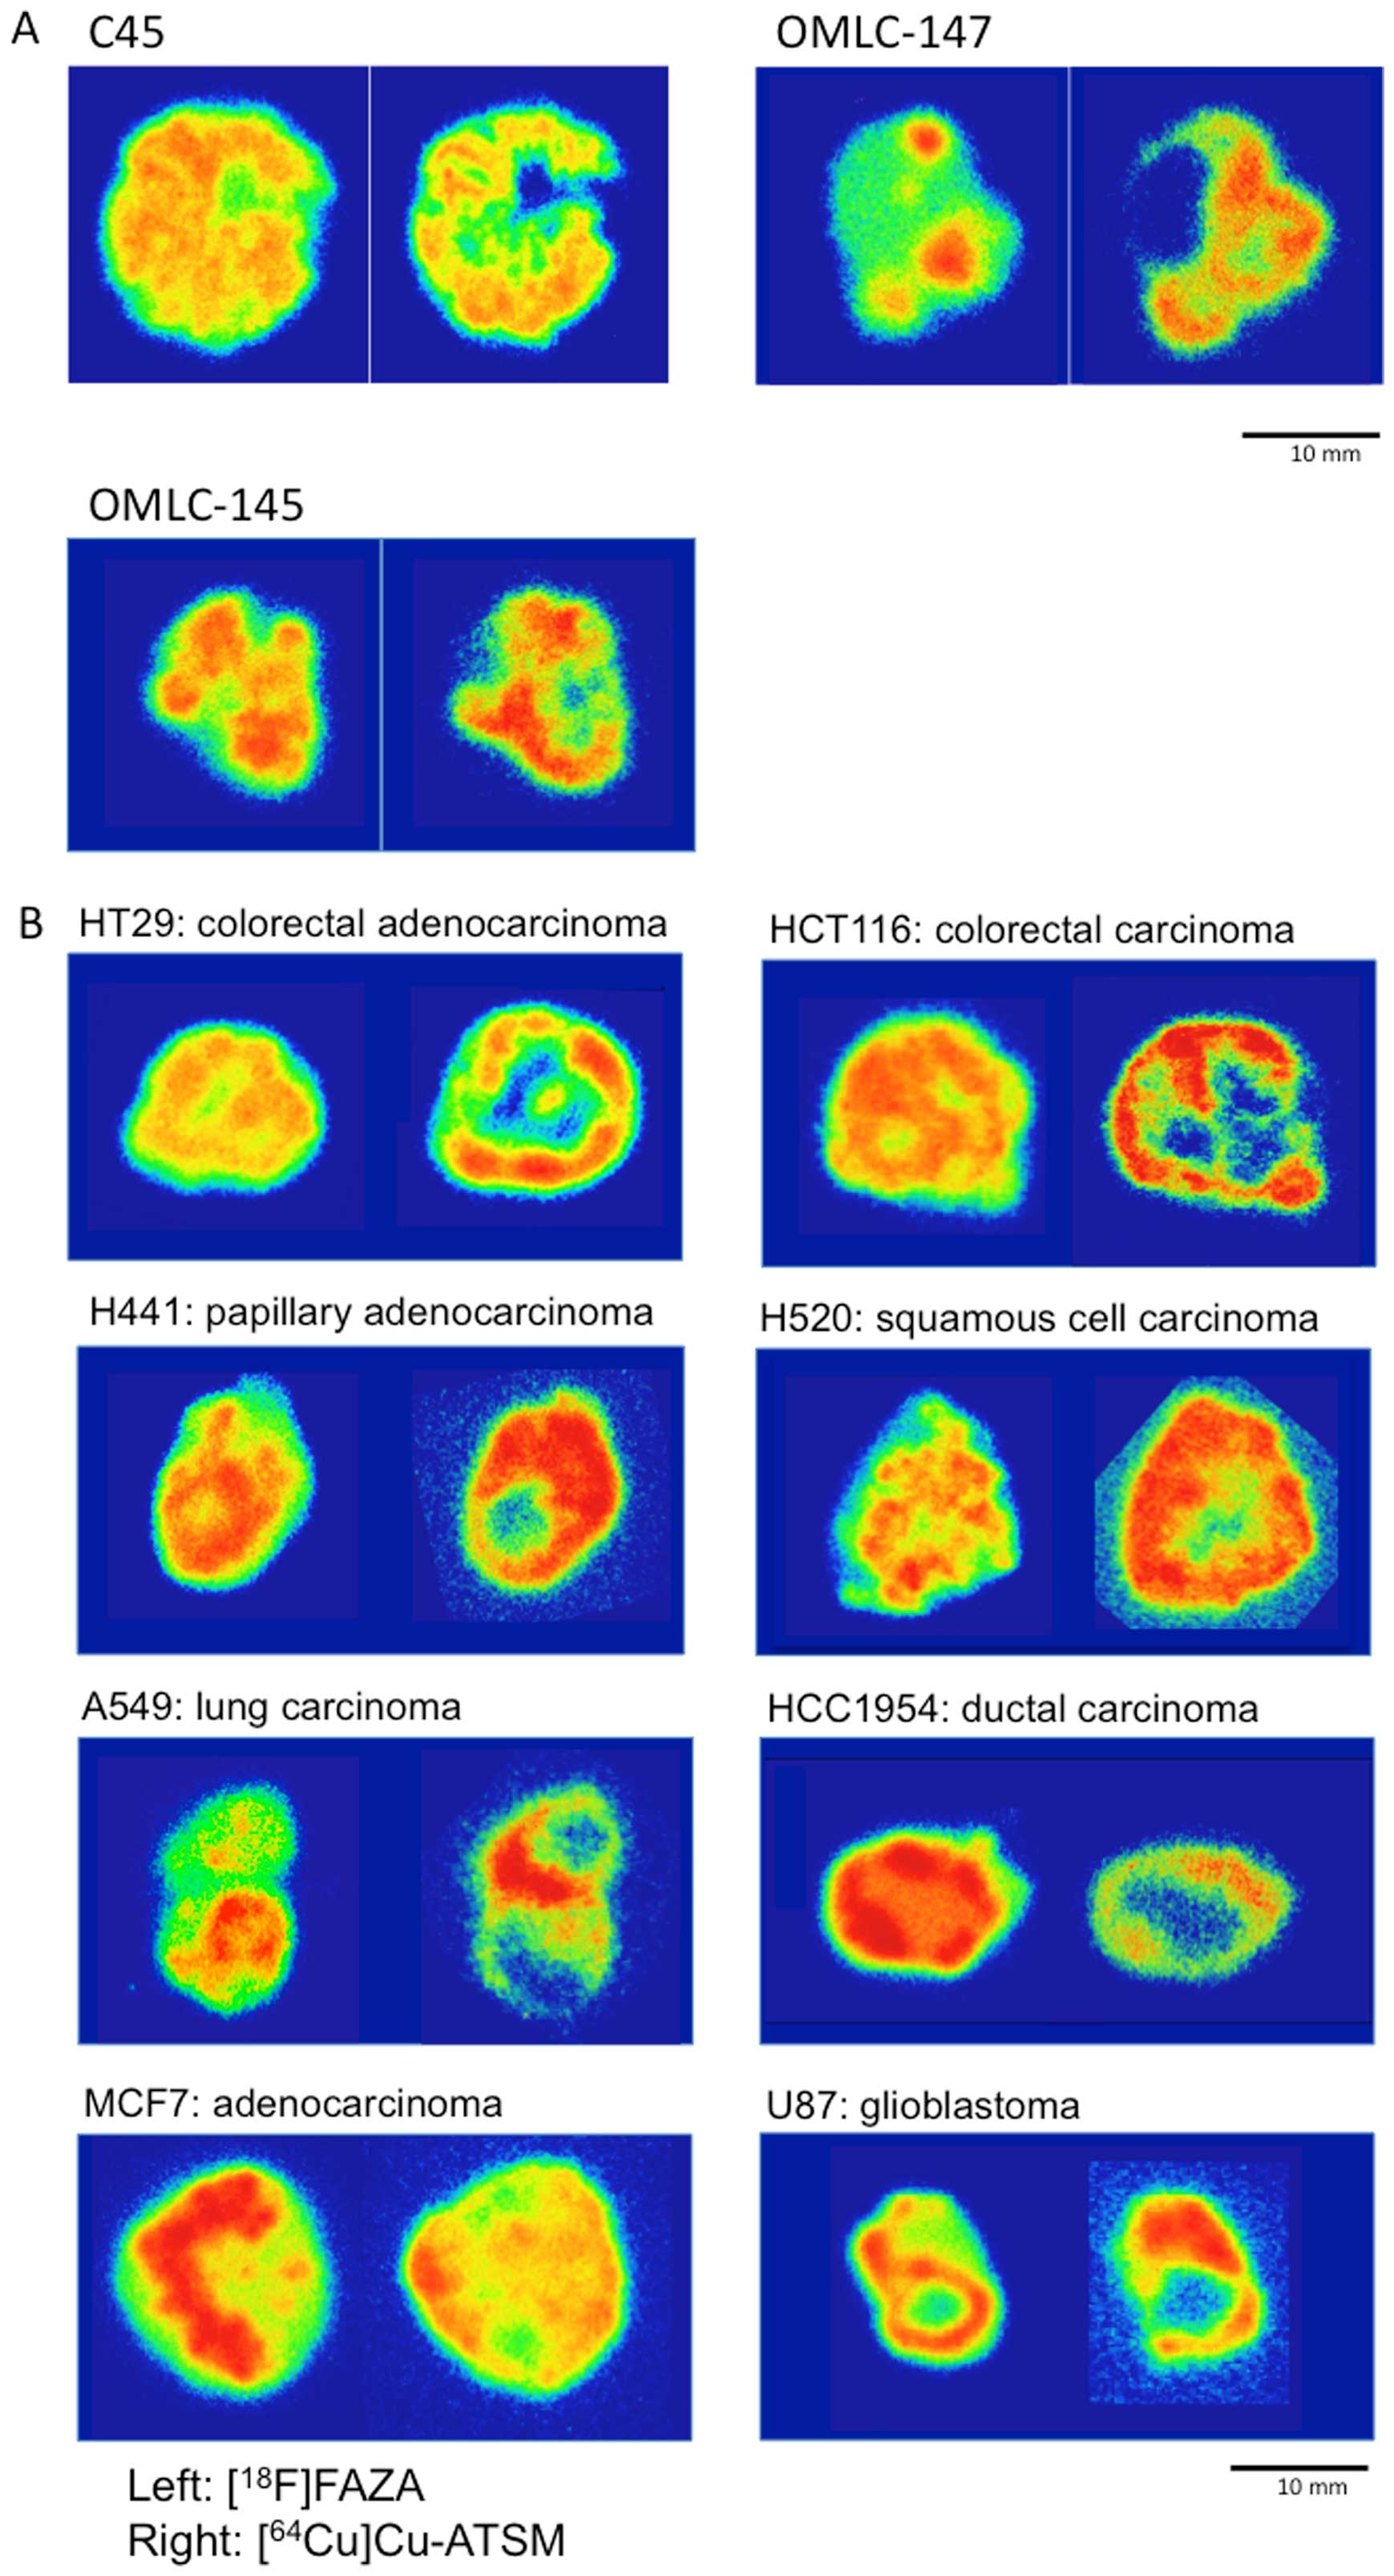
Representative 32-color autoradiographs of the
[18F]FAZA and [64Cu]Cu-ATSM distributions in
the CTOS and cell line xenografts are shown in Fig. 1A and B, respectively. The patterns
of intratumoral distributions of the two tracers varied in
xenografts of all the CTOSs and cell lines tested. In most cases,
high levels of Cu-ATSM were observed peripherally, whereas FAZA
accumulated predominantly around the center of tumors.
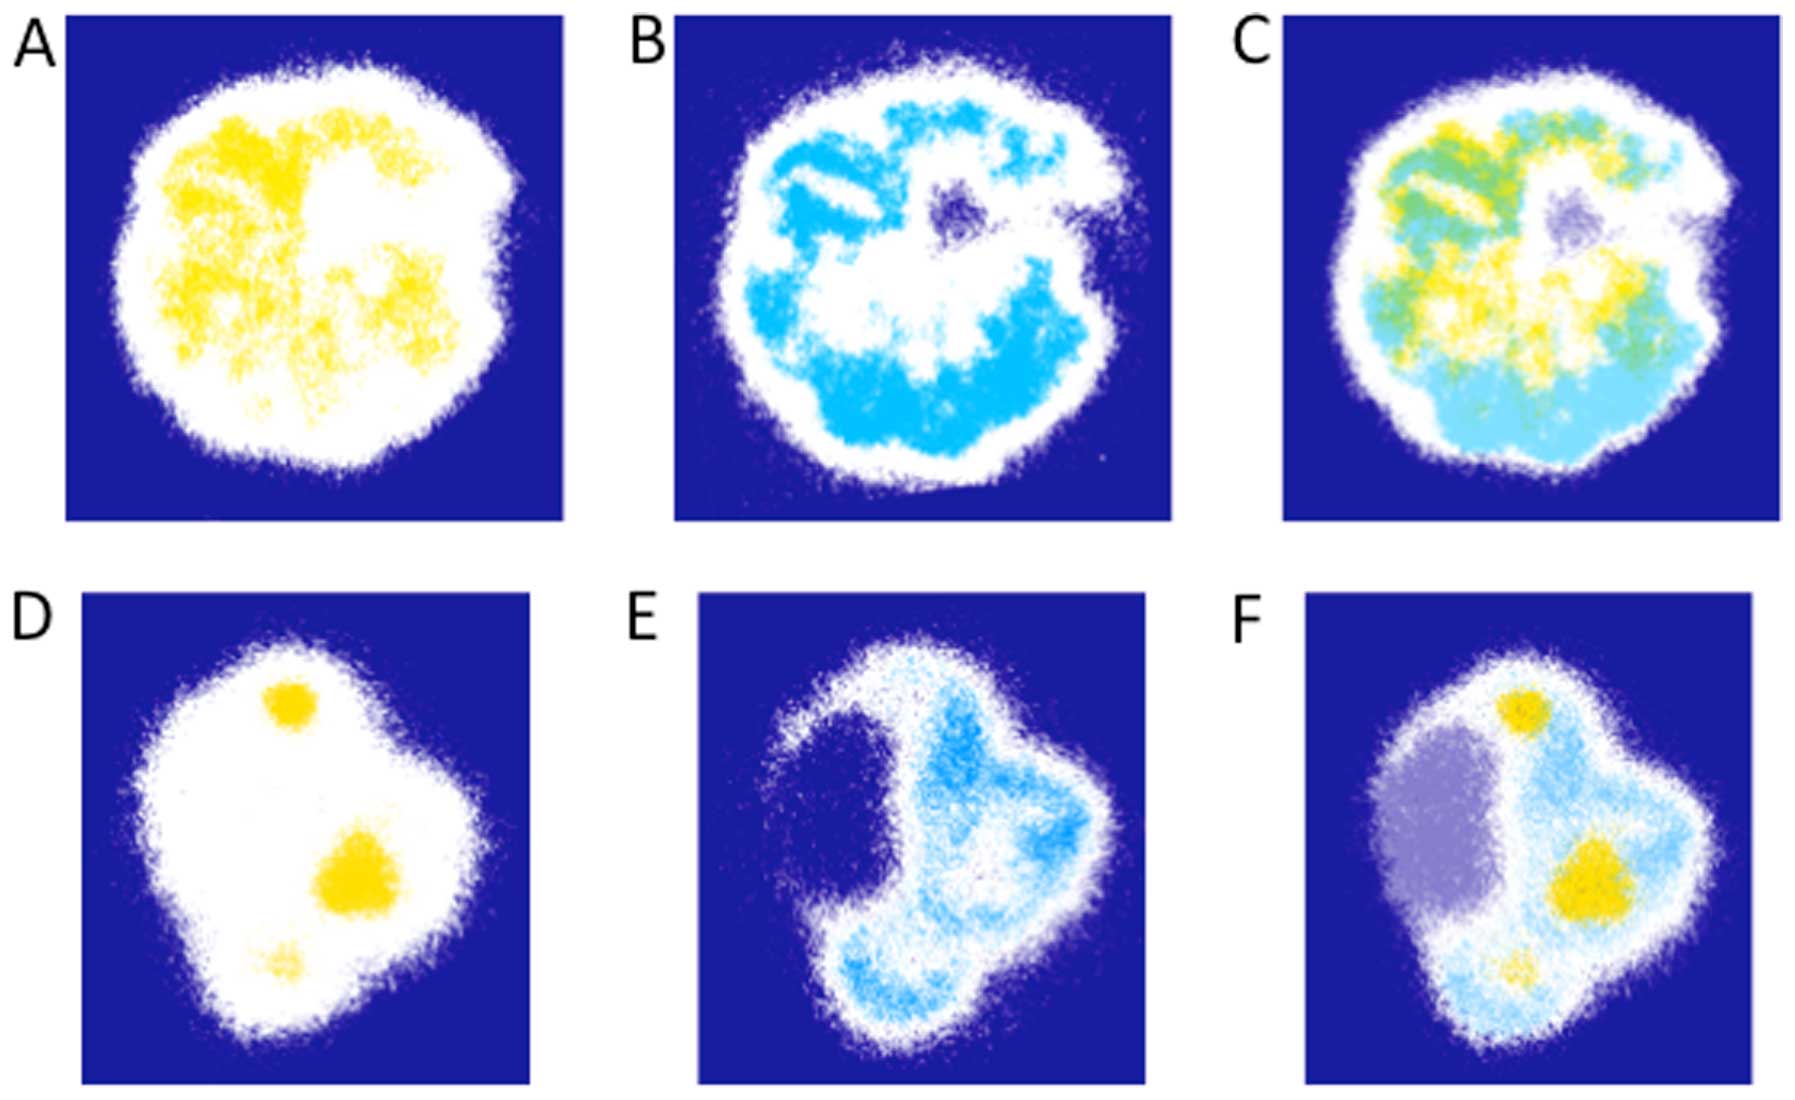
In Fig. 2, the
regions of high FAZA or Cu-ATSM accumulation in the sections of C45
and OMLC-147 xenografts from Fig.
1A were highlighted in yellow (Fig.
2A and D) and blue (Fig. 2B and
E), respectively, and the extent of their overlap was assessed
by merging the two images (Fig. 2C and
F). Only a limited overlap between the areas of high FAZA and
Cu-ATSM accumulation was observed as illustrated by areas in merged
green color (Fig. 2C and F). The
overlap ratios calculated for the 3 CTOS and 4 cell line xenografts
are presented in Table I. These
ratios were generally low (<5%) except in the case of CTOS C45,
where the ratio comprised 15.3%.
 | Table IRegional overlap between the areas of
high accumulation of Cu-ATSM and FAZA. |
Table I
Regional overlap between the areas of
high accumulation of Cu-ATSM and FAZA.
| Transplanted
cell/CTOS | Overlap ratio |
|---|
| HT29 | 1.33±0.74 |
| HCT116 | 4.99±2.52 |
| H441 | 2.29±1.75 |
| H520 | 2.76±1.51 |
| C45 | 15.32±4.74 |
| OMLC-147 | 3.81±2.28 |
| OMLC-145 | 4.71±2.82 |
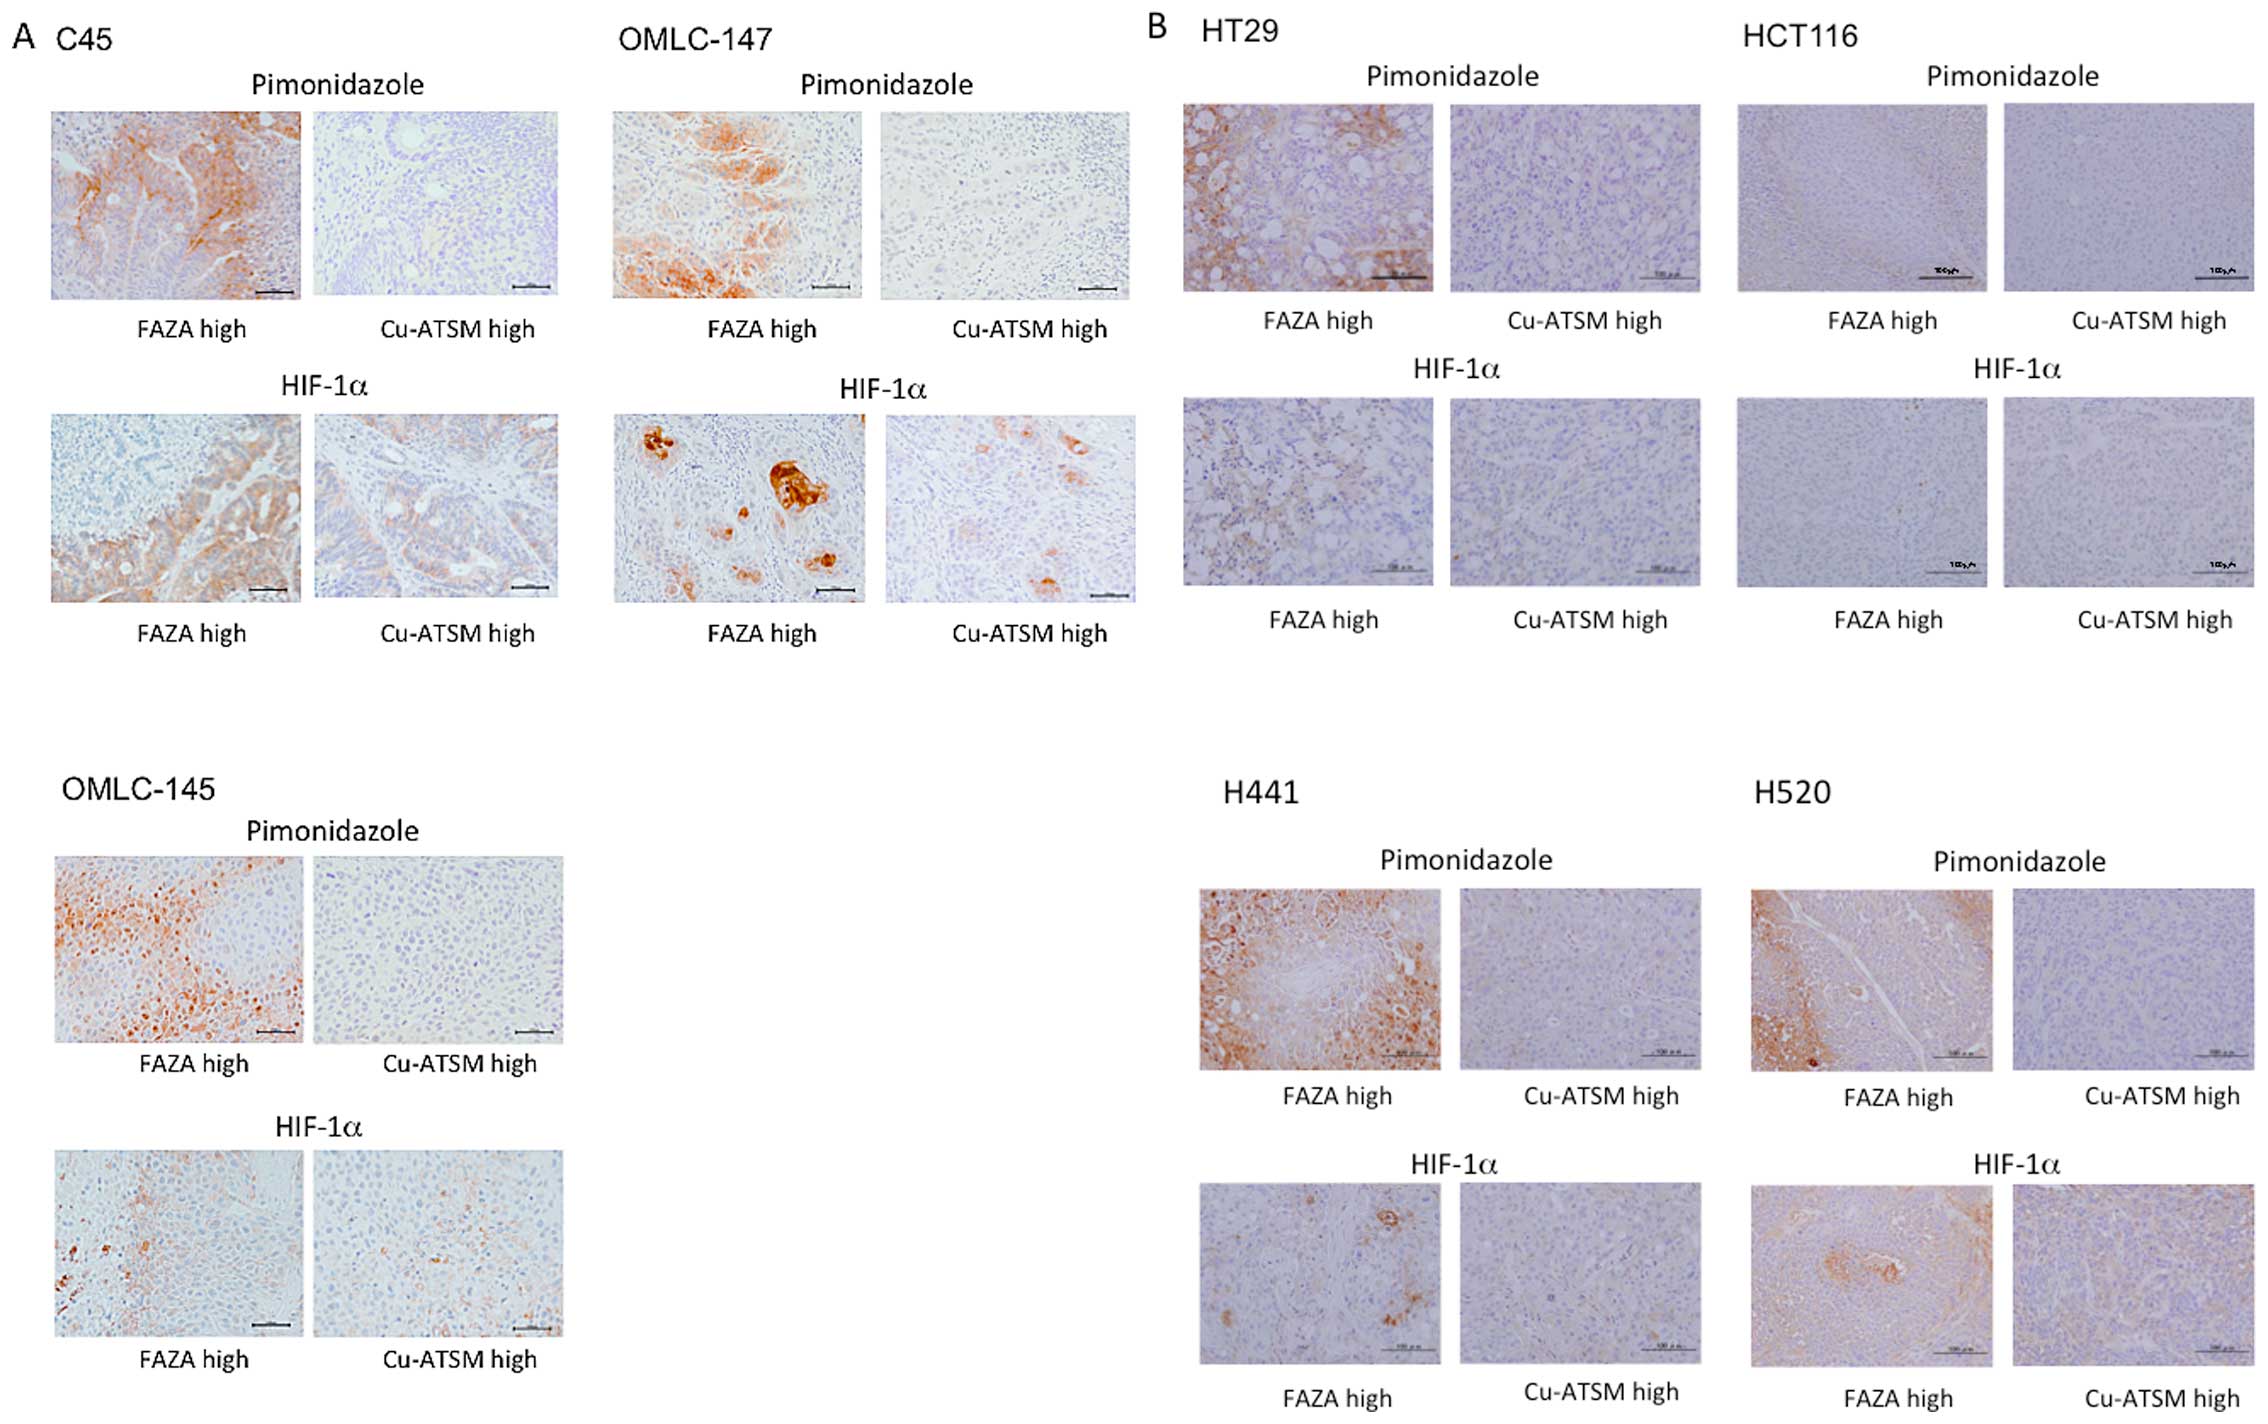
Pimonidazole adducts and HIF-1α in areas
of high accumulation of FAZA or Cu-ATSM
We compared intratumoral distributions of FAZA and
Cu-ATSM with the staining for pimonidazole adducts and HIF-1α in
the neighboring sections of CTOS C45 and OMLC-147 xenografts
(Fig. 3). Pimonidazole and HIF-1α
showed distinct staining patterns with some overlap. Most of the
pimonidazole staining was found in the area of high FAZA
accumulation, while the HIF-1α signal overlapped with both the
areas enriched in FAZA and Cu-ATSM.
The extent of staining for pimonidazole adducts and
HIF-1α in areas of high FAZA and Cu-ATSM accumulation was then
compared in several xenografts. Representative images of
immunohistochemical staining for 3 CTOSs and 4 cell lines are shown
in Fig. 4 and overlap ratios of
areas stained for pimonidazole and HIF-1α and areas of high FAZA
and Cu-ATSM accumulation are given in the Table II. In all the xenografts tested,
moderate to intensive staining for pimonidazole adducts was
observed in regions enriched with FAZA, while only minimal staining
was detected in areas of high Cu-ATSM accumulation. Significant
differences of the ratios of pimonidazole stained areas between the
regions enriched with FAZA and Cu-ATSM were observed in all cell
lines and CTOSs. In contrast, HIF-1α positive staining generally
did not discriminate between regions enriched with FAZA or Cu-ATSM
(Fig. 4; Table II). There was a trend for the
HIF-1α signal to overlap more with areas of high FAZA accumulation,
however this difference was notable only in H520 and OMLC-147
xenografts.
| Table IIImmunohistochemical staining for
pimonidazole and HIF-1α in areas of high accumulation of Cu-ATSM
and FAZA. |
Table II
Immunohistochemical staining for
pimonidazole and HIF-1α in areas of high accumulation of Cu-ATSM
and FAZA.
| HT29 | HCT116 | H441 | H520 | C45 | OMLC-147 | OMLC-145 |
|---|
| Pimonidazole
positive (%) |
| Area of high FAZA
accumulation | 12.20±4.89 | 11.97±6.98 | 13.1±8.83 | 8.03±6.73 | 19.86±12.87 | 23.48±9.94 | 17.98±5.67 |
| Area of high
Cu-ATSM accumulation | 0.93±0.73a | 0.73±0.10a | 0.05±0.07a | 0.04±0.03a | 0.36±0.32a | 0.15±0.24a | 0.05±0.05a |
| HIF-1α positive
(%) |
| Area of high FAZA
accumulation | 1.65±3.04 | 0.23±0.04 | 3.22±2.31 | 2.62±0.89 | 6.67±7.18 | 12.9±4.42 | 1.57±0.88 |
| Area of high
Cu-ATSM accumulation | 0.58±0.59 | 0.20±0.08 | 1.75±1.10 | 1.57±0.87a | 6.19±2.39 | 2.88±2.28a | 0.90±0.81 |
Relationship between the cellular uptake
of FAZA and Cu-ATSM and oxygen concentration
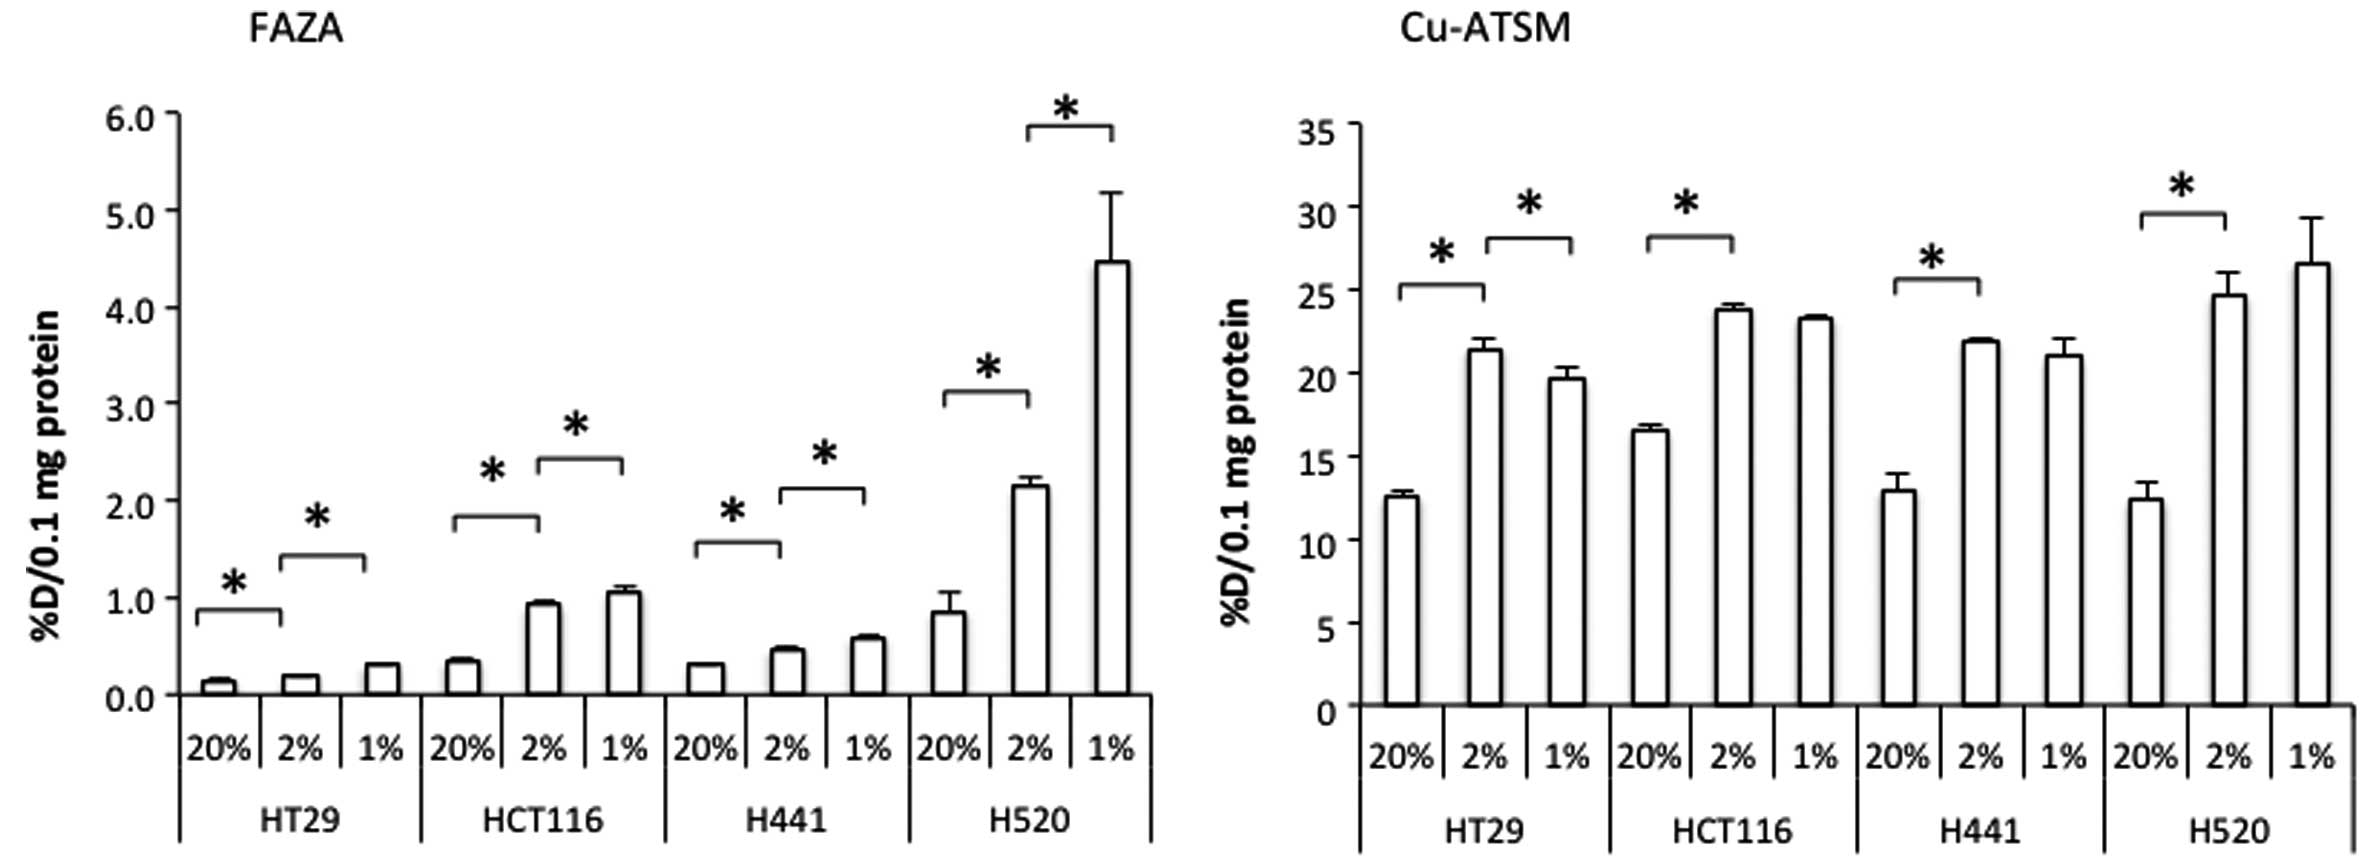
Under normoxic conditions, the cellular uptake of
FAZA normalized to 0.1 mg protein (an average amount present in
each well) comprised 0.2–1.0% of the total radioactivity added to a
well, while for Cu-ATSM this parameter was 10–20%. When the oxygen
concentration in the incubator was lowered from 20 to 2%, the
cellular uptake of both FAZA and Cu-ATSM was significantly enhanced
in all cell lines tested (Fig. 5).
The FAZA uptake was further increased by the reduction of oxygen
concentration from 2 to 1%. At the same time, the latter treatment
generally did not cause any further alterations in the Cu-ATSM
uptake. Moreover, the uptake of Cu-ATSM by HT29 cells at 1%
O2 was significantly lower than that at 2% O2
(Fig. 5).
Discussion
FAZA is a second generation nitroimidazole PET
tracer for hypoxia imaging with faster clearance from non-target
tissues compared to the first generation PET tracer FMISO (14). Sharing the same mechanism of
accumulation into hypoxic cells, FAZA and pimonidazole, a commonly
used hypoxia marker in histochemical studies, have been reported to
show similar intratumoral distributions (11,16).
This observation has been confirmed in the present study (Fig. 4). Hypoxia-dependent accumulation of
nitroimidazole PET tracers has also been demonstrated by
pO2 polarography (16,17).
Cu-ATSM was designed to release Cu ions inside the
cell, which would bind to cellular components and remain in the
intracellular compartments under over-reduced conditions but not in
normal conditions due to the finely tuned redox potential of the
Cu-bis-thiosemicarbazone complex (18). Using xenocybrid cells and a free
metal responsive reporter gene, Donnelly et al elegantly
demonstrated that the impaired electron transfer chain (ETC)
elevates intracellular NADH leading to the reduction of Cu-ATSM,
release of Cu ions and increased accumulation in intact cells
(19). Yoshii et al also
reported that the intracellular accumulation of radioactive Cu
after the addition of [64Cu]Cu-ATSM to the culture
medium is dependent on the increased cellular NADH and NADPH
(20). A study using a dog model
showed the accumulation of Cu radioactivity in the viable but
ischemic region after a Cu-ATSM injection (21,22).
According to another study, stroke-like lesions in a patient with
mitochondrial encephalomyopathy, lactic acidosis and stroke-like
episodes could be clearly visualized using Cu-ATSM (23). Collectively, these studies proved
the ability of Cu-ATSM to detect over-reduced conditions in
vivo. During hypoxia, the lack of oxygen decreases the electron
flow through ETC and causes buildup of NADPH and/or NADH that, in
turn, leads to the release and intracellular accumulation of Cu
ions from Cu-ATSM. Accordingly, the accumulation of Cu after the
administration of Cu-ATSM has been regarded as a marker of
hypoxia.
The ability of nitroimidazole compounds and Cu-ATSM
to predict prognosis (4–7) has been attributed to their
hypoxia-dependent accumulation in tumors. However, several recent
studies have noted differential intratumoral distributions of
Cu-ATSM and nitroimidazole compounds and raised questions on
whether Cu-ATSM accumulation is truly hypoxia-dependent (10,11).
In the present study, we detected a very limited overlap between
areas of high accumulation of FAZA and Cu-ATSM in xenografts
derived from human cancer cell lines of different origins and
several CTOSs in which intratumoral distribution of PET tracers is
similar to that observed in clinical studies (24). The extent of the regional overlap
detected by us (Figs. 1Figure 2–3; Table I)
was even less than the recently reported overlap between areas of
high FDG and Cu-ATSM accumulation that ranged from 1.4% for HT29
cell line to 26.0% for C45 CTOS (24). Therefore, our results, as well as
data from other studies, suggest that intratumoral distributions of
FAZA and Cu-ATSM are generally different and non-overlapping.
How could these two PET tracers, both designed to
accumulate into hypoxic tissues, show different intratumoral
distribution? Noticing the cell line-dependent temporal changes in
intratumoral distribution of Cu-ATSM, Valtorta et al
proposed that early distribution of Cu-ATSM (2 h after
administration) is still influenced by perfusion and late
distribution (24 h after administration) reflects the hypoxia
dependency (10). Hueting et
al argued that Cu-ATSM is unstable in vivo and the
distribution reflects the behavior of Cu-ion, based on the
similarity found between the tissue distribution patterns of
Cu-ATSM and Cu-acetate (25). Both
explain the different intratumoral distribution of nitroimidazole
compounds and Cu-ATSM. We have no direct evidence to oppose these
rationales, however, considering that
Cu-pyruvaldehyde-di(N4-methylthiosemicabazone) (Cu-PTSM), a PET
perfusion tracer which has similar structure to Cu-ATSM with higher
redox potential and more easily releases Cu-ion, showed different
intratumoral distribution at early time-point (10 min after
administration) (26) and different
tissue distribution (1–30 min after administration) (18) from Cu-ATSM, the influence of
perfusion to the early distribution of Cu-ATSM may be minor and the
early distribution may represent the inherent behavior of Cu-ATSM.
The stability of Cu-ATSM, reported as 60% stayed in intact form
after 30 min incubation with mouse brain homogenates and 90% with
mouse blood (27) and the rapid
clearance of Cu-ATSM from circulation, as reported only 3% ID/g
remained in blood at 1 min after injection in mice (27), would also support that the early
distribution mainly reflects the behavior of Cu-ATSM with released
Cu-ion playing smaller part. The late distribution is more likely
to be influenced by the released Cu-ion from the degraded complex.
We then conceived another possible cause for the different
intratumoral distribution between nitroimidazole compounds and
Cu-ATSM. When we looked at staining patterns of pimonidazole and
HIF-1α in comparison to intratumoral distributions of FAZA and
Cu-ATSM, we found that pimonidazole staining was mostly found in
regions demonstrating high FAZA accumulation, while it was
generally absent in the areas enriched with Cu-ATSM. In contrast,
we observed that HIF-1α staining was found in areas enriched with
either of the two PET tracers used. Pimonidazole was reported to
make adducts during hypoxia because of the lack of oxygen, such as
in conditions when its pressure is less than 10 mmHg, while HIF-1α
presence is thought to reflect a biological response to hypoxia
(28). Only a partial overlap of
these markers has been reported previously (29–31)
and this was also confirmed in the present study (Fig. 4). Pimonidazole adducts tended to be
located in areas more distant from the vessels and closer to
necrotic regions compared to HIF-1α signals (31). This may mean that pimonidazole
adducts are formed in areas more severely affected by hypoxia
compared to HIF-1α positive regions. On the basis of this
observation, we hypothesized that Cu-ATSM may accumulate in regions
with milder hypoxia compared to areas enriched with FAZA.
In our experiments in cell cultures, the Cu-ATSM
uptake at 20% oxygen was more than tenfold higher than that of FAZA
(Fig. 5). However, the increase in
the Cu-ATSM uptake caused by the reduction in oxygen concentration
from 20% to 1% was smaller than in the case of FAZA. As discussed
by Donnelly et al (19),
Cu-ATSM is more lipophilic than FAZA and may enter the cells and
stay within the cells even in the absence of reducing conditions as
long as Cu-ATSM continued to be present in the cell culture medium.
Notably, two quick washes with PBS could not remove non-reduced
Cu-ATSM from the cells. Another striking difference between Cu-ATSM
and FAZA was the dynamics of their uptake behavior upon the
decrease of the oxygen concentration in the chamber from 2 to 1%
(Fig. 5). The FAZA uptake was
augmented when the oxygen concentration was reduced from 20 to 2
and from 2 to 1%. As in the case with FAZA, the Cu-ATSM uptake
increased with the decrease in oxygen concentration from 20 to 2%,
however, it did not increase any further upon the reduction from 2
to 1% or even decreased slightly in the case of HT29 cell line. In
our setting, it took up to 20 min for the chamber oxygen
concentration to gradually reach the designated level, so the cells
were exposed sequentially to normoxic, mild hypoxic and severe
hypoxic conditions throughout the course of the experiment. We did
not have means to determine the oxygen concentration inside the
cells, but it is plausible that with the decrease of the designated
oxygen concentration in the chamber the cells were exposed to
severe hypoxia and the intracellular oxygen concentration dropped.
The lack of enhancement of the Cu-ATSM uptake with the change of
the oxygen concentration in the chamber from 2 to 1% (Fig. 5) may indicate that the level of
oxygen concentration needed for the reduction of Cu-ATSM in cancer
cells is higher than that of FAZA. Lewis et al reported that
the cellular uptake of Cu-ATSM started to increase at lower oxygen
concentration than FMISO (27),
which contradicts our result. In their experiments, cellular uptake
of Cu-ATSM was measured in cell suspension and that of FMISO in
monolayer culture. Because of the difference in the experimental
setting, it would be difficult to directly compare their results to
ours. Our observation suggests that Cu-ATSM may be a marker of mild
hypoxia, while FAZA accumulates predominantly in cells that endured
more profound hypoxic episodes.
By a combination of in vivo and in
vitro studies, we revealed the possibility that hypoxia affects
accumulation of both Cu-ATSM and FAZA in cancer cells, although the
buildup of Cu-ATSM occurs mainly during milder hypoxia, whereas
FAZA is enriched in regions that underwent more severe hypoxic
episodes. We propose that accumulation levels of FAZA and Cu-ATSM
should be considered as independent biomarkers.
Acknowledgments
We would like to thank the members of the Diagnostic
Imaging and Molecular Probe Program, the Molecular Imaging Center,
the National Institute of Radiological Sciences (NIRS) for their
helpful discussions and valuable suggestions. The present study was
supported by the Japan Advanced Molecular Imaging Program (J-AMP)
of the Ministry of Education, Culture, Sports, Science and
Technology, Japan (MEXT) and the NIRS.
References
|
1
|
Jain RK: Antiangiogenesis strategies
revisited: From starving tumors to alleviating hypoxia. Cancer
Cell. 26:605–622. 2014. View Article : Google Scholar : PubMed/NCBI
|
|
2
|
Vaupel P and Mayer A: Hypoxia in cancer:
Significance and impact on clinical outcome. Cancer Metastasis Rev.
26:225–239. 2007. View Article : Google Scholar : PubMed/NCBI
|
|
3
|
Harrison LB, Chadha M, Hill RJ, Hu K and
Shasha D: Impact of tumor hypoxia and anemia on radiation therapy
outcomes. Oncologist. 7:492–508. 2002. View Article : Google Scholar : PubMed/NCBI
|
|
4
|
Fleming IN, Manavaki R, Blower PJ, West C,
Williams KJ, Harris AL, Domarkas J, Lord S, Baldry C and Gilbert
FJ: Imaging tumour hypoxia with positron emission tomography. Br J
Cancer. 112:238–250. 2015. View Article : Google Scholar
|
|
5
|
Dehdashti F, Grigsby PW, Lewis JS,
Laforest R, Siegel BA and Welch MJ: Assessing tumor hypoxia in
cervical cancer by PET with 60Cu-labeled
diacetyl-bis(N4-methylthiosemicarbazone). J Nucl Med. 49:201–205.
2008. View Article : Google Scholar : PubMed/NCBI
|
|
6
|
Rischin D, Hicks RJ, Fisher R, Binns D,
Corry J, Porceddu S and Peters LJ: Trans-Tasman Radiation Oncology
Group Study 98.02: Prognostic significance of
[18F]-misonidazole positron emission tomography-detected
tumor hypoxia in patients with advanced head and neck cancer
randomly assigned to chemoradiation with or without tirapazamine: A
substudy of Trans-Tasman Radiation Oncology Group Study 98.02. J
Clin Oncol. 24:2098–2104. 2006. View Article : Google Scholar : PubMed/NCBI
|
|
7
|
Mortensen LS, Johansen J, Kallehauge J,
Primdahl H, Busk M, Lassen P, Alsner J, Sørensen BS, Toustrup K,
Jakobsen S, et al: FAZA PET/CT hypoxia imaging in patients with
squamous cell carcinoma of the head and neck treated with
radiotherapy: Results from the DAHANCA 24 trial. Radiother Oncol.
105:14–20. 2012. View Article : Google Scholar : PubMed/NCBI
|
|
8
|
Dence CS, Ponde DE, Welch MJ and Lewis JS:
Autoradiographic and small-animal PET comparisons between
(18)F-FMISO, (18) F-FDG, (18)F-FLT and the hypoxic selective
(64)Cu-ATSM in a rodent model of cancer. Nucl Med Biol. 35:713–720.
2008. View Article : Google Scholar : PubMed/NCBI
|
|
9
|
O'Donoghue JA, Zanzonico P, Pugachev A,
Wen B, Smith-Jones P, Cai S, Burnazi E, Finn RD, Burgman P, Ruan S,
et al: Assessment of regional tumor hypoxia using
18F-fluoromisonidazole and
64Cu(II)-diacetyl-bis(N4-methylthiosemicarbazone)
positron emission tomography: Comparative study featuring microPET
imaging, Po2 probe measurement, autoradiography, and fluorescent
microscopy in the R3327-AT and FaDu rat tumor models. Int J Radiat
Oncol Biol Phys. 61:1493–1502. 2005. View Article : Google Scholar : PubMed/NCBI
|
|
10
|
Valtorta S, Belloli S, Sanvito F, Masiello
V, Di Grigoli G, Monterisi C, Fazio F, Picchio M and Moresco RM:
Comparison of 18F-fluoroazomycin-arabinofuranoside and
64Cu-diacetyl-bis(N4-methylthiosemicarbazone) in
preclinical models of cancer. J Nucl Med. 54:1106–1112. 2013.
View Article : Google Scholar : PubMed/NCBI
|
|
11
|
Carlin S, Zhang H, Reese M, Ramos NN, Chen
Q and Ricketts SA: A comparison of the imaging characteristics and
microregional distribution of 4 hypoxia PET tracers. J Nucl Med.
55:515–521. 2014. View Article : Google Scholar : PubMed/NCBI
|
|
12
|
Kondo J, Endo H, Okuyama H, Ishikawa O,
Iishi H, Tsujii M, Ohue M and Inoue M: Retaining cell-cell contact
enables preparation and culture of spheroids composed of pure
primary cancer cells from colorectal cancer. Proc Natl Acad Sci
USA. 108:6235–6240. 2011. View Article : Google Scholar : PubMed/NCBI
|
|
13
|
Obata A, Kasamatsu S, McCarthy DW, Welch
MJ, Saji H, Yonekura Y and Fujibayashi Y: Production of therapeutic
quantities of (64)Cu using a 12 MeV cyclotron. Nucl Med Biol.
30:535–539. 2003. View Article : Google Scholar : PubMed/NCBI
|
|
14
|
Sorger D, Patt M, Kumar P, Wiebe LI,
Barthel H, Seese A, Dannenberg C, Tannapfel A, Kluge R and Sabri O:
[18F] Fluoroazomycin arabinofuranoside
(18FAZA) and [18F] Fluoromisonidazole
(18FMISO): A comparative study of their selective uptake
in hypoxic cells and PET imaging in experimental rat tumors. Nucl
Med Biol. 30:317–326. 2003. View Article : Google Scholar : PubMed/NCBI
|
|
15
|
Endo H, Okami J, Okuyama H, Kumagai T,
Uchida J, Kondo J, Takehara T, Nishizawa Y, Imamura F, Higashiyama
M, et al: Spheroid culture of primary lung cancer cells with
neuregulin 1/HER3 pathway activation. J Thorac Oncol. 8:131–139.
2013. View Article : Google Scholar : PubMed/NCBI
|
|
16
|
Busk M, Horsman MR, Jakobsen S, Keiding S,
van der Kogel AJ, Bussink J and Overgaard J: Imaging hypoxia in
xenografted and murine tumors with 18F-fluoroazomycin
arabinoside: A comparative study involving microPET,
autoradiography, PO2-polarography, and fluorescence microscopy. Int
J Radiat Oncol Biol Phys. 70:1202–1212. 2008. View Article : Google Scholar : PubMed/NCBI
|
|
17
|
Gagel B, Reinartz P, Dimartino E, Zimny M,
Pinkawa M, Maneschi P, Stanzel S, Hamacher K, Coenen HH, Westhofen
M, et al: pO(2) Polarography versus positron emission tomography
([(18)F] fluoromisonidazole, [(18)F]-2-fluoro-2′-deoxyglucose). An
appraisal of radiotherapeutically relevant hypoxia. Strahlenther
Onkol. 180:616–622. 2004. View Article : Google Scholar : PubMed/NCBI
|
|
18
|
Fujibayashi Y, Taniuchi H, Yonekura Y,
Ohtani H, Konishi J and Yokoyama A: Copper-62-ATSM: A new hypoxia
imaging agent with high membrane permeability and low redox
potential. J Nucl Med. 38:1155–1160. 1997.PubMed/NCBI
|
|
19
|
Donnelly PS, Liddell JR, Lim S, Paterson
BM, Cater MA, Savva MS, Mot AI, James JL, Trounce IA, White AR, et
al: An impaired mitochondrial electron transport chain increases
retention of the hypoxia imaging agent
diacetylbis(4-methylthiosemicarbazonato)copperII. Proc Natl Acad
Sci USA. 109:47–52. 2012. View Article : Google Scholar :
|
|
20
|
Yoshii Y, Yoneda M, Ikawa M, Furukawa T,
Kiyono Y, Mori T, Yoshii H, Oyama N, Okazawa H, Saga T, et al:
Radiolabeled Cu-ATSM as a novel indicator of overreduced
intracellular state due to mitochondrial dysfunction: Studies with
mitochondrial DNA-less ρ0 cells and cybrids carrying MELAS
mitochondrial DNA mutation. Nucl Med Biol. 39:177–185. 2012.
View Article : Google Scholar
|
|
21
|
Lewis JS, Herrero P, Sharp TL, Engelbach
JA, Fujibayashi Y, Laforest R, Kovacs A, Gropler RJ and Welch MJ:
Delineation of hypoxia in canine myocardium using PET and
copper(II)-diacetyl-bis(N(4)-methylthiosemicarbazone). J Nucl Med.
43:1557–1569. 2002.PubMed/NCBI
|
|
22
|
Takahashi N, Fujibayashi Y, Yonekura Y,
Welch MJ, Waki A, Tsuchida T, Sadato N, Sugimoto K, Nakano A, Lee
JD, et al: Copper-62 ATSM as a hypoxic tissue tracer in myocardial
ischemia. Ann Nucl Med. 15:293–296. 2001. View Article : Google Scholar : PubMed/NCBI
|
|
23
|
Ikawa M, Okazawa H, Arakawa K, Kudo T,
Kimura H, Fujibayashi Y, Kuriyama M and Yoneda M: PET imaging of
redox and energy states in stroke-like episodes of MELAS.
Mitochondrion. 9:144–148. 2009. View Article : Google Scholar : PubMed/NCBI
|
|
24
|
Furukawa T, Yuan Q, Jin ZH, Aung W, Yoshii
Y, Hasegawa S, Endo H, Inoue M, Zhang MR, Fujibayashi Y, et al:
Comparison of intratumoral FDG and Cu-ATSM distributions in cancer
tissue originated spheroid (CTOS) xenografts, a tumor model
retaining the original tumor properties. Nucl Med Biol. 41:653–659.
2014. View Article : Google Scholar : PubMed/NCBI
|
|
25
|
Hueting R, Kersemans V, Cornelissen B,
Tredwell M, Hussien K, Christlieb M, Gee AD, Passchier J, Smart SC,
Dilworth JR, et al: A comparison of the behavior of (64)Cu-acetate
and (64) Cu-ATSM in vitro and in vivo. J Nucl Med. 55:128–134.
2014. View Article : Google Scholar
|
|
26
|
Lewis JS, McCarthy DW, McCarthy TJ,
Fujibayashi Y and Welch MJ: Evaluation of 64Cu-ATSM in vitro and in
vivo in a hypoxic tumor model. J Nucl Med. 40:177–183.
1999.PubMed/NCBI
|
|
27
|
Wada K, Fujibayashi Y and Yokoyama A:
Copper(II) [2,3-butanedionebis(N4-methylthiosemicarbazone)], a
stable superoxide dismutase-like copper complex with high membrane
penetrability. Arch Biochem Biophys. 310:1–5. 1994. View Article : Google Scholar : PubMed/NCBI
|
|
28
|
Semenza GL: HIF-1 mediates metabolic
responses to intratumoral hypoxia and oncogenic mutations. J Clin
Invest. 123:3664–3671. 2013. View Article : Google Scholar : PubMed/NCBI
|
|
29
|
Fujii H, Yamaguchi M, Inoue K, Mutou Y,
Ueda M, Saji H, Kizaka-Kondoh S, Moriyama N and Umeda IO: In vivo
visualization of heterogeneous intratumoral distribution of
hypoxia-inducible factor-1α activity by the fusion of
high-resolution SPECT and morphological imaging tests. J Biomed
Biotechnol. 2012:2627412012. View Article : Google Scholar
|
|
30
|
Jankovic B, Aquino-Parsons C, Raleigh JA,
Stanbridge EJ, Durand RE, Banath JP, MacPhail SH and Olive PL:
Comparison between pimonidazole binding, oxygen electrode
measurements, and expression of endogenous hypoxia markers in
cancer of the uterine cervix. Cytometry B Clin Cytom. 70:45–55.
2006. View Article : Google Scholar : PubMed/NCBI
|
|
31
|
Sobhanifar S, Aquino-Parsons C, Stanbridge
EJ and Olive P: Reduced expression of hypoxia-inducible
factor-1alpha in perinecrotic regions of solid tumors. Cancer Res.
65:7259–7266. 2005. View Article : Google Scholar : PubMed/NCBI
|