Introduction
Myelodysplastic syndrome (MDS) is a diverse group of
neoplastic bone marrow disorders characterized by abnormal cell
morphology and blood defects in the normal differentiation and
proliferation of hematopoietic precursors. Various subtypes of MDS
lead to acute myeloid leukemia (AML) (1). Chromosome aberrations in MDS have been
previously elucidated, and it is now known that an interstitial
deletion of chromosome 5 is the most common cytogenetic abnormality
in MDS (2). In addition, the common
deletion region (CDR) exists in 5q31–32 (3). One of the genes in this area is the
osteonectin (SPARC) gene. Investigation into the
relationship between the CDR gene and cell biology
facilitates further understanding of the pathogenesis MDS/AML.
SPARC has been described as a counter-adhesive,
matricellular protein with a variety of biological functions
associated with morphogenesis, remodeling, cell migration and
proliferation (4). The expression
of SPARC occurs in different types of cancer, however, its role in
tumorigenesis appears to be complex and not well-defined (5). For example, SPARC expression is high
in breast and colorectal cancer (6,7), but
low in prostate and lung cancer (8,9).
Moreover, haploinsufficiency of SPARC in the 5q-syndrome
potentially increases the adhesion of hematopoietic stem cells to
the supporting stromal cells, providing a clonal advantage
(10). Elevated SPARC expression
inhibits the growth of tumor cells in the 5q-syndrome, whereas a
low expression leads to tumor development. Therefore lenalidomide,
a drug known to elevate SPARC expression, has been used to treat
patients with the 5q-syndrome (11).
Cytarabine (cytosine arabinoside, Ara-C) is commonly
used as a treatment for MDS, when combined with other
chemotherapeutic agents. It comprises pyrimidine antimetabolite,
which interferes with the DNA synthesis of the cells in the S phase
of the cell cycle by inhibiting DNA polymerase. Cell apoptosis by
cytarabine was induced dose dependently, which may play a role in
cell cycle regulation and show that induces quiescent and
proliferating tumor cells (12).
DNA microarray technology has been used to gain an understanding of
biochemical pathway function, and identify gene functions and
medicine targets (13). To gain
insight into MDS exposure to Ara-C, we investigated the use of gene
chip and RNA sequencing (RNA-seq) on SPARC overexpression combined
with Ara-C. The results of the DNA microarray were used to
determine transcription factor analysis (Tfscan), to detected the
mechanism of transcription factors contact long non-coding RNA
(IncRNA) regulate genes and promotes programmed cell death.
Materials and methods
Construction of SPARC recombinant
lentivirus
We used a lentivirus vector containing a CMV-driven
GFP reporter and a U6 promoter upstream of the cloning sites
(AgeI and EcoRI) to clone SPARC mRNA. The target
sequence for SPARC was, 5′-CCAGGTGGAAGTAGGAGAATT-3′; and the
NC-GFP-LV sequence was, 5′-TTCTCCGAACGTGTCACGT-3′. SPARC cDNA was
amplified by reverse transcription-polymerase chain reaction
(RT-PCR) and subcloned into a lentiviral vector pGC-GV SPARC
(Jikai, Shanghai, China). This allowed for the construction of a
recombinant lentiviral vector designated as pGC-GV-SPARC. According
to the operation manual, the packaging of the retrovirus in 293
cells, Lipofectamine 2000, pHelper 1.0 and pHelper 2.0 (Jikai) were
used, prior to the collection of the supernatants for
determination.
Cell culture
The MDS/AML cell line SKM-1 was provided by
Professor Zhou Jianfeng at Tongji Medical College, Huazhong
University of Science Technology and cultured in a RPMI-1640 medium
prior to its supplementation with 10% fetal bovine serum
(Gibco-BRL, Grand Island, NY, USA) in a humid atmosphere at 37°C
with 5% CO2.
Cells transfection using SPARC
recombinant lentivirus
The cells were cultured in 6-well plates
(106 cells/ml) and infected with lentivirus at a
multiplicity of infection (MOI) of 100 for 10 h. The medium was
then replaced with a more basic medium. After 4 days, the cells
were observed under a fluorescence microscope and flow cytometry to
evaluate the efficiency of the infection.
RT-PCR and quantitative PCR
The total RNA of the samples in each group was
extracted from the cells using RNAiso Plus (Takara Biotechnology,
Dalian, China) and was then used for cDNA synthesis. In terms of
the RT-PCR, each well (25 µl reaction volume) contained 12.5
µl Taq (Takara Biotechnology), 1 µl of each primer
(10 µmol/l), 2 µl cDNA template (50 ng/µl) and
8.5 µl ddH2O. The cycling parameters used were
as: 97°C for 5 min, then 30 cycles of 97°C for 1 min, 56°C for 30
sec and 72°C for 30 sec, and a final extension at 72°C for 7 min.
The RT-PCR results were analyzed using the Quantity One software
(Bio-Rad, Co., Hercules, CA, USA).
Quantitative PCR was performed using an ABI PRISM
7500 Real-Time PCR system (Applied Biosystems, Co., Hercules, CA,
USA). The total reaction system was 25 µl: SYBR Premix Ex
Taq II (12.5 µl), 1 µl of each primer (10
µmol/l) and 2 µl cDNA template (50 ng/µl), and
ddH2O (8.5 µl). All the primers were designed
using Primer 5 software and synthesized by Takara Biotechnology
(Table I). The relative gene
expression levels were quantified using the equation
2−ΔΔCt.
 | Table IQuantitative PCR primers used in the
present study. |
Table I
Quantitative PCR primers used in the
present study.
| Genes | Forward and reverse
primers | Product length
(bp) |
|---|
| SPARC | F:
5′-GGCCTGGATCTTTCTCCTT-3
R: 5′-CCCACAGATACCTCACCTC-3′ | 126 |
| β-actin | F:
5′-CCACGAAACTACCTTCAACTAA-3′
R: 5′-GTGATCTCCTTCTGCATCCTGT-3′ | 132 |
| CD164L2 | F:
5′-CACCCTCACCTCCAAGGAC-3′
R 5′-GTGACCTGAGTTCCCAGA-3′ | 106 |
| MLKL | F:
5′-TGTCTTTTCTCTCGTAGTT-3′
R: 5′-GAAGTCTGTGTTTTCCTCA-3′ | 184 |
| GALR3 | F:
5′-CCCCTCGCAAGCAGCCTCTGGG-3′
R: 5′-TGCAGGGCGTGCTTGAGGGG-3′ | 118 |
| ELP5 | F:
5′-ATCTGGACCCTCCTACCTCTGG-3′
R 5′-GATGCAGGCCTTCCAAGTTCT-3′ | 157 |
| NT5C2 | F:
5′-TGTTCTGAAAGCTGGGAGCA-3′
R: 5′-AGAAACTGACCTGAGTTTAA-3′ | 136 |
| AFM | F:
5′-TTCATTTTTATTTTTTATAG-3′
R: 5′-AAGTTGCCAGAAGGAACC-3′ | 141 |
| ATM | F:
5′-AATACGGAAATGTTAAGAAA-3′
R: 5′-GAATGTGCCTCTAATTGTAC-3′ | 142 |
| AKT1 | F:
5′-CCCGTTTTCAGACACAGCTC-3′
R: 5′-CTGCCTTCCCGTTGACCCAG-3′ | 137 |
| AKT3 | F:
5′-GTTCCTGTGTTAGTTTGCTT-3′
R: 5′-CTGCAAAGGACATGATCTTG-3′ | 105 |
| TP73 | F: 5′-CCTACGCACA
ACCCAGCTCC-3′
R: 5′-TCCCCTCCAACACCGACTAC-3′ | 117 |
| RFWD2 | F:
5′-CAATATTTCTACCAAATCAG-3′
R: 5′-AGAAACACGTACTCCACCAA-3′ | 112 |
Western blot analysis
The cells were lysed in 100 µl of a RIPA
buffer supplemented with 1 µl of PMSF, and the protein
concentration of the lysate was determined using a BCA protein
assay kit (Beyotime, Beijing, China). A total of 50 µg of
protein per lane was separated by SDS-PAGE and transferred to the
PVDF membranes. The membranes were blocked with 5% skim milk for 2
h and incubated overnight at 4°C with primer antibodies (mouse
anti-human monoclonal antibody 1:1,000; Abcam, Burlingame, CA, USA)
for SPARC/ATM/AKT3/AKT1/RFWD2/TP73. This was followed by incubation
using HRP-conjugated goat anti-rabbit or HRP-conjugated goat
anti-mouse (1:1,000) for 1 h at 37°C. The membranes were washed
four times with TBST and developed using the ECL method. The band
intensity was analyzed with Quantity One software.
Annexin V and 7-AAD assay of
apoptosis
The cells were collected (106 cells/ml)
and washed twice with phosphate-buffered saline (PBS) before
suspension in 200 µl binding buffer, 1 µl Annexin
V-PE and 5 µl 7-AAD (KeyGen Biotech, Shanghai, China) in the
dark for 15 min. The infection efficiency and the apoptotic cells
were determined by flow cytometry with CellQuest software (BD
Biosciences, USA). The pre-experimental testing time period for
detecting apoptosis was 48 h.
Affymetrix experiments and microarray
data analysis
Total RNA was extracted from the cells using TRIzol
(Takara Biotechnology). This process was completed according to the
manufacturer's instructions. The RNA samples examined were derived
from SKM-1 cells, SKM-1 cells treated with Ara-C, and
pGC-GV-SPARC-infected cells treated with Ara-C. For each sample, 50
ng of the total RNA were amplified and labeled with the two-cycle
'cDNA Synthesis' and the 'Two-Cycle Target Labeling and Control
Reagent' packages (Affymetrix, Santa Clara, CA, USA), according to
the manufacturer's instructions. The cell intensity calculation and
scaling were then performed, using GeneChip operating software
(GCOS). Data analysis was performed using GeneSpring 7.3 (Agilent
Technologies, USA) and clustering analysis.
TFscan images
The sequences of the differential expression genes
were identified using Jemboss software (Sanger Institute, Hinxton,
Cambridge). To determine the relationship between genes and
transcription factors, the correlation between the gene and
transcription factor sequences were identified. A transcription
factor regulation network (TF-Gene-Network) was established
regarding the interaction between the genes and transcription
factors. The networks core transcription factor was identified as
the most important center with the largest degree (14). The Pearson correlation analysis was
used to measure the regulatory ability of the transcription factors
by calculating the correlation between the transcription factors
and genes they regulate, as well as the correlation between genes
regulated by the same factors.
Statistical analysis
The results were presented as the mean ± SE and were
analyzed by Graphpad Prism 5 software. Each experiment was repeated
three times to ensure replication. The groups were compared through
analysis by one-way ANOVA. P<0.05 was considered to indicate a
statistically significant result.
Results
Sequencing result of antisense DNA
fragment is in accordance with the known SPARC gene
An enzyme digested the lentiviral pGC-GV-EGFP
vector, and the products in 2% agarose gel electrophoresis. As
shown in Fig. 1A, the enzyme
digestion products released in the second lane were 9,983 kb. The
results are consistent with the hypothesis that these products
could be used during the subsequent connection reaction. After
using the pcDNA-SPARC amplification of the SPARC gene as
primers of PCR templates (Fig. 1B),
we obtained the 955 bp target fragment, indicating the successful
extraction of SPARC.
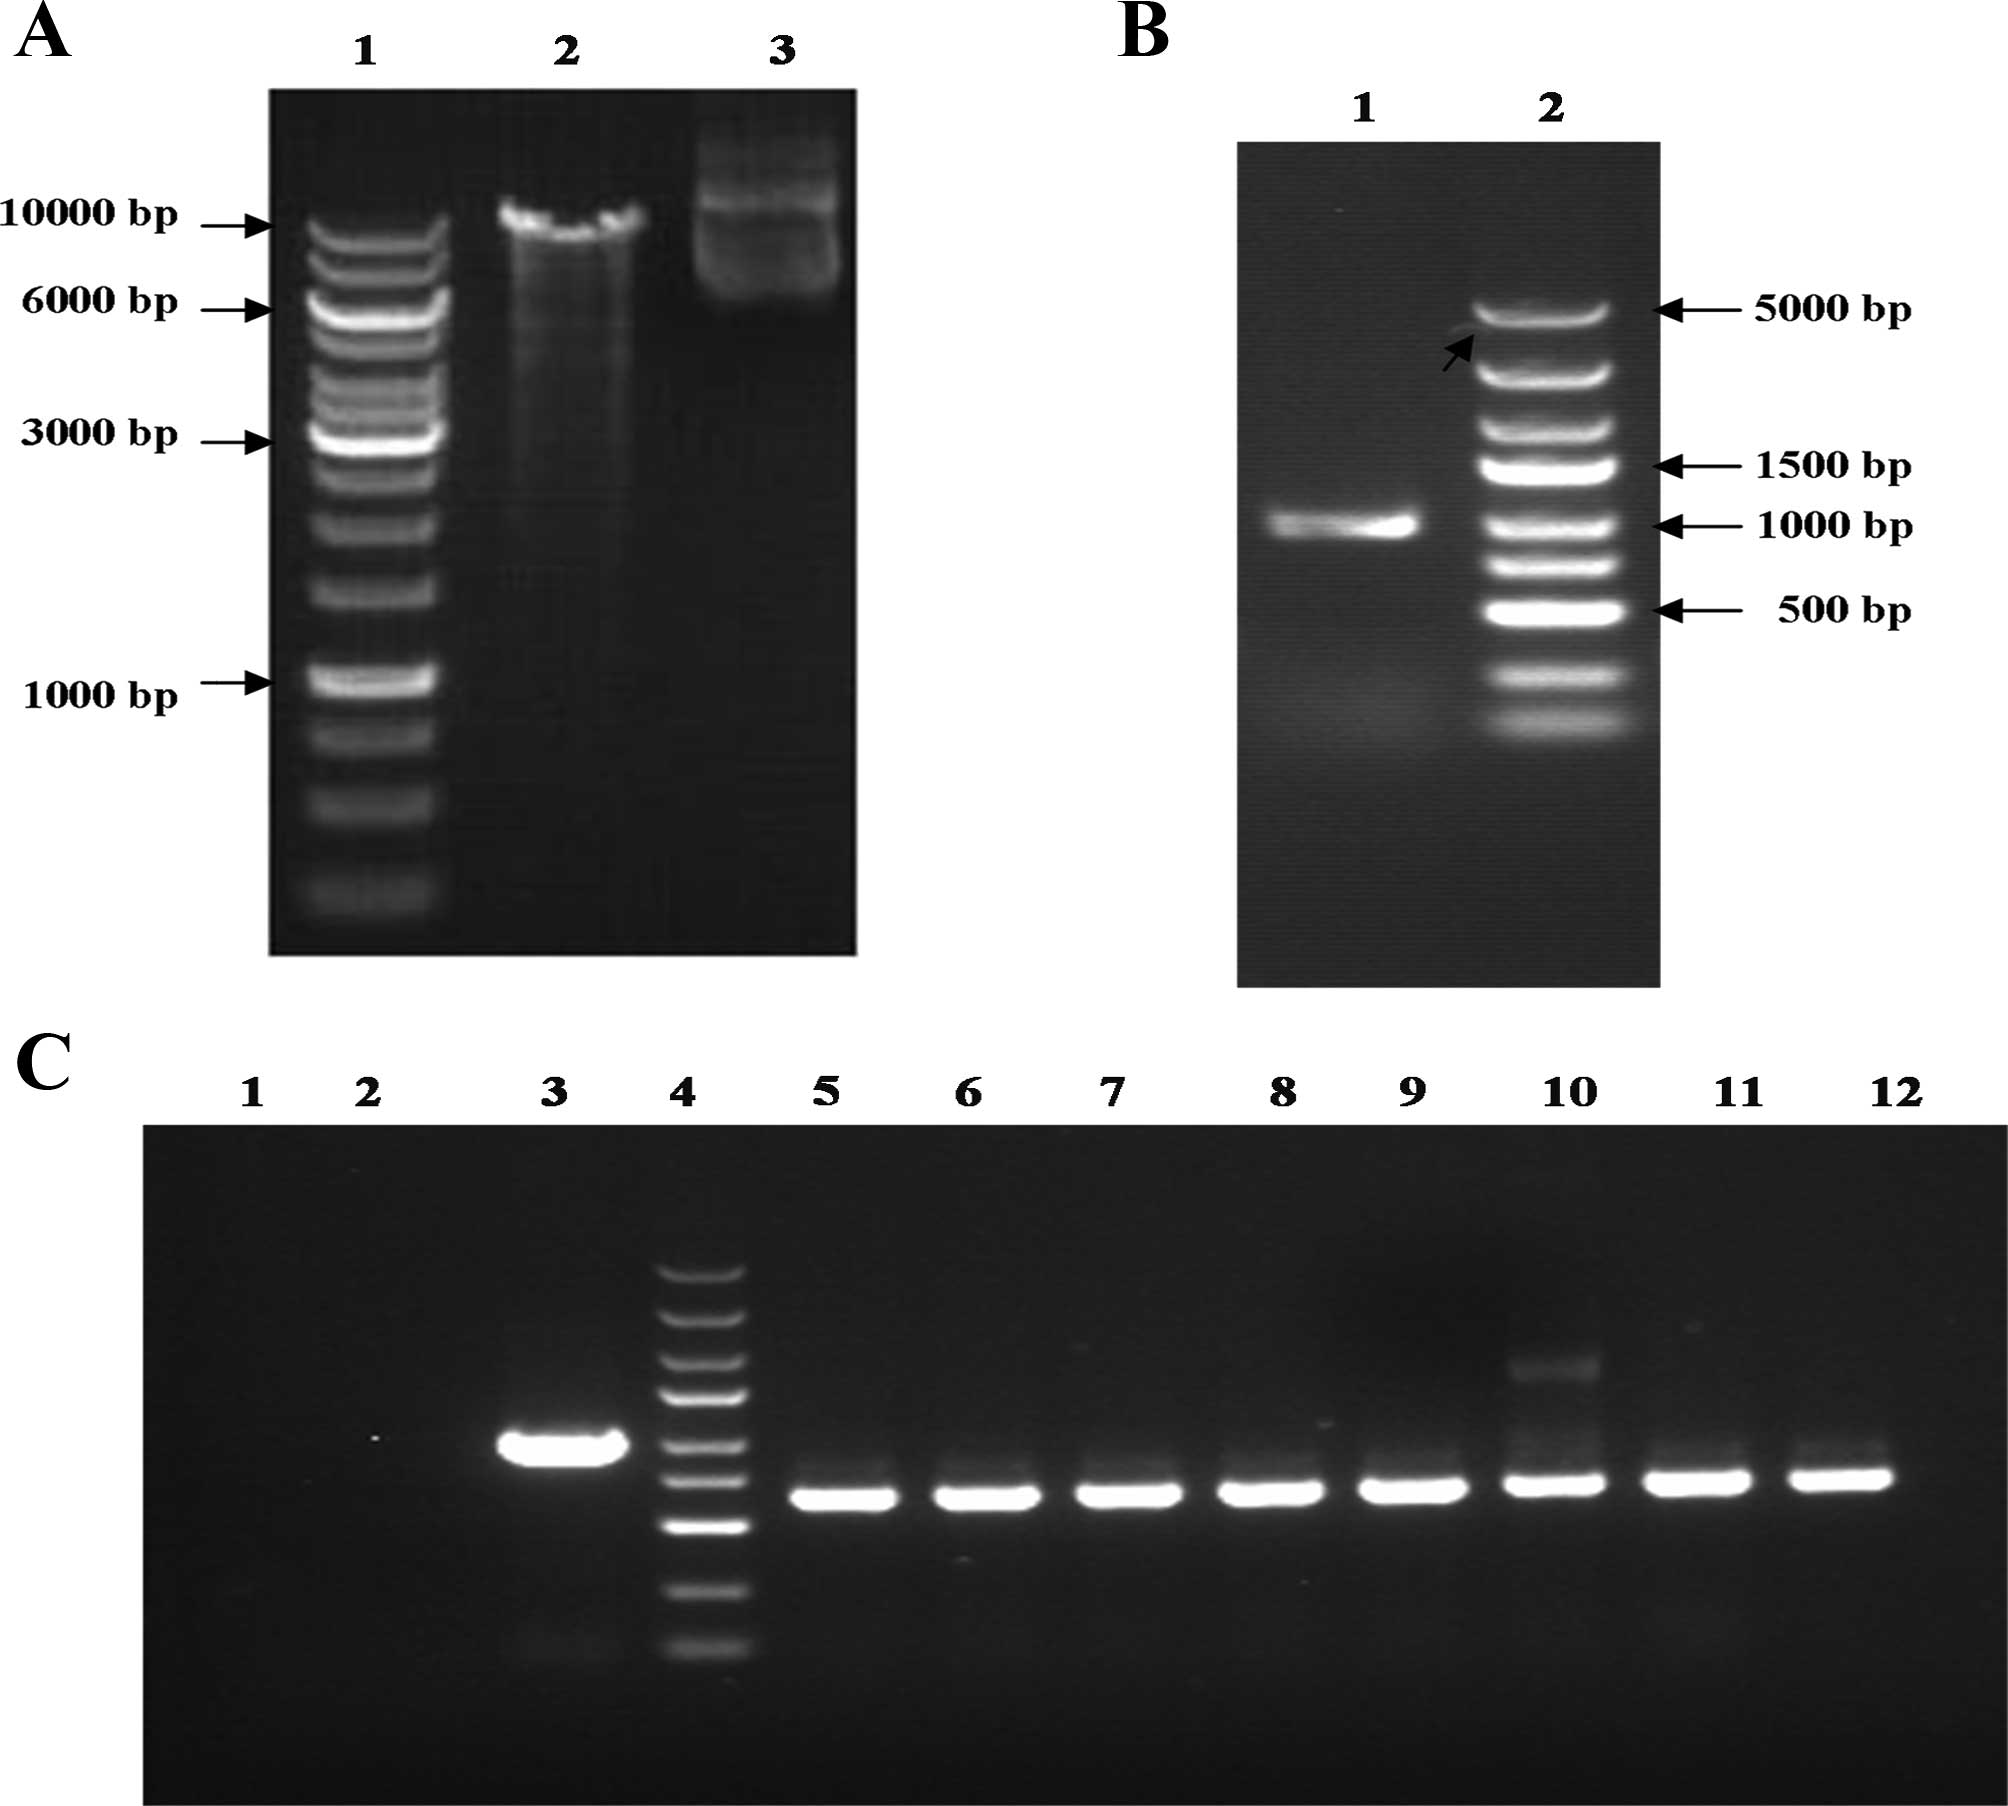 | Figure 1Enzyme products and identification of
pGC-GV-SPARC. (A) pGC-GV-EGFP was analyzed using SDS-PAGE. (Lane 1,
marker; lane 2, enzyme products; lane 3, non-enzyme products). (B)
SPARC fragment electrophoresis results by PCR (lane 1, SPARC; lane
2, marker). (C) PCR identifies pGC-GV-SPARC recombinant [lane 1,
the negative control (ddH2O); lane 2, NC-GFP-LV; lane 3,
positive control]; lane 4, marker (from top to bottom: 3, 2, 1.5
and 1 kb; and 750, 500, 250 and 100 bp, respectively); lanes 5–12,
SPARC transformant. SPARC, secreted protein acidic and rich in
cysteine. |
Vector construction and verification of
the positive clone using PCR
The pGC-GV-SPARC lentiviral vector-positive clone
PCR fragment size was 627 bp, a size consistent with the enzyme
results. The SPARC sequence obtained from pGC-GV SPARC was the same
as that of GenBank (Fig. 1C). This
result confirmed that we obtained the correct expression
product.
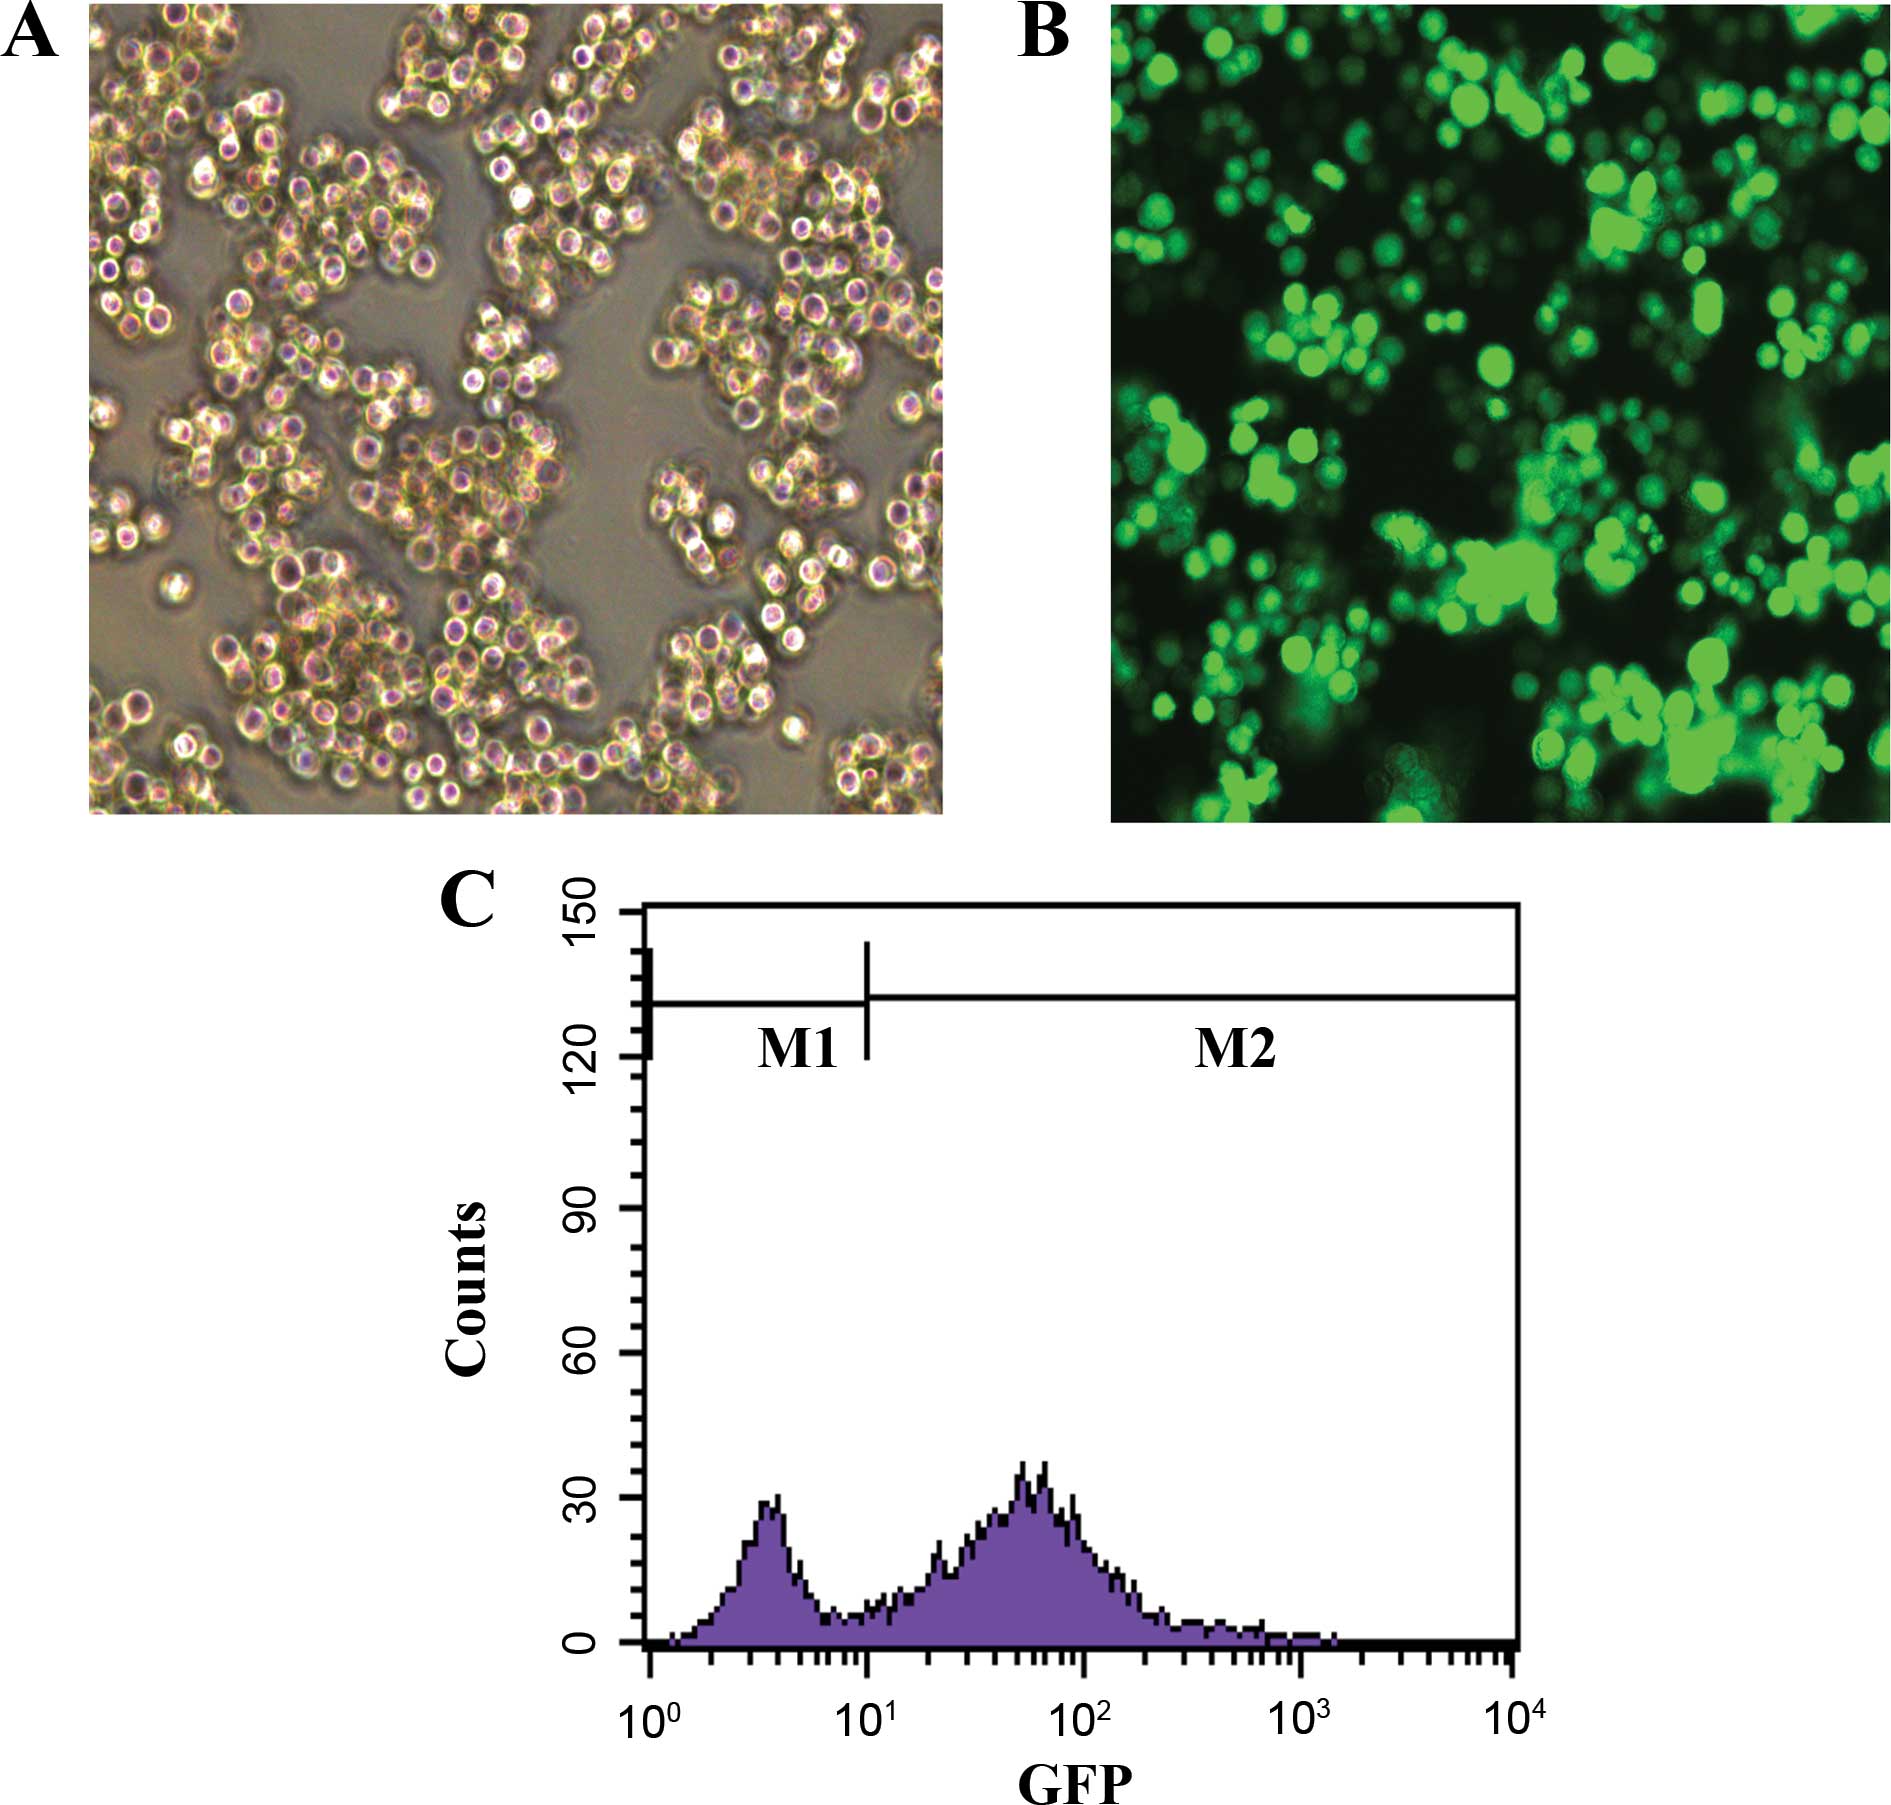
SPARC overexpression by lentivirus
mediated in SKM-1 cells
We constructed the SPARC overexpression lentivirus
vector and infected the SKM-1 cells. After the infection, we found
that 67.88±1.26% of cells were GFP-positive, indicating high
infection efficiency (Fig. 2).
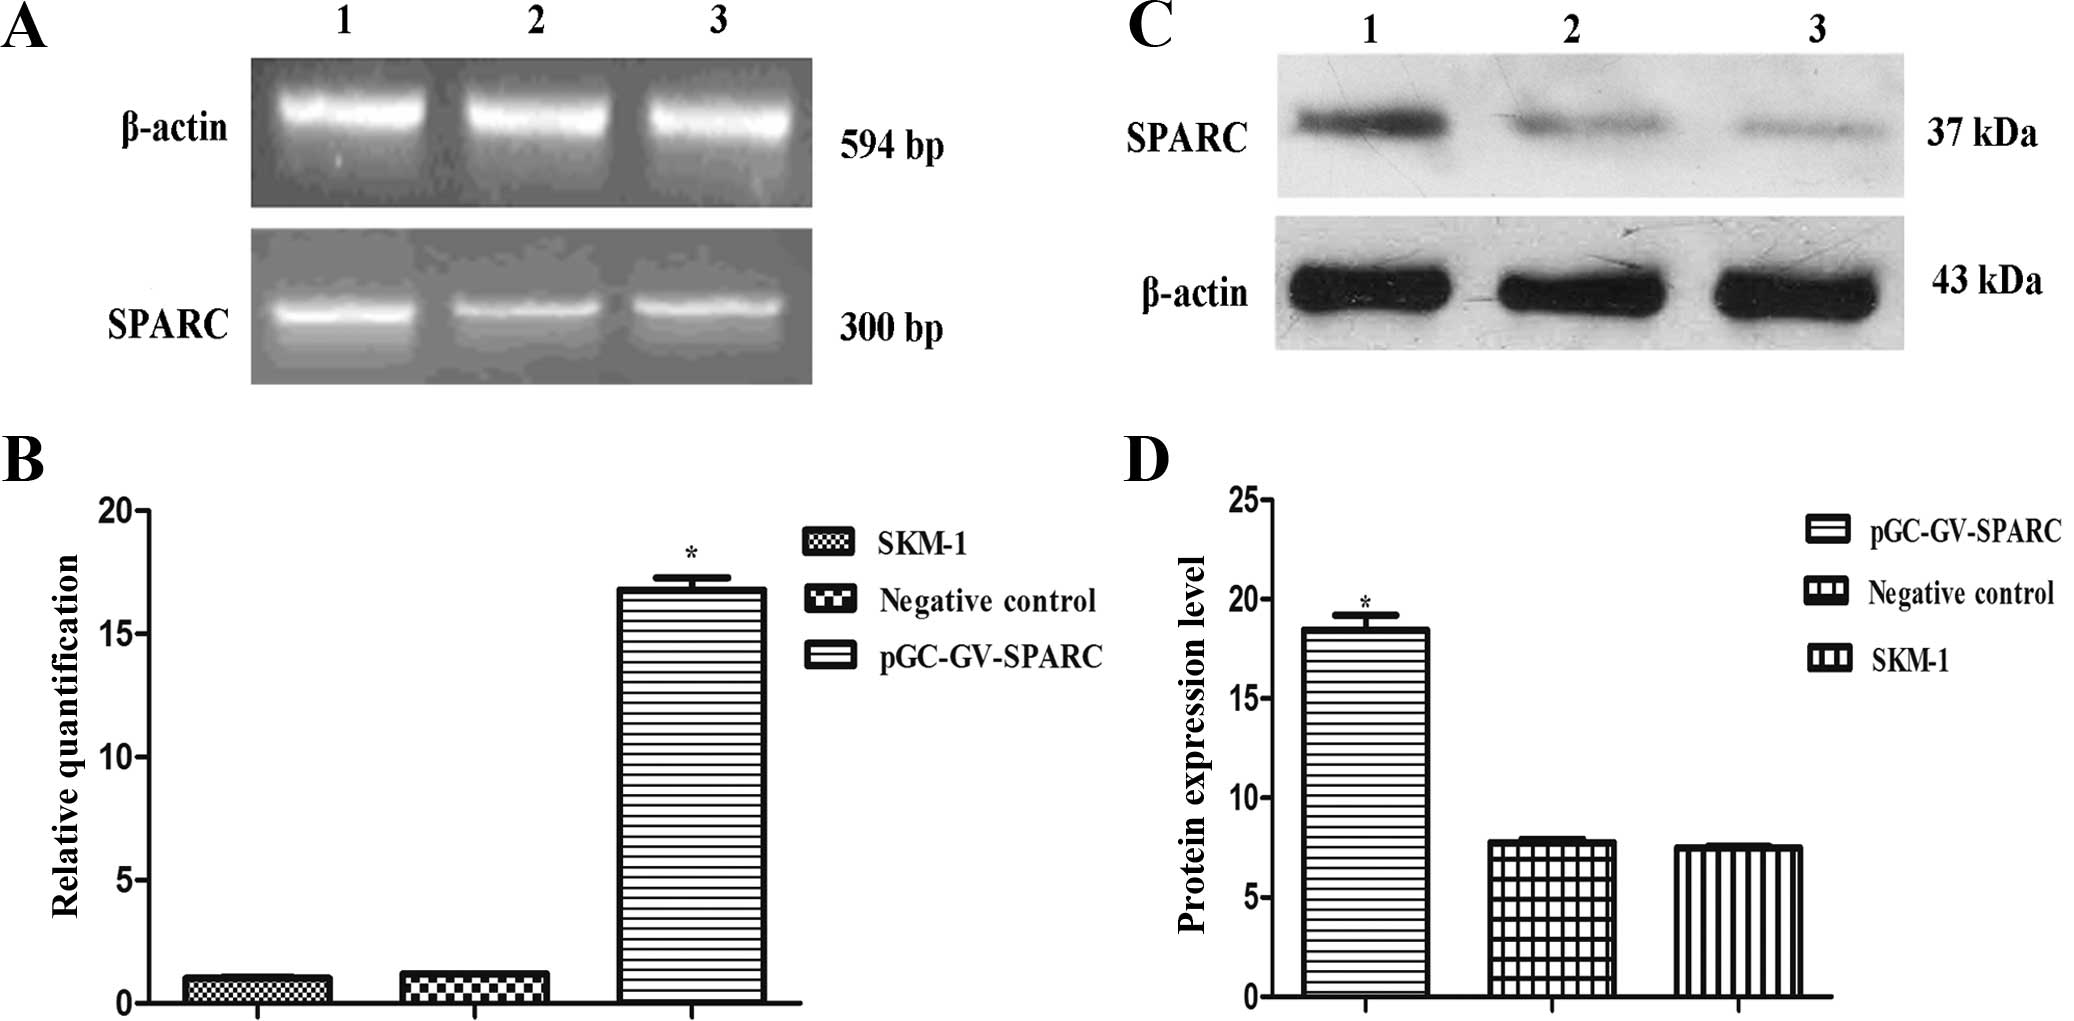
After 5 days, the 2−ΔΔCt value of cells treated with the
SPARC overexpression was increased to 13.2–15.7 when compared to
the 2−ΔΔCt values of the other two groups. RT-PCR and
western blot analysis showed that the SPARC overexpression
significantly increased SPARC levels for mRNA and protein (Fig. 3).
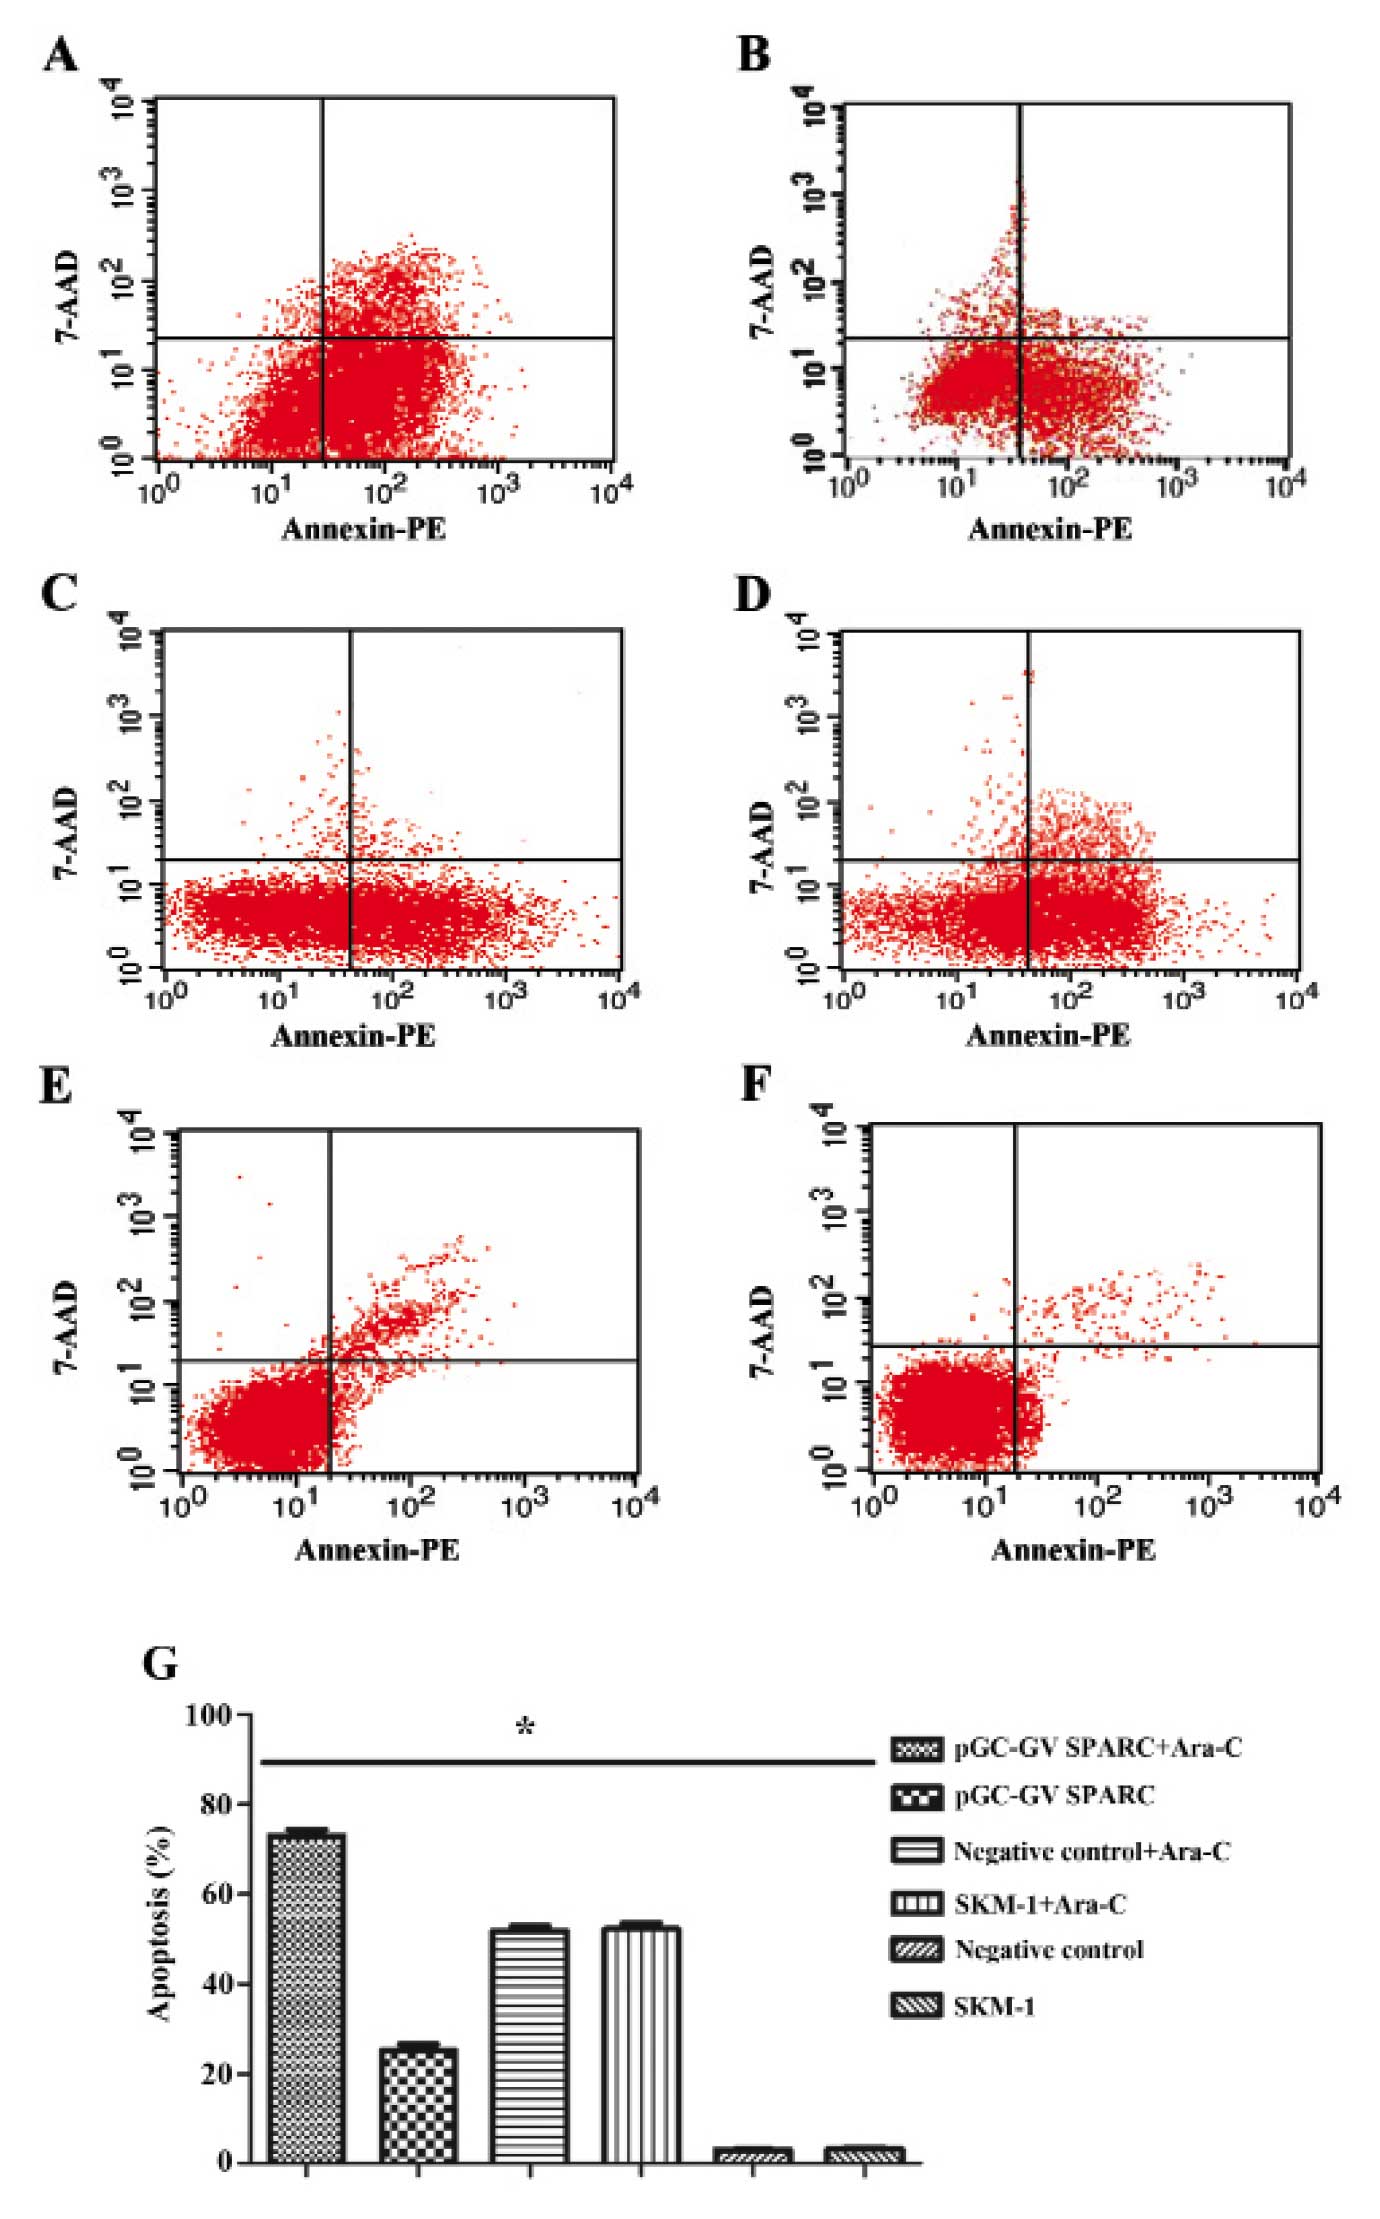
Flow cytometric analysis SPARC
overexpression associated with Ara-C in MDS cell apoptosis
To elucidate the mechanism by which SPARC with Ara-C
inhibits the proliferation of MDS cells, we performed a flow
cytometric analysis to evaluate apoptosis. The data showed ~70%
cell apoptosis with SPARC overexpression and Ara-C. In this
instance, the growth inhibition percentage of cells was much higher
than that of the other groups (P<0.05) (Fig. 4). These data indicate that the SPARC
overexpression associated with Ara-C inhibited MDS cell
proliferation, corresponding to the MTS results.
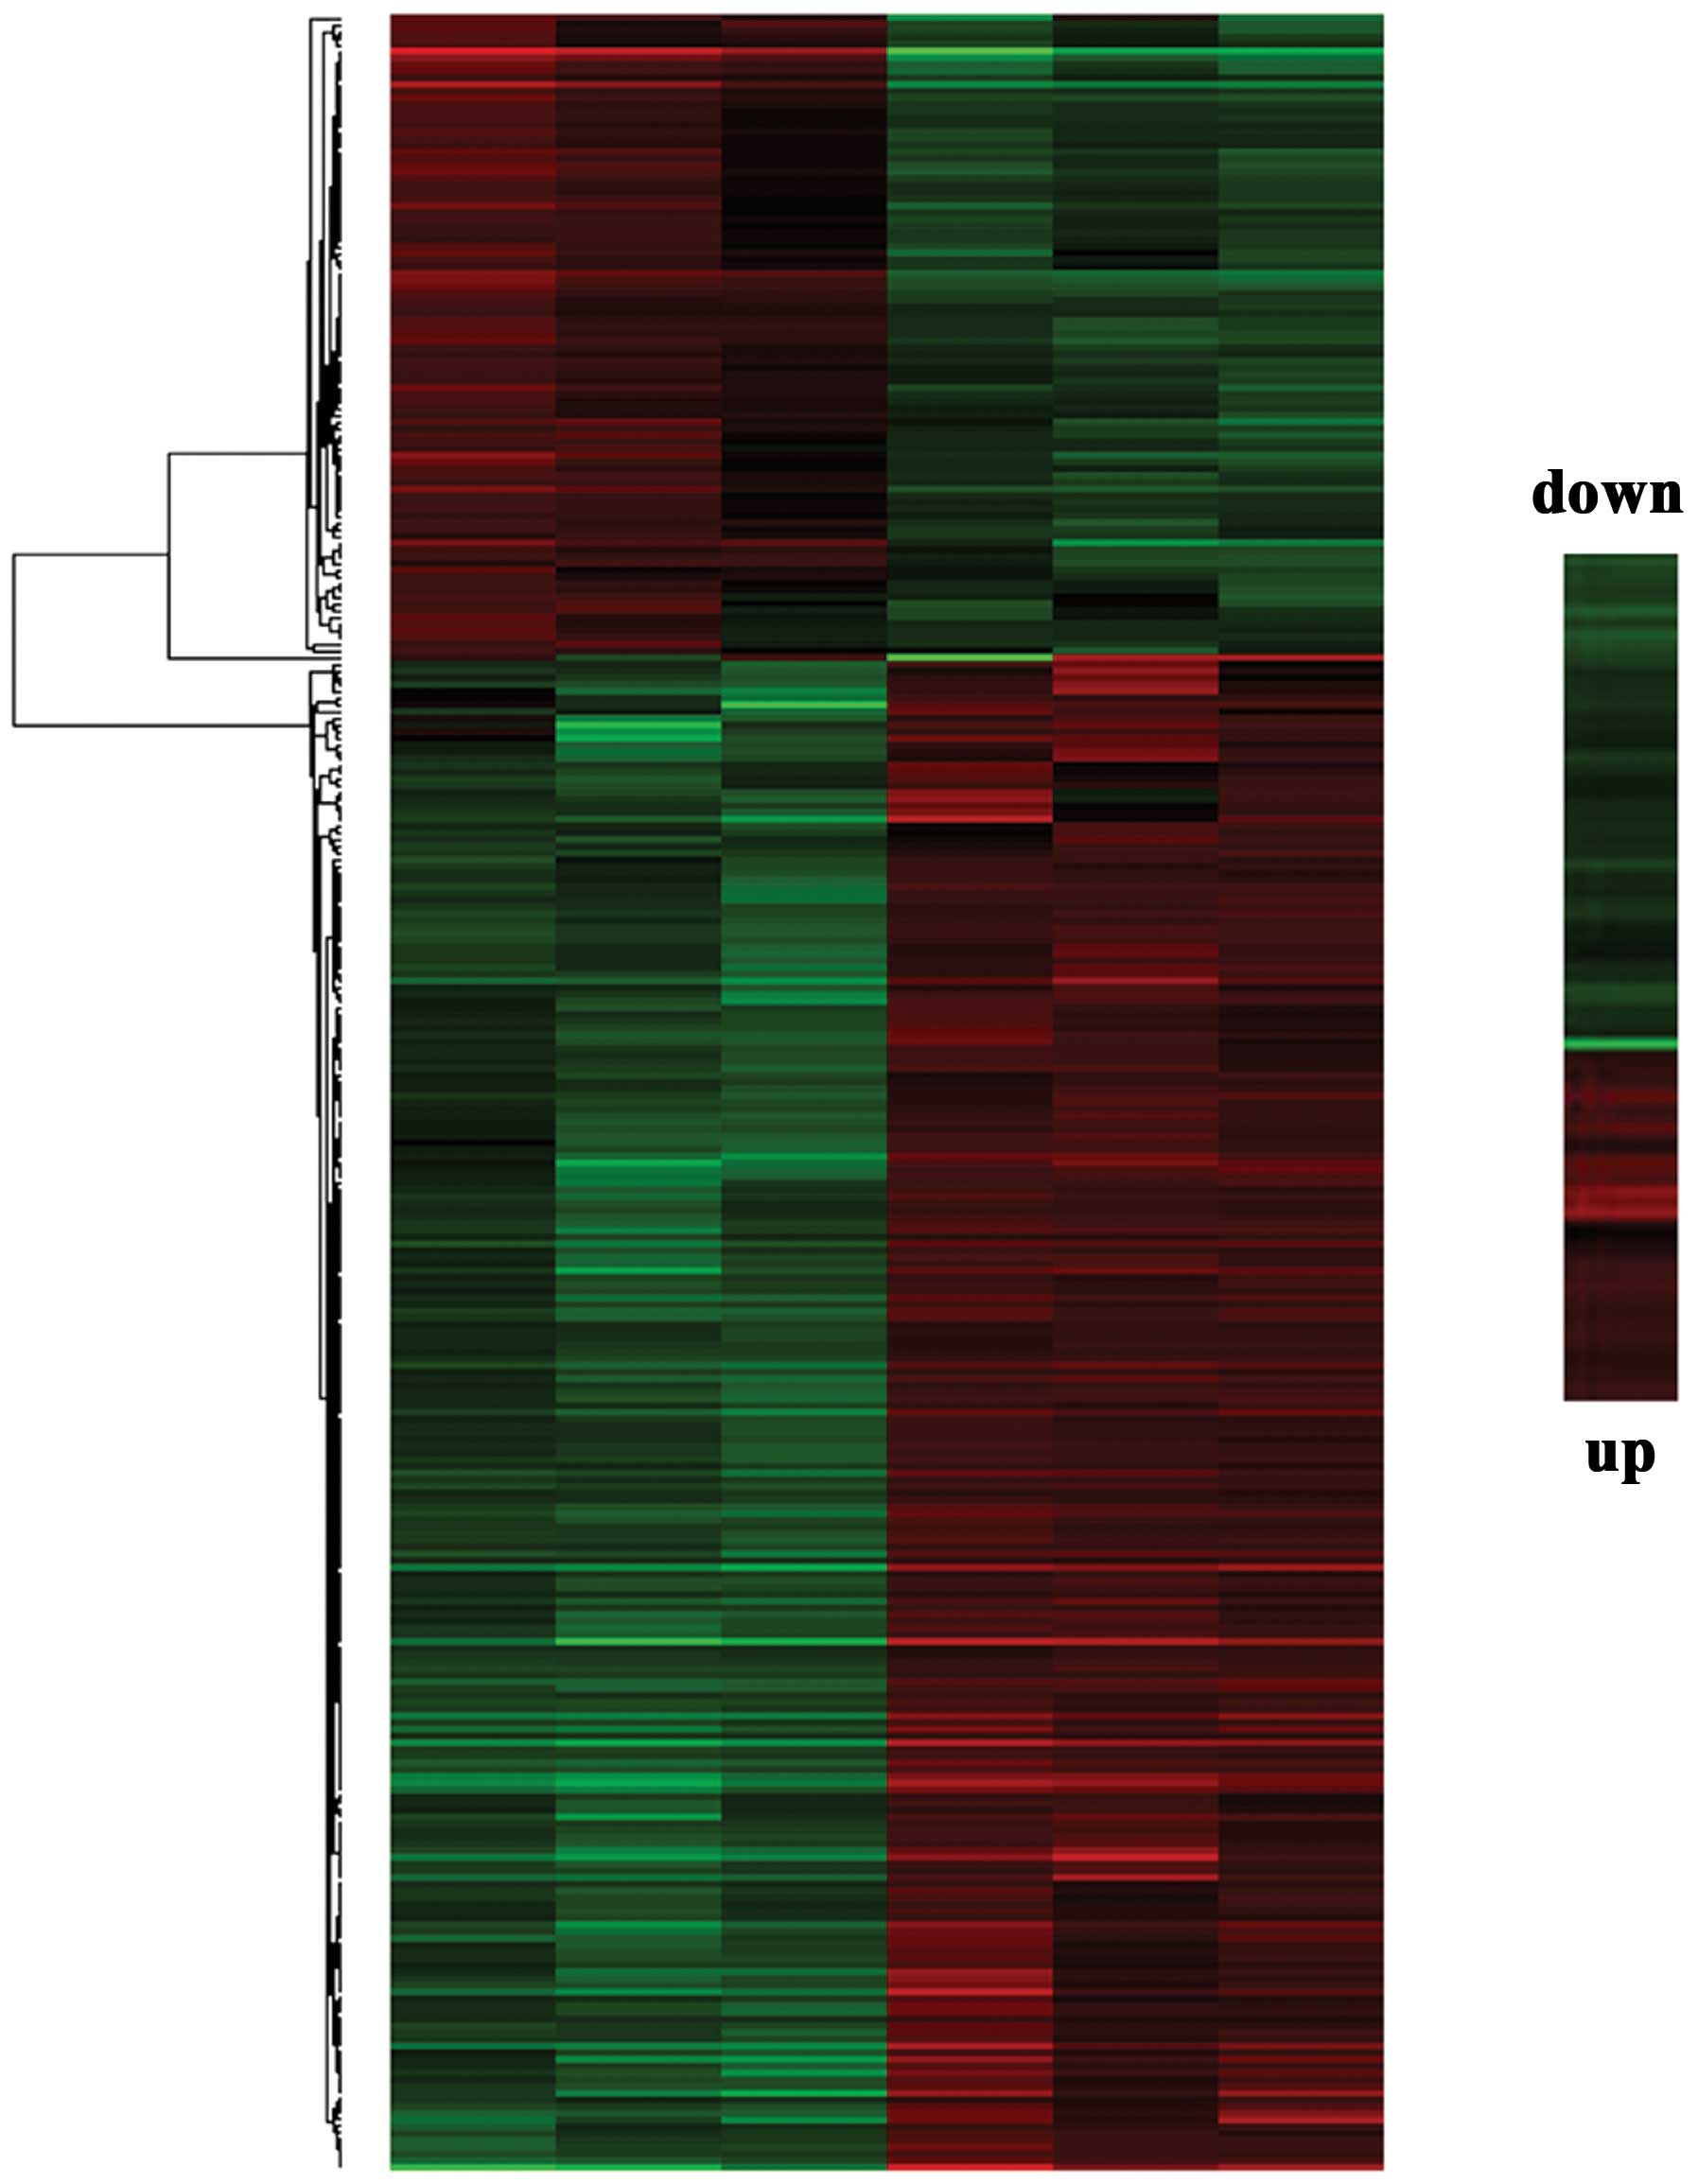
Gene transcription responses to Ara-C
exposure
Our experiment is based on a comparison of two
groups: SKM-1 cells treated with Ara-C and SPARC-overexpressing
SKM-1 cells treated with Ara-C. The analysis of the microarray
results revealed an upregulated expression in 566 genes and a
down-regulated expression in 106 gene transcription levels
(Fig. 5). The genes with the high
up- and downregulations identified were: mixed lineage kinase
domain-like (MLKL), CD164 silomucin-like-2 protein
(CD164L2) and galanin receptor 3 (GalR3), and
5′-nucleotidase cytosolic II (NT5C2), elongator
acetyltransferase complex subunit 5 (ELP5), and afamin
(AFM). These genes were selected for further investigation
according to their relevance to cell death and disease. The mRNA
expression levels of these genes were tested by a qPCR to validate
our microarray results. As shown in Fig. 6A and B, the RT-PCR results matched
our expression study, as was the case for the microarray experiment
results for the 6 genes.
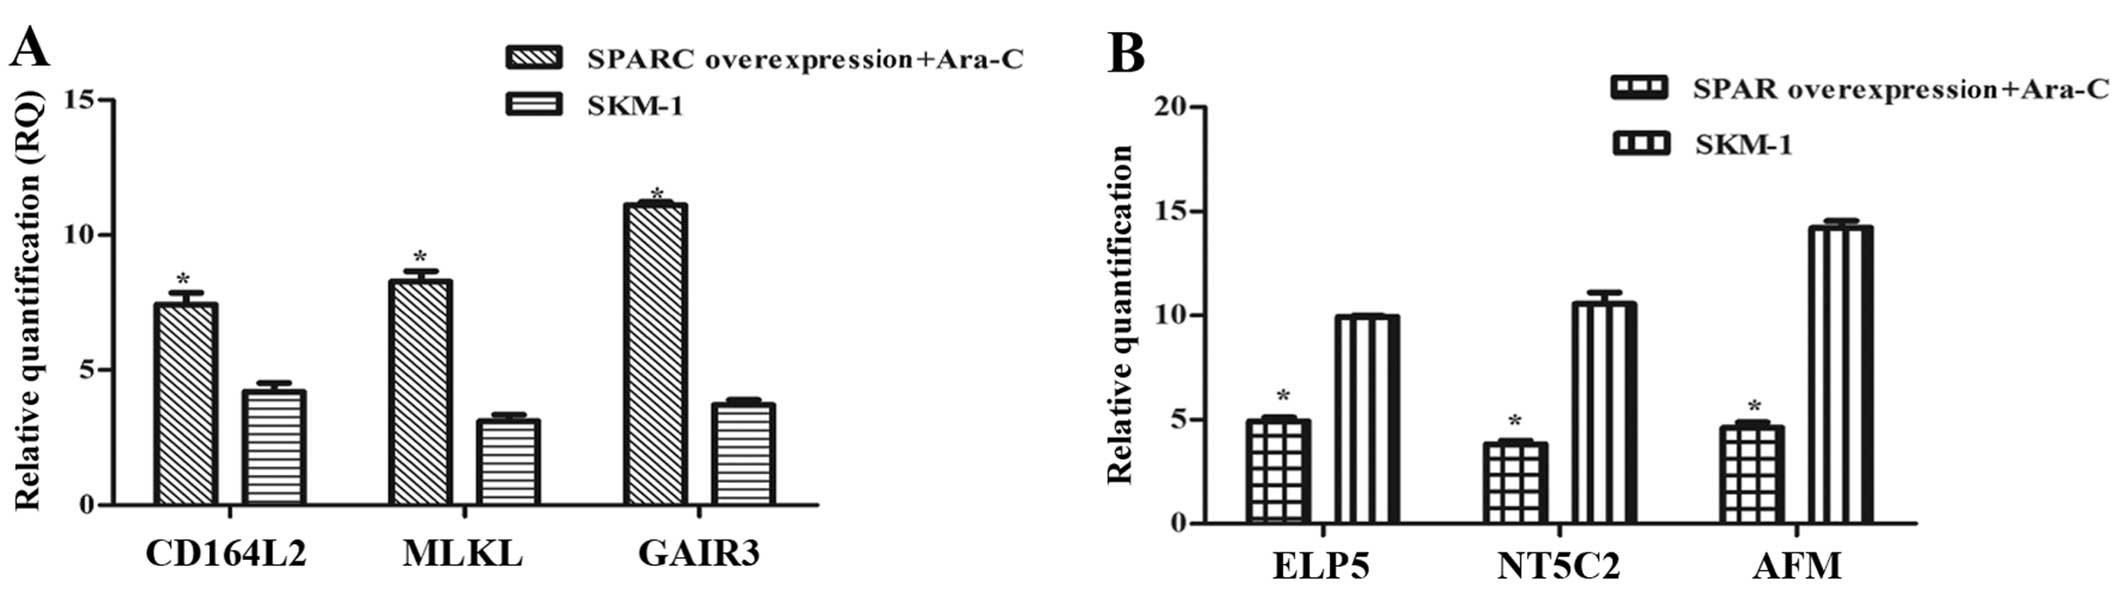 | Figure 6Validating microarray data by qPCR.
(A) CD164L2, MLKL and GalR3 were increased when SPARC
overexpression associated with Ara-C, the 2−ΔΔCt value
increased to 6.81–14.37 vs. other groups. (B) ELP5, NT5C2 and AFM
expression was decreased to a value of 3.67–13.55. MLKL, mixed
lineage kinase domain-like; GALR3, galanin receptor 3; SPARC,
secreted protein acidic and rich in cysteine; Ara-C, analogue
cytosine arabinoside; ELP5, elongator acetyltransferase complex
subunit 5; NT5C2, 5′-nucleotidase cytosolic II; AFM, afamin. |
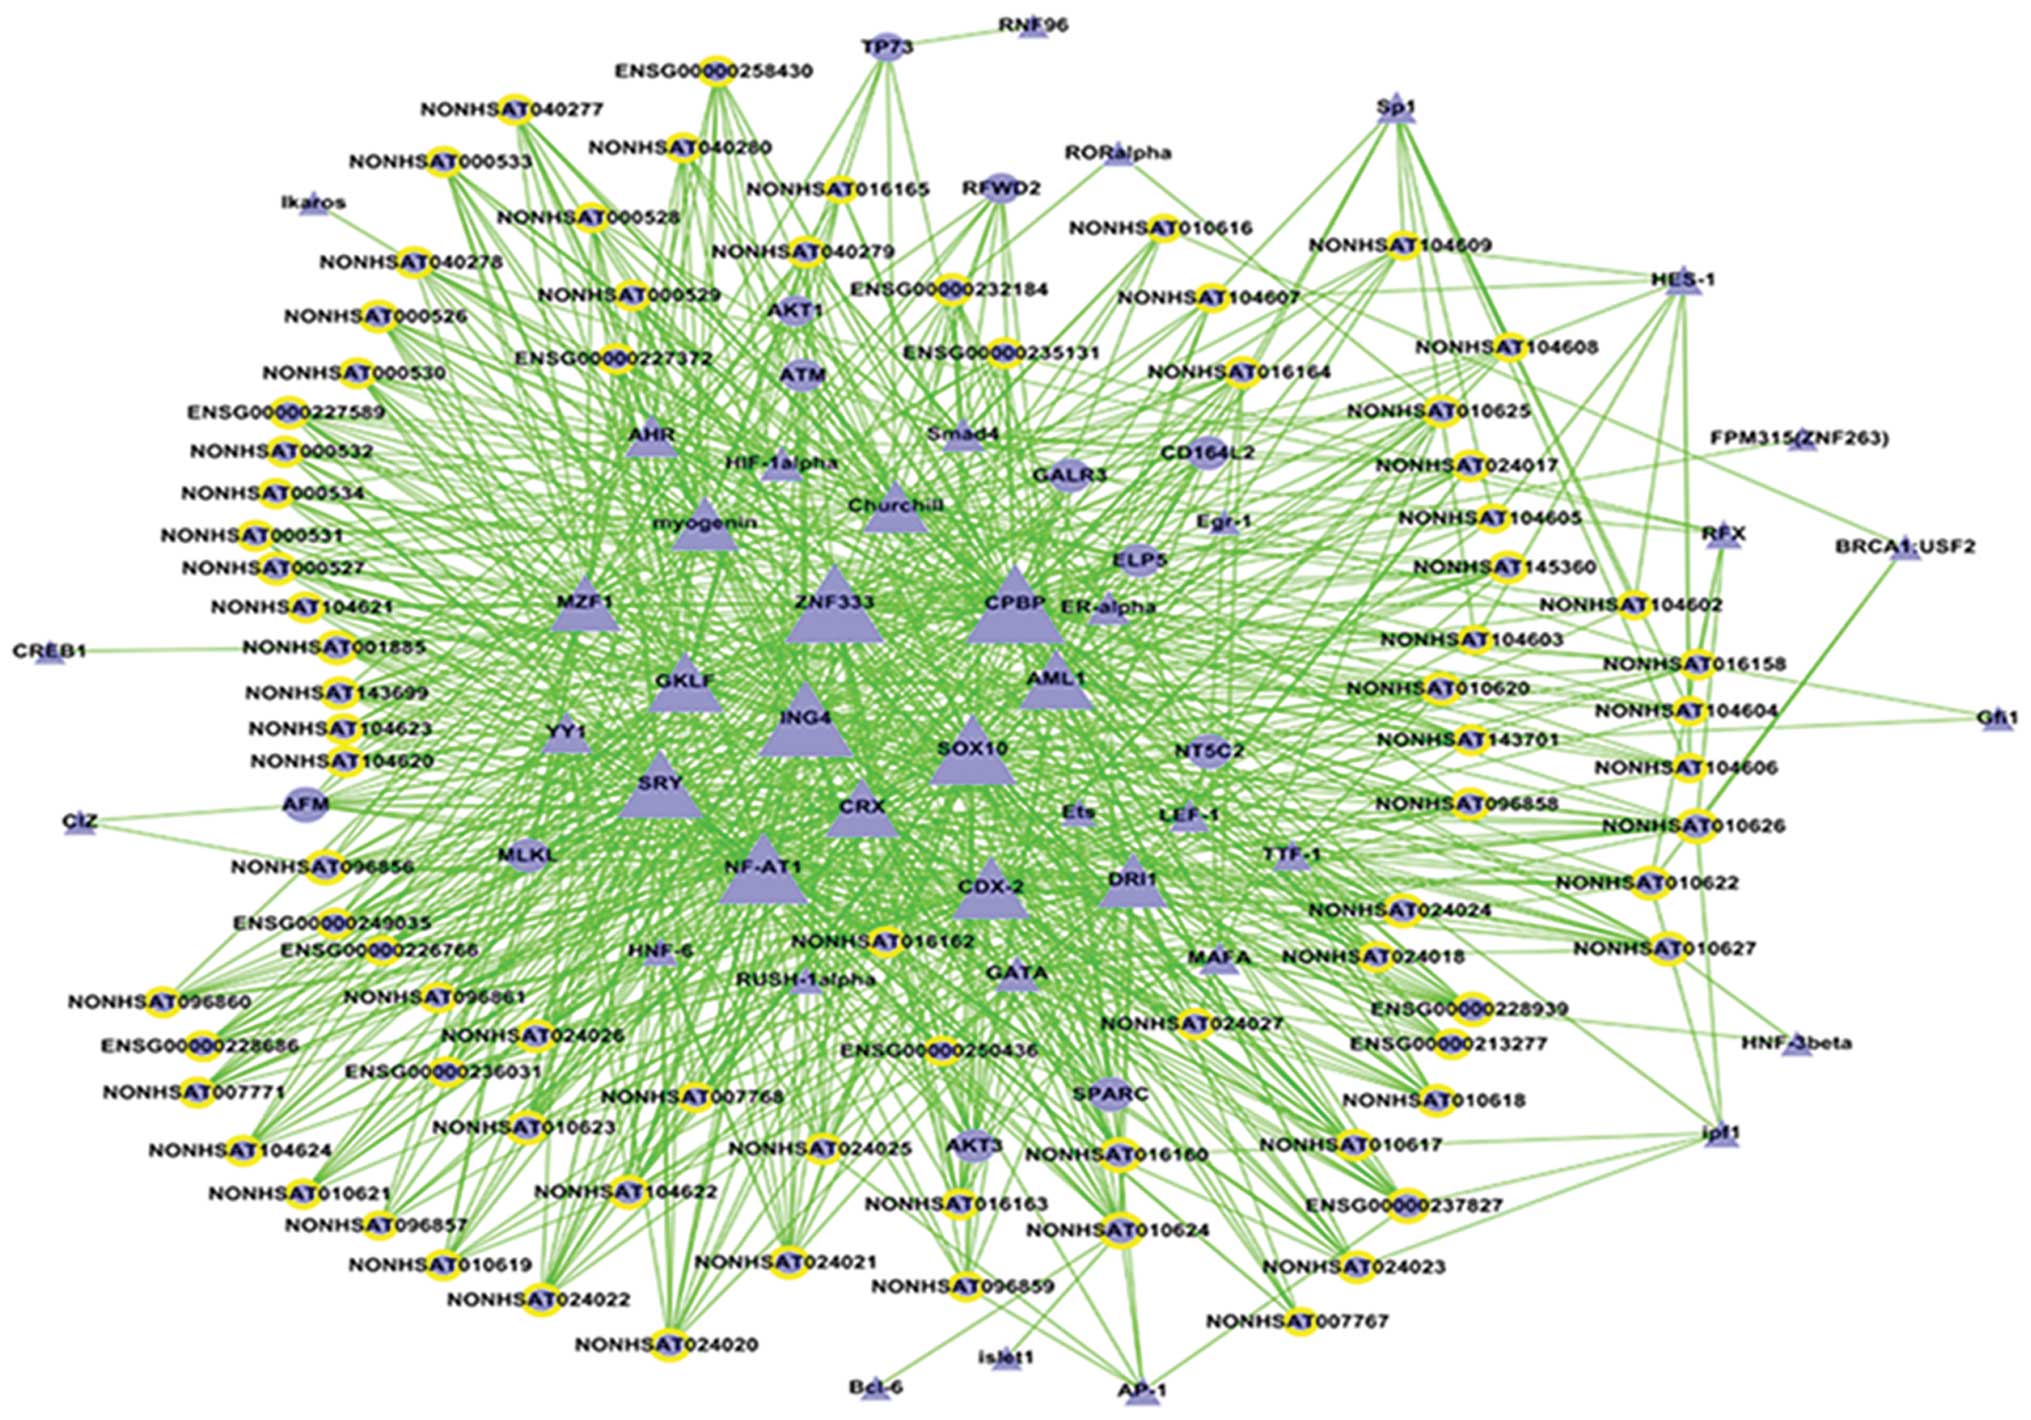
Transcription factors regulating the 69
genes and lncRNA
We predicted lncRNA ranged from upstream 10 kb to
downstream 10 kb for MLKL, CD164L2, GalR3,
NT5C2, ELP5, AFM and the target gene
SPARC. A transcription factor analysis on lncRNA and the
seven genes was performed. The TF-lncRNA-gene-net demonstrated that
the 69 genes and lncRNA were controlled by transcription factors,
mainly-CPBP and ZNF333 (Fig. 7).
ZNF333 is a member of the subfamily of the zinc finger gene
complex, localized on chromosome 19p13.1 (15). The cDNA encoded a predicted protein
of 290 amino acids. It also created a designated core
promoter-binding protein (CPBP) with three zinc fingers (type
Cys2-His2) at the end of its C-terminal domain, a
serine/threonine-rich central region, and an acidic domain lying
within the N-terminal region. In the cotransfection assays, CPBP
increased the transcription from a minimal promoter containing its
natural DNA-binding site (16).
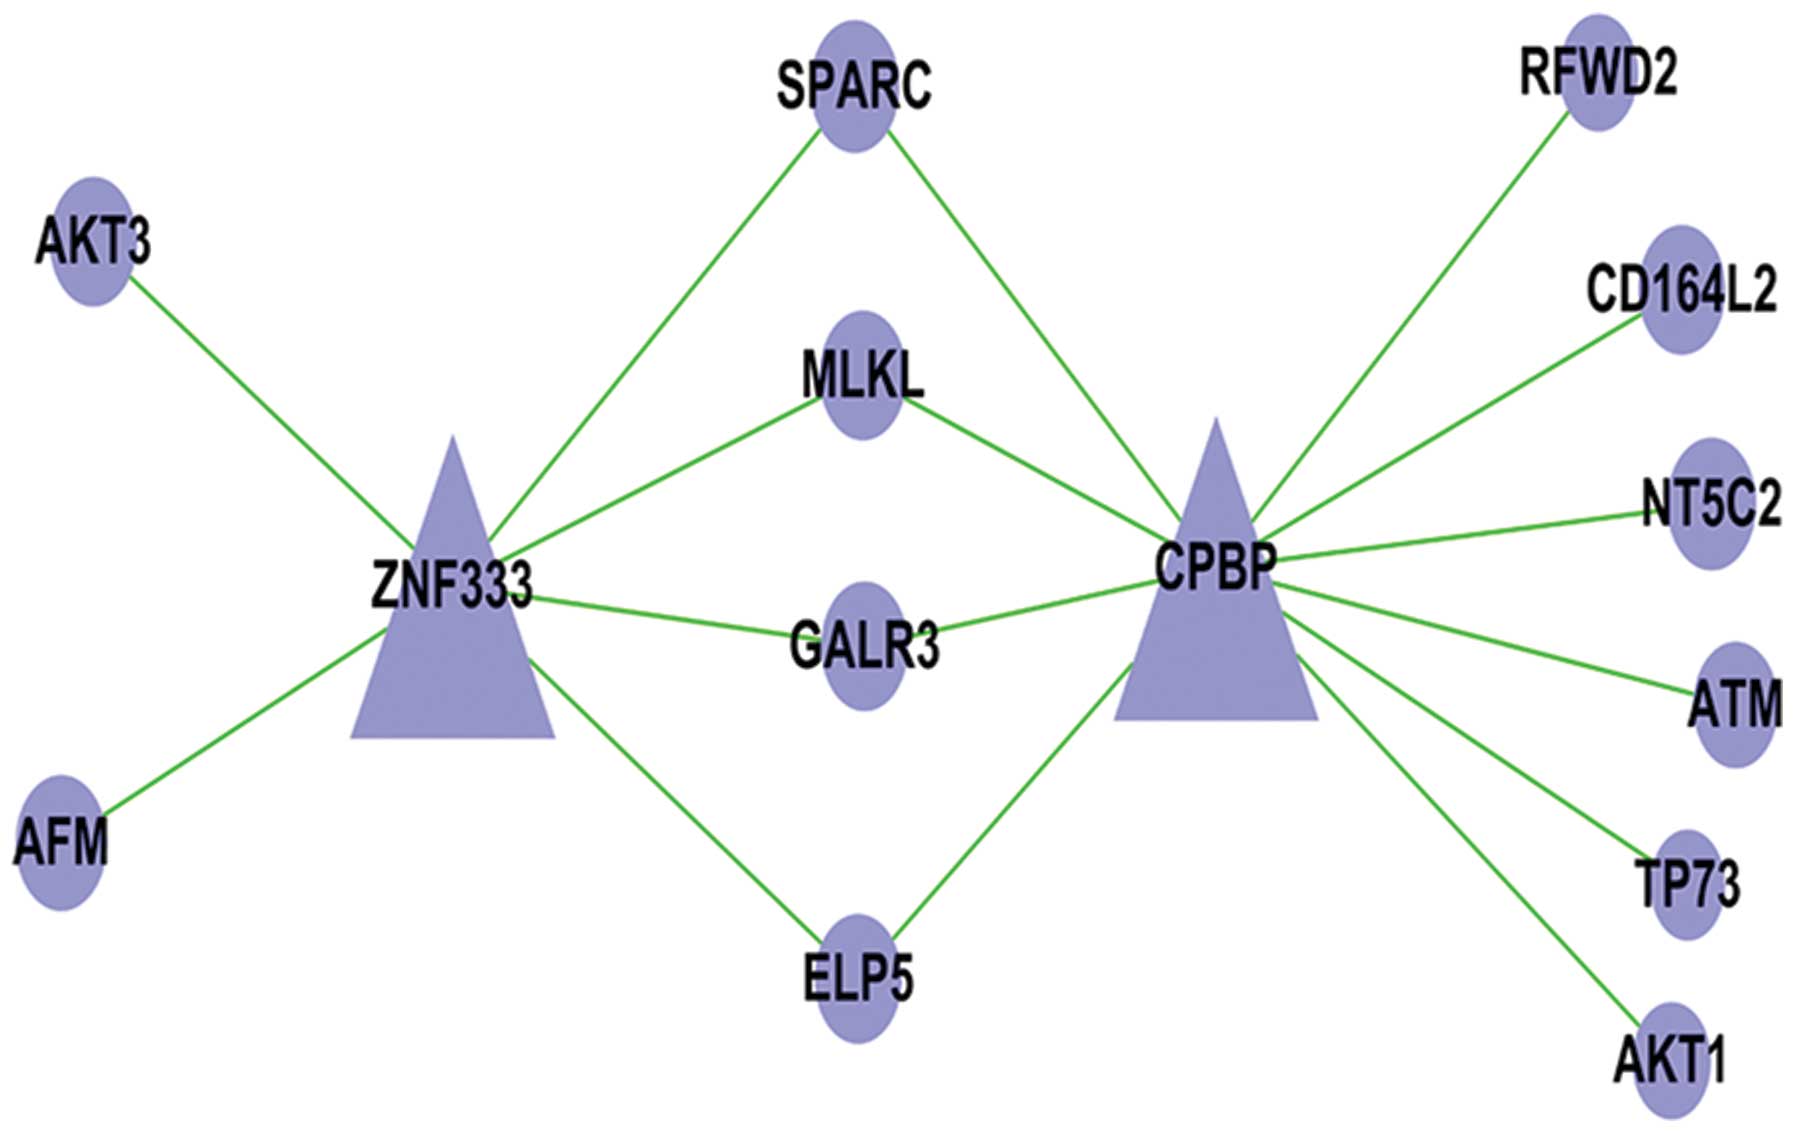
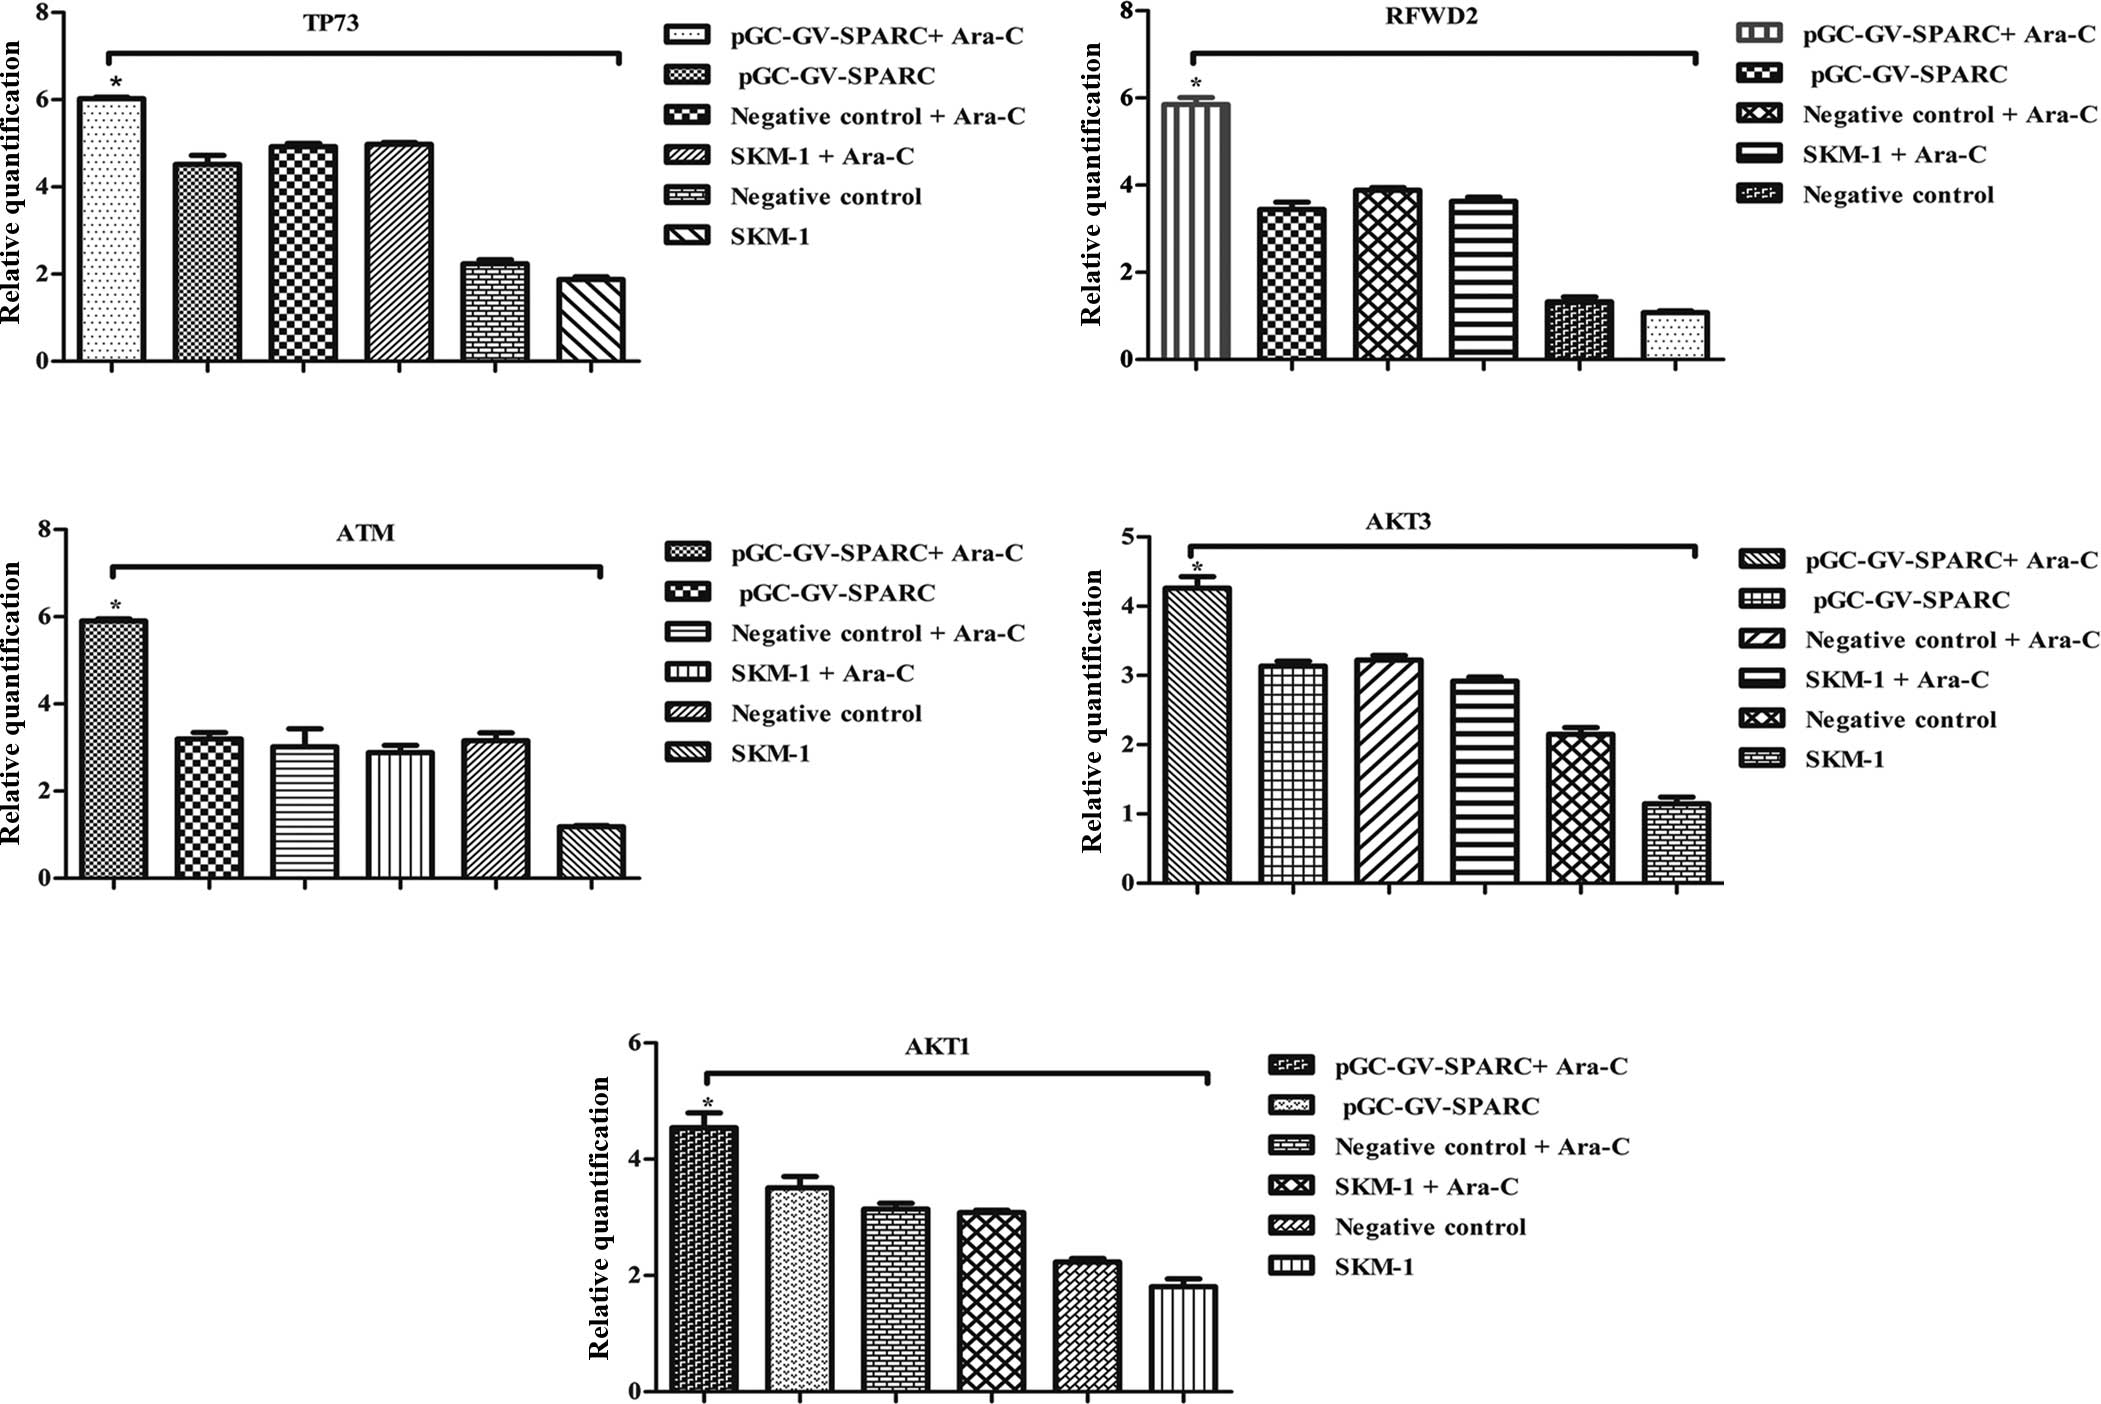
Changes in apoptosis-associated genes in
the microarray results
In our RNA sequencing study, five apoptosis pathway
genes were associated with the seven genes and transcription
factors. The ATM, AKT3, AKT1, RFWD2 and TP73 possess anti-apoptotic
effects, which occurs as a TF-mRNA relationship. Fig. 8 manifests this cyber-relation
improvement, showing the relationships between the different genes
and transcription factors. For the PCR, western blot analysis
confirmed that the expression of ATM, AKT3, AKT1, RFWD2 and TP73
was increased (Figs. 9 and 10).
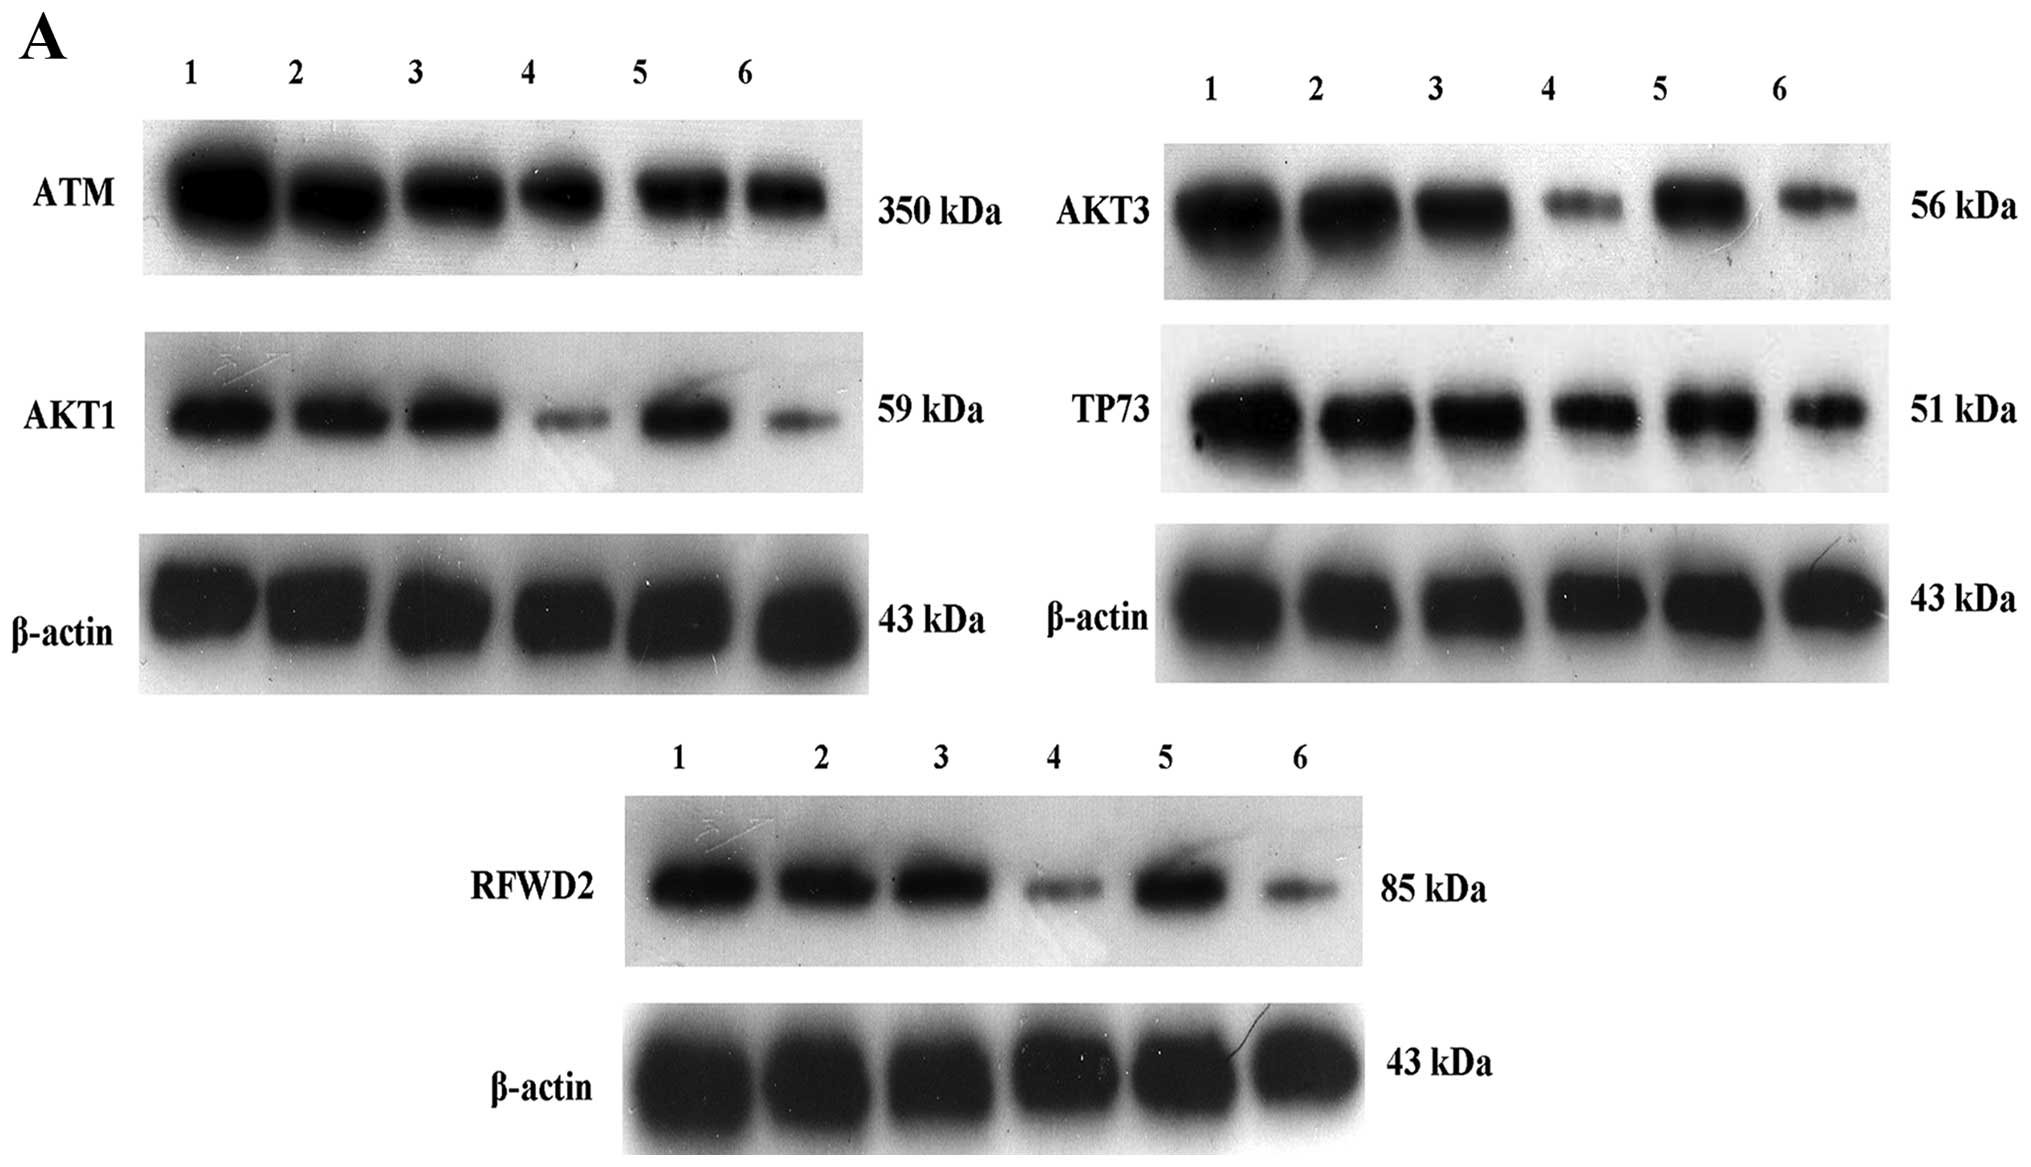 | Figure 10Regulation of gene cell apoptosis
from the microarray results by western blotting. (A) Lane 1,
pGC-GV-SPARC + Ara-C-treated; lane 2, pGC-GV-SPARC; lane 3,
negative control + Ara-C; lane 4, SKM-1 cells + Ara-C; lane 5,
negative control; lane 6, normal SKM-1 cells. Protein expression
for ATM, AKT3, AKT1, RFWD2 and TP73 was increased after SPARC
overexpression was associated with Ara-C. (B) Quantitative analysis
of western blotting results by Quantity One software,
*P<0.05, **P<0.01. SPARC, secreted
protein acidic and rich in cysteine; Ara-C, analogue cytosine
arabinoside. |
Discussion
The role of SPARC in hematology and other
malignancies is complex and dependent on the basis of the cell type
and malignant tumor (17,18). The present study aimed to
investigate the function of SPARC overexpression and associate it
with Ara-C in the context of MDS. We selected a human MDS cell
line, SKM-1, with a complex abnormal karyotype including del(9q),
i(17q) and t(17p) (19). SKM-1 was
a cell line derived from a male patient with acute myeloid leukemia
as a result of MDS (20). When
pGC-GV-SPARC was transfected into SKM-1, over 60% of GFP-positive
cells showed that the vector system was successfully
constructed.
Upregulation of the SPARC mRNA levels was verified
by qPCR against the normal SKM-1 SPARC mRNA levels and those of the
infected cells with an empty negative control vector.
Overexpression of SPARC was detected and confirmed by western blot
analysis. Increased SPARC protein content in the cells was
repeatedly associated with a recorded inhibition of the SKM-1 cells
transduced by the pGC-GV-SPARC vector, in comparison to normal
SKM-1 cells and SKM-1 cells infected with an empty vector. Further
assessment by flow cytometry demonstrated a significant increase in
the number of pro-apoptotic and dead cells of the transduced cell
line. These numbers reached 30% of the cells tested, paralleling
the observed antiproliferation effect that the overexpression of
SPARC exerted on the cells.
Since SPARC overexpression induces quiescent and
inhibits the proliferation of MDS cells, we assessed the effects of
cell treatment using Ara-C, a common MDS treatment. We combined
this with chemotherapeutic drugs. The results of the present study
show that, the apoptotic effect of SPARC overexpression associated
with Ara-C was obvious when compared to the upregulation of SPARC
in the cells alone. Cell apoptosis was approximately 20–30%. Our
flow cytometric analysis showed that the apoptosis of
SPARC-overexpressing cells following the treatment with Ara-C
increased 50% in the non-treated controls and 30% in the normal
SKM-1 cells. These conditions suggest a synergy of the mechanisms
that lead to cell death, or possibly a sensitization effect of one
of the two conditions. By contrast, our results from this and a
previous study, exhibit proliferation inhibition and increased cell
death after SPARC overexpression or silencing in the MDS SKM-1 cell
line (21). These contradicting
results of SPARC involvement in the biology of different cell
types, underscores the pleiotropic function and effects of SPARC
protein in the cell life cycle and its complex role in disease
where its involvement is unique sometimes promoting growth and
survival, whereas it also leads to the inhibition of proliferation
and apoptosis.
Gene chip technology was employed to determine the
mechanism involved in the association between gene changes and
Ara-C. It is notable that for the six genes, we identified the
CD164L2, MLKL and GalR3 genes as being
extensively upregulated in the SPARC-overexpressed cells when
treated with Ara-C. CD164L2 has been found to be associated with
essential hypertension in a recent study (22). However, it has been reported that
cell apoptosis was increased following the co-administration of
SPARC overexpression and the Ara-C drug. MLKL regulates necrotic
plasma membrane permeabilization, and promotes necrotic cell death
(23). Stimulation of GalR3
promotes the survival of adult neural stem cells in response to
diabetic milieu (24).
Nevertheless, ELP5, NT5C2 and AFM were downregulated. ELP5 was
initially identified as a component of a hyper-phosphorylated RNA
polymerase II (RNAPII) holoenzyme isolated from budding yeast
chromatin and subsequently from the human melanoma cells (25). It has been reported that NT5C2
mutations predict the possibility of a relapse of acute
lymphoblastic leukemia (26). In
the present study, we have found that NT5C2 is decreased when Ara-C
is present in MDS cells. In addition, AFM is a novel human vitamin
E-binding glycoprotein characterization, and we investigated its
in vitro expression in the present study (27). To the best of our knowledge, vitamin
E is an antioxidant that delays aging (28). We suggest that AFM alters the effect
of vitamin E, thus, that cell apoptosis is increased, enhancing
pharmacokinetics.
Transcription factors are essential for the
regulation of gene expression and are consequently found in all
living organisms. The number of transcription factors increase with
genome size, and larger genomes tend to have more transcription
factors per gene (29). A new class
of transcripts, known as lncRNAs, has been recently found to be
pervasively transcribed in the genome. These mRNA-like molecules,
which lack significant protein-coding capacity and previously
considered a part of dark matter, now have been used in a wide
range of biological functions (30). By combining microarray data
analysis, Tfscan demonstrated the ZNF333 and CPBP regulation of the
gene and lncRNA transcription. These significant transcription
factors are key regulatory elements that control gene expression.
They act on the mRNA expression of ATM, AKT3, AKT1, RFWD2 and TP73
to allow the CD164L2, MLKL, GalR3,
ELP5, NT5C2 and AFM and the SPARC genes
to change collectively. ATM mainly modulates apoptosis via the
regulation of p53/TP53-dependent anti-apoptotic genes (31). It induces resistance of the
chemotherapy drug cisplatin in glioma cells when underexpressed
(32). Studies have shown the
sensitization of Ara-C may is associated with ATM. AKT1 leads to
the activation of AKT3, and both play a role in cell survival. E3
ubiquitin-protein ligase mediates ubiquitination and subsequent
proteasomal degradation of target proteins function in RFWD2
(33). This directly involves p53
(TP53) ubiquitination and degradation, thereby abolishing
p53-dependent transcription and apoptosis. The P53 signaling
pathway includes TP73, serine/threonine protein kinase, which
activates checkpoint signaling following double-strand breaks
(DSBs), as well as apoptosis and genotoxic stresses such as
ionizing ultraviolet A light (UVA) (34). This process allows it to act as a
DNA damage sensor. These genes therefore are associated with cell
growth and death. Transcription factors regulate the expression of
these genes, which may be useful in identifying the SKM-1 apoptosis
mechanism.
The expression of SPARC is correlative with P53 in
MDS. The haploinsufficiency of SPARC induces the change of P53 in
the 5q-syndrome (35). P53 is a
well-known tumor suppressor that impedes the cell cycle at the G1-S
checkpoint (34). Our microarray
results determined that ATM, RFWD2 and TP73 are subject to the P53
signaling pathway, particularly ATM, which acts directly on P53.
According to these analyses, we assumed that when the gene was
regulated, tumor cell apoptosis mediated P53.
Controlling gene expression associated with
chemotherapy drugs has been used in different diseases, and some
progress has been made in ERG when combined with chemotherapy for
leukemia (36). Similar findings
were identified for atherosclerosis (37). The present results show that, SPARC
regulates SKM-1 cell proliferation and apoptosis, which is
associated with Ara-C. In conclusion, SPARC overexpression inhibits
cell proliferation, induces cell apoptosis and activates the
pathway gene change. The results as presented suggest that SPARC
may have anti-oncogene properties for MDS and acts as a tumor
suppressor in 5q-syndrome. Reference source not found. These
findings are important in pathogenetics and in the treatment of
MDS. SPARC combined medication may be a useful method in curing
hematonosis.
Acknowledgments
The present study was supported by the National
Natural Science Foundation of China (nos. 30971277, 81250034 and
30370618), the Natural Science Foundation of Chongqing (CSTC,
2009BB5070), the Science and Technology Commission of the Chongqing
(no. 0135414105), the Health Bureau of Chongqing (2013-2-023) and
the Project Foundation of Chongqing Municipal Education Committee
(2013, 2014).
References
|
1
|
Ghariani I, Braham N, Hassine M and Kortas
M: Myelodysplastic syndrome classification. Ann Biol Clin.
71:139–144. 2013.In French.
|
|
2
|
Jädersten M and Hellström-Lindberg E: New
clues to the molecular pathogenesis of myelodysplastic syndromes.
Exp Cell Res. 316:1390–1396. 2010. View Article : Google Scholar : PubMed/NCBI
|
|
3
|
Visconte V, Selleri C, Maciejewski JP and
Tiu RV: Molecular pathogenesis of myelodysplastic syndromes. Transl
Med UniSa. 8:19–30. 2014.PubMed/NCBI
|
|
4
|
DiMartino JF, Lacayo NJ, Varadi M, Li L,
Saraiya C, Ravindranath Y, Yu R, Sikic BI, Raimondi SC and Dahl GV:
Low or absent SPARC expression in acute myeloid leukemia with MLL
rearrangements is associated with sensitivity to growth inhibition
by exogenous SPARC protein. Leukemia. 20:426–432. 2006. View Article : Google Scholar : PubMed/NCBI
|
|
5
|
Rotllant J, Liu D, Yan YL, Postlethwait
JH, Westerfield M and Du SJ: Sparc (Osteonectin) functions in
morphogenesis of the pharyngeal skeleton and inner ear. Matrix
Biol. 27:561–572. 2008. View Article : Google Scholar : PubMed/NCBI
|
|
6
|
Hsiao YH, Lien HC, Hwa HL, Kuo WH, Chang
KJ and Hsieh FJ: SPARC (osteonectin) in breast tumors of different
histologic types and its role in the outcome of invasive ductal
carcinoma. Breast J. 16:305–308. 2010. View Article : Google Scholar : PubMed/NCBI
|
|
7
|
Wiese AH, Auer J, Lassmann S, Nährig J,
Rosenberg R, Höfler H, Rüger R and Werner M: Identification of gene
signatures for invasive colorectal tumor cells. Cancer Detect Prev.
31:282–295. 2007. View Article : Google Scholar : PubMed/NCBI
|
|
8
|
Said N, Frierson HF Jr, Chernauskas D,
Conaway M, Motamed K and Theodorescu D: The role of SPARC in the
TRAMP model of prostate carcinogenesis and progression. Oncogene.
28:3487–3498. 2009. View Article : Google Scholar : PubMed/NCBI
|
|
9
|
Isler SG, Ludwig CU, Chiquet-Ehrismann R
and Schenk S: Evidence for transcriptional repression of SPARC-like
1, a gene downregulated in human lung tumors. Int J Oncol.
25:1073–1079. 2004.PubMed/NCBI
|
|
10
|
Boultwood J, Pellagatti A, Cattan H,
Lawrie CH, Giagounidis A, Malcovati L, Della Porta MG, Jädersten M,
Killick S, Fidler C, et al: Gene expression profiling of
CD34+ cells in patients with the 5q-syndrome. Br J
Haematol. 139:578–589. 2007. View Article : Google Scholar : PubMed/NCBI
|
|
11
|
Duong VH, Komrokji RS and List AF:
Efficacy and safety of lenalidomide in patients with
myelodysplastic syndrome with chromosome 5q deletion. Ther Adv
Hematol. 3:105–116. 2012. View Article : Google Scholar
|
|
12
|
Koren-Michowitz M, Maayan H, Apel A,
Shem-Tov N, Yerushalmi R, Volchek Y, Avigdor A, Shimoni A and
Nagler A: Salvage therapy with ARA-C and gemtuzumab ozogamicin in
AML patients relapsing after stem cell transplantation. Ann
Hematol. 94:375–378. 2015. View Article : Google Scholar
|
|
13
|
Strauss C, Endimiani A and Perreten V: A
novel universal DNA labeling and amplification system for rapid
microarray-based detection of 117 antibiotic resistance genes in
Gram-positive bacteria. J Microbiol Methods. 108:25–30. 2015.
View Article : Google Scholar
|
|
14
|
Prieto C, Risueño A, Fontanillo C and De
las Rivas J: Human gene coexpression landscape: Confident network
derived from tissue transcriptomic profiles. PLoS One. 3:e39112008.
View Article : Google Scholar : PubMed/NCBI
|
|
15
|
Jing Z, Liu Y, Dong M, Hu S and Huang S:
Identification of the DNA binding element of the human ZNF333
protein. J Biochem Mol Biol. 37:663–670. 2004. View Article : Google Scholar : PubMed/NCBI
|
|
16
|
Slavin D, Sapin V, López-Diaz F, Jacquemin
P, Koritschoner N, Dastugue B, Davidson I, Chatton B and Bocco JL:
The Krüppel-like core promoter binding protein gene is primarily
expressed in placenta during mouse development. Biol Reprod.
61:1586–1591. 1999. View Article : Google Scholar : PubMed/NCBI
|
|
17
|
Alachkar H, Santhanam R, Maharry K,
Metzeler KH, Huang X, Kohlschmidt J, Mendler JH, Benito JM, Hickey
C, Neviani P, et al: SPARC promotes leukemic cell growth and
predicts acute myeloid leukemia outcome. J Clin Invest.
124:1512–1524. 2014. View
Article : Google Scholar : PubMed/NCBI
|
|
18
|
Pellagatti A, Jädersten M, Forsblom AM,
Cattan H, Christensson B, Emanuelsson EK, Merup M, Nilsson L,
Samuelsson J, Sander B, et al: Lenalidomide inhibits the malignant
clone and up-regulates the SPARC gene mapping to the commonly
deleted region in 5q-syndrome patients. Proc Natl Acad Sci USA.
104:11406–11411. 2007. View Article : Google Scholar
|
|
19
|
Kimura S, Kuramoto K, Homan J, Naruoka H,
Ego T, Nogawa M, Sugahara S and Naito H: Antiproliferative and
antitumor effects of azacitidine against the human myelodysplastic
syndrome cell line SKM-1. Anticancer Res. 32:795–798.
2012.PubMed/NCBI
|
|
20
|
Nakagawa T and Matozaki S: The SKM-1
leukemic cell line established from a patient with progression to
myelomonocytic leukemia in myelodysplastic syndrome
(MDS)-contribution to better understanding of MDS. Leuk Lymphoma.
17:335–339. 1995. View Article : Google Scholar : PubMed/NCBI
|
|
21
|
Nian Q, Xiao Q, Wang L, Luo J, Chen LP,
Yang ZS and Liu L: SPARC silencing inhibits the growth of acute
myeloid leukemia transformed from myelodysplastic syndrome via
induction of cell cycle arrest and apoptosis. Int J Mol Med.
33:856–862. 2014.PubMed/NCBI
|
|
22
|
Lu J, Li M, Zhang R, Hu C, Wang C, Jiang
F, Yu W, Qin W, Tang S and Jia W: A common genetic variant of
FCN3/CD164L2 is associated with essential hypertension in a Chinese
population. Clin Exp Hypertens. 34:377–382. 2012. View Article : Google Scholar : PubMed/NCBI
|
|
23
|
Dondelinger Y, Declercq W, Montessuit S,
Roelandt R, Goncalves A, Bruggeman I, Hulpiau P, Weber K, Sehon CA,
Marquis RW, et al: MLKL compromises plasma membrane integrity by
binding to phosphatidylinositol phosphates. Cell Rep. 7:971–981.
2014. View Article : Google Scholar : PubMed/NCBI
|
|
24
|
Mansouri S, Barde S, Ortsäter H, Eweida M,
Darsalia V, Langel U, Sjöholm A, Hökfelt T and Patrone C: GalR3
activation promotes adult neural stem cell survival in response to
a diabetic milieu. J Neurochem. 127:209–220. 2013. View Article : Google Scholar : PubMed/NCBI
|
|
25
|
Close P, Gillard M, Ladang A, Jiang Z,
Papuga J, Hawkes N, Nguyen L, Chapelle JP, Bouillenne F, Svejstrup
J, et al: DERP6 (ELP5) and C3ORF75 (ELP6) regulate tumorigenicity
and migration of melanoma cells as subunits of Elongator. J Biol
Chem. 287:32535–32545. 2012. View Article : Google Scholar : PubMed/NCBI
|
|
26
|
Meyer JA, Wang J, Hogan LE, Yang JJ,
Dandekar S, Patel JP, Tang Z, Zumbo P, Li S, Zavadil J, et al:
Relapse-specific mutations in NT5C2 in childhood acute
lymphoblastic leukemia. Nat Genet. 45:290–294. 2013. View Article : Google Scholar : PubMed/NCBI
|
|
27
|
Hubalek M, Buchner H, Mörtl MG, Schlembach
D, Huppertz B, Firulovic B, Köhler W, Hafner E, Dieplinger B, Wildt
L, et al: The vitamin E-binding protein afamin increases in
maternal serum during pregnancy. Clin Chim Acta. 434:41–47. 2014.
View Article : Google Scholar : PubMed/NCBI
|
|
28
|
Johnson EJ: Age-related macular
degeneration and antioxidant vitamins: Recent findings. Curr Opin
Clin Nutr Metab Care. 13:28–33. 2010. View Article : Google Scholar
|
|
29
|
Gill G: Regulation of the initiation of
eukaryotic transcription. Essays Biochem. 37:33–43. 2001.
View Article : Google Scholar
|
|
30
|
Quek XC, Thomson DW, Maag JL, Bartonicek
N, Signal B, Clark MB, Gloss BS and Dinger ME: lncRNAdb v2.0:
Expanding the reference database for functional long noncoding
RNAs. Nucleic Acids Res. 43(Database issue): D168–D173. 2015.
View Article : Google Scholar :
|
|
31
|
Zou Y, Wang Q, Li B, Xie B and Wang W:
Temozolomide induces autophagy via ATM-AMPK-ULK1 pathways in
glioma. Mol Med Rep. 10:411–416. 2014.PubMed/NCBI
|
|
32
|
Cowley AW Jr, Moreno C, Jacob HJ, Peterson
CB, Stingo FC, Ahn KW, Liu P, Vannucci M, Laud PW, Reddy P, et al:
Characterization of biological pathways associated with a 1.37 Mbp
genomic region protective of hypertension in Dahl S rats. Physiol
Genomics. 46:398–410. 2014. View Article : Google Scholar : PubMed/NCBI
|
|
33
|
Cubillos-Rojas M, Amair-Pinedo F,
Peiró-Jordán R, Bartrons R, Ventura F and Rosa JL: The E3 ubiquitin
protein ligase HERC2 modulates the activity of tumor protein p53 by
regulating its oligomerization. J Biol Chem. 289:14782–14795. 2014.
View Article : Google Scholar : PubMed/NCBI
|
|
34
|
Liebermann DA, Hoffman B and Vesely D: p53
induced growth arrest versus apoptosis and its modulation by
survival cytokines. Cell Cycle. 6:166–170. 2007. View Article : Google Scholar : PubMed/NCBI
|
|
35
|
Boultwood J, Pellagatti A and Wainscoat
JS: Haploinsufficiency of ribosomal proteins and p53 activation in
anemia: Diamond-Blackfan anemia and the 5q-syndrome. Adv Biol
Regul. 52:196–203. 2012. View Article : Google Scholar
|
|
36
|
Goldberg L, Tijssen MR, Birger Y, Hannah
RL, Kinston SJ, Schütte J, Beck D, Knezevic K, Schiby G,
Jacob-Hirsch J, et al: Genome-scale expression and transcription
factor binding profiles reveal therapeutic targets in transgenic
ERG myeloid leukemia. Blood. 122:2694–2703. 2013. View Article : Google Scholar : PubMed/NCBI
|
|
37
|
Linden F, Domschke G, Erbel C, Akhavanpoor
M, Katus HA and Gleissner CA: Inflammatory therapeutic targets in
coronary atherosclerosis-from molecular biology to clinical
application. Front Physiol. 5:4552014. View Article : Google Scholar : PubMed/NCBI
|