Introduction
Vulvar tumours constitute 4% of all gynaecological
malignancies and are critical carcinomas of the female reproductive
system (1). According to the
National Cancer Institute, the incidence of vulvar cancer has
increased in recent years in the US (2). The early diagnosis of vulvar cancer
results in a five-year survival greater than 70%. The prognosis of
vulvar neoplasia depends on the clinical grade, tumour diameter and
status of lymph node metastasis. Standard surgery can cause
considerable morbidity and significant disfigurement. Patients
require individualised therapy and less radical surgery to reduce
the incidence of complications. At present, the majority of vulvar
carcinomas are vulvar squamous cell carcinomas (VSCCs) (90%)
(3), and recent studies have shown
that the overall incidence of VSCC has risen steadily at a rate of
20% over the past 40 years (4).
Previous studies have not completely explained the aetiology of
this disease. Thus, the identification of new tumour markers for
the early detection and prognostic monitoring of VSCC remains
urgently needed.
MicroRNAs (miRNAs) are short non-coding RNAs that
silence mRNAs at the post-transcriptional levels. The transcription
of approximately one-third of mRNAs is regulated by miRNAs, which
are considered important regulators in key biological processes,
such as cell growth, differentiation, adhesion, angiogenesis and
inflammation (5–7). Changes in miRNA levels can cause
different types of cancers. The miRNA expression profiles in cancer
have been used to identify early diagnostic markers and therapeutic
targets. At present, little data are available regarding miRNA
expression in vulvar cancer. de Melo Maia et al (8) identified 79 miRNAs that showed
markedly different expression levels in vulvar cancer compared with
control samples. Although many miRNAs have been found to be
associated with vulvar cancer, the mechanism of action of miRNAs in
vulvar tumourigenesis still requires further investigation.
In the present study, we compared the miRNA
expression profiles of VSCC and adjacent non-cancerous samples and
investigated the mechanism of action of miR-590-5p in the A431
human VSCC cell line. The target of miR-590-5p was identified to
elucidate the possible function of miR-590-5p in VSCC.
Materials and methods
Tissue collection
We obtained three pairs of freshly frozen VSCC
samples and adjacent non-cancerous tissues for our microarray study
(Table I). For miRNA analysis and
target gene validation step, 30 freshly frozen VSCC samples and
adjacent non-cancerous tissues were collected. All of the tissues
were obtained from the Department of Gynaecology at our hospital at
the time of surgery between January 2011 and January 2015, and we
snap-froze the samples rapidly for future use. We staged all of the
lesions using the new vulvar cancer classification system (9). The pathology of the frozen specimens
was analysed. Clinical records were retrospectively reviewed. We
enrolled patients who had not undergone chemotherapy or radiation
treatment prior to surgery. The ethics Committee of the First
Affiliated hospital of China Medical University approved our
research and we obtained the informed consent from patients.
 | Table ICharacteristics of the patients in the
microarray study. |
Table I
Characteristics of the patients in the
microarray study.
| Sample name | Age (years) | FIGO stage | Tumor
differentiation | Lymph node
metastasis |
|---|
| A exp | 48 | IIIA | Moderate | Yes |
| a ctrl | 48 | – | – | – |
| B exp | 85 | IB | Well | No |
| b ctrl | 85 | – | – | – |
| F exp | 64 | IA | Well | No |
| f ctrl | 64 | – | – | – |
miRNA microarray and bioinformatics
Kangchen Bio-tech Inc. (Shanghai, China) extracted
the total RNA from the tissue samples and performed our microarray
analysis using a miRCURY™ LNA array (v. 18.0; exiqon). After
carefully reviewing the literature, we chose 25 upregulated and 25
down-regulated miRNAs for further study. Three web-based miRNA
target prediction programs were used to explore potential target
genes: TargetScan (https://www.targetscan.org/vert60/), MicroCosm
(http://www.ebi.ac.uk/enright-srv/microcosm/htdocs/targets/v5/)
and miRanda (http://www.microrna.org/microrna/home.do). To improve
the accuracy of our results, we further examined the putative genes
that were identified by the three algorithms for further study. We
conducted Gene Ontology (GO) and KEGG pathways analyses on these
target genes.
Real-time quantitative PCR of miRNAs
We selected fragments of the differentially
expressed miRNAs for further verification in 30 additional VSCC
tissues and the corresponding adjacent non-cancerous vulvar
samples. Total RNA was isolated from tissues using TRIzol reagent
(Invitrogen Life Technologies, Carlsbad, CA, USA) according to the
manufacturer's instructions. As previously described (10), we applied stem-loop RT-PCR to detect
the miRNA levels. cDNA synthesis was performed using a Gene Amp PCR
System 9700 (Applied Biosystems, Foster City, CA, USA). We
performed RT-qPCR in triplicate following standard protocols. We
calculated the miRNA expression levels using the 2−ΔΔCt
method with U6 as the internal control. The PCR cycle parameters
were the following: 95°C for 10 min followed by 40 cycles of 95°C
for 10 sec and 60°C for 60 sec. The miRNA primers are shown in
Table II.
| Table IIPrimers used in reverse transcription
and real-time PCR for the miRNAs. |
Table II
Primers used in reverse transcription
and real-time PCR for the miRNAs.
| Gene | Reverse
transcriptase reaction primer (5′ to 3′) | Real-time
quantitative PCR primer (5′ to 3′) |
|---|
| U6 |
CGCTTCACGAATTTGCGTGTCAT | F:
GCTTCGGCAGCACATATACTAAAAT |
| | R:
CGCTTCACGAATTTGCGTGTCAT |
| miR-590–5p |
GTCGTATCCAGTGCGTGTCGTGGAGTC | GSP:
GGGGGAGCTTATTCATAAAA |
|
GGCAATTGCACTGGATACGACCTGCAC | R:
CAGTGCGTGTCGTGGAGT |
| miR-182-5p |
GTCGTATCCAGTGCGTGTCGTGGAGTC | GSP:
GGGTTTGGCAATGGTAGAAC |
|
GGCAATTGCACTGGATACGACAGTGTG | R:
CAGTGCGTGTCGTGGAGT |
| miR-183-5p |
GTCGTATCCAGTGCGTGTCGTGGAGTC | GSP:
GGGTATGGCACTGGTAGAATT |
|
GGCAATTGCACTGGATACGACAGTGAA | R:
CAGTGCGTGTCGTGGAGT |
| miR-603 |
GTCGTATCCAGTGCGTGTCGTGGAGTC | GSP:
CACACACTGCAATTACTTTTGC |
|
GGCAATTGCACTGGATACGACGCAAAA | R:
CAGTGCGTGTCGTGGAGT |
| miR-103a-3p |
GTCGTATCCAGTGCGTGTCGTGGAGTC | GSP:
AGCAGCATTGTACAGGGCTA |
|
GGCAATTGCACTGGATACGACTCATAG | R:
CAGTGCGTGTCGTGGAGT |
| miR-107 |
GTCGTATCCAGTGCGTGTCGTGGAGTC | GSP:
AGCAGCATTGTACAGGGCTA |
|
GGCAATTGCACTGGATACGACTGATAG | R:
CAGTGCGTGTCGTGGAGT |
Detection of mRNAs of TGFβ1, TGFβ2,
TGFβRII and Smad4
We detected mRNAs of TGFβ1, TGFβ2, TGFβRII and Smad4
in the tissue samples by RT-qPCR. We quantified the amplified
products using the SYBR-green method (Takara Bio, inc., Dalian,
China) with gAPDh as the internal control. The fold-changes were
quantified using the 2−ΔΔCt method. The primers were as
follows: GAPDH forward, AAGGTGAAGGTCGGAGTCAAC and reverse,
GGGTCATTGATGGCAACAATA; TGFβ1 forward, AAGGACCTCGGCTGGAAGTG and
reverse, CCCGGGTTATGCTGGTTGTA; TGFβ2 forward, TGCCGCCCTTCTTCCCCTC
and reverse, GGAGCACAAGCTGCCCACTGA; TGFβRII forward,
AAGATGACCGCTCTGACATCA and reverse, CTTATAGACCTCAGCAAAGCGAC; and
Smad4 forward, CGCTTTTGTTTGGGTCAACT and reverse,
CCCAAACATCACCTTCACCT. The RT-qPCR parameters were the following:
95°C for 10 min followed by 40 cycles of 95°C for 5 sec and 60°C
for 34 sec.
Western blotting
The total protein from the tissue samples and cells
was prepared for western blot analysis. Seventy-two hours after
transfection with the miRNA mimics or siRNA-TGFβRII, the total
protein was collected for analysis (11). Immunoblotting was performed with
monoclonal TGFβ1 (ab64715) (1:1,000), polyclonal TGFβ2 (ABE586;
cat.) (1:1,000), polyclonal TGFβRII (ab78419) (1:1,000), monoclonal
Smad4 (ab40759) (1:5,000) or gAPDh (ab181602) (1:5,000) antibody
(all from Abcam, Cambridge, MA, USA). The membrane was washed and
incubated with goat anti-rabbit (1:5,000; Invitrogen Life
Technologies) or anti-mouse igg (h + L)-hRP conjugate (1:10,000;
Invitrogen Life Technologies) antibody. The ImageJ software was
used to determine the relative protein expression levels.
Cell culture and transfection
The A431 cell line was obtained from ATCC (Manassas,
VA, USA) and cultured in RPMi-1640 medium containing 10% fetal
bovine serum under standard conditions at 37°C and 5%
Co2 in a humidified atmosphere. The cells were
transfected with Dharmacon miRIDIAN miR-590-5p mimic (miR-590-5p)
and the negative control (Thermo Fisher Scientific, Lafayette, Co,
USA) at a final concentration of 100 nmol/l. A small interfering
RNA targeting TGFβRII (siRNA-TgFβRII) was obtained from Santa Cruz
Biotechnology, inc. (Santa Cruz, CA, USA) (sc-36657). The cells
were transfected using Lipofectamine 2000 (Invitrogen Life
Technologies) according to the manufacturer's recommendation.
MTT assay
We performed an MTT assay to evaluate cell
proliferation. A431 cells were plated in 96-well sample culture
plates at a density of 5×10⁴ cells per well with the
miR-590-5p mimics or siRNA-TGFβRII and the corresponding negative
controls. The cells were cultured for 48 and 96 h, and the optical
absorbance was read at 490 nm on a microplate reader. The
experiments were conducted in triplicate.
Cell migration
A Transwell assay was performed to examine cell
migration. Forty-eight hours after transfection, 5×10⁴
cells were placed in the upper chambers of Transwell plates with an
untreated membrane. After 24 h of incubation, the chambers were
treated with 4% paraformaldehyde and then fixed with hematoxylin
and eosin. The cells that passed through the membrane were counted.
The migration assays were conducted in triplicate.
Analysis of cell cycle distribution
Cells transfected with the miR-590-5p mimics or
siRNA-TGFβRII for 48 h were collected and placed in ethanol (70%)
for 24 h. The cells were then treated with propidium iodide (40
µg/ml) for 30 min. Flow cytometry was used for the analysis,
and the experiments were performed in triplicate.
Statistical analysis
The data are presented as the means ± SD, and SPSS
15.0 software (SPSS, Inc., Chicago, IL, USA) was used for all of
the data analyses. The significance of differences in the mean
values was analysed using the Student's t-test. A two-sided
Fisher's exact test was used to determine the relationship between
miR-590-5p expression and clinicopathological data. P<0.05 was
considered to indicate a statistically significant difference.
Results
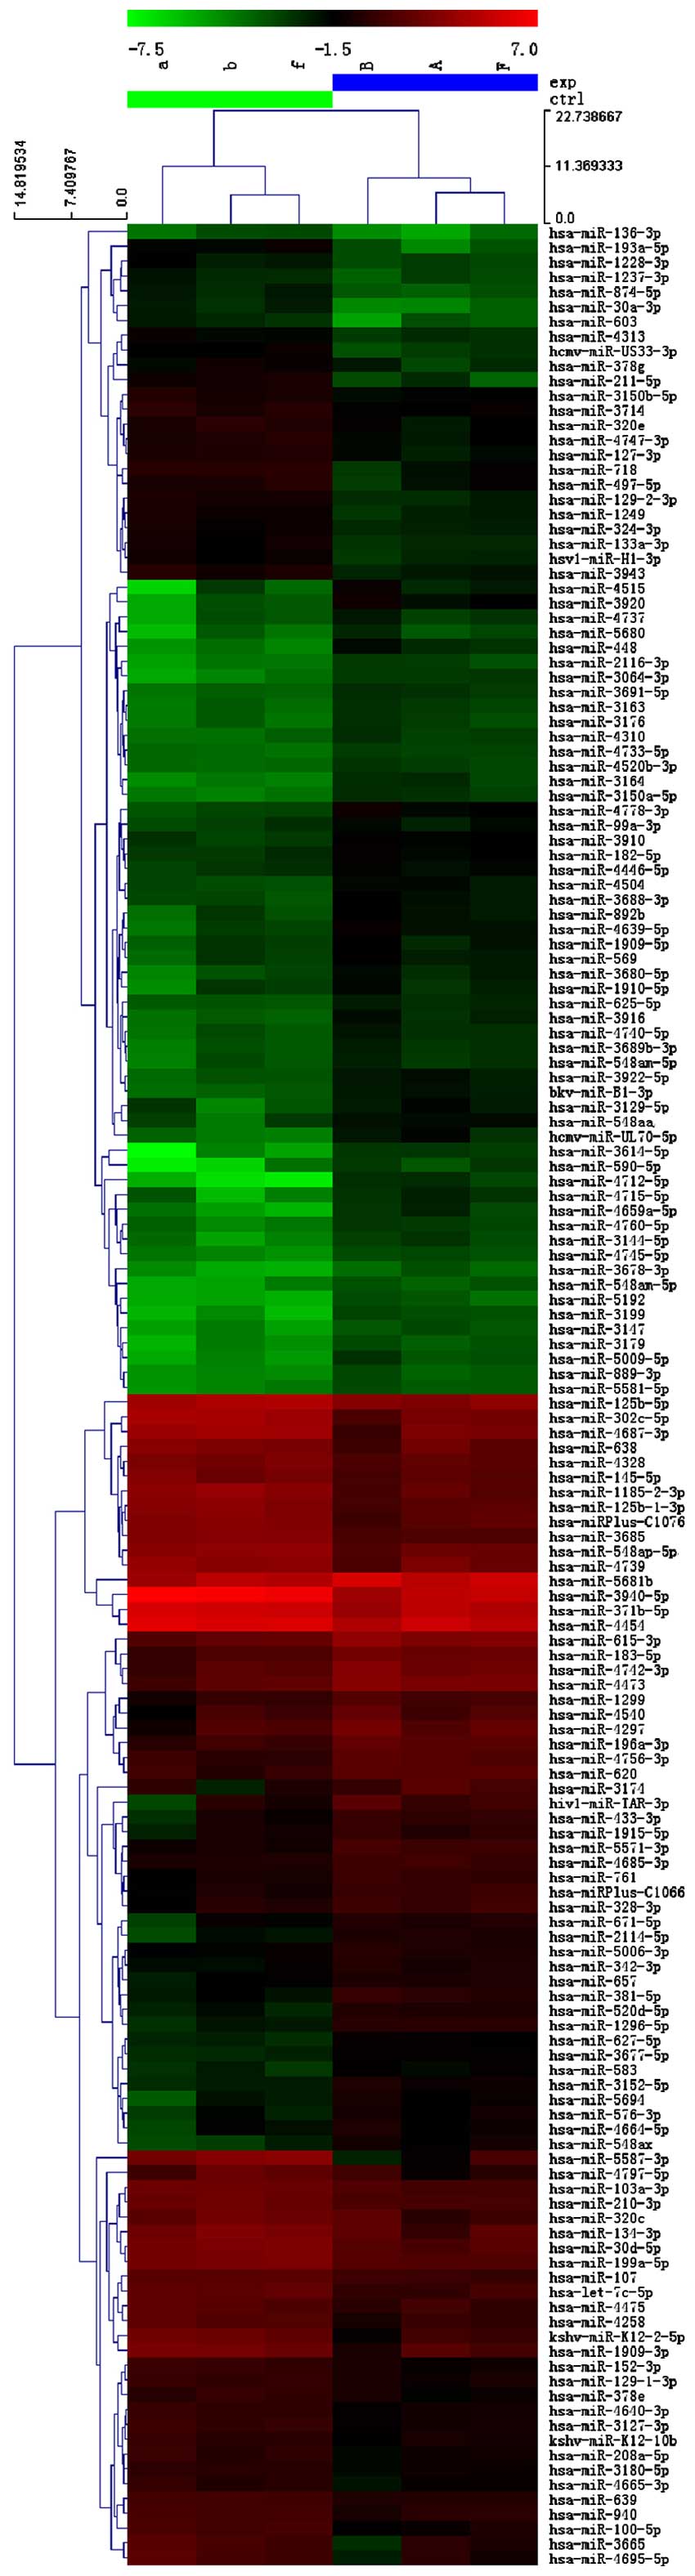
miRNA expression profile in VSCC
After confirming the quality of the RNA extracted
from the tissue samples, we determined the miRNA expression profile
of VSCC. We selected the miRNAs that were overexpressed or
underexpressed by more than 2-fold for the bioinformatics analysis
and identified 90 upregulated and 67 downregulated miRNAs in the
cancer samples (Fig. 1, Tables III and IV).
| Table IIImiRNAs with a 2-fold increased change
in VSCC. |
Table III
miRNAs with a 2-fold increased change
in VSCC.
| Name | Fold-change (exp
vs. ctrl) | P-value (exp vs.
ctrl) |
|---|
|
hsa-miR-1909-5p | 2.268009207 | 0.034970206 |
| hsa-miR-625-5p | 2.299905838 | 0.016908005 |
|
hsa-miR-3680-5p | 2.874185596 | 0.031517055 |
|
hsa-miR-5006-3p | 2.041647823 | 0.040961217 |
| hsa-miR-448 | 4.877156933 | 0.047126944 |
| hsa-miR-3179 | 2.787311058 | 0.000743429 |
|
hsa-miR-548am-5p | 2.766300414 | 0.015495713 |
|
hsa-miR-548au-5p | | |
|
hsa-miR-548c-5p | | |
|
hsa-miR-548o-5p | | |
|
hsa-miR-5571-3p | 2.856577623 | 0.005585384 |
|
hsa-miR-4760-5p | 2.448261646 | 0.04027403 |
|
hsa-miR-3614-5p | 5.742156538 | 0.01292475 |
| hsa-miR-4737 | 2.530840607 | 0.038784823 |
| hsa-miR-892b | 2.858771178 | 0.017431678 |
|
hsa-miR-4639-5p | 3.240730738 | 0.032308547 |
| hsa-miR-627-5p | 2.052727495 | 0.0037273 |
| hsa-miR-183-5p | 2.419287261 | 0.013326849 |
|
hsa-miR-4778-3p | 3.699981341 | 0.025561685 |
|
hsa-miR-3129-5p | 2.781924851 | 0.008224854 |
|
hsa-miR-2116-3p | 2.84569609 | 0.046005427 |
| hsa-miR-99a-3p | 2.078061984 | 0.02427523 |
| hsa-miR-3163 | 2.236794583 | 0.019324673 |
| hsa-miR-4515 | 4.005941261 | 0.043115779 |
| hsa-miR-761 | 2.283378294 | 0.030433155 |
|
hiv1-miR-TAR-3p | 3.407407279 | 0.042298704 |
| hsa-miR-3916 | 3.177438789 | 0.04565907 |
| hsa-miR-5694 | 2.530767474 | 0.01283172 |
|
hsa-miR-3152-5p | 2.654922182 | 0.037278832 |
| hsa-miR-182-5p | 2.333439033 | 0.026694345 |
| hsa-miR-569 | 2.407604243 | 0.024602814 |
| hsa-miR-381-5p | 3.635872619 | 0.023950604 |
| hsa-miR-4310 | 2.232312931 | 0.047107543 |
|
hsa-miR-3677-5p | 2.132387267 | 0.003261066 |
| hsa-miR-5192 | 3.677159629 | 0.044010016 |
| hsa-miR-5680 | 2.575312372 | 0.032441222 |
| hsa-miR-4504 | 2.717320696 | 0.014710469 |
| hsa-miR-1299 | 2.002702571 | 0.013834637 |
|
hsa-miR-1910-5p | 2.162735851 | 0.03783251 |
|
hsa-miR-3689b-3p | 2.415977652 | 0.017534668 |
| hsa-miR-3689c | | |
| hsa-miR-3920 | 5.625452236 | 0.026111532 |
| hsa-miR-3199 | 4.295820524 | 0.000563038 |
| hsa-miR-4540 | 2.012988685 | 0.016275315 |
|
hsa-miR-5009-5p | 3.71180521 | 0.040632129 |
| hsa-miR-615-3p | 2.483195697 | 0.044667033 |
| hsa-miR-590-5p | 5.021381531 | 0.023268648 |
| hsa-miR-3174 | 2.939705901 | 0.029182617 |
|
hsa-miR-3691-5p | 2.345199113 | 0.024231387 |
|
hsa-miR-4742-3p | 2.488143419 | 0.036999111 |
|
hsa-miR-4685-3p | 2.073555353 | 0.036241143 |
|
hsa-miR-4740-5p | 2.38994988 | 0.022891232 |
| hsa-miR-342-3p | 2.181671493 | 0.035571011 |
| hsa-miR-657 | 2.134615186 | 0.007542585 |
|
hsa-miR-520d-5p | 3.073773663 | 0.000401222 |
|
hsa-miR-4659a-5p | 4.519405061 | 0.022666827 |
|
hsa-miR-4756-3p | 2.247748775 | 0.037541024 |
|
hsa-miR-4715-5p | 3.419119082 | 0.005577942 |
|
hsa-miR-548am-5p | 2.214394005 | 0.007252986 |
|
hsa-miR-548c-5p | | |
|
hsa-miR-548o-5p | | |
| hsa-miR-576-3p | 2.244314801 | 0.01432112 |
|
hsa-miR-196a-3p | 2.372627688 | 0.004993835 |
| hsa-miR-671-5p | 2.537177995 | 0.009026734 |
| hsa-miR-3176 | 2.203589711 | 0.029281769 |
| hsa-miR-3147 | 2.735734119 | 0.047108881 |
| hsa-miR-3910 | 2.608801926 | 0.015245264 |
|
hsa-miR-4733-5p | 2.008593535 | 0.007370313 |
|
hsa-miR-4520b-3p | 2.017026584 | 0.047310787 |
|
hsa-miR-4712-5p | 12.22863711 | 0.014670128 |
|
hsa-miR-4446-5p | 2.134631842 | 0.004281929 |
| hsa-miR-889-3p | 2.399358429 | 0.041746801 |
| hsa-miR-583 | 2.027782059 | 0.049386185 |
|
hsa-miR-3678-3p | 2.766474628 | 0.021131864 |
| hsa-miR-3164 | 3.639623557 | 0.044721554 |
|
hsa-miR-3688-3p | 2.833806324 | 0.027287514 |
| hsa-miR-433-3p | 2.956586285 | 0.005371443 |
|
hsa-miR-3922-5p | 3.02440681 | 0.034490467 |
|
hsa-miR-2114-5p | 3.239366725 | 0.031005786 |
|
hsa-miRPlus-C1066 | 2.469174691 | 0.016399394 |
|
hsa-miR-1915-5p | 2.208897579 | 0.001720096 |
|
hsa-miR-3064-3p | 3.469771706 | 0.005127139 |
| bkv-miR-B1-3p | 3.418831807 | 0.018095363 |
| jcv-miR-J1-3p | | |
| hsa-miR-5681b | 2.021948002 | 0.034047499 |
|
hsa-miR-4664-5p | 2.119244868 | 0.031194048 |
|
hsa-miR-3150a-5p | 3.134068744 | 0.028284216 |
|
hsa-miR-1296-5p | 4.088863472 | 0.003660659 |
|
hsa-miR-3144-5p | 2.926516532 | 0.022729536 |
|
hsa-miR-4745-5p | 2.466356986 | 0.000146798 |
| hsa-miR-4473 | 2.504250002 | 0.034469781 |
| hsa-miR-548aa | 2.835267551 | 0.009012684 |
|
hsa-miR-548t-3p | | |
|
hcmv-miR-UL70-5p | 4.45206206 | 0.049288866 |
| hsa-miR-328-3p | 2.116531252 | 0.005483732 |
| hsa-miR-4297 | 2.255154322 | 0.033062969 |
| hsa-miR-620 | 2.159044023 | 0.040631617 |
|
hsa-miR-5581-5p | 2.215694094 | 0.036348099 |
| hsa-miR-548ax | 3.255292172 | 0.020722488 |
| Table IVmiRNAs with a 2-fold decreased change
in VSCC. |
Table IV
miRNAs with a 2-fold decreased change
in VSCC.
| Name | Fold-change (exp
vs. ctrl) | P-value (exp vs.
ctrl) |
|---|
|
hsa-miR-103a-3p | 0.424280671 | 0.004572105 |
|
hsa-miR-125b-1-3p | 0.312927645 | 0.038777049 |
| hsa-miR-4475 | 0.461365437 | 0.025426598 |
|
hsa-miR-4640-3p | 0.44007417 | 0.008555965 |
|
kshv-miR-K12-2-5p | 0.261405403 | 0.031752834 |
| hsa-miR-136-3p | 0.469715785 | 0.047488345 |
|
hsa-miRPlus-C1076 | 0.336815427 | 0.039990317 |
| hsa-miR-4313 | 0.434091658 | 0.030820428 |
|
hsa-miR-125b-5p | 0.435287519 | 0.010836626 |
| hsa-miR-718 | 0.301243354 | 0.008612888 |
| hsa-miR-3665 | 0.306037784 | 0.044793295 |
|
hsa-miR-3150b-5p | 0.491060897 | 0.035735777 |
| hsa-miR-152-3p | 0.419871509 | 0.028451985 |
| hsa-miR-638 | 0.447432966 | 0.018664434 |
| hsa-miR-639 | 0.495992306 | 0.003366715 |
|
hsa-miR-4747-3p | 0.400747519 | 0.00664862 |
|
hsa-miR-302c-5p | 0.267763813 | 0.024743292 |
|
hsa-miR-1228-3p | 0.431370899 | 0.040648229 |
|
hcmv-miR-US33-3p | 0.329650196 | 0.007069712 |
|
hsa-miR-3127-3p | 0.39249684 | 0.005878926 |
| hsa-miR-548ap- | 0.374250134 | 0.03201148 |
|
5p/hsa-miR-548j-5p | | |
| hsa-miR-1249 | 0.369524954 | 0.028701441 |
| hsa-miR-210-3p | 0.451024778 | 0.015191447 |
| hsa-miR-3714 | 0.455539333 | 0.047728424 |
|
hsa-miR-1185-2-3p | 0.280261944 | 0.035995727 |
| hsa-miR-320e | 0.424891032 | 0.018026801 |
| hsa-miR-378g | 0.422359181 | 0.01182177 |
|
hsa-miR-3180-5p | 0.467975782 | 0.010146089 |
|
hsa-miR-4797-5p | 0.34170329 | 0.042345844 |
| hsa-miR-320c | 0.458391368 | 0.012703414 |
| hsa-miR-127-3p | 0.391036192 | 0.002697576 |
|
hsa-miR-129-1-3p | 0.484901627 | 0.033744514 |
|
hsa-miR-193a-5p | 0.211752847 | 0.020608715 |
| hsa-miR-107 | 0.491113228 | 0.00909686 |
|
hsa-miR-1237-3p | 0.491995661 | 0.025161672 |
|
hsa-miR-129-2-3p | 0.326940269 | 0.017236448 |
| hsa-miR-378e | 0.432741045 | 0.004039221 |
| hsa-miR-30d-5p | 0.399892004 | 0.003032197 |
| hsa-miR-940 | 0.497089979 | 0.01686806 |
| hsa-miR-3685 | 0.281450369 | 0.007545584 |
| hsa-miR-497-5p | 0.377350451 | 0.011166099 |
|
hsa-miR-208a-5p | 0.407300528 | 0.035579721 |
|
hsa-miR-3940-5p | 0.22946766 | 0.026666441 |
| hsa-miR-30a-3p | 0.246337873 | 0.018149941 |
|
kshv-miR-K12-10b | 0.489194522 | 0.01863871 |
| hsa-miR-211-5p | 0.209335232 | 0.027658562 |
|
hsa-miR-133a-3p | 0.353621363 | 0.025055885 |
| hsa-let-7c-5p | 0.420424499 | 0.004476239 |
| hsa-miR-4328 | 0.481358306 | 0.016905376 |
| hsa-miR-4258 | 0.379569936 | 0.006127006 |
| hsa-miR-874-5p | 0.381710238 | 0.029590223 |
| hsa-miR-134-3p | 0.427828419 | 0.012731845 |
|
hsa-miR-4665-3p | 0.386183592 | 0.029972291 |
| hsa-miR-324-3p | 0.408704049 | 0.042361639 |
| hsv1-miR-h1-3p | 0.414986507 | 0.016595063 |
|
hsa-miR-199a-5p | 0.419753002 | 0.010205226 |
| hsa-miR-603 | 0.337203781 | 0.036655296 |
|
hsa-miR-1909-3p | 0.331046605 | 0.043830752 |
| hsa-miR-3943 | 0.331748922 | 0.034720544 |
|
hsa-miR-4687-3p | 0.322418396 | 0.049090253 |
| hsa-miR-145-5p | 0.438537269 | 0.042746741 |
| hsa-miR-100-5p | 0.274313719 | 0.013542083 |
|
hsa-miR-371b-5p | 0.440758217 | 0.019114517 |
|
hsa-miR-5587-3p | 0.115849457 | 0.023669599 |
| hsa-miR-4739 | 0.432716062 | 0.004950109 |
| hsa-miR-4454 | 0.48752685 | 0.005377393 |
|
hsa-miR-4695-5p | 0.276772972 | 0.037591238 |
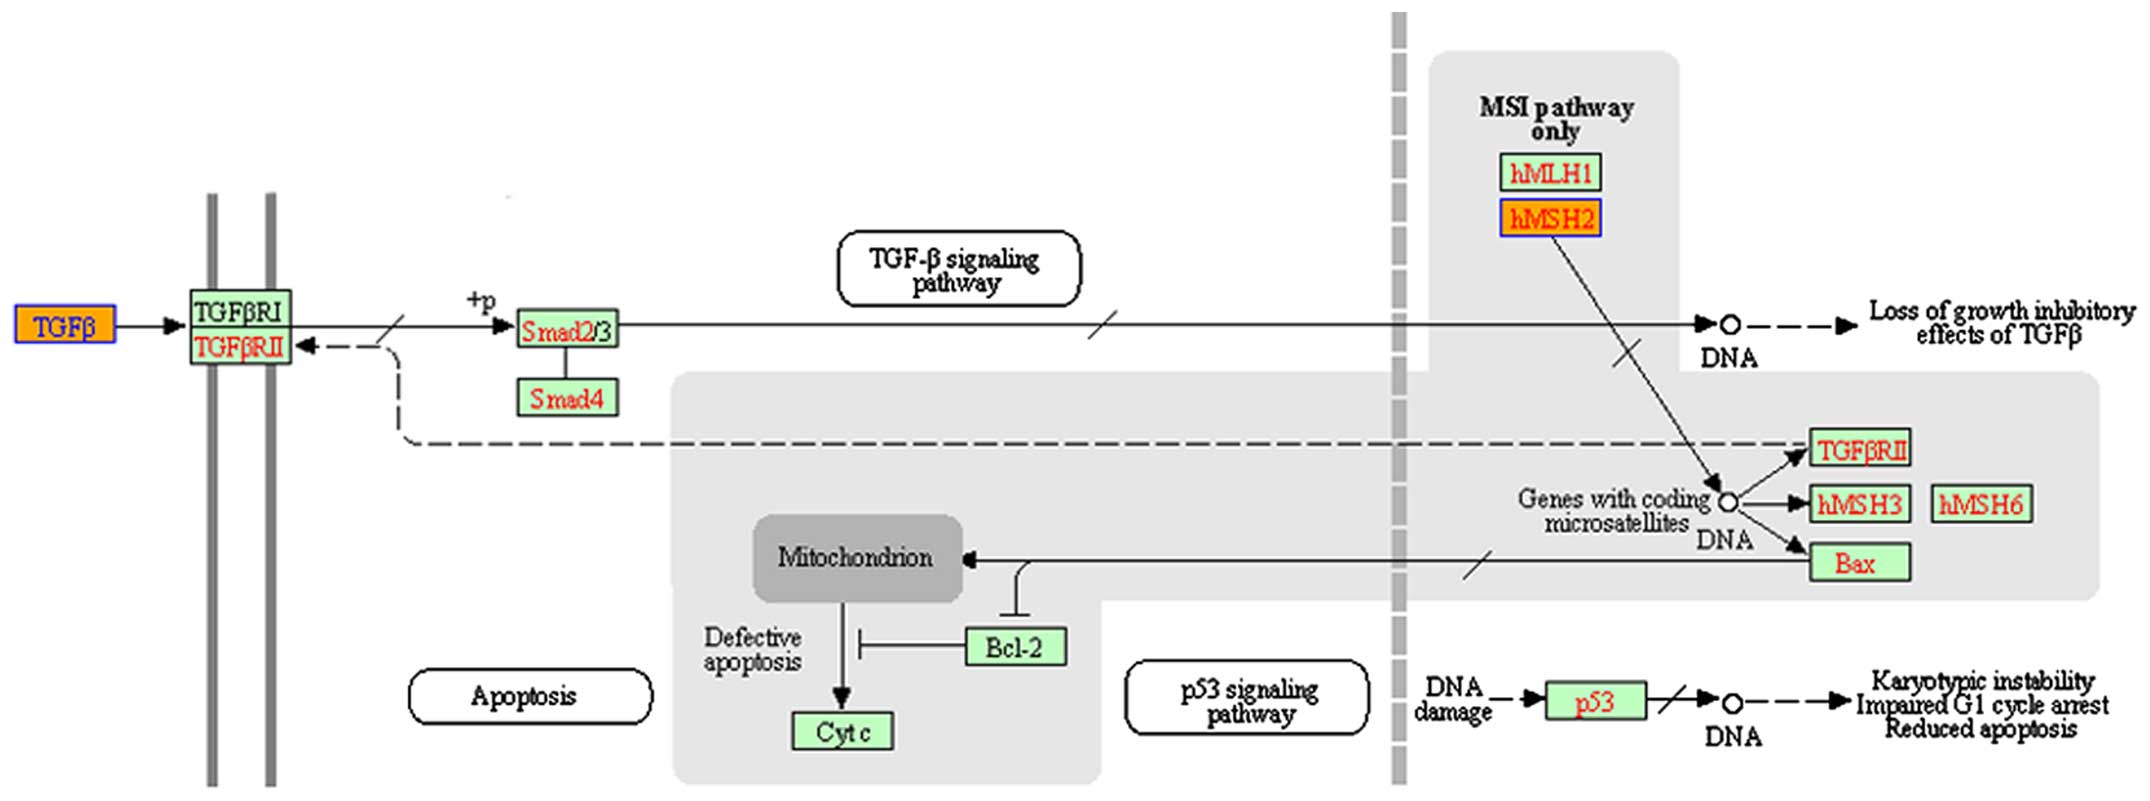
Bioinformatics
In total, 1,350 genes were predicted. GO analysis
and KEGG annotation showed that the transforming growth factor-β
(TGF-β) pathway was an enriched pathway in VSCC (Fig. 2).
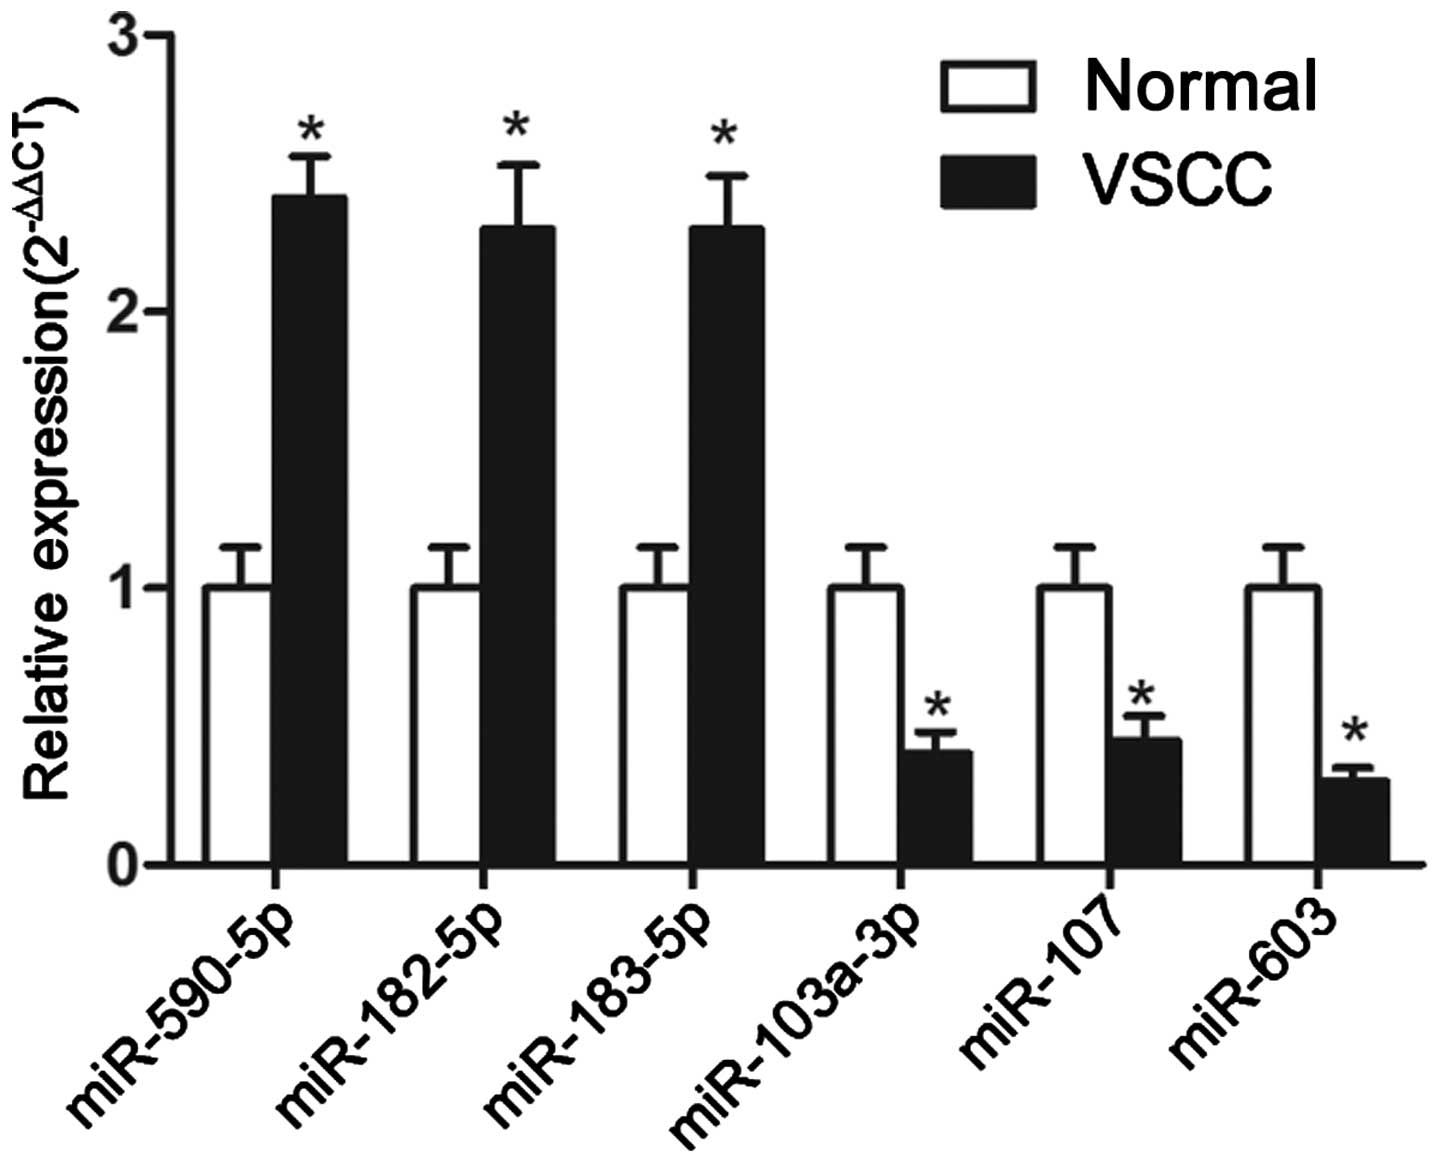
Confirmation of the microarray
findings
To confirm our microarray findings, RT-qPCR analysis
of miR-590-5p, miR-182-5p, miR-183-5p, miR-603, miR-103a-3p and
miR-107 was conducted. The RT-qPCR results were in accordance with
the microarray results (Fig. 3): in
VSCC, miR-590-5p, miR-182-5p and miR-183-5p were upregulated, and
miR-603, miR-103a-3p and miR-107 were downregulated.
Relationship between miR-590-5p and
clinical pathology of vulvar cancer
We set the 75th percentile of the 2−ΔΔCt
values as the cut-off value for samples with high or low levels of
miR-590-5p (12). The miR-590-5p
level was not correlated with patient age, tumour differentiation,
vascular invasion, FIGO stage, tumour size and depth of invasion
but was positively correlated with lymph node metastasis (P=0.009)
(Table V). The results indicated
that increased expression of miR-590-5p aids the distant spread of
VSCC.
| Table VAssociation between expression of
miR-590-5p and clinical pathology of the VSCC cases. |
Table V
Association between expression of
miR-590-5p and clinical pathology of the VSCC cases.
| Variables | Total | miR-590-5p
| P-value |
|---|
| Low | High |
|---|
| Age (years) |
| 25–69 | 18 | 15 | 3 | 0.571 |
| 70–85 | 12 | 8 | 4 | |
|
Differentiation |
| Well | 14 | 6 | 8 | 0.961 |
| Moderate | 12 | 6 | 6 | |
| Poor | 4 | 1 | 3 | |
| Vascular
invasion |
| Yes | 5 | 1 | 4 | 0.903 |
| No | 25 | 9 | 16 | |
| Lymph node
metastasis |
| No | 25 | 1 | 24 | 0.011a |
| Yes | 5 | 3 | 2 | |
| FIGO stage |
| I | 12 | 2 | 10 | 0.961 |
| II | 13 | 4 | 9 | |
| III | 5 | 1 | 4 | |
| Tumor diameter
(cm) |
| 0.3–2.5 | 12 | 5 | 7 | 0.995 |
| 2.6–4.0 | 10 | 5 | 5 | |
| 4.1–20.0 | 8 | 3 | 5 | |
| Depth of invasion
(mm) |
| 0.0–4.0 | 11 | 5 | 6 | 0.971 |
| 4.1–8.0 | 9 | 4 | 5 | |
| 8.1–40.0 | 10 | 3 | 7 | |
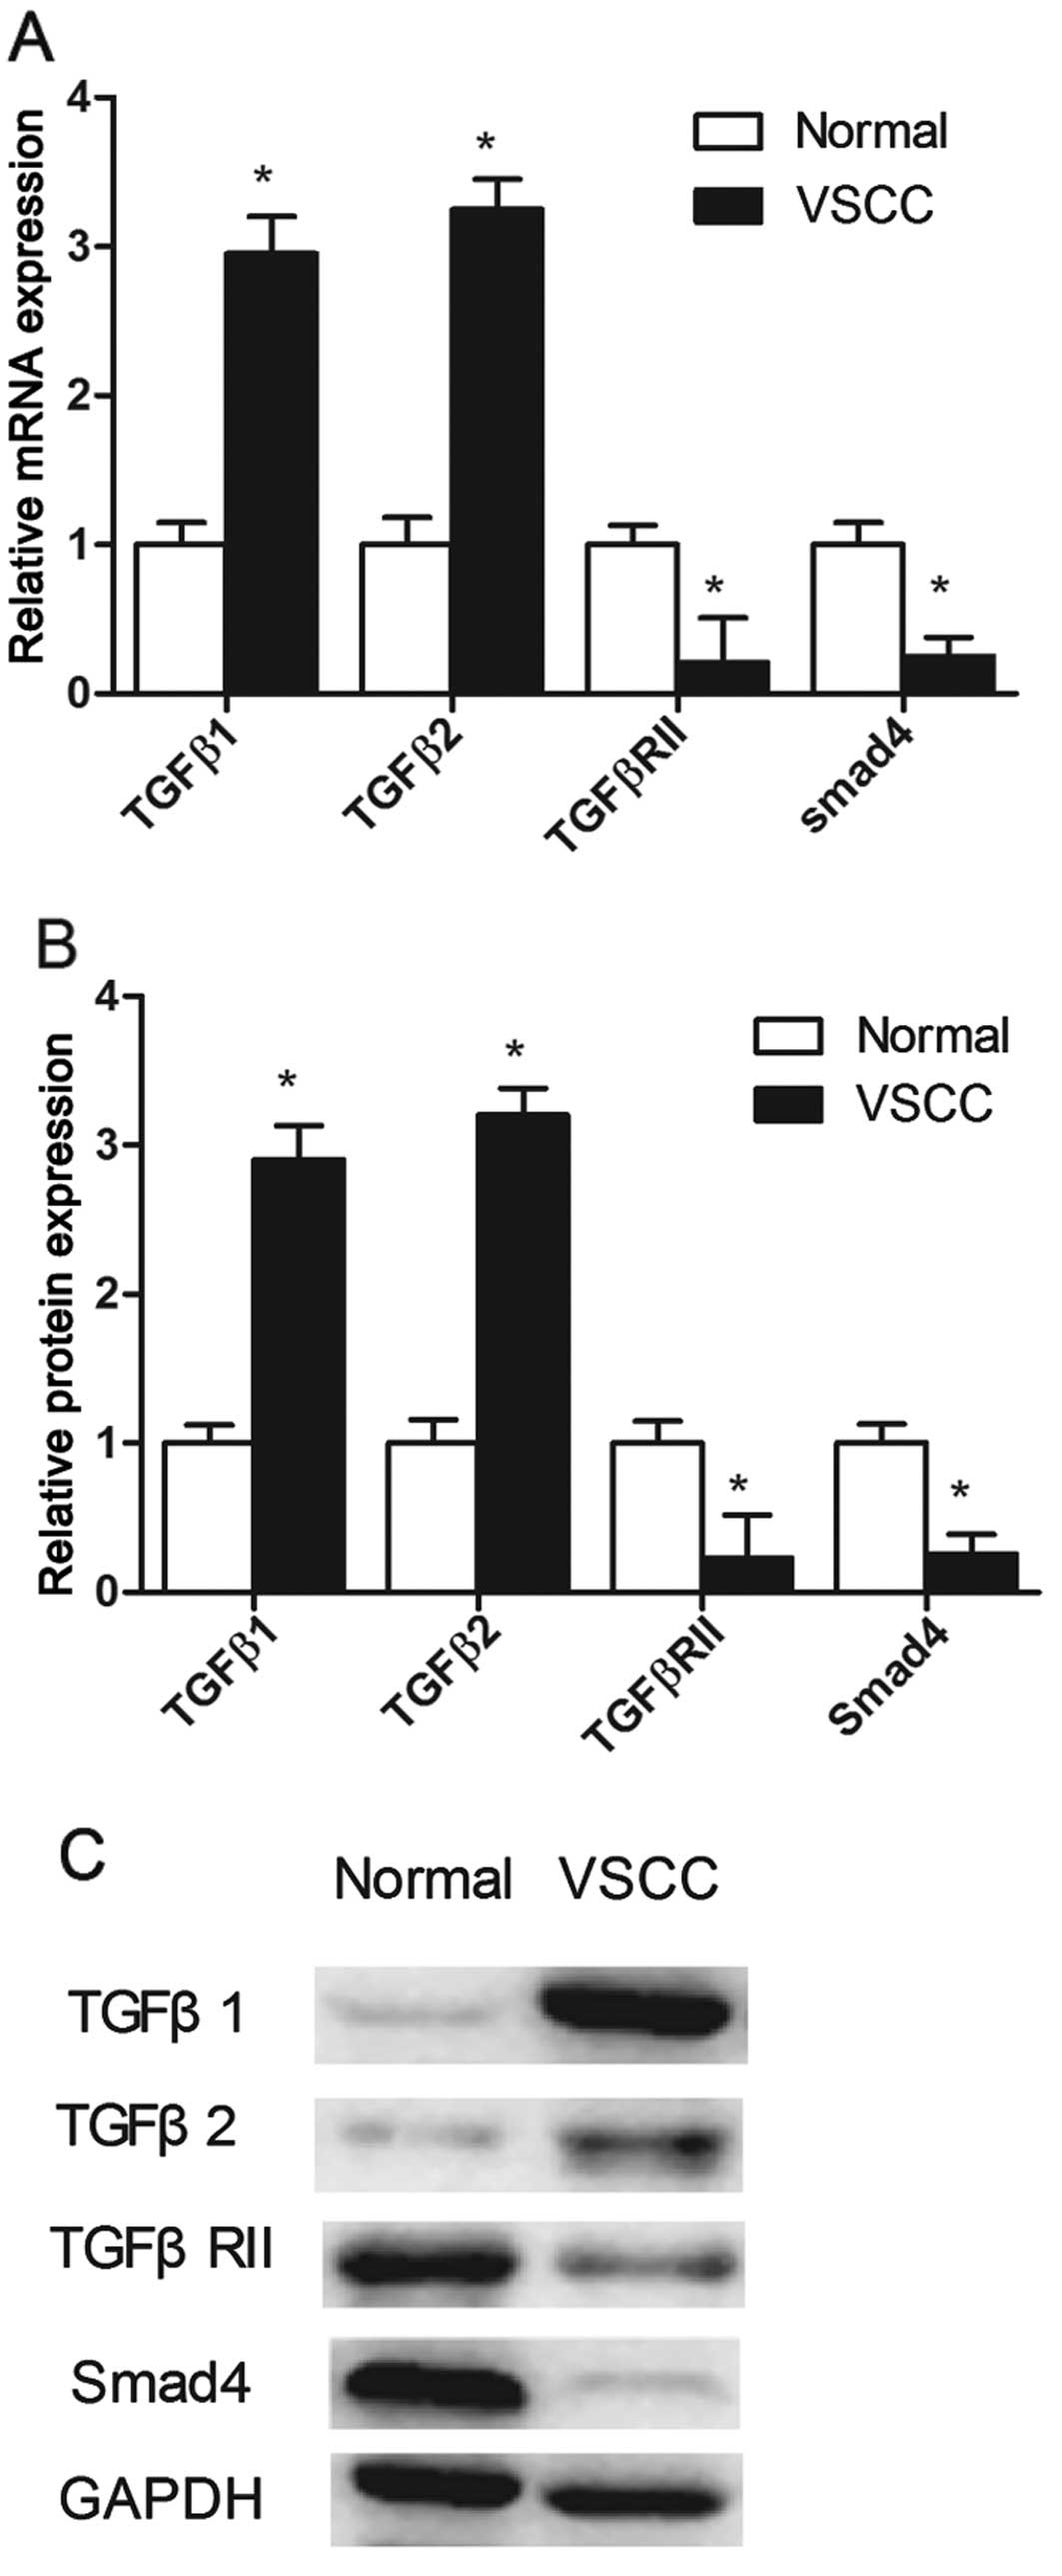
Putative target genes
According to the target prediction programs, TGFβ1
and TGFβ2 are both putative target genes for miR-590-5p (Table VI), TgFβRII is a target of
miR-590-5p in human hepatocellular carcinoma (13), and miR-182-5p acts as an oncogene by
knocking down Smad4 in bladder cancer (14). Since the results showed that
miR-182-5p and miR-590-5p were upregulated in VSCC (Fig. 3), we detected the mRNA and protein
levels of TGFβ1, TGFβ2, TGFβRII and Smad4. The RNA levels of TGFβ1
and TGFβ2 were significantly overexpressed in VSCC compared with
control tissues by 2.95-fold and 3.25-fold, respectively (Fig. 4A). The protein levels of TGFβ1 and
TGFβ2 were found to be markedly increased in VSCC (Fig. 4B and C). The RNA levels of TGFβRII
and Smad4 were significantly underexpressed in VSCC compared with
control tissues by 0.21-fold and 0.25-fold, respectively (Fig. 4A), and the protein levels of TGFβRII
and Smad4 were markedly decreased in VSCC (Fig. 4B and C). Based on our results and
the literature (13), we
hypothesized that TGFβRII is a target gene of miR-590-5p in
VSCC.
| Table VIPutative mRNA targets for
miR-590-5p. |
Table VI
Putative mRNA targets for
miR-590-5p.
| Name | Putative mRNA
targets |
|---|
| hsa-miR-590-5p | AIM1L |
| hsa-miR-590-5p | ARMCX1 |
| hsa-miR-590-5p | BAHD1 |
| hsa-miR-590-5p | BEST3 |
| hsa-miR-590-5p | BOLL |
| hsa-miR-590-5p | BTK |
| hsa-miR-590-5p | CCL1 |
| hsa-miR-590-5p | CCL20 |
| hsa-miR-590-5p | CNTFR |
| hsa-miR-590-5p | DAG1 |
| hsa-miR-590-5p | ELF2 |
| hsa-miR-590-5p | FASLG |
| hsa-miR-590-5p | GLCCI1 |
| hsa-miR-590-5p | GPR64 |
| hsa-miR-590-5p | IL12A |
| hsa-miR-590-5p | ITGB8 |
| hsa-miR-590-5p | JHDM1D |
| hsa-miR-590-5p | LATS1 |
| hsa-miR-590-5p | MATN2 |
| hsa-miR-590-5p | MRPL9 |
| hsa-miR-590-5p | MSH2 |
| hsa-miR-590-5p | NELL2 |
| hsa-miR-590-5p | NFIB |
| hsa-miR-590-5p | NTF3 |
| hsa-miR-590-5p | PCBP2 |
| hsa-miR-590-5p | PCSK6 |
| hsa-miR-590-5p | PFKM |
| hsa-miR-590-5p | PIK3R1 |
| hsa-miR-590-5p | RBMS3 |
| hsa-miR-590-5p | RBPJ |
| hsa-miR-590-5p | RECK |
| hsa-miR-590-5p | S100A10 |
| hsa-miR-590-5p | SKI |
| hsa-miR-590-5p | SLC2A4RG |
| hsa-miR-590-5p | SPRY1 |
| hsa-miR-590-5p | SPRY2 |
| hsa-miR-590-5p | ST3GAL6 |
| hsa-miR-590-5p | STAG2 |
| hsa-miR-590-5p | TAGAP |
| hsa-miR-590-5p | TBX2 |
| hsa-miR-590-5p | TGFβ2 |
| hsa-miR-590-5p | TGFβ1 |
| hsa-miR-590-5p | TNFRSF11B |
| hsa-miR-590-5p | TOPORS |
| hsa-miR-590-5p | WNK3 |
| hsa-miR-590-5p | WWP1 |
| hsa-miR-590-5p | XKR6 |
| hsa-miR-590-5p | ZCCHC3 |
| hsa-miR-590-5p | ZNF367 |
| hsa-miR-590-5p | ZNF704 |
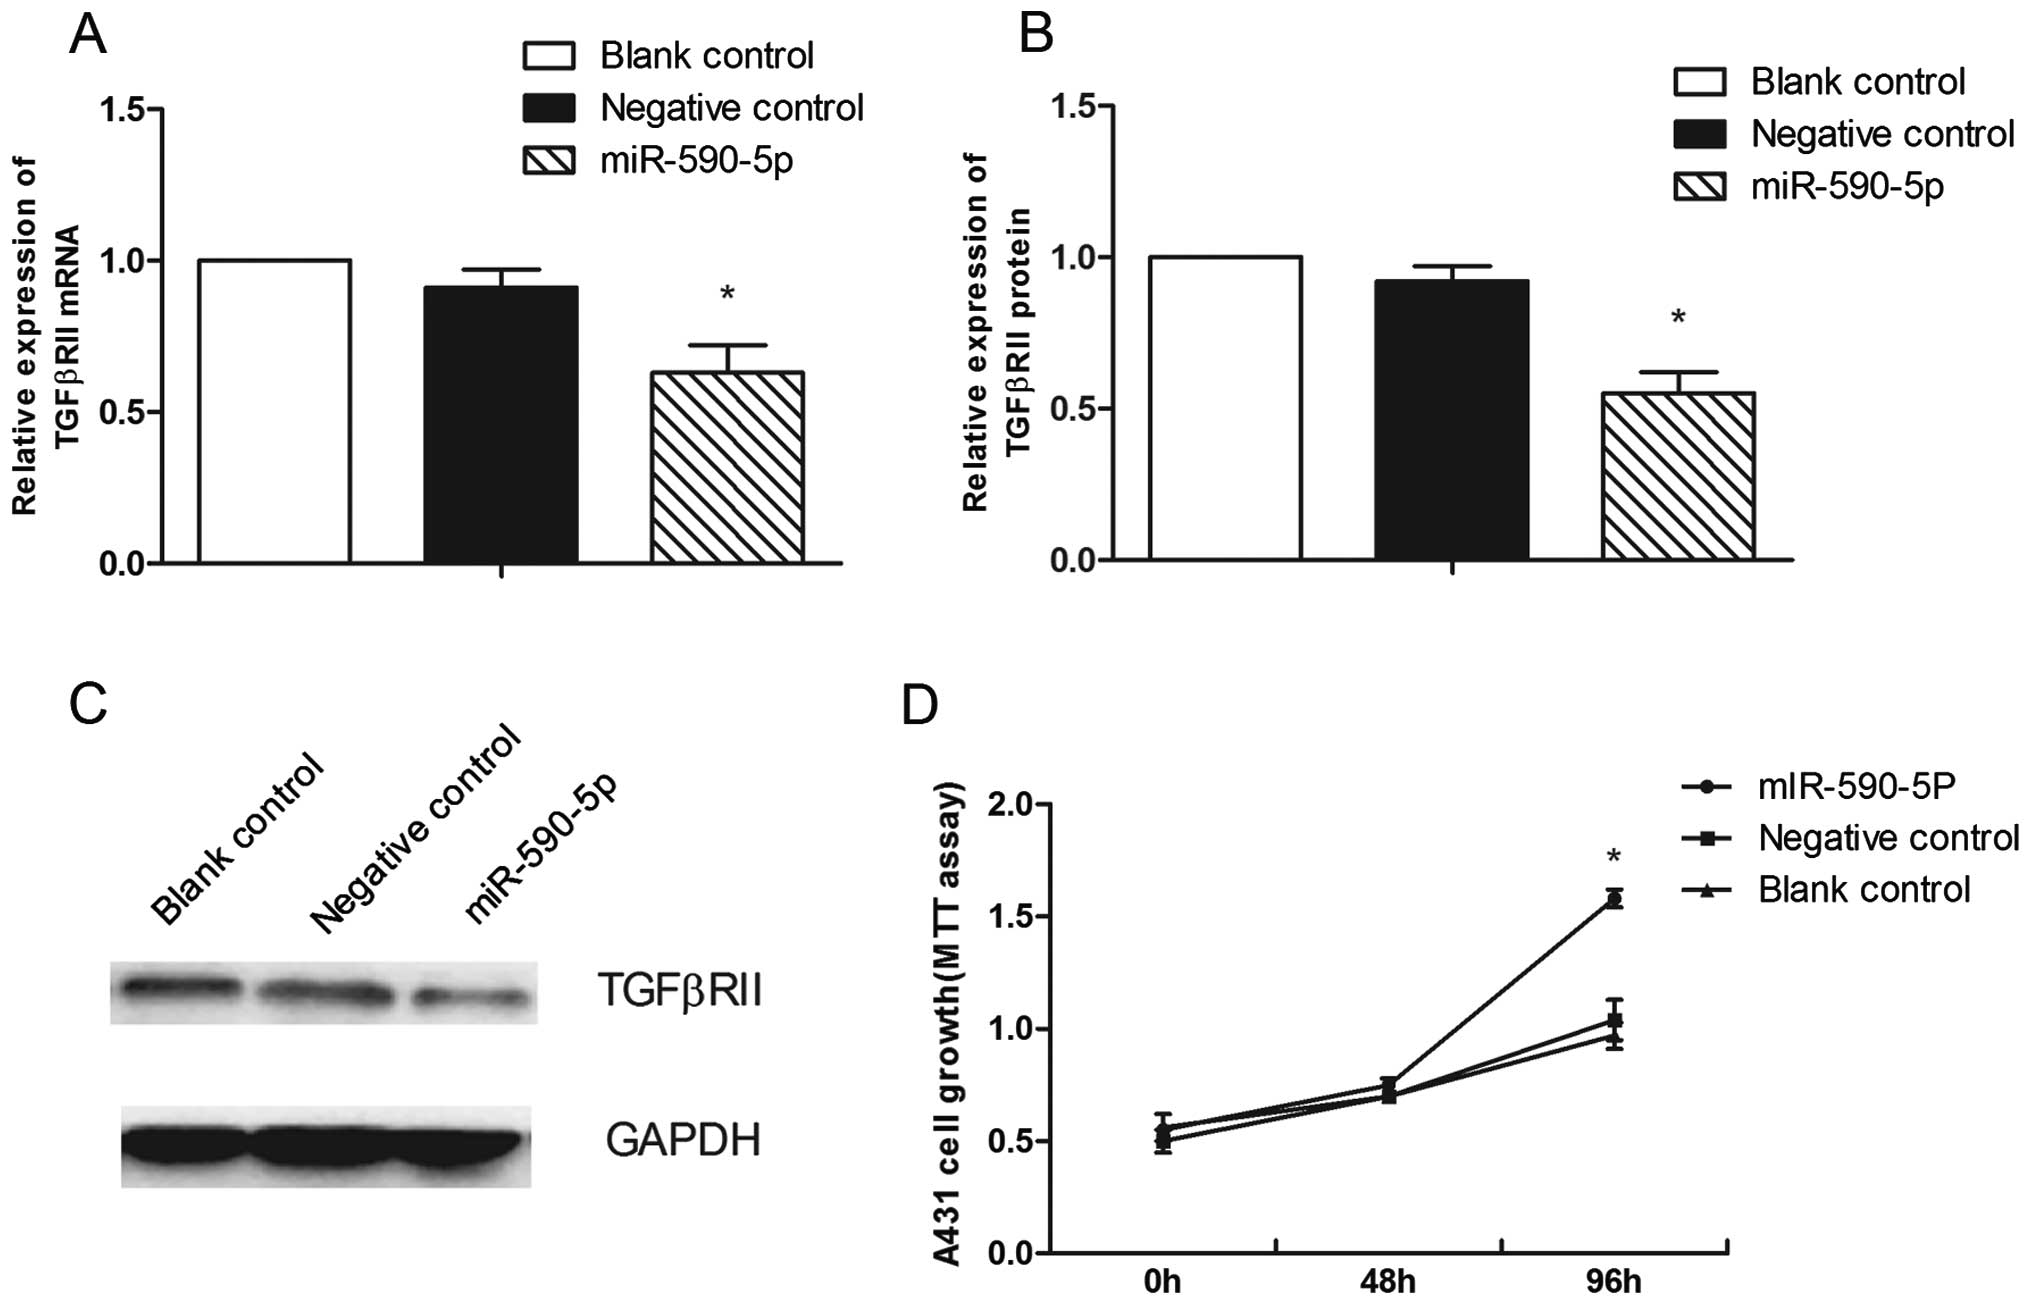
miR-590-5p promotes the proliferation,
migration and the G1-to-S transition in A431 cells
A431 cells were transiently transfected with the
miR-590-5p mimic at a concentration of 100 nM. At 96 h, the
proliferation rate of the A431 cells transfected with the
miR-590-5p mimic was markedly higher (P=0.001) than that of the
cells transfected with the miRNA negative control (Fig. 5D). The miR-590-5p mimic
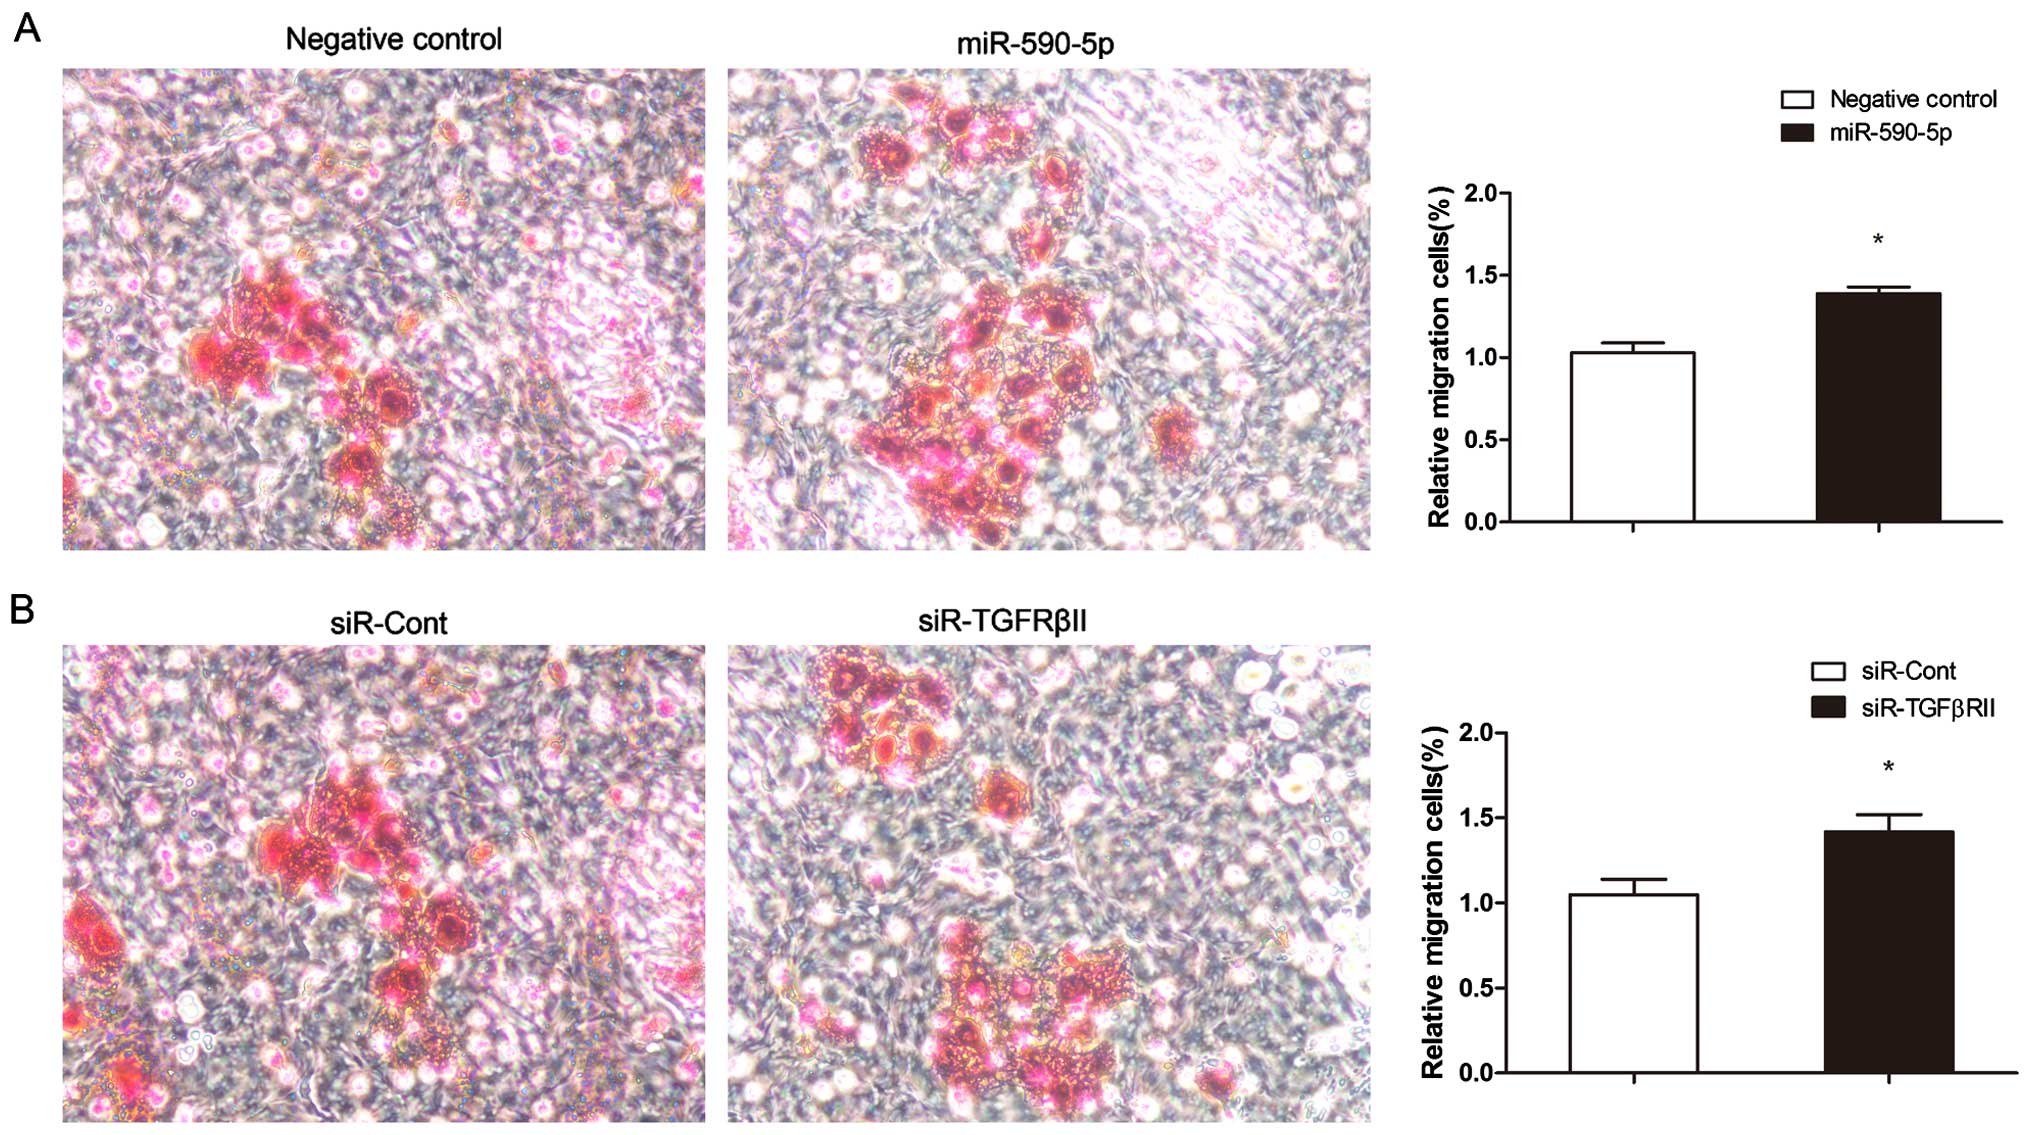
significantly promoted A431 cell migration. The migration rate of
the cells transfected with the miR-590-5p mimics was 40% higher
than that of the cells transfected with the negative control
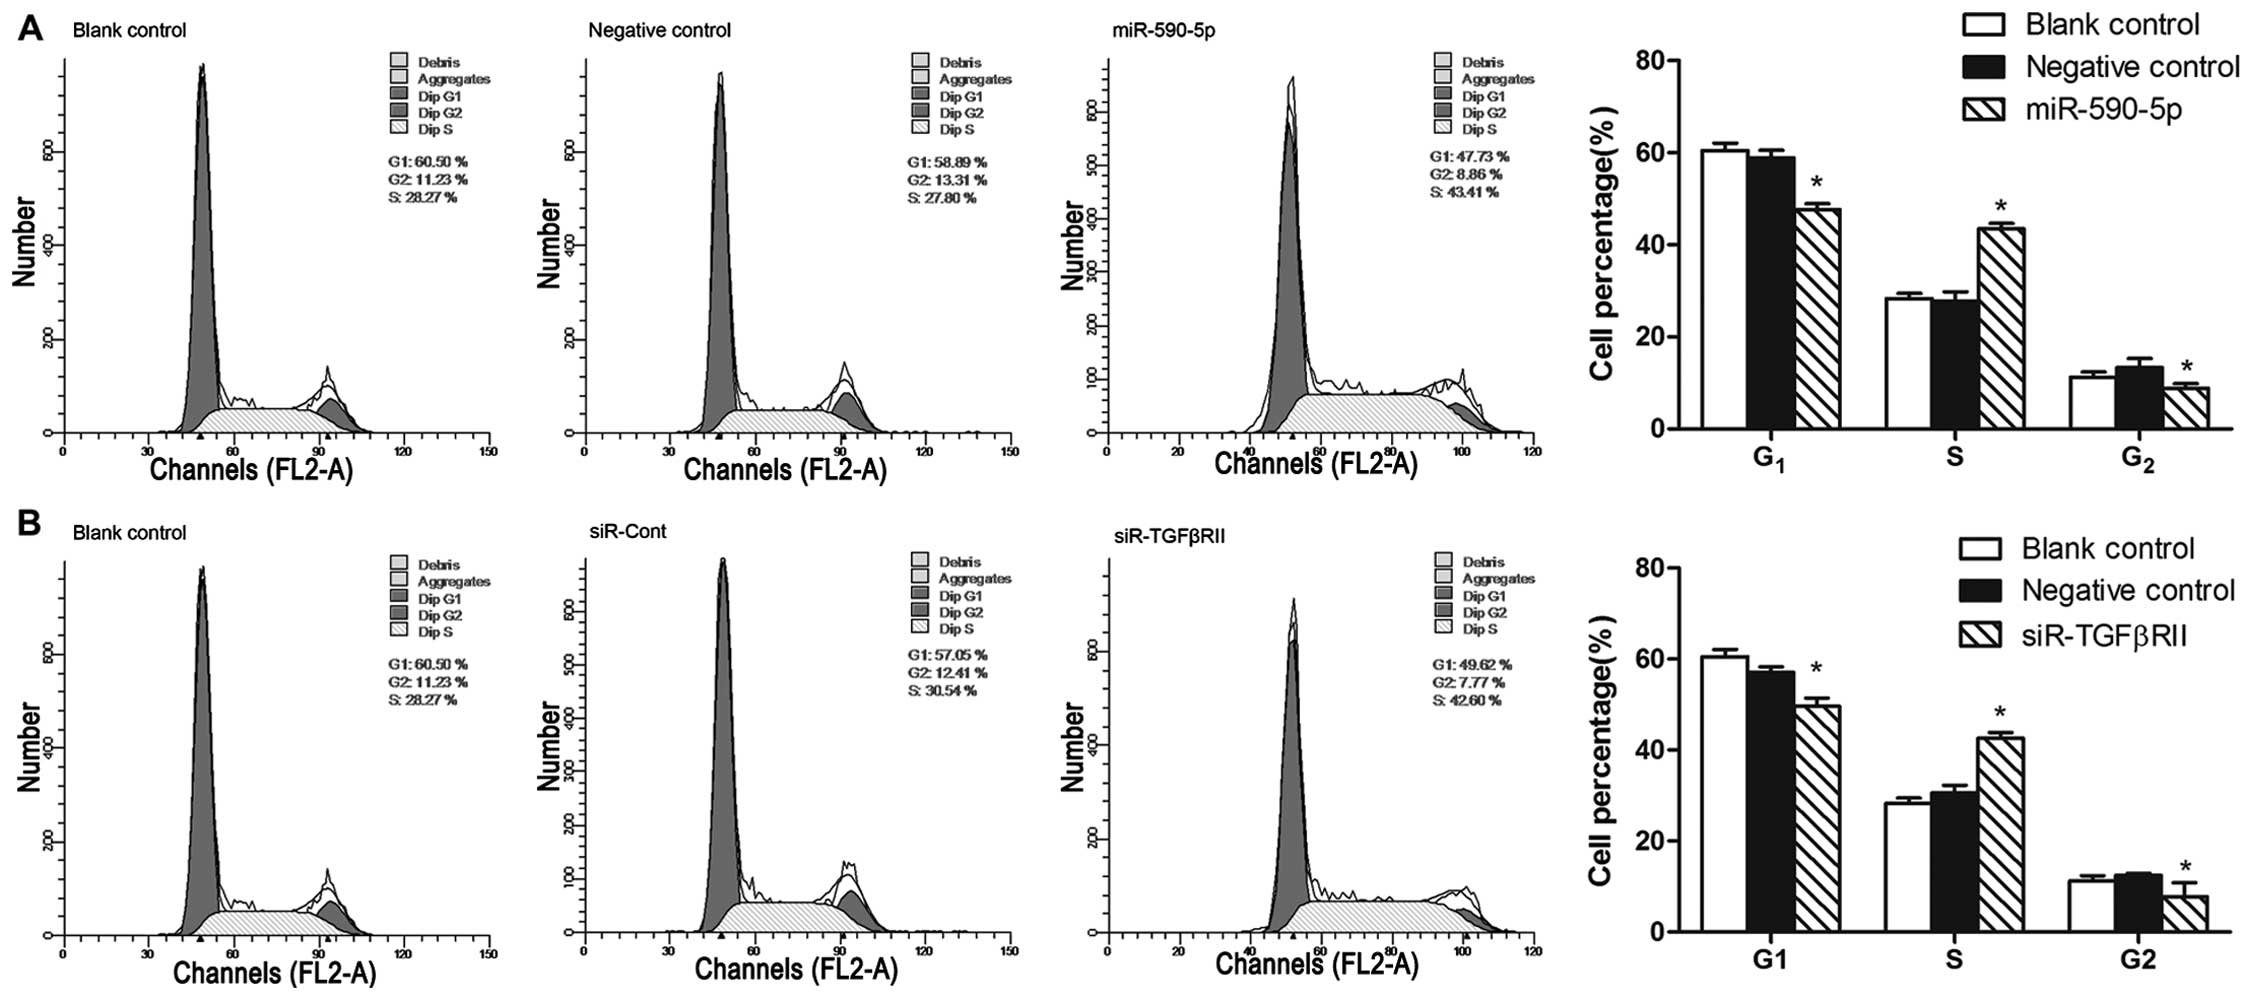
(P=0.001) (Fig. 6A). An analysis of
the cell cycle distribution by flow cytometry showed that the
percentage of A431 cells in the G1 phase was significantly
decreased from 58.89±1.69% before transfection to 47.73±1.23% at 48
h after transfection (P=0.001) and that the percentage of cells in
the S phase was significantly increased from 27.80±1.95% before
transfection to 43.41±1.22% at 48 h after transfection
(P=2.998×10⁻⁴) (Fig.
7A).
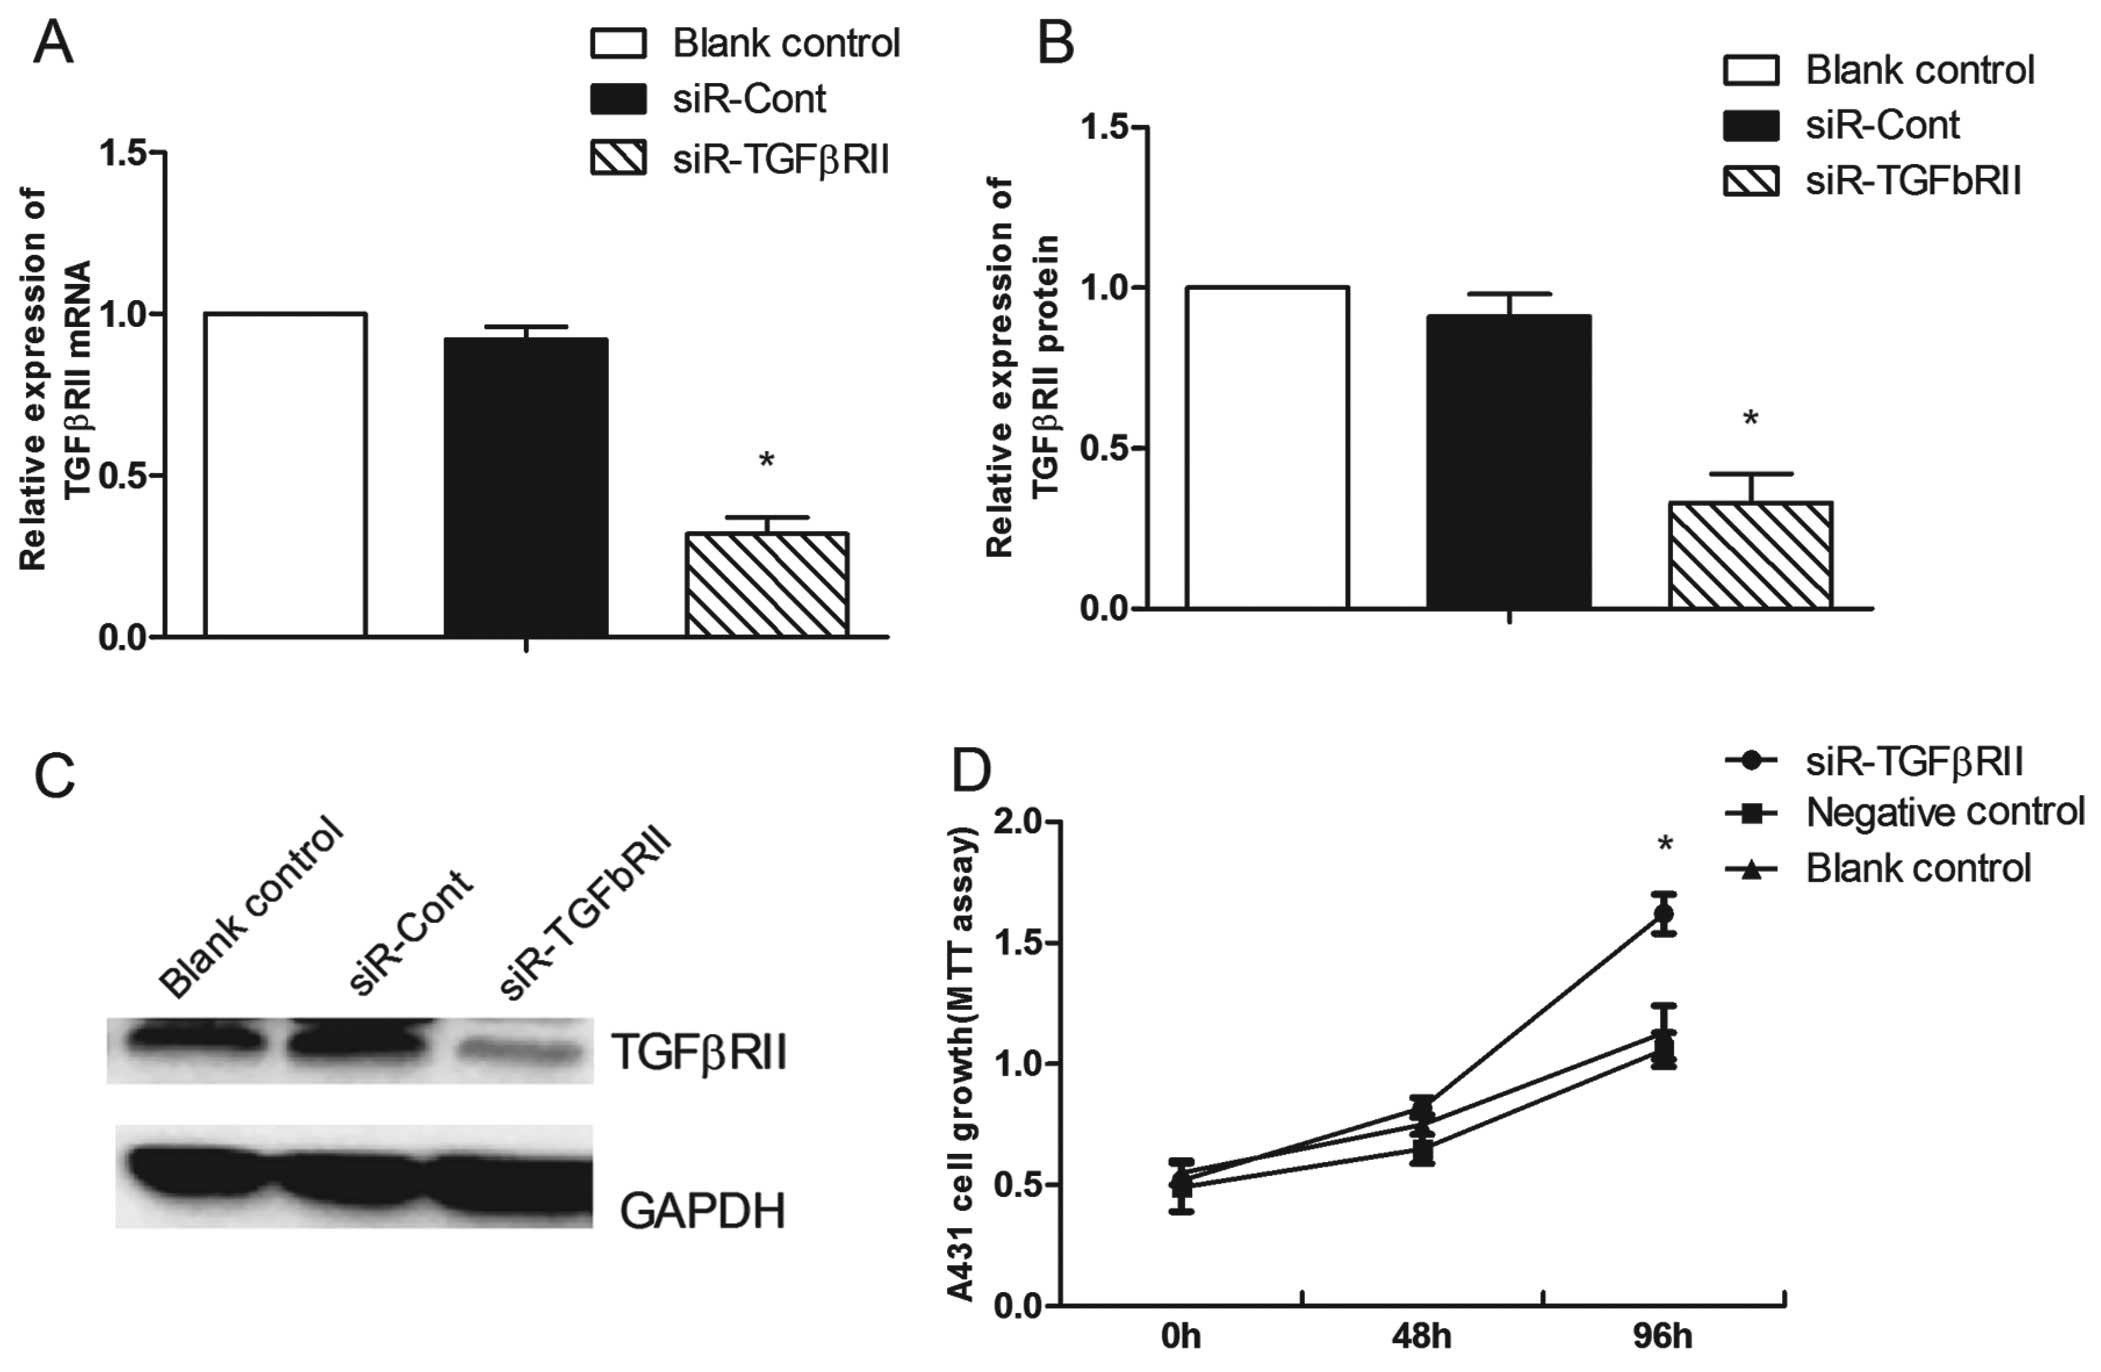
Knockdown of TGFβRII increases the
proliferation and migration of vulvar carcinoma cells
We used an siRNA that targets TGFβRII (siR-TgFβRII)
to investigate the role of TGFβRII in the proliferation and
migration of A431 cells. Forty-eight hours after the knockdown of
TgFβRII in the A431 cells, the mRNA and protein expression levels
of TGFβRII were reduced by 60.3±3.5% (P=0.001) (Fig. 8A) and 57.7±3.2% (P=0.001) (Fig. 8B and C), respectively. TGFβRII
knockdown markedly decreased the percentage of A431 cells in the G1
phase from 57.05±1.26% before knockdown to 49.62±1.84% at 48 h
after knockdown (P=0.005) (Fig. 7B)
and promoted cell proliferation (P=0.003) (Fig. 8D) and cell migration (P=0.008)
(Fig. 6B).
miR-590-5p targets TGFβRII
In the A431 cells, TGFβRII expression was
significantly downregulated by the forced expression of miR-590-5p.
TGFβRII mRNA expression was decreased by 28.7±6.8% (P=0.018) and
TGFβRII protein expression was decreased by 37.7±5.1% (P=0.006) in
the cells transfected with miR-590-5p compared to the cells
transfected with the miRNA negative control (Fig. 5A–C).
Discussion
miRNAs are highly conserved small RNA molecules
(18–24 bp in length) that block translation or promote mRNA
degradation. Researchers use miRNA expression profiles to identify
new early diagnostic markers and key pathways that are relevant to
cancer and to predict outcomes (15). however, few miRNA studies have
focused on VSCC. In the present study, we determined the miRNA
expression profile of VSCC using a miRCURY™ LNA array. To confirm
the reproducibility of the experiment, we determined the expression
levels of 6 miRNAs in 30 pairs of tissues by RT-qPCR and found that
the results of the two assays were consistent. This investigation
of the miRNA profile of VSCC provides valuable information
regarding the aetiology of VSCC. Computational approaches, such as
GO and KEGG, provide high statistical power for confirming the
biological relevance of the experimental data. Using
bioinformatics, we found that the TGFβ signalling pathway is
important in VSCC. The RNA and protein levels of key factors
(TgFβ1, TGFβ2, TGFβRII and Smad4) were measured in tissue samples,
and TGFβRII was selected for further research.
We observed the upregulation of miR-590-5p in VSCC.
miR-590-5p has been reported to increase cardiac muscle cell growth
in mammals (16) and has frequently
been shown to be upregulated in tumours, which suggests that
miR-590-5p promotes tumour progression. miR-590-5p has been shown
to be overexpressed in patients with high-risk types of Wilms'
carcinoma (17). The target mRNAs
of miR-590-5p have been identified in certain studies. For example,
miR-590-5p has been shown to exert oncogenic activity through
targeting of the ChL1 gene in cervical carcinoma (18). in addition, upregulation of
miR-590-5p has been shown to be induced by the downregulation of
PBRM1 in renal cancer cell lines (19). Another research group showed that
miR-590 is upregulated by TGFβRII in cardiosphere-derived cells
during differentiation (20).
however, Shan et al reported that miR-590-5p is
downregulated in liver cancer and that miR-590-5p decreases the
proliferation of carcinoma cells by targeting S100A100 (21). Our study showed that miR-590-5p is
overexpressed in vulvar cancer tissues (Fig. 3). Thus, miR-590-5p may be a novel
oncogenic miRNA in VSCC.
Our research also showed that TGFβRII is negatively
regulated by miR-590-5p in VSCC. The TGF-β/Smad signalling pathway
functions as an important regulator of the pathogenesis of many
cancers, including colon cancer, oesophageal squamous cell
carcinoma, breast cancer and lung cancer (22–25).
Many studies have investigated the effect of TGF-β/Smad signalling
on epithelial cell proliferation and carcinoma. In humans, the
three TGFβ isoforms, TGFβ1, TGFβ2 and TGFβ3, exhibit high
similarity and homology. The TGF-β pathway transfers signals to the
inside of cells via TGF-β-specific receptors including TGFβRII,
which plays a role in cell growth and carcinogenesis. Smad4 is a
major transducer of intracellular signals of the TGF-β pathway.
TGFβRII has been shown to play roles in tumour invasion and
metastasis in several types of cancers. Ganapathy et al
showed that TGFβRII is downregulated in haCaT cells and found that
TGFβRII inhibits metastasis and progression of late-stage tumour
cells (26). The overexpression of
TGFβRII inhibits cell growth in cancer (27). Additionally, TGFβRII has also been
found to be progressively lost in oral and skin SCC (28). However, the role of TGFβRII in VSCC
is unknown, and our research showed that TGFβRII is underexpressed
in vulvar carcinoma.
We conducted functional studies in A431 cells, which
have previously been used for miRNA research. Alanazi et al
found that some miRNAs (miR-663, miR-499-5p, miR-494, miR-602,
miR-2861, miR-675 and miR-3185) may have crucial functions in A431
cell apoptosis through a process involving epidermal growth factor
(EGF) involvement (29). In
addition, miR-21 has been shown to promote the proliferation of
A431 cells (30). In the present
study, we transfected the miR-590-5p mimic into A431 cells, and
after transfection, the endogenous level of miR-590-5p was
upregulated. The MTT assay revealed that cell proliferation was
markedly increased (Fig. 5D) and
that TGFβRII was down-regulated (Fig.
5A–C). The Transwell assay results suggested that miR-590-5p
induced cell migration (Fig. 6A).
We also explored changes in cell cycle progression, which is an
essential step in carcinogenesis. The FCM results indicated that
the upregulation of miR-590-5p promoted the G1-to-S cell cycle
transition in the A431 cells (Fig.
7A). Our results provide novel information regarding the roles
of miR-590-5p in tumourigenesis. Moreover, we used siRNA to
successfully block TGFβRII expression and obtained results that
were similar to those obtained after the overexpression of
miR-590-5p. We found that miR-590-5p exerted an oncogenic function
in vulvar cancer. Based on our results, we hypothesize that
miR-590-5p interferes with the TGF-β pathway to regulate cell
growth and induce carcinogenesis.
The present study has some limitations. First,
vulvar cancer is a rare disease; thus, the number of clinical
samples in our study was relatively low, and more microarray
studies on vulvar cancer are needed to obtain larger data sets. We
did not conduct a dual luciferase reporter assay in our study since
it was performed previously (13).
We found that miR-590-5p, TGFβ1 and TGFβ2 were all upregulated in
VSCC tissues, which suggests that miRNAs other than miR-590-5p may
be responsible for the upregulation of TGFβ1 and TGFβ2 because
miRNAs typically decrease the expression of their target mRNAs.
however, some miRNAs have also been reported to increase the
expression of target genes. For example, miR-373 increases the
expression of its target gene, E-cadherin (31). Therefore, further assays need to be
performed to determine the targets of miR-590-5p. The relationship
between miR-182-5p and Smad4 in VSCC remains to be
investigated.
In conclusion, we determined the miRNA expression
profile in VSCC and evaluated the expression of a subset of miRNAs
by microarray. Target prediction and functional analysis suggested
that miR-590-5p is involved in the tumourigenesis of VSCC as the
upregulation of miR-590-5p was found to be associated with
lymphatic metastasis. Furthermore, the present investigation showed
that miR-590-5p plays an oncogenic role in VSCC by promoting cell
proliferation and migration as well as the G1-S transition through
the manipulation of TGFβRII expression. These findings suggest that
miR-590-5p may be a critical therapeutic target in VSCC.
Acknowledgments
We thank Tao Zhang for his invaluable technical
assistance.
References
|
1
|
Pathak D, Agrawal S and Dhali TK:
Prevalences of and risk factors for vulvar diseases in Nepal: A
hospital-based study. Int J Dermatol. 50:161–167. 2011. View Article : Google Scholar : PubMed/NCBI
|
|
2
|
Akhtar-Danesh N, Elit L and Lytwyn A:
Trends in incidence and survival of women with invasive vulvar
cancer in the United States and Canada: A population-based study.
Gynecol Oncol. 134:314–318. 2014. View Article : Google Scholar : PubMed/NCBI
|
|
3
|
Dittmer C, Katalinic A, Mundhenke C, Thill
M and Fischer D: Epidemiology of vulvar and vaginal cancer in
Germany. Arch Gynecol Obstet. 284:169–174. 2011. View Article : Google Scholar : PubMed/NCBI
|
|
4
|
Judson PL, Habermann EB, Baxter NN, Durham
SB and Virnig BA: Trends in the incidence of invasive and in situ
vulvar carcinoma. Obstet Gynecol. 107:1018–1022. 2006. View Article : Google Scholar : PubMed/NCBI
|
|
5
|
Chen CZ, Li L, Lodish HF and Bartel DP:
MicroRNAs modulate hematopoietic lineage differentiation. Science.
303:83–86. 2004. View Article : Google Scholar
|
|
6
|
Sharma A, Kumar M, Aich J, Hariharan M,
Brahmachari SK, Agrawal A and Ghosh B: Posttranscriptional
regulation of interleukin-10 expression by hsa-miR-106a. Proc Natl
Acad Sci USA. 106:5761–5766. 2009. View Article : Google Scholar : PubMed/NCBI
|
|
7
|
Ambros V: The functions of animal
microRNAs. Nature. 431:350–355. 2004. View Article : Google Scholar : PubMed/NCBI
|
|
8
|
de Melo Maia B, Lavorato-Rocha AM,
Rodrigues LS, Coutinho-Camillo CM, Baiocchi G, Stiepcich MM, Puga
R, de A Lima L, Soares FA and Rocha RM: microRNA portraits in human
vulvar carcinoma. Cancer Prev Res (Phila). 6:1231–1241. 2013.
View Article : Google Scholar
|
|
9
|
Pecorelli S: Revised FIGO staging for
carcinoma of the vulva, cervix, and endometrium. Int J Gynaecol
Obstet. 105:103–104. 2009. View Article : Google Scholar : PubMed/NCBI
|
|
10
|
Chen C, Ridzon DA, Broomer AJ, Zhou Z, Lee
DH, Nguyen JT, Barbisin M, Xu NL, Mahuvakar VR, Andersen MR, et al:
Real-time quantification of microRNAs by stem-loop RT-PCR. Nucleic
Acids Res. 33:e1792005. View Article : Google Scholar : PubMed/NCBI
|
|
11
|
Li Y, Wang F, Xu J, Ye F, Shen Y, Zhou J,
Lu W, Wan X, Ma D and Xie X: Progressive miRNA expression profiles
in cervical carcinogenesis and identification of hPV-related target
genes for miR-29. J Pathol. 224:484–495. 2011. View Article : Google Scholar : PubMed/NCBI
|
|
12
|
Chen ZL, Zhao XH, Wang JW, Li BZ, Wang Z,
Sun J, Tan FW, Ding DP, Xu XH, Zhou F, et al: microRNA-92a promotes
lymph node metastasis of human esophageal squamous cell carcinoma
via E-cadherin. J Biol Chem. 286:10725–10734. 2011. View Article : Google Scholar :
|
|
13
|
Jiang X, Xiang G, Wang Y, Zhang L, Yang X,
Cao L, Peng H, Xue P and Chen D: MicroRNA-590–5p regulates
proliferation and invasion in human hepatocellular carcinoma cells
by targeting TGF-β RII. Mol Cells. 33:545–551. 2012. View Article : Google Scholar : PubMed/NCBI
|
|
14
|
Hirata H, Ueno K, Shahryari V, Tanaka Y,
Tabatabai ZL, Hinoda Y and Dahiya R: Oncogenic miRNA-182-5p targets
Smad4 and RECK in human bladder cancer. PLoS One. 7:e510562012.
View Article : Google Scholar : PubMed/NCBI
|
|
15
|
Garzon R, Fabbri M, Cimmino A, Calin GA
and Croce CM: MicroRNA expression and function in cancer. Trends
Mol Med. 12:580–587. 2006. View Article : Google Scholar : PubMed/NCBI
|
|
16
|
Eulalio A, Mano M, Dal Ferro M, Zentilin
L, Sinagra G, Zacchigna S and Giacca M: Functional screening
identifies miRNAs inducing cardiac regeneration. Nature.
492:376–381. 2012. View Article : Google Scholar : PubMed/NCBI
|
|
17
|
Watson JA, Bryan K, Williams R, Popov S,
Vujanic G, Coulomb A, Boccon-Gibod L, Graf N, Pritchard-Jones K and
O'Sullivan M: miRNA profiles as a predictor of chemorespon-siveness
in Wilms' tumor blastema. PLoS One. 8:e534172013. View Article : Google Scholar
|
|
18
|
Chu Y, Ouyang Y, Wang F, Zheng A, Bai L,
Han L, Chen Y and Wang H: MicroRNA-590 promotes cervical cancer
cell growth and invasion by targeting ChL1. J Cell Biochem.
115:847–853. 2014. View Article : Google Scholar
|
|
19
|
Xiao X, Tang C, Xiao S, Fu C and Yu P:
Enhancement of proliferation and invasion by microRNA-590-5p via
targeting PBRM1 in clear cell renal carcinoma cells. Oncol Res.
20:537–544. 2013. View Article : Google Scholar : PubMed/NCBI
|
|
20
|
Ekhteraei-Tousi S, Mohammad-Soltani B,
Sadeghizadeh M, Mowla SJ, Parsi S and Soleimani M: Inhibitory
effect of hsa-miR-590-5p on cardiosphere-derived stem cells
differentiation through downregulation of TGFB signaling. J Cell
Biochem. 116:179–191. 2015. View Article : Google Scholar
|
|
21
|
Shan X, Miao Y, Fan R, Qian H, Chen P, Liu
H, Yan X, Li J and Zhou F: MiR-590-5P inhibits growth of hepg2
cells via decrease of S100A10 expression and Inhibition of the Wnt
pathway. Int J Mol Sci. 14:8556–8569. 2013. View Article : Google Scholar : PubMed/NCBI
|
|
22
|
Ji Q, Liu X, Han Z, Zhou L, Sui H, Yan L,
Jiang H, Ren J, Cai J and Li Q: Resveratrol suppresses
epithelial-to-mesenchymal transition in colorectal cancer through
TGF-β1/Smads signaling pathway mediated Snail/E-cadherin
expression. BMC Cancer. 15:972015. View Article : Google Scholar
|
|
23
|
Guo W, Zhang M, Shen S, Guo Y, Kuang G,
Yang Z and Dong Z: Aberrant methylation and decreased expression of
the TGF-β/Smad target gene FBXO32 in esophageal squamous cell
carcinoma. Cancer. 120:2412–2423. 2014. View Article : Google Scholar : PubMed/NCBI
|
|
24
|
Goto N, Hiyoshi H, Ito I, Iida K, Nakajima
Y, Nagasawa K and Yanagisawa J: Identification of a novel compound
that suppresses breast cancer invasiveness by inhibiting
transforming growth factor-β signaling via estrogen receptor α. J
Cancer. 5:336–343. 2014. View
Article : Google Scholar
|
|
25
|
Ischenko I, Liu J, Petrenko O and Hayman
MJ: Transforming growth factor-beta signaling network regulates
plasticity and lineage commitment of lung cancer cells. Cell Death
Differ. 21:1218–1228. 2014. View Article : Google Scholar : PubMed/NCBI
|
|
26
|
Ganapathy A, Paterson IC, Prime SS, Eveson
JW, Pring M, Price N, Threadgold SP and Davies M: TGF-β inhibits
metastasis in late stage human squamous cell carcinoma of the skin
by a mechanism that does not involve Id1. Cancer Lett. 298:107–118.
2010. View Article : Google Scholar : PubMed/NCBI
|
|
27
|
Deacu E, Mori Y, Sato F, Yin J, Olaru A,
Sterian A, Xu Y, Wang S, Schulmann K, Berki A, et al: Activin type
II receptor restoration in ACVR2-deficient colon cancer cells
induces transforming growth factor-beta response pathway genes.
Cancer Res. 64:7690–7696. 2004. View Article : Google Scholar : PubMed/NCBI
|
|
28
|
Paterson IC, Matthews JB, Huntley S,
Robinson CM, Fahey M, Parkinson EK and Prime SS: Decreased
expression of TGF-beta cell surface receptors during progression of
human oral squamous cell carcinoma. J Pathol. 193:458–467. 2001.
View Article : Google Scholar : PubMed/NCBI
|
|
29
|
Alanazi I, Hoffmann P and Adelson DL:
MicroRNAs are part of the regulatory network that controls EGF
induced apoptosis, including elements of the JAK/STAT pathway, in
A431 cells. PLoS One. 10:e01203372015. View Article : Google Scholar : PubMed/NCBI
|
|
30
|
Li X, Huang K and Yu J: Inhibition of
microRNA-21 upregulates the expression of programmed cell death 4
and phosphatase tensin homologue in the A431 squamous cell
carcinoma cell line. Oncol Lett. 8:203–207. 2014.PubMed/NCBI
|
|
31
|
Place RF, Li LC, Pookot D, Noonan EJ and
Dahiya R: MicroRNA-373 induces expression of genes with
complementary promoter sequences. Proc Natl Acad Sci USA.
105:1608–1613. 2008. View Article : Google Scholar : PubMed/NCBI
|