Introduction
The role of skeletal muscle as a prognostic and
predictive factor in cancer management has been a topic of interest
lately (1–6). In particular, two skeletal muscle
parameters have been studied in detail: skeletal muscle density
(SMD) and skeletal muscle index (SMI). SMD reflects the lipid
content of the muscle: the higher the lipid content, the lower the
SMD and the weaker the muscle strength (7–9). SMI
reflects the skeletal muscle volume or mass and is measured as
skeletal muscle area divided by the square of the body height.
Both SMD and SMI have been shown to predict survival
in patients with various types of cancer (10,11).
Low SMI, also known as sarcopenia, is also a predictor of severe
toxicities associated with anticancer drugs such as 5-fluorouracil
and sorafenib (12,13). However, this association of SMD
and/or SMI with prognosis or treatment-toxicities among gastric
cancer patients has not been studied yet.
The clinical significance of SMD and SMI in patients
with gastric cancer may differ from that in patients with other
types of cancer owing to differences in dietary status caused by
gastrectomy, gastrointestinal disorders, or both. Because
chemotherapy is the only treatment for metastatic gastric cancer
and has only limited survival benefit (14), it is important to have factors that
could effectively predict the prognosis or adverse effects for
proper assessment of risk-benefit ratio to the patients. Hence, we
undertook this study to evaluate the prognostic implications of SMD
and SMI in patients with metastatic gastric cancer receiving
chemotherapy.
Materials and methods
Patients
Patients with recurrent or metastatic gastric cancer
who received S-1 plus cisplatin as first-line chemotherapy in
Nagoya University Hospital (Nagoya, Japan) from January 2009
through June 2014 were studied retrospectively. All but 2 patients
received S-1 (80 mg/m2 on days 1–21) orally and
cisplatin (60 mg/m2 on day 8) intravenously every 5
weeks. The other 2 patients received S-1 (80 mg/m2 on
days 1–14) orally and cisplatin (60 mg/m2 on day 1)
intravenously every 3 weeks. All patients had histologically proven
adenocarcinoma of stomach with at least one metastatic lesion as
confirmed by diagnostic imaging. CT scanning was performed every 2
months in most patients to evaluate treatment response. Patients
with double primary cancers were excluded. This retrospective study
was conducted after receiving formal approval from our
Institutional Review Board.
Data collection
Clinical data were extracted from the hospital
electronic medical database and included the following variables:
age, gender, ECOG performance status (PS), height (m), body weight
(kg), at baseline (before starting chemotherapy), history of
gastrectomy, histopathological characteristics of primary tumor
(well or poorly differentiated), and subsequent treatments,
including conversion surgery. Relative dose intensity (RDI) was
calculated by dividing the actual total dose intensity (actual
total dose divided by the duration of therapy) by the planned total
dose intensity (planned total dose divided by the planned duration
of therapy).
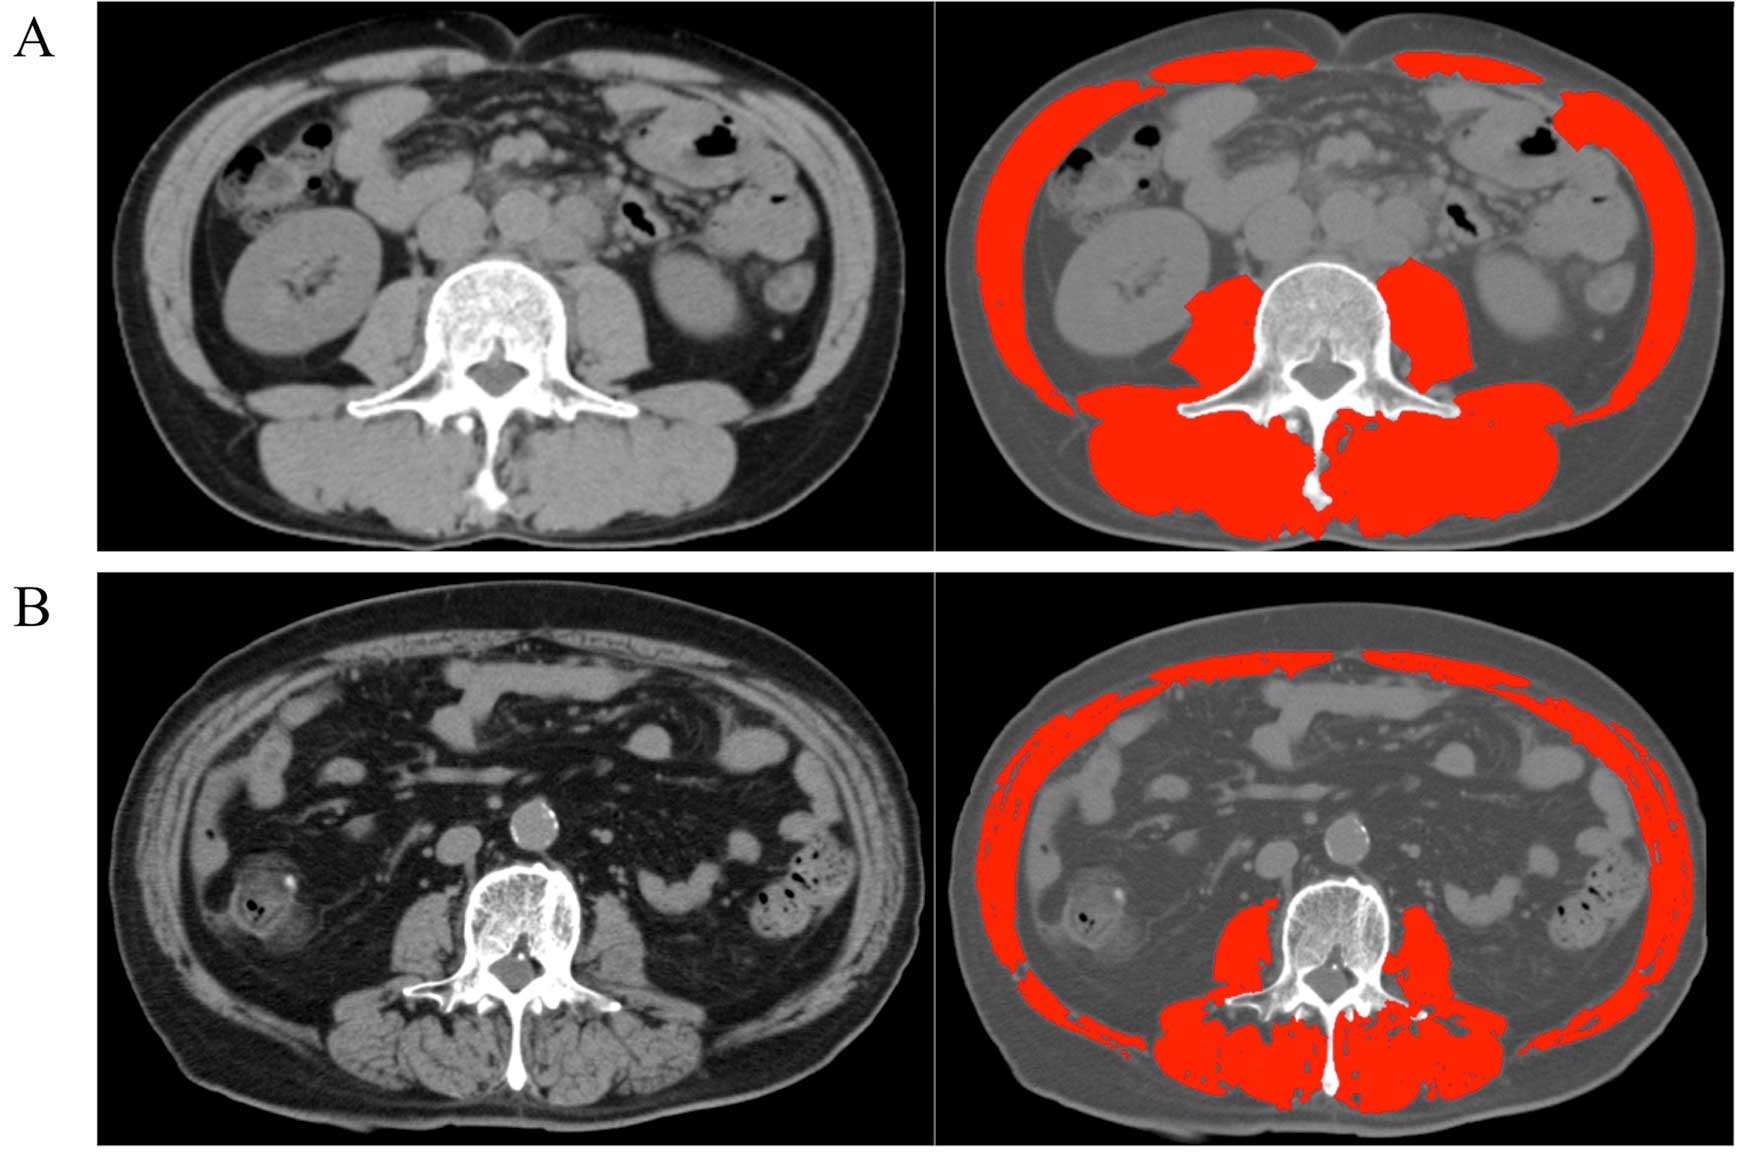
Skeletal muscle assessment
Baseline CT images obtained within 1 month before
starting chemotherapy were used to evaluate SMD and SMI. Skeletal
muscle area at the level of the third lumber vertebra (l3) scan was
quantified by using Slice-O-Matic® medical imaging
software (version 5.0; TomoVision, Magog, Quebec, Canada) using a
Hounsfield unit (HU) threshold of −29 to +150 for identification as
has been described previously (15)
(Fig. 1). The skeletal muscle area
thus obtained was divided by the square of body height to get the
skeletal muscle index (SMI) in the units of
cm2/m2. The value for the skeletal muscle
density (SMD) in HU at the same level was also obtained from the
software. It is estimated that SMD decreases by 1 HU for each
additional 1 g/100 ml lipid in muscle (8). The cut-off values for determining low
SMD and low SMI were based on a recently published population-based
study of 1,473 patients (10)
(Table I). Although various
cut-offs for diagnosing sarcopenia have been proposed, this
criteria takes into account both gender and BMI, and therefore is
more reliable.
 | Table ICut-off values of SMD and SMI. |
Table I
Cut-off values of SMD and SMI.
| BMI
(kg/m2) | SMD (HU)
| SMI
(cm2/m2)
|
|---|
| Male | Female | Male | Female |
|---|
| <20.0 | <41 | <41 | <43 | <41 |
| 20.0 to 24.9 | <41 | <41 | <43 | <41 |
| ≥25.0 | <33 | <33 | <53 | <41 |
Statistical analysis
Overall survival (OS), progression-free survival
(PFS), and tumor response (evaluated according to the Response
Evaluation Criteria in Solid Tumors, version 1.0) were compared
between patients with low SMD and those with normal SMD, as well as
between patients with low SMI and those with normal SMI. Briefly,
OS was defined as the time from the day of starting chemotherapy to
the day of death or the last contact, and PFS was defined as the
time from the day of starting chemotherapy to the day on which the
first event of disease progression was diagnosed or the day of
death from any cause. PFS and OS with 95% confidence intervals (95%
CI) were estimated by the Kaplan-Meier method and were compared
between groups by the log-rank test. Data on patients who were
alive or lost to follow-up were censored in the calculation of OS.
Data on patients who discontinued chemotherapy because of adverse
events or who could not be followed up until disease progression
were censored in the calculation of PFS. Associations of the
following variables with OS were analyzed with the use of
multivariate Cox hazard models: SMD (normal vs. low), SMI (normal
vs. low), gender (male vs. female), PS (0–1 vs. 2), age (less than
or equal to the median vs. higher than the median), number of
metastatic sites (less than 2 vs. 2 or more), and tumor response to
first-line chemotherapy (yes vs. no). P-values <0.05 were
considered to indicate statistical significance. P-values are
estimated from one-sided tests. Statistical analysis was performed
using JMP software (version 9; SAS Institute Inc., Cary, NC,
USA).
Results
Patient characteristics
A total of 53 patients were included in this study
(Table II). The median SMD was
36.8 HU (range, 19.5–59.3 HU), and the median SMI was 39.8
cm2/m2 (range, 23.7–60.0
cm2/m2). Thirty-one patients (58.5%) had low
SMD (median, 30.8 HU) and 37 patients (69.8%) had low SMI (median,
36.1 cm2/m2). The distribution of the 34
patients (64.1%) who had undergone gastrectomy before starting
chemotherapy was balanced between low and normal groups of both SMD
or SMI. There was no significant difference in RDI between the
patients with low SMD and those with normal SMD (cisplatin, P=0.77;
S-1, P=0.83) or between patients with low SMI and those with normal
SMI (cisplatin, P=0.89; S-1, P=0.86). There was a numerically
higher incidence of grade 3 or higher neutropenia in the patients
with low SMI than in those with normal SMI (35.1 vs. 18.8%,
P=0.22).
| Table IIPatient characteristics. |
Table II
Patient characteristics.
| Variable | SMD (HU)
| P-value | SMI
(cm2/m2)
| P-value |
|---|
| Low (n=31) n (%) | Normal (n=22) n
(%) | Low (n=37) n (%) | Normal (n=16) n
(%) |
|---|
| Age (years) | | | | | | |
| Median | 68 | 60.5 | <0.01 | 66 | 63.5 | 0.71 |
| Range | 44–80 | 33–80 | | 33–80 | 44–80 | |
| Gender | | | | | | |
| Male | 17 (54.8) | 16 (72.7) | 0.90 | 19 (51.1) | 14 (87.5) | 0.01a |
| Female | 14 (45.2) | 6 (27.2) | | 18 (48.6) | 2 (12.5) | |
| PS | | | | | | |
| 0 to 1 | 27 (87.1) | 19 (86.3) | 0.94 | 32 (86.4) | 14 (87.5) | 0.23 |
| 2 | 4 (12.9) | 3 (13.6) | | 5 (13.5) | 2 (12.5) | |
| Gastrectomy | | | | | | |
| Yes | 22 (70.9) | 12 (54.5) | 0.21 | 26 (70.2) | 8 (50.0) | 0.23 |
| No | 9 (29.1) | 10 (45.4) | | 11 (29.7) | 8 (50.0) | |
| Differentiation | | | | | | |
| Well | 10 (32.2) | 4 (18.2) | 0.25 | 11 (29.7) | 3 (18.8) | 0.40 |
| Moderate to
poor | 21 (67.7) | 18 (81.8) | | 26 (70.2) | 13 (81.3) | |
| No. of metastatic
site | | | | | | |
| <2 | 25 (80.6) | 17 (77.3) | 0.77 | 28 (75.7) | 14 (87.5) | 0.33 |
| ≥2 | 6 (19.3) | 5 (22.7) | | 9 (24.3) | 2 (12.5) | |
| Conversion
surgery | | | | | | |
| Yes | 6 (19.3) | 2 (9.1) | 0.30 | 3 (8.1) | 5 (31.5) | 0.03a |
| No | 25 (80.6) | 20 (90.9) | | 34 (91.9) | 11 (68.8) | |
| SMD | | | | | | |
| Median | 30.8 | 44.8 | <0.01a | 36.8 | 37.5 | 0.59 |
| SMI | | | | | | |
| Median | 39.8 | 41.7 | 0.45 | 36.1 | 48.2 | <0.01a |
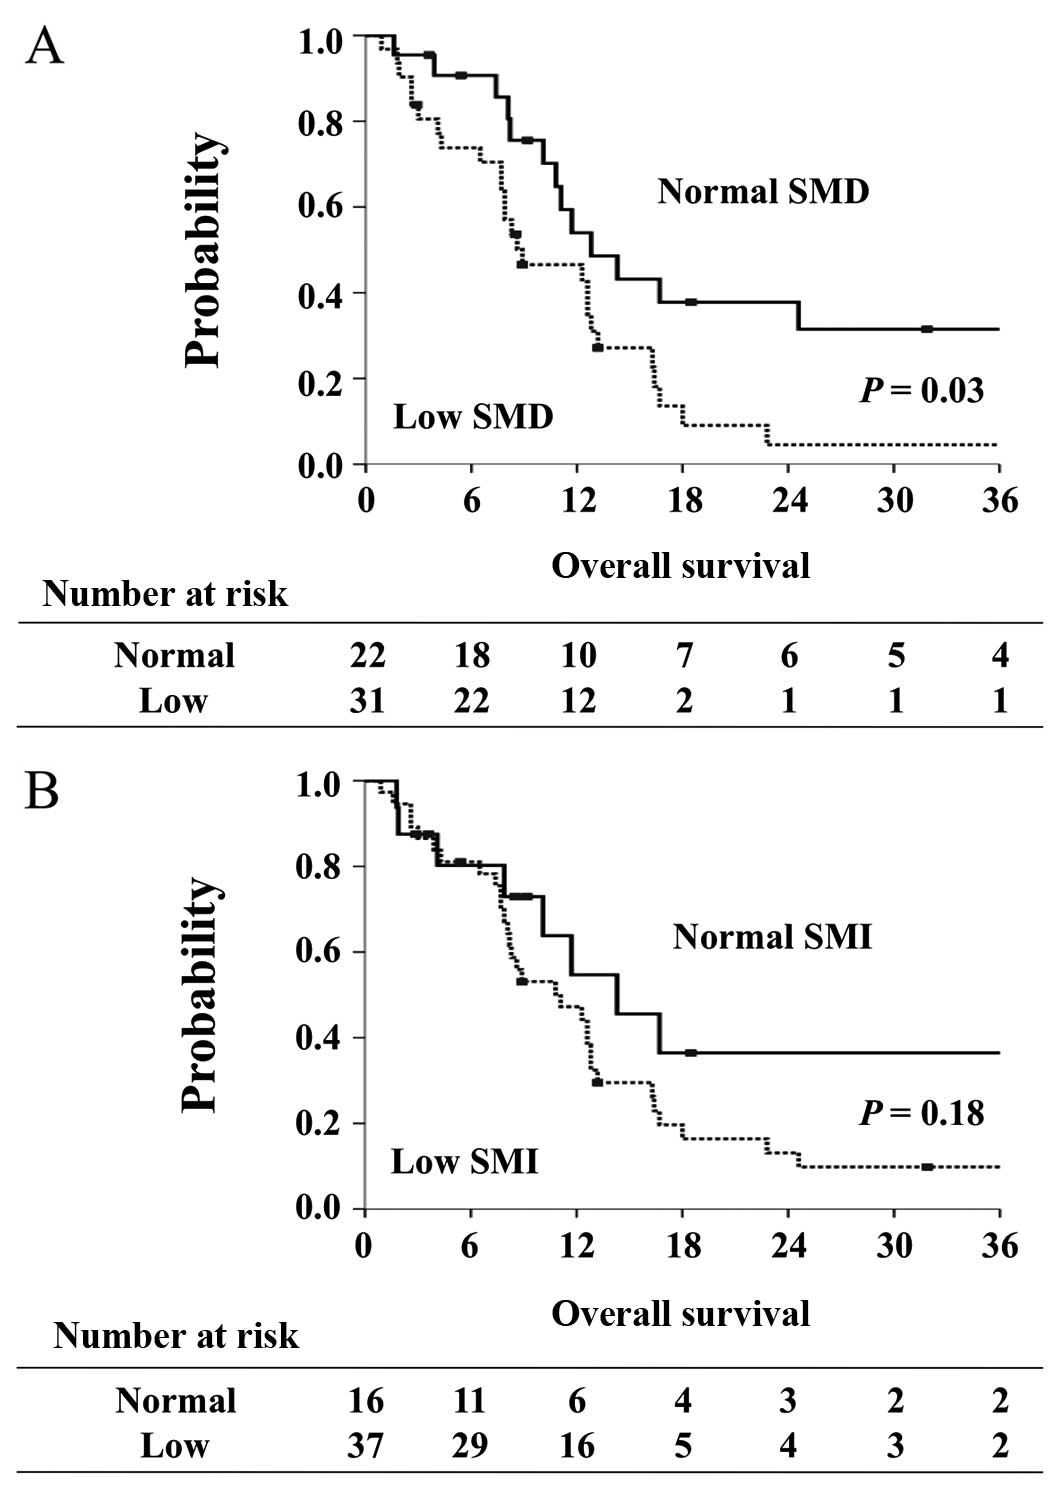
Overall survival
The median OS of the 53 patients was 11.7 months
(95% CI, 8.2 to 13.2 months). Patients with low SMD had
significantly shorter OS (8.9 months; 95% CI, 7.7 to 12.8 months)
compared with patients with normal SMD (12.8 months; 95% CI, 10.1
to 37.0 months, P= 0.03) (Fig. 2A).
On the other hand, median OS was similar between patients with low
SMI and normal SMI (11.1 vs. 14.3 months, P=0.18) (Fig. 2B).
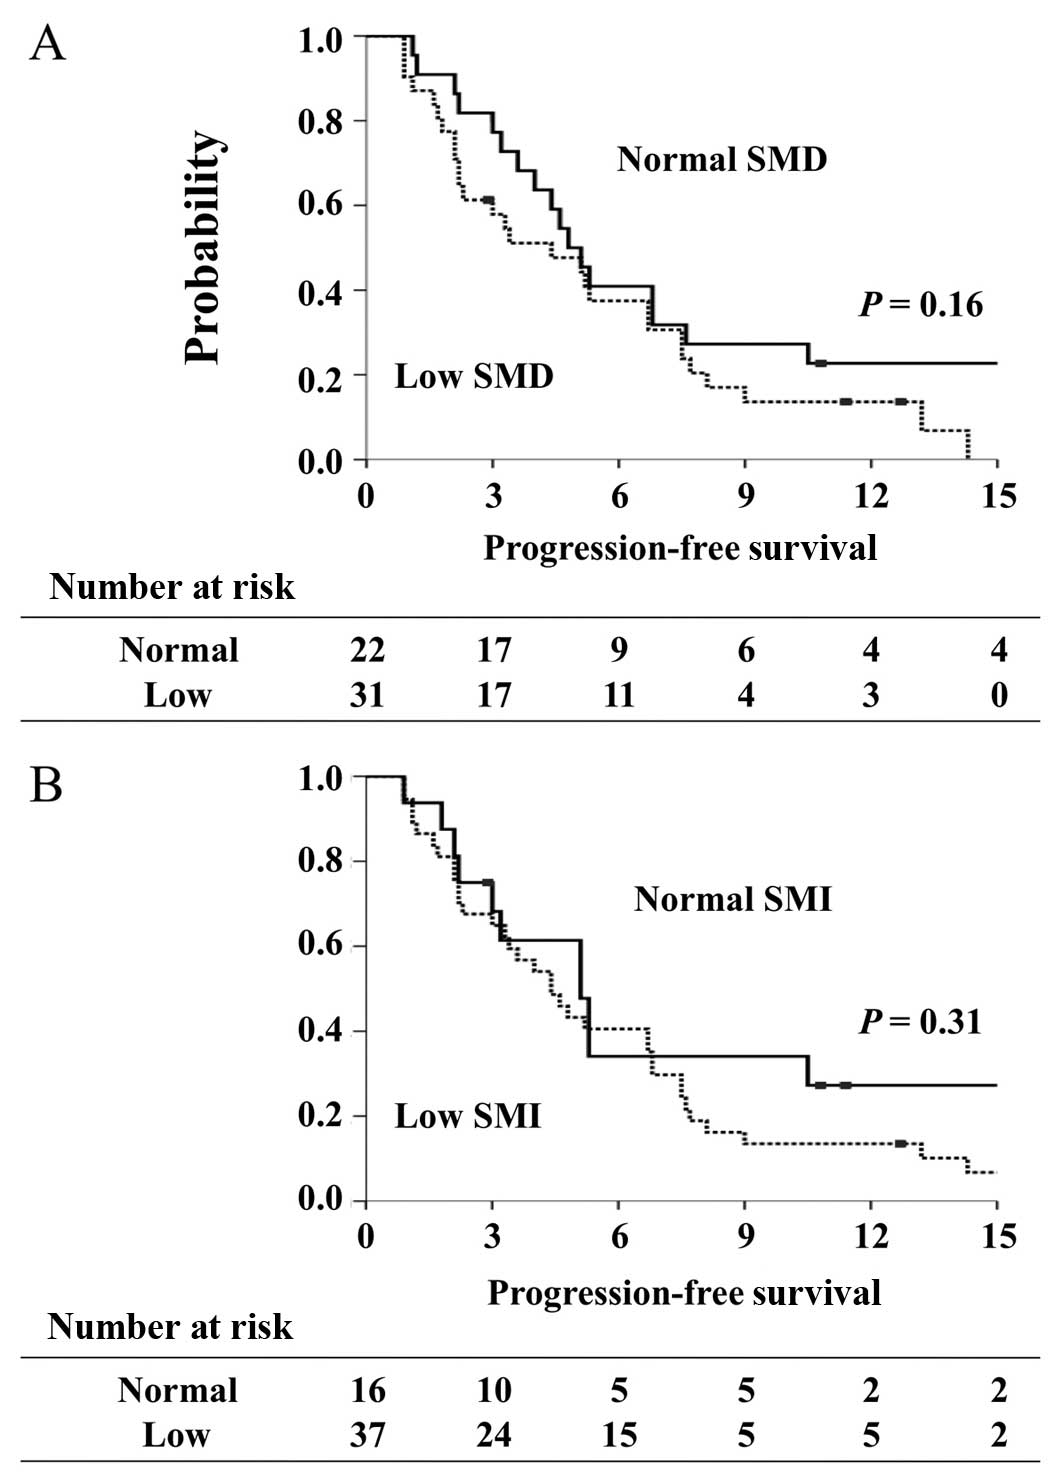
Progression-free survival
The median PFS of the 53 patients was 4.8 months
(95% CI, 3.2 to 6.7 months). Median PFS did not differ
significantly between patients with low SMD and those with normal
SMD (4.4 vs. 4.9 months, P=0.16) or between patients with low SMI
and those with normal SMI (4.4 vs. 5.1 months, P=0.31) (Fig. 3).
Tumor response
Among the 53 patients, 2 patients had a complete
response, 12 had a partial response, and 18 had stable disease. The
response rate was 26.4%, and the disease control rate was 60.4%.
The response rate was similar in patients with low SMD (29.0%) and
those with normal SMD (22.7%). On the other hand, there was a trend
toward a lower response rate in the patients with low SMI (18.9%)
than in those with normal SMI (43.5%, P=0.06).
Multivariate analysis
Multivariate analysis confirmed that low SMD was an
independent predictor of poor outcomes; the hazard ratio (HR) for
death in patients with low SMD versus those with normal SMD was
2.72 (95% CI, 1.32 to 5.82; P<0.01; Table III). The other independent
predictors of poor OS included a PS of 2 (HR, 3.25; 95% CI, 1.21 to
7.88; P=0.02), two or more metastatic sites of disease (HR, 2.48;
95% CI, 1.13 to 5.55; P=0.03), and no response to first-line
therapy (HR, 4.18; 95% CI, 1.65 to 11.6; P<0.01).
| Table IIIMultivariate Cox proportional-hazards
model for survival. |
Table III
Multivariate Cox proportional-hazards
model for survival.
| Variable | HR | 95% CI | P-value |
|---|
| SMD | | | <0.01a |
| Normal | Ref | 0.17–0.76 | |
| Low | 2.72 | 1.32–5.82 | |
| SMI | | | 0.98 |
| Normal | Ref | 0.42–2.57 | |
| Low | 1.01 | 0.39–2.38 | |
| PS | | | 0.02a |
| 0 to 1 | Ref | 0.13–0.83 | |
| 2 | 3.25 | 1.21–7.88 | |
| Age (years) | | | 0.10 |
| ≤65 | Ref | 0.24–1.14 | |
| >65 | 1.91 | 0.87–4.21 | |
| Gender | | | 0.13 |
| Male | Ref | 0.81–4.97 | |
| Female | 0.51 | 0.20–1.23 | |
| No. of metastatic
site | | | 0.03a |
| <2 | Ref | 0.18–0.89 | |
| ≥2 | 2.48 | 1.13–5.55 | |
| Response to
first-line therapy | | | <0.01a |
| Yes | Ref | 0.08–0.60 | |
| No | 4.25 | 1.65–11.6 | |
Discussion
This is the first study to demonstrate that low SMD
is an independent poor prognostic factor in metastatic gastric
cancer patients receiving chemotherapy. Also, in contrast to
reports of other cancers, our study showed that sarcopenia or low
SMI is not associated with prognosis in metastatic gastric cancer.
On the other hand, PFS and tumor response were not associated with
either SMD or SMI in this study. These findings imply that low SMD,
is an important prognostic indicator in patients with gastric
cancer who are considered eligible for systemic chemotherapy, but
is not a predictor of the response to chemotherapy.
The association of SMD, but not SMI, with survival
outcomes in our present study is an intriguing finding. One
plausible explanation for this could be that the increase in lipid
content of muscle occurs before the decline in muscle mass and
therefore, the decrease in SMD is detected earlier than the
decrease in SMI. Also, CT based calculation allows for early
detection of fall in HU (SMD) while the muscle area remains
unchanged; thus decrease in SMD is detected earlier than
corresponding decrease in SMI. Because most of the previous studies
have examined either SMD or SMI only, this discrepancy has not yet
been revealed in those studies. Second, many gastric cancer
patients will have undergone gastrectomy as a part of their
treatment. Gastrectomy, in itself, has been known to decrease
muscle mass (16). Abdiev et
al reported that after gastrectomy the skeletal muscle mass
decreased to around 85% of preoperative level (17). Therefore, the low SMI found among
patients in this study could have partly been an effect of
gastrectomy. These results suggest that SMD would better facilitate
assessment of the risk-benefit ratio of systemic chemotherapy in
metastatic gastric cancer patients compared to SMI.
PFS, tumor response and toxicities were not related
to SMD or SMI in this study. Nevertheless, both tumor response and
toxicities were numerically better in normal SMI group versus low
SMI group.
Some other studies in patients with diseases such as
breast cancer or renal cell carcinoma have also reported that lower
SMI may be linked to severe toxicities, leading to dose reduction
and then to a shorter time to progression (12,13).
The clinical value of skeletal muscle assessment is thus considered
to warrant further investigation in gastric cancer patients.
Our study had several important limitations. It was
retrospective and had a small sample size. In addition, the cut-off
values that we used for SMD and SMI were based on the results of a
study done in a Western population (10), because there is no clear consensus
about the Asian-specific cut-off values of SMD and SMI.
In conclusion, our results demonstrated that low
skeletal muscle density, rather than low skeletal muscle mass, is
independently associated with poor survival in patients who receive
chemotherapy for metastatic gastric cancer.
Acknowledgments
We are grateful to Dr Kenta Murotani, Center for
Advanced Medicine and Clinical Research, Nagoya University
Hospital, for his expert assistance in statistical analyses. This
study was partly supported by JSPS KAKENHI grant number
2646026.
References
|
1
|
Prado CM, Lieffers JR, McCargar LJ, Reiman
T, Sawyer MB, Martin L and Baracos VE: Prevalence and clinical
implications of sarcopenic obesity in patients with solid tumours
of the respiratory and gastrointestinal tracts: A population-based
study. Lancet Oncol. 9:629–635. 2008. View Article : Google Scholar : PubMed/NCBI
|
|
2
|
Peng P, Hyder O, Firoozmand A, Kneuertz P,
Schulick RD, Huang D, Makary M, Hirose K, Edil B, Choti MA, et al:
Impact of sarcopenia on outcomes following resection of pancreatic
adenocarcinoma. J Gastrointest Surg. 16:1478–1486. 2012. View Article : Google Scholar : PubMed/NCBI
|
|
3
|
Harimoto N, Shirabe K, Yamashita YI,
Ikegami T, Yoshizumi T, Soejima Y, Ikeda T, Maehara Y, Nishie A and
Yamanaka T: Sarcopenia as a predictor of prognosis in patients
following hepatectomy for hepatocellular carcinoma. Br J Surg.
100:1523–1530. 2013. View
Article : Google Scholar : PubMed/NCBI
|
|
4
|
van Vledder MG, Levolger S, Ayez N,
Verhoef C, Tran TC and Ijzermans JN: Body composition and outcome
in patients undergoing resection of colorectal liver metastases. Br
J Surg. 99:550–557. 2012. View
Article : Google Scholar : PubMed/NCBI
|
|
5
|
Lanic H, Kraut-Tauzia J, Modzelewski R,
Clatot F, Mareschal S, Picquenot JM, Stamatoullas A, Leprêtre S,
Tilly H and Jardin F: Sarcopenia is an independent prognostic
factor in elderly patients with diffuse large B-cell lymphoma
treated with immunochemotherapy. Leuk Lymphoma. 55:817–823. 2014.
View Article : Google Scholar
|
|
6
|
Tan BH, Birdsell LA, Martin L, Baracos VE
and Fearon KC: Sarcopenia in an overweight or obese patient is an
adverse prognostic factor in pancreatic cancer. Clin Cancer Res.
15:6973–6979. 2009. View Article : Google Scholar : PubMed/NCBI
|
|
7
|
Goodpaster BH, Park SW, Harris TB,
Kritchevsky SB, Nevitt M, Schwartz AV, Simonsick EM, Tylavsky FA,
Visser M and Newman AB: The loss of skeletal muscle strength, mass,
and quality in older adults: The health, aging and body composition
study. J Gerontol A Biol Sci Med Sci. 61:1059–1064. 2006.
View Article : Google Scholar : PubMed/NCBI
|
|
8
|
Goodpaster BH, Kelley DE, Thaete FL, He J
and Ross R: Skeletal muscle attenuation determined by computed
tomography is associated with skeletal muscle lipid content. J Appl
Physiol (1985). 89:104–110. 2000.
|
|
9
|
Delmonico MJ, Harris TB, Visser M, Park
SW, Conroy MB, Velasquez-Mieyer P, Boudreau R, Manini TM, Nevitt M,
Newman AB, et al: Health, Aging, and Body: Longitudinal study of
muscle strength, quality, and adipose tissue infiltration. Am J
Clin Nutr. 90:1579–1585. 2009. View Article : Google Scholar : PubMed/NCBI
|
|
10
|
Martin L, Birdsell L, Macdonald N, Reiman
T, Clandinin MT, McCargar LJ, Murphy R, Ghosh S, Sawyer MB and
Baracos VE: Cancer cachexia in the age of obesity: Skeletal muscle
depletion is a powerful prognostic factor, independent of body mass
index. J Clin Oncol. 31:1539–1547. 2013. View Article : Google Scholar : PubMed/NCBI
|
|
11
|
Antoun S, Lanoy E, Iacovelli R,
Albiges-Sauvin L, Loriot Y, Merad-Taoufik M, Fizazi K, di Palma M,
Baracos VE and Escudier B: Skeletal muscle density predicts
prognosis in patients with metastatic renal cell carcinoma treated
with targeted therapies. Cancer. 119:3377–3384. 2013. View Article : Google Scholar : PubMed/NCBI
|
|
12
|
Prado CM, Baracos VE, McCargar LJ, Reiman
T, Mourtzakis M, Tonkin K, Mackey JR, Koski S, Pituskin E and
Sawyer MB: Sarcopenia as a determinant of chemotherapy toxicity and
time to tumor progression in metastatic breast cancer patients
receiving capecitabine treatment. Clin Cancer Res. 15:2920–2926.
2009. View Article : Google Scholar : PubMed/NCBI
|
|
13
|
Antoun S, Baracos VE, Birdsell L, Escudier
B and Sawyer MB: Low body mass index and sarcopenia associated with
dose-limiting toxicity of sorafenib in patients with renal cell
carcinoma. Ann Oncol. 21:1594–1598. 2010. View Article : Google Scholar : PubMed/NCBI
|
|
14
|
Koizumi W, Narahara H, Hara T, Takagane A,
Akiya T, Takagi M, Miyashita K, Nishizaki T, Kobayashi O, Takiyama
W, et al: S-1 plus cisplatin versus S-1 alone for first-line
treatment of advanced gastric cancer (SPIRITS trial): A phase III
trial. Lancet Oncol. 9:215–221. 2008. View Article : Google Scholar : PubMed/NCBI
|
|
15
|
Mitsiopoulos N, Baumgartner RN, Heymsfield
SB, Lyons W, Gallagher D and Ross R: Cadaver validation of skeletal
muscle measurement by magnetic resonance imaging and computerized
tomography. J Appl Physiol (1985). 85:115–122. 1998.
|
|
16
|
Yamaoka Y, Fujitani K, Tsujinaka T,
Yamamoto K, Hirao M and Sekimoto M: Skeletal muscle loss after
total gastrectomy, exacerbated by adjuvant chemotherapy. Gastric
Cancer. 18:382–389. 2015. View Article : Google Scholar
|
|
17
|
Abdiev S, Kodera Y, Fujiwara M, Koike M,
Nakayama G, Ohashi N, Tanaka C, Sakamoto J and Nakao A: Nutritional
recovery after open and laparoscopic gastrectomies. Gastric Cancer.
14:144–149. 2011. View Article : Google Scholar : PubMed/NCBI
|