Introduction
According to an analysis of over 3,000 cases of
primary head and neck tumours in Germany in 2009, the patient
benefit has not significantly improved from 1995 to 2006, despite
new treatment strategies. Particularly, the 5-year overall survival
rate for carcinomas of hypopharyngeal origin is very low with 27.2%
(1). Hypopharyngeal cancer is often
detected in later stages, since early signs and symptoms rarely
occur. Late stages frequently involve multiple node affection,
leading to poor prognosis (http://emedicine.medscape.com/article/1375268).
In vivo cells in a tissue context interact
with neighbouring cells and extracellular matrix components.
However, in 2-dimensional (2D) monolayer cultures cells tend to
loose tissue-specific properties (2). 2D culture models therefore seem
unsuitable to mimic the behaviour of cells in a natural,
3-dimensional (3D) microenvironment, particularly for testing of
growth or invasion inhibiting substances, just as proposed in 1988
(3). In many aspects spheroids
resemble the solid, nonvascularized tumour tissue and spheroidal
cells show higher morphological and functional differentiation than
monolayer cells. Upon proliferation of cells inside spheroids a
tumourlike microenvironment develops with a hypoxic/necrotic core
(reviewed in ref. 4), surrounded by
quiescent and proliferating zones. Cells inside spheroids secrete
extracellular matrix and functional cell junctions arise between
cells, providing an advanced model system for examination of growth
and invasion of carcinomas (4).
In the present study we compared the morphology and
size of 12 HNSCC cell lines with the expression of the
proliferation marker Ki67 and the cell-cell adhesion marker
E-cadherin. Furthermore, the larynx carcinoma cell line HLaC78 was
used as a model for comparing overall gene expression in 2D
monolayer cultures with 72 h old HLaC78 multicellular spheroids.
The results provide evidence for extensive restructuring of gene
expression in the 3D context.
Materials and methods
Cell lines and cell culture
The cell lines used for spheroid analysis are listed
in Table I. The cell lines were
kept in RPMI-1640, 10% FCS and standard antibiotics, except Hep2
(MEM), Hep2-Tax (MEM+20 μM paclitaxel), SCC4 [Dulbecco's
modified Eagle's medium (DMEM/F12)] and HNO 210 (DMEM).
 | Table IHNSCC cell lines used in the present
study. |
Table I
HNSCC cell lines used in the present
study.
| Cell line | Origin |
|---|
| FADU | Hypopharynx
carcinoma, LGC standards (Wesel, Germany) |
| HLaC78 | Larynx carcinoma
(5) |
| Hep-2 | Larynx
carcinomaa, LGC standards (Wesel,
Germany) |
| Hep-2-Tax | Larynx carcinoma,
paclitaxel-resistant clone |
| HLaC79 | Larynx carcinoma
(5) |
| HLaC79-Tax | Larynx carcinoma,
paclitaxel-resistant clone |
| HPaC79 | Parotis carcinoma
(6) |
| HSmC78 | Submandibular gland
(5) |
| Cal27 | Tongue, LGC standards
(Wesel, Germany) |
| PE/CA-PJ41 | Tongue, Sigma-Aldrich
(Taufkirchen, Germany) (7) |
| SCC4 | Tongue, LGC standards
(Wesel, Germany) |
| HNO210 | Larynx carcinoma, CLS
(Eppelheim, Germany) |
Spheroid formation
Tumour spheroids were generated by seeding 5,000
cells/well of Hep2 and Hep2-Tax cells in ultra-low attachment (ULA)
96-well round-bottomed plates (Corning, Amsterdam, The Netherlands)
(8) or alternatively in ULA T75
flasks. Images were captured after 72 h with a Leica DMI 4000
inverted fluorescence microscope (Leica Microsystems, Wetzlar,
Germany).
Expression micro array
RNA extraction and RNA quality
control
RNA of HLaC78 monolayer and spheroidal cell cultures
was isolated with the RNeasy kit (Qiagen, Hilden, Germany)
according to the manufacturer's instructions. RNA quality was
assessed with the RNA 6000 Nano kit using the Bioanalyzer 2100
instrument (Agilent, Böblingen, Germany). RNA integrity numbers
(RINs) of our samples ranged between 9.4 and 9.9.
Microarray analysis
For microarray hybridization, 100 ng total RNA were
amplified and labelled using the IVT Express kit and hybridized to
GeneChip PrimeView Human Gene Expression arrays (both from
Affymetrix, Santa Clara, CA, USA) according to the manufacturer's
instructions.
Raw microarray data was background corrected,
normalized and summarized to probe set expression values using the
robust microarray average (RMA) [algorithm (9,10)].
Data preprocessing and calculation of log2 fold-changes
between spheroid and monolayer expression values was performed in
the R environment (http://www.r-project.org) using the Bioconductor
(http://www.bioconductor.org) package
ʻaffyʼ. Pathway enrichment analyses were performed with gene set
enrichment analysis (GSEA) (11).
Microarray data were deposited in MIAME-compliant form at Gene
Expression Omnibus (http://www.ncbi.nlm.nih.gov/geo) with the identifier
GSE67495.
Real-time PCR
Gene expression rates were determined by real-time
TaqMan® PCR (Applied Biosystems, Foster City, CA, USA).
RNA was isolated from cell lines and primary cells with the RNeasy
kit according to the manufacturer's instructions. The High Capacity
RNA-to-cDNA Master Mix (Applied Biosystems, Darmstadt, Germany) was
used for cDNA reverse transcription. Real-time PCR was performed in
triplicates on a Real-time PCR cycler (Applied Biosytems,
Darmstadt, Germany) using the TaqMan® gene expression
assays for E-cadherin (CDH1), N-cadherin (CDH2), Ki67 (MKI), gap
junction protein β6 (GJB6), aldo-keto reductase family 1 member C1
(AKR1C1), cytochrome P450 1B1 (CYP1b1), flap endonuclease 1 (FEN1),
mutL homolog 1 (MLH1), [replication factor C (activator 1) 3
(RFC3)], and epidermal growth factor receptor 1 (EGFR1).
Relative quantification was calculated according to
the 2−ΔΔCt method (12).
Expression values were normalized to the expression of GAPDH
as an endogenous control which proved to be expressed most stably
throughout the cell lines.
Scanning electron microscopy
For examination of morphology of HLaC78 spheroidal
surface SEM was performed. Spheroids were fixed overnight at 4°C
with 2% glutaraldehyde in 0.1 M phosphate-buffer. Subsequently,
spheroids were treated with 2% osmiumtetroxide in 0.1 M
phosphate-saccharose. After dehydration in graded ethanol series
(35–100%), specimens were dried using a critical point dryer.
Spheroids were then coated with carbon, sputtered with gold
palladium particles and viewed with an SEM (DSM 962; Zeiss,
Oberkochen, Germany).
Statistical analysis
All statistical analyses and graphs were performed
with GraphPad Prism 4 (GraphPad Software, Inc., La Jolla, CA,
USA).
Results
Morphology of spheroids and expression of
crucial genes
Cells (5,000) of each cell line (Table I) were seeded into 96 ULA U-bottom
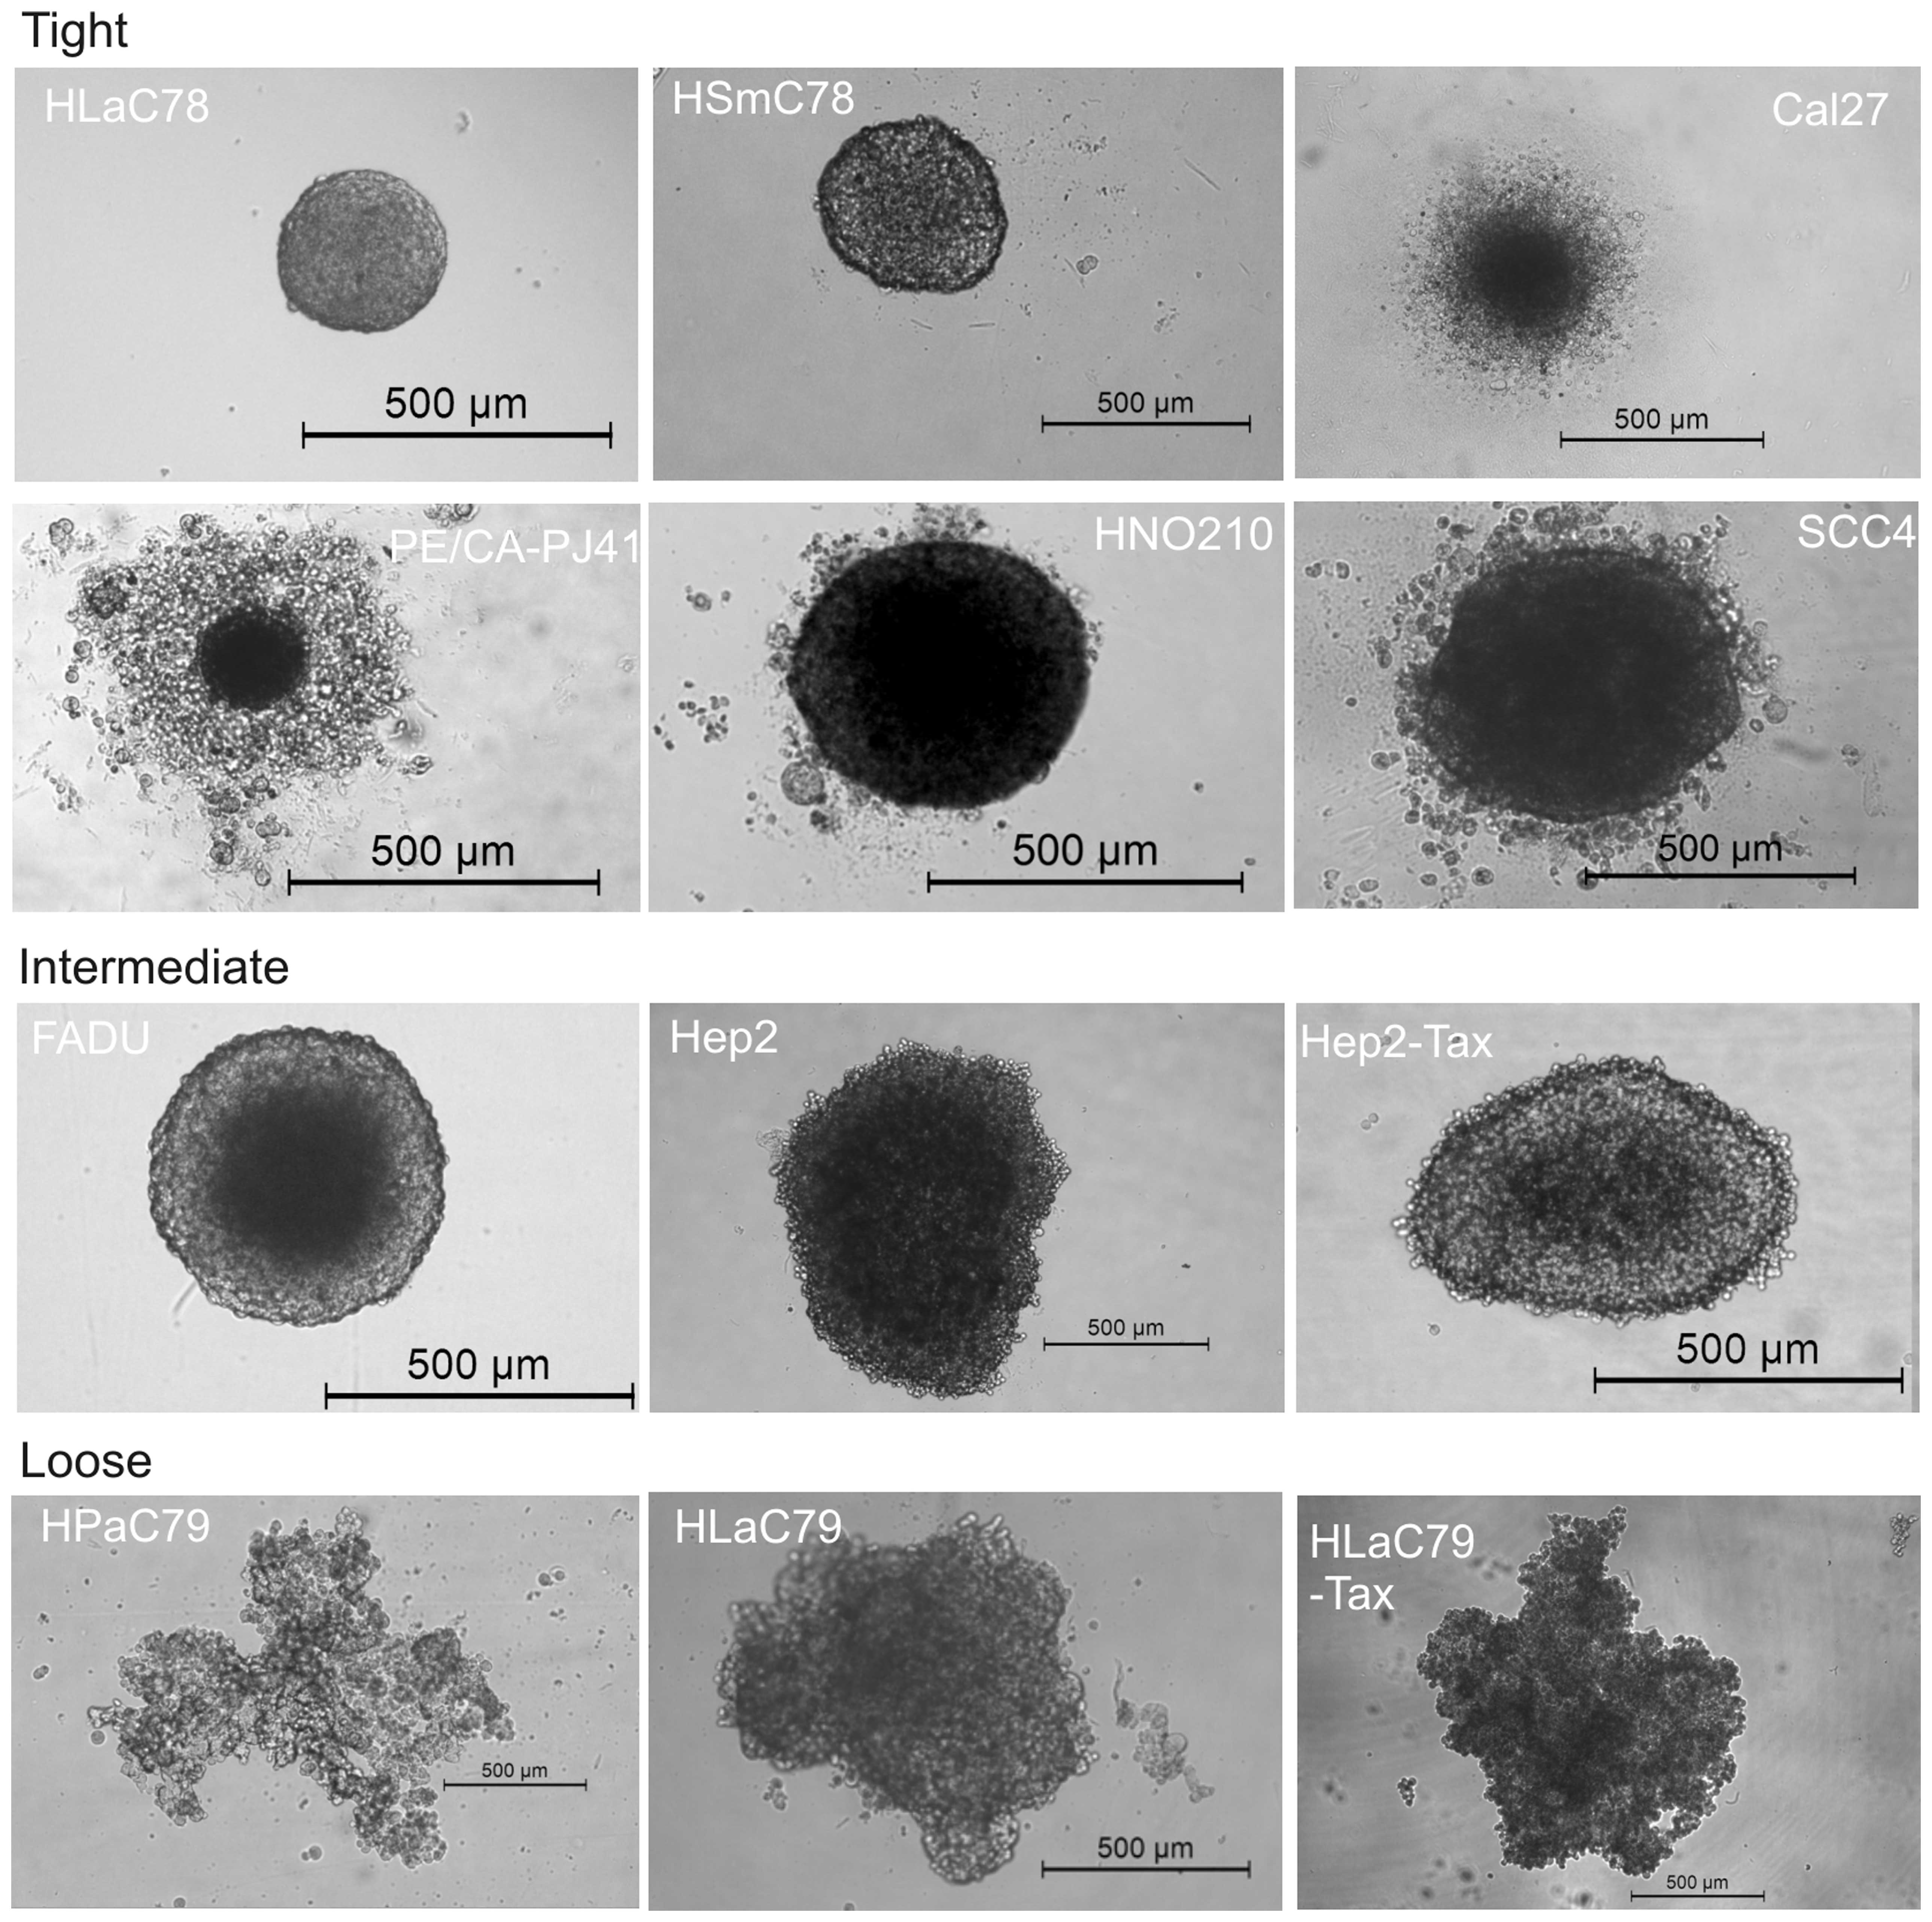
well plates. Fig. 1 shows 72 h old
spheroids originating from 5,000 cells of each cell line.
Fig. 1 demonstrates
the morphological differences between spheroids of different
monolayer origin. While HLaC78 and HSmC78 form small and very
tight, nearly indestructible spheroids (even by harsh pipetting
upon trypsin incubation), FADU, HNO210 and SCC-4 spheroids are
larger in diameter, but also round shaped. Cal27 and PE/CA-PJ41 are
typically surrounded by a halo of dead/nonaggregated cells. HPaC79,
Hep2/Hep2-Tax and HLaC79/HLaC79-Tax cell lines rather aggregate
into loose clusters. Spheroid size ranges from ~250 μm for
tight, compact spheroids (HLaC78 and HsmC78) till diameters >1
mm (HPaC79).
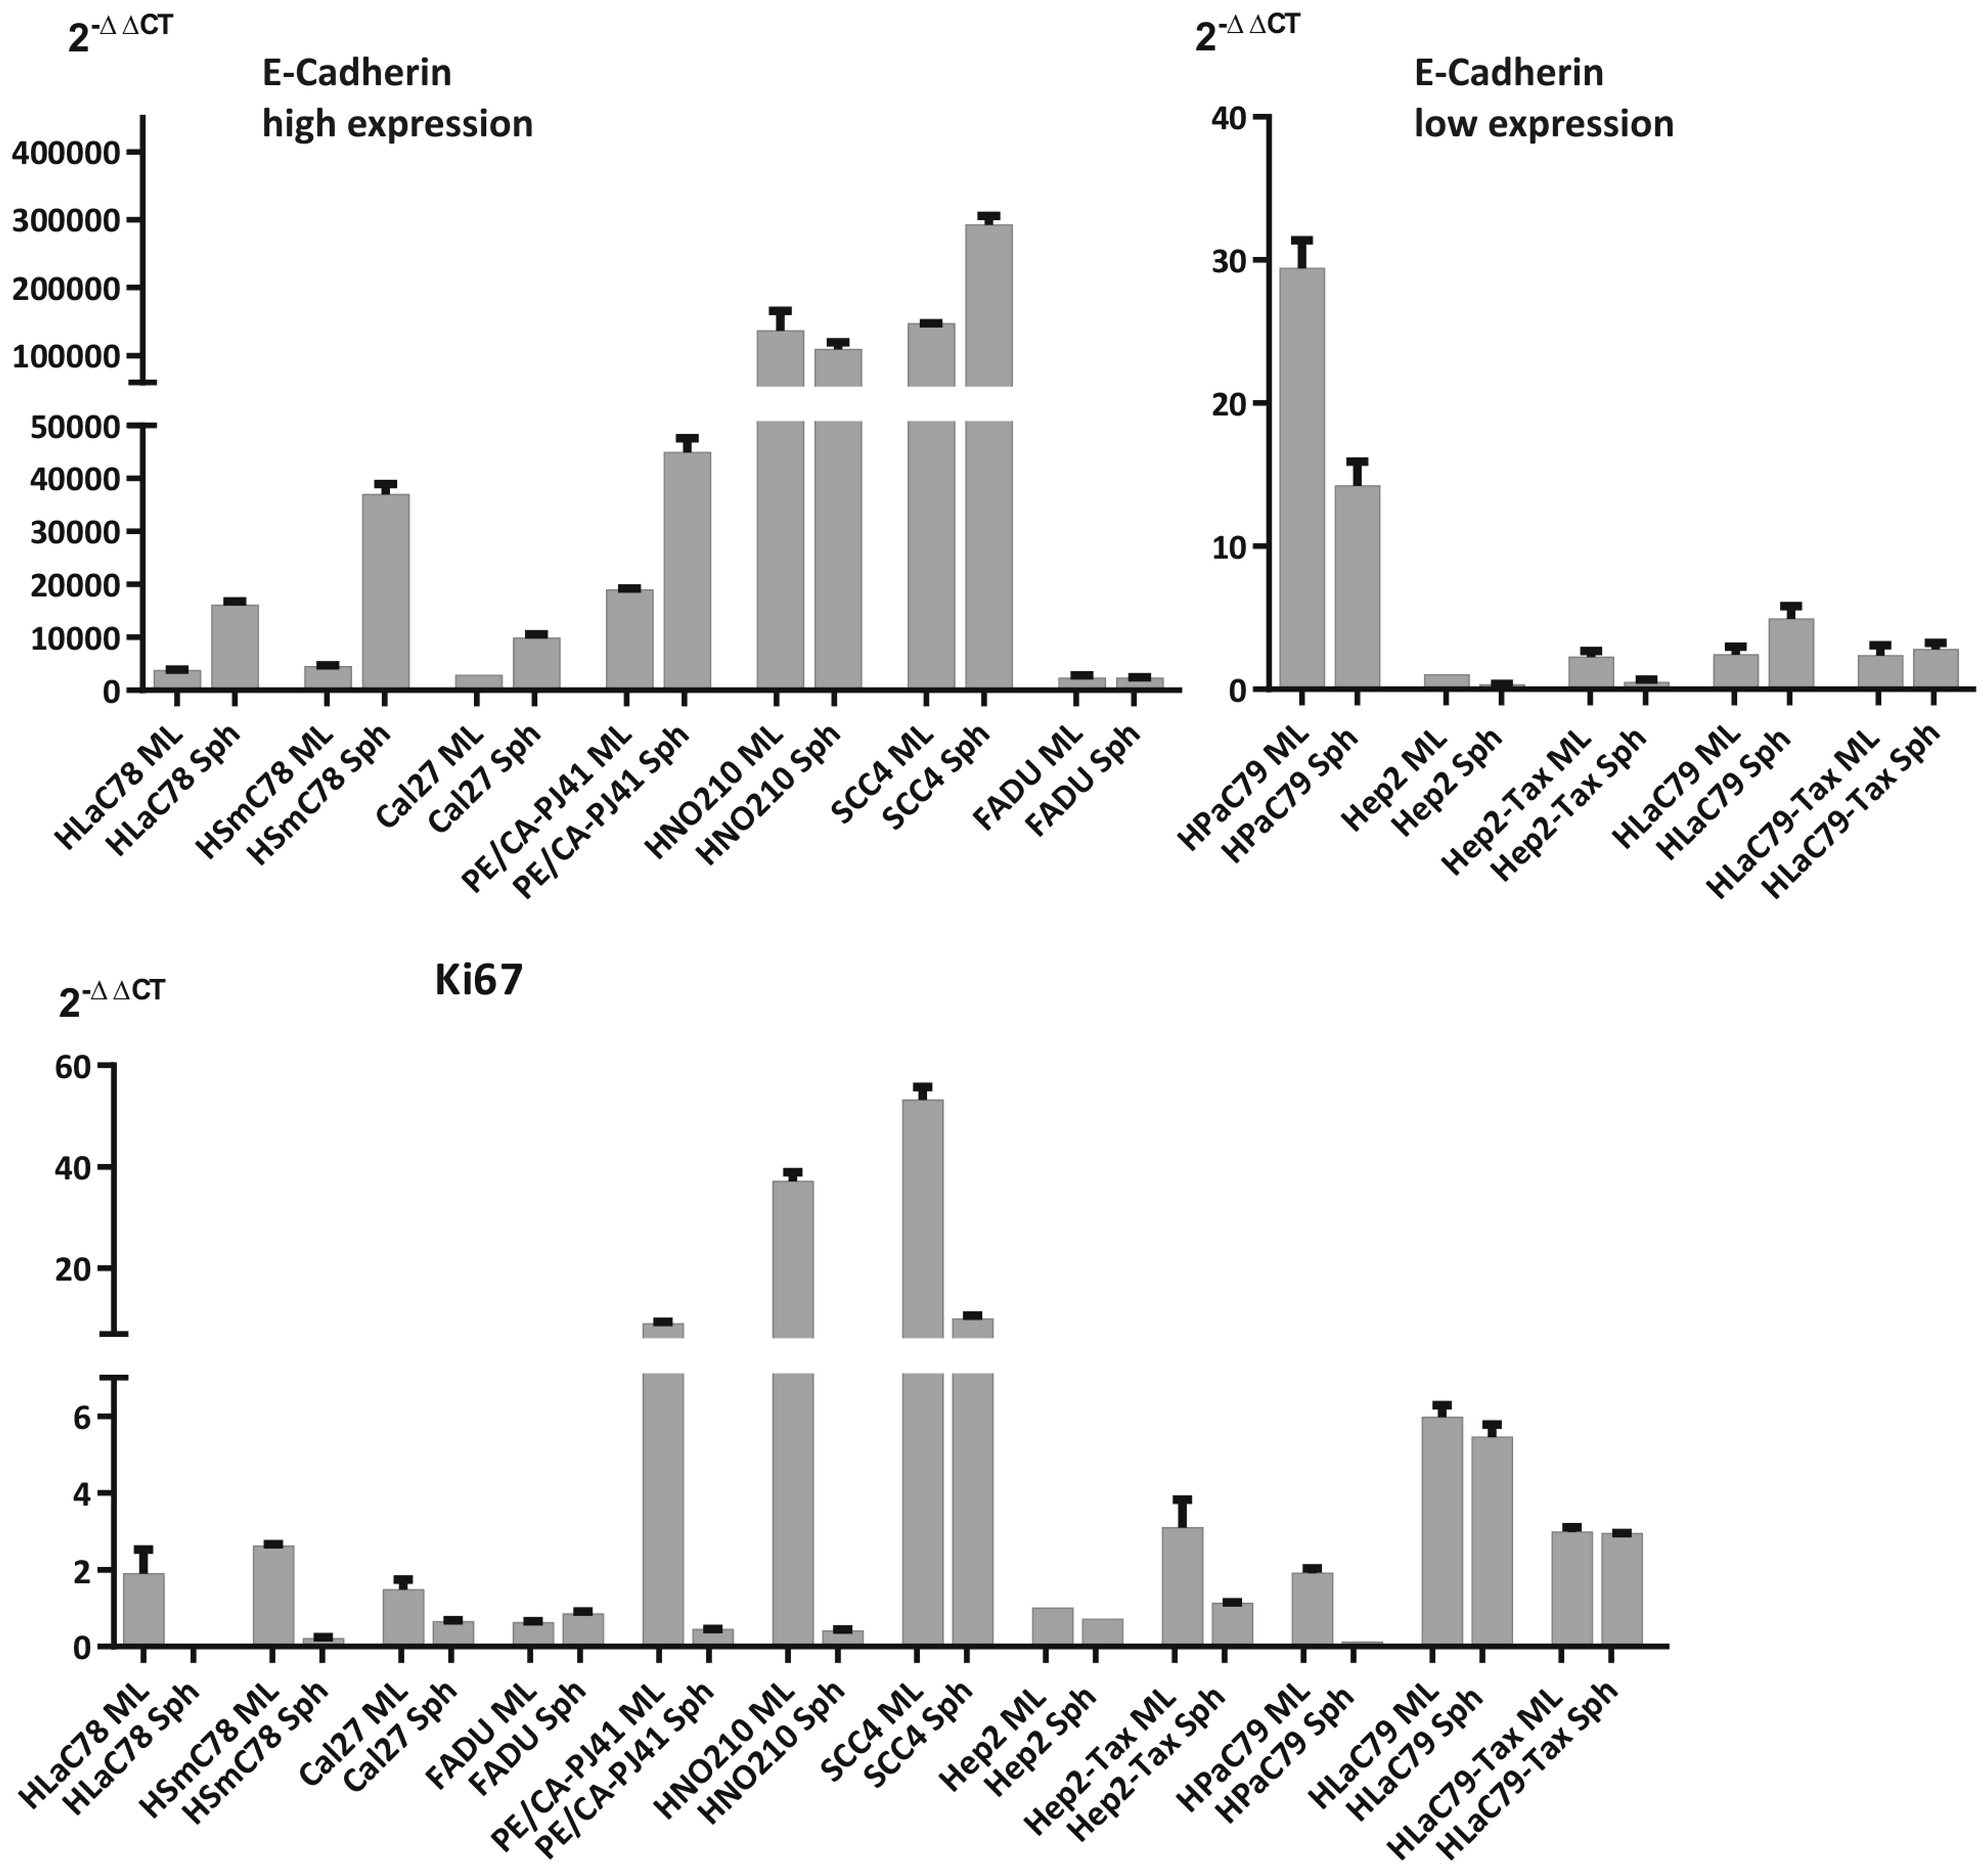
In general spheroid sizes are both determined by
tightness of cell-cell contacts and proliferation rates of the cell
lines within the aggregates. Tightness of the spheroids and the
proliferation rates within were measured by qRT-PCR expression
analysis of E-cadherin (as a marker for adhesion) and Ki67 (as a
proliferation marker; Fig. 2) and
opposed to expression of these markers in monolayers.
It is noticeable, that tight spheroids show either
strong upregulation of E-cadherin upon aggregation (as HLaC78,
zHSmC78 Cal27 or Pe/CA-PJ41). or a basic high E-cadherin expression
in monolayer cultures with moderate increase/decrease (HNO210 and
SSC4) following spheroid formation. Cell lines, agglomerating into
intermediate or loose spheroids featured a basically low E-cadherin
expression, increasing only weakly or decreasing upon loss of
attachment to 2D surfaces (Fig. 2).
Proliferation decreased in all cell lines except FADU, most
markedly in cell lines forming tight spheroids. Since usually
E-cadherin expression causes a decrease in proliferation (13) it is noticeable that the cell lines
HPaC79, Hep2 and Hep2-Tax on the one hand decreased E-cadherin
expression upon spheroid formation (log fold-changes HPaC79 −1.06,
Hep2 −1.62, Hep2-Tax −2.20 and on the other hand also proliferation
diminished (log fold-changes Ki67: HPaC79 −4.02, Hep2 −0.48 and
Hep2-Tax −1.44; see Table IV).
Wang et al (14) described
an enhancement of proliferation by downregulation of E-cadherin in
HNSCC monolayer cell lines. The enhanced proliferation was mediated
by upregulation of EGFR. To check this in the cell lines HPaC79,
Hep2 and Hep2-Tax we performed qRT-PCR for EGFR. In these cell
lines E-cadherin was downregulated along with EGFR in Hep2 (EGFR
log fold-change −0.90) and Hep2-Tax (EGFR log fold-change 1.35)
following aggregation. HPaC79 did not express EGFR in monolayer or
in the spheroid culture.
| Table IVLog fold-changes in gene expression
of selected genes in spheroids vs. monolayer cultures of HNSCC cell
lines. |
Table IV
Log fold-changes in gene expression
of selected genes in spheroids vs. monolayer cultures of HNSCC cell
lines.
| GJB6 | CDH1 | AKR1C1 | CYP1A1 | CYP1B1 | MKI | FEN1 | MLH1 | RCF3 |
|---|
| Tight
spheroids |
| HLaC78 | 3.06 | 2.17 | 4.64 | 2.83 | 1.86 | −5.55 | −1.42 | −0.37 | −3.30 |
| HSmC78 | 5.93 | 3.04 | 6.58 | 5.02 | 5.23 | −3.71 | 0.73 | 0.81 | −0.95 |
| Cal27 | 5.05 | 1.81 | 4.04 | 4.69 | 2.55 | −1.17 | −0.22 | 1.34 | −0.61 |
|
PE/CA-PJ41 | 0.49 | 1.35 | 2.76 | 6.78 | 4.88 | −4.35 | 1.51 | −0.04 | −0.65 |
| HNO210 | 5.75 | −0.44 | 5.99 | 1.49 | 0.12 | −6.48 | 3.31 | 0.40 | −2.65 |
| SCC4 | 0.59 | 0.79 | 0.15 | 5.71 | 0.75 | −2.41 | −0.92 | 0.91 | −7.64 |
| Loose/intermediate
aggregates |
| FADU | −0.68 | 0.06 | 0.04 | 0.45 | 0.79 | 0.43 | −0.38 | −0.52 | −0.22 |
| Hep2 | −2.52 | −1.62 | −0.77 | 1.21 | −2.21 | −0.48 | −1.85 | −0.68 | −1.57 |
|
Hep2-Tax | −2.23 | −2.20 | 2.36 | 1.26 | 0.07 | −1.44 | −1.71 | −3.17 | −0.65 |
| HPaC79 | −1.16 | −1.06 | −1.27 | −1.47 | −3.89 | −4.02 | −1.56 | −1.40 | −5.58 |
| HLaC79 | −0.29 | 1.04 | 0.90 | 0.11 | 0.15 | −0.13 | −0.34 | −1.09 | −0.55 |
|
HLaC79-Tax | −5.22 | −3.24 | −7.64 | −2.55 | −0.99 | −0.01 | −5.95 | −0.28 | −0.68 |
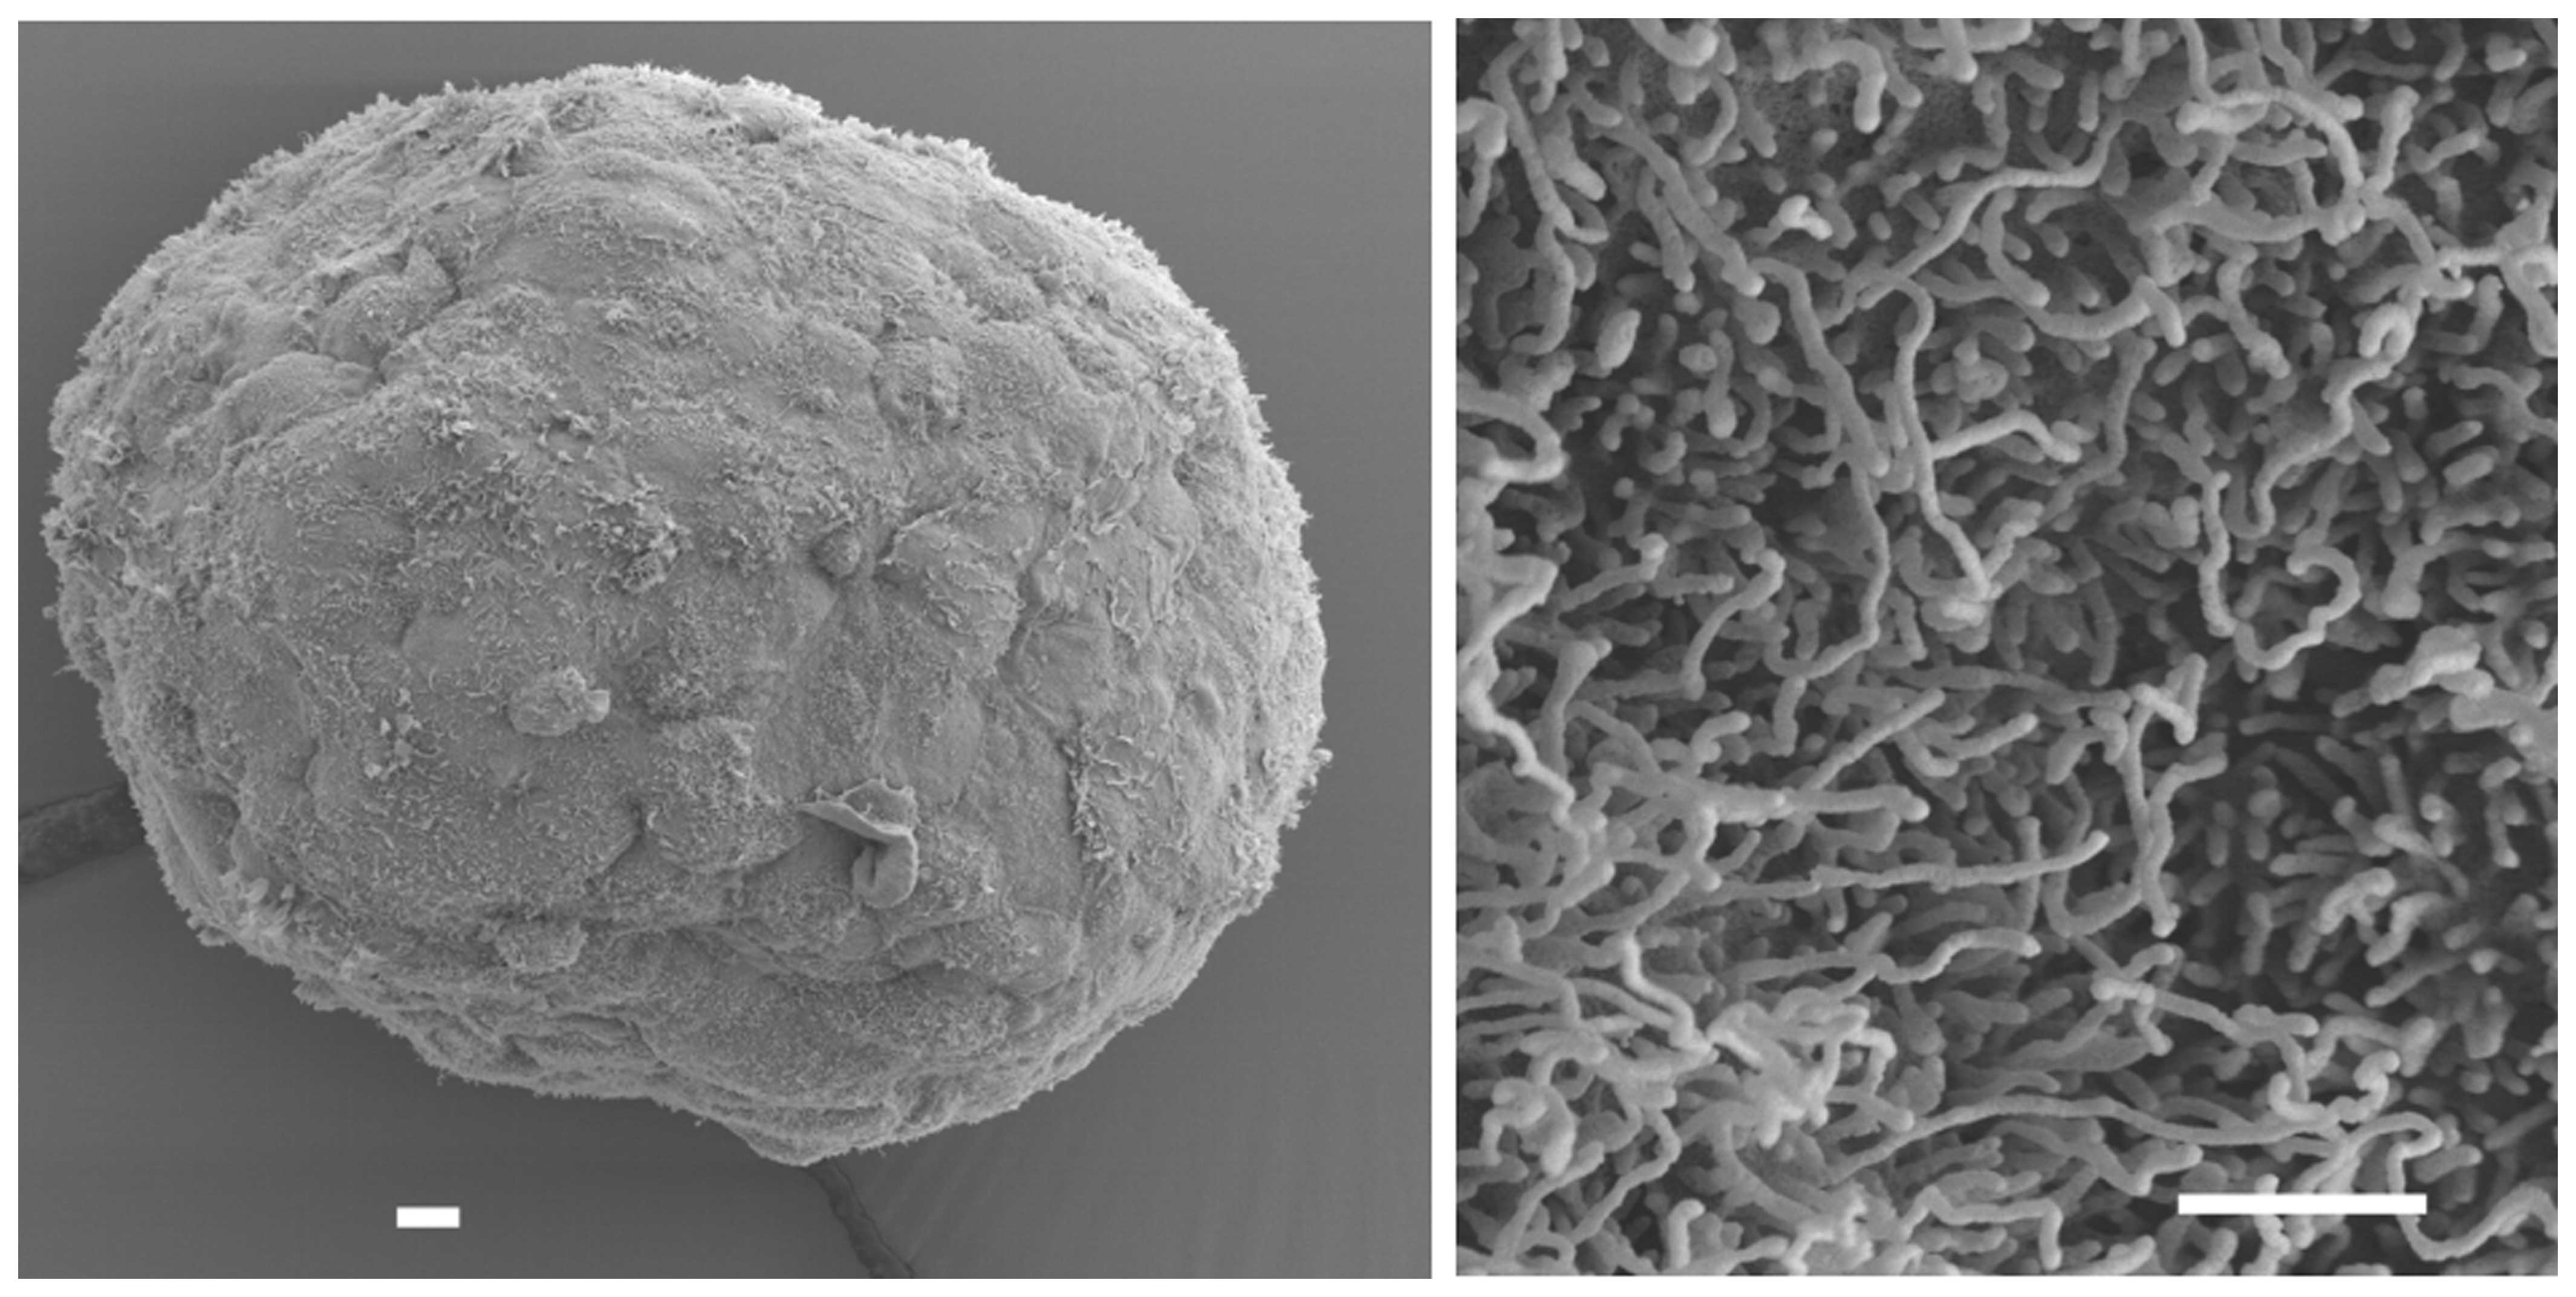
Gene expression
Microarray analysis was used to create a gene
expression array profile of head and neck cancer cell line growing
as monolayer and in a 3D context. We selected the HLaC78 cell line
due to its spontaneous aggregation into tight, well-shaped
spheroids with a smooth, tissue-like surface with apical microvilli
protrusions typical for epithelia (Fig.
3). A global upregulation of gene expression in HLaC78 larynx
carcinoma cells line growing in a tissue-like 3D structure was
primarily related to cell adhesion, cell junctions and cytochrome
P450-mediated metabolism of xenobiotics. Expression downregulation
could be predominantly associated with cell cycle, DNA replication
and DNA mismatch repair.
A summary of selected differentially expressed probe
sets is shown in Table II,
subdivided into functional groups.
| Table IILog fold-changes in gene expression in
spheroids vs. monolayer cultures of HLaC78 cell line. |
Table II
Log fold-changes in gene expression in
spheroids vs. monolayer cultures of HLaC78 cell line.
| Gene symbol | Gene | logFC |
|---|
| Cell junctions |
| GJB6 | Gap junction protein,
β6, 30 kDa | 4,588 |
| CDH2 | Cadherin 2, type 1,
N-cadherin (neuronal) | −3,963 |
| GJB2 | Gap junction protein,
β2, 26 kDa | 3,547 |
| CLDN10 | Claudin 10 | 3,364 |
| DSC2 | Desmocollin 2 | 3,254 |
| DSG3 | Desmoglein 3 | 2,727 |
| NOTCH3 | Notch 3 | 2,723 |
| GJA1 | Gap junction protein,
α1, 43 kDa | 2,488 |
| DSC3 | Desmocollin 3 | 2,238 |
| CLDN7 | Claudin 7 | 2,222 |
| NOTCH1 | Notch 1 | 1,991 |
| F11R | F11 receptor | 1,887 |
| CLDN8 | Claudin 8 | 1,878 |
| CAV1 | Caveolin 1, caveolae
protein, 22 kDa | −1,730 |
| JUP | Junction
plakoglobin | 1,657 |
| CDH1 | Cadherin 1, type 1,
E-cadherin (epithelial) | 1,589 |
| ITGB1 | Integrin, β1
(fibronectin receptor) | −1,195 |
| DSP | Desmoplakin | 1,181 |
| ITGB6 | Integrin, β6 | 1,099 |
| GJB5 | Gap junction protein,
β5, 31.1 kDa | 1,041 |
| Cell adhesion |
| HLA-DRA | Major
histocompatibility complex, class II, DRα | 7,514 |
| HLA-DRB1 | Major
histocompatibility complex, class II, DRβ1 | 4,842 |
| HLA-DMA | Major
histocompatibility complex, class II, DMα | 4,692 |
| HLA-DPA1 | Major
histocompatibility complex, class II, DPα1 | 4,391 |
| HLA-F | Major
histocompatibility complex, class I, F | 4,050 |
| HLA-DMB | Major
histocompatibility complex, class II, Dβ | 3,924 |
| HLA-DRB5 | Major
histocompatibility complex, class II, DRβ5 | 3,864 |
|
HLA-DPB1 | Major
histocompatibility complex, class II, DPβ1 | 3,464 |
| CLDN10 | Claudin 10 | 3,364 |
| HLA-B | Major
histocompatibility complex, class I, B | 2,965 |
| HLA-C | Major
histocompatibility complex, class I, C | 2,618 |
|
HLA-DQB1 | Major
histocompatibility complex, class II, DQβ1 | 2,477 |
| HLA-E | Major
histocompatibility complex, class I, E | 2,468 |
| CLDN7 | Claudin 7 | 2,222 |
| PTPRM | Protein tyrosine
phosphatase, receptor type, M | 2,192 |
| CD58 | CD58 molecule | 2,076 |
| HLA-A | Major
histocompatibility complex, class I, A | 2,058 |
| PVRL1 | Poliovirus
receptor-related 1 (herpesvirus entry mediator C) | 2,016 |
| F11R | F11 receptor | 1,887 |
| CLDN8 | Claudin 8 | 1,878 |
| CDH1 | Cadherin 1, type 1,
E-cadherin (epithelial) | 1,589 |
| CDH3 | Cadherin 3, type 1,
P-cadherin (placental) | 1,566 |
| NEO1 | Neogenin 1 | 1,518 |
| CD86 | CD86 molecule | 1,424 |
| ITGB8 | Integrin, β8 | 1,370 |
| GLG1 | Golgi glycoprotein
1 | 1,368 |
| CNTN1 | Contactin 1 | 1,366 |
| CD40 | CD40 molecule, TNF
receptor superfamily member 5 | 1,359 |
| SDC1 | Syndecan 1 | 1,340 |
| SDC2 | Syndecan 2 | 1,265 |
| PTPRF | Protein tyrosine
phosphatase, receptor type, F | 1,159 |
| CD276 | CD276 molecule | 1,100 |
| Cytochrome P450
metabolism |
| AKR1C1 | Aldo-keto reductase
family 1, member C1 | 3,798 |
| AKR1C3 | Aldo-keto reductase
family 1, member C3 | 3,364 |
| CYP1B1 | Cytochrome P450,
family 1, subfamily B, polypeptide 1 | 2,837 |
| CYP1A1 | Cytochrome P450,
family 1, subfamily A, polypeptide 1 | 2,327 |
| GSTA4 | Glutathione
S-transferase α4 | 2,299 |
| ALDH3B2 | Aldehyde
dehydrogenase 3 family, member B2 | 2,039 |
| MGST2 | Microsomal
glutathione S-transferase 2 | 1,196 |
| GSTK1 | Glutathione
S-transferase κ1 | 1,131 |
| GSTZ1 | Glutathione
S-transferase ζ1 | 1,112 |
| Cell cycle |
| CDKN3 | Cyclin-dependent
kinase inhibitor 3 | −5,795 |
| CDK1 | Cyclin-dependent
kinase 1 | −5,556 |
| BIRC5 | Baculoviral IAP
repeat containing 5 | −5,257 |
| CCNA2 | Cyclin A2 | −5,205 |
| CDC20 | Cell division cycle
20 homolog (S. cerevisiae) | −5,19 |
| CDC6 | Cell division cycle
6 homolog (S. cerevisiae) | −5,104 |
| MAD2L1 | MAD2 mitotic arrest
deficient-like 1 (yeast) | −4,665 |
| CCNB1 | Cyclin B1 | −4,573 |
| CDC25A | Cell division cycle
25 homolog A (S. pombe) | −4,500 |
| AURKB | Aurora kinase
B | −4,439 |
| CCNB2 | Cyclin B2 | −4,387 |
| MKI67 | Antigen identified
by monoclonal antibody Ki67 | −4,028 |
| BRCA1 | Breast cancer 1,
early onset | −3,798 |
| RAD51 | RAD51 homolog
(S. cerevisiae) | −3,543 |
| KNTC1 | Kinetochore
associated 1 | −3,023 |
| MCM3 | Minichromosome
maintenance complex component 3 | −2,973 |
| CKS2 | CDC28 protein
kinase regulatory subunit 2 | −2,919 |
| STMN1 | Stathmin 1 | −2,783 |
| AURKA | Aurora kinase
A | −2,778 |
| GTSE1 | G-2 and S-phase
expressed 1 | −2,719 |
| CHEK1 | Checkpoint kinase
1 | −2,687 |
| CKS1B | CDC28 protein
kinase regulatory subunit 1B | −2,636 |
| CCND2 | Cyclin D2 | −2,488 |
| TFDP1 | Transcription
factor Dp-1 | −2,242 |
| BCCIP | BRCA2 and CDKN1A
interacting protein | −2,239 |
| TFDP1 | Transcription
factor Dp-1 | −2,219 |
| BRCA2 | Breast cancer 2,
early onset | −2,147 |
| CDKN1A | Cyclin-dependent
kinase inhibitor 1A (p21, Cip1) | 2,116 |
| CCNF | Cyclin F | −2,103 |
| CDK2 | Cyclin-dependent
kinase 2 | −1,949 |
| RBL1 | Retinoblastoma-like
1 (p107) | −1,905 |
| SKP2 | S-phase
kinase-associated protein 2, E3 ubiquitin protein ligase | −1,580 |
| MDM2 | Mdm2, p53 E3
ubiquitin protein ligase homolog (mouse) | 1,454 |
| RAD1 | RAD1 homolog (S.
pombe) | −1,416 |
| CCNE1 | Cyclin E1 | −1,379 |
| CCNC | Cyclin C | −1,336 |
| MAD2L2 | MAD2 mitotic arrest
deficient-like 2 (yeast) | −1,263 |
| NBN | Nibrin | −1,249 |
| CDK4 | Cyclin-dependent
kinase 4 | −1,245 |
| RB1 | Retinoblastoma
1 | −1,219 |
| MCM4 | Minichromosome
maintenance complex component 4 | −1,203 |
| STMN1 | Stathmin 1 | −1,193 |
| CDK5R1 | Cyclin-dependent
kinase 5, regulatory subunit 1 (p35) | −1,177 |
| CCNG2 | Cyclin G2 | 1,102 |
| CDK6 | Cyclin-dependent
kinase 6 | −1,094 |
| BCCIP | BRCA2 and CDKN1A
interacting protein | −1,085 |
| CCND1 | Cyclin D1 | −1,064 |
| DNA mismatch
repair |
| FEN1 | Flap
structure-specific endonuclease 1 | −2,869 |
| NEIL3 | Nei endonuclease
VIII-like 3 (E. coli) | −2,787 |
| POLE2 | Polymerase (DNA
directed), ε2, accessory subunit | −2,760 |
| PCNA | Proliferating cell
nuclear antigen | −2,279 |
| HMGB1 | High mobility group
box 1 | −2,076 |
| PARP1 | Poly(ADP-ribose)
polymerase 1 | −1,931 |
| LIG1 | Ligase I, DNA,
ATP-dependent | −1,724 |
| POLE | Polymerase (DNA
directed), ε, catalytic subunit | −1,621 |
| POLD3 | Polymerase
(DNA-directed), δ3, accessory subunit | −1,387 |
| MBD4 | Methyl-CpG binding
domain protein 4 | −1,378 |
| MLH1 | mutL homolog 1,
colon cancer, non-polyposis type 2 (E. coli) | −1,369 |
| POLD2 | Polymerase (DNA
directed), δ2, accessory subunit | −1,248 |
| POLD1 | Polymerase (DNA
directed), δ1, catalytic subunit | −1,182 |
| NEIL2 | Nei endonuclease
VIII-like 2 (E. coli) | −1,143 |
| UNG | Uracil-DNA
glycosylase | −1,132 |
| DNA
replication |
| RFC3 | Replication factor
C (activator 1) 3, 38 kDa | −3,710 |
| POLA2 | Polymerase (DNA
directed), α2, accessory subunit | −3,076 |
| MCM3 | Minichromosome
maintenance complex component 3 | −2,973 |
| PRIM1 | Primase, DNA,
polypeptide 1 (49 kDa) | −2,948 |
| FEN1 | Flap
structure-specific endonuclease 1 | −2,869 |
| MCM6 | Minichromosome
maintenance complex component 6 | −2,859 |
| MCM7 | Minichromosome
maintenance complex component 7 | −2,853 |
| POLE2 | Polymerase (DNA
directed), ε2, accessory subunit | −2,760 |
| MCM4 | Minichromosome
maintenance complex component 4 | −2,616 |
| DNA2 | DNA replication
helicase/nuclease 2 | −2,429 |
|
RNASEH2A | Ribonuclease H2,
subunit A | −2,381 |
| MCM2 | Minichromosome
maintenance complex component 2 | −2,344 |
| PCNA | Proliferating cell
nuclear antigen | −2,279 |
| RFC5 | Replication factor
C (activator 1) 5, 36.5 kDa | −2,227 |
| RFC4 | Replication factor
C (activator 1) 4, 37 kDa | −2,086 |
| RFC2 | Replication factor
C (activator 1) 2, 40 kDa | −1,798 |
| LIG1 | Ligase I, DNA,
ATP-dependent | −1,724 |
| POLA1 | Polymerase (DNA
directed), α1, catalytic subunit | −1,671 |
| MCM5 | Minichromosome
maintenance complex component 5 | −1,622 |
| POLE | Polymerase (DNA
directed), ε, catalytic subunit | −1,621 |
| POLD3 | Polymerase
(DNA-directed), δ3, accessory subunit | −1,387 |
| RPA3 | Replication protein
A3, 14 kDa | −1,368 |
|
RNASEH2B | Ribonuclease H2,
subunit B | −1,260 |
| POLD2 | Polymerase (DNA
directed), δ2, accessory subunit | −1,248 |
| RFC1 | Replication factor
C (activator 1) 1, 145 kDa | −1,235 |
| PRIM2 | Primase, DNA,
polypeptide 2 (58 kDa) | −1,185 |
| POLD1 | Polymerase (DNA
directed), δ1, catalytic subunit | −1,182 |
| POLE3 | Polymerase (DNA
directed), ε3, accessory subunit | −1,123 |
To transfer data obtained from HLaC78 expression
analysis and to determine key changes in switching between 2D and
3D conditions, the expression of selected genes of each functional
group were analyzed by quantitative RT-PCR in monolayer and
spheroid cultures of 12 different HNSCC cell lines.
Genes selected for TaqMan® qRT-PCR
expression quantification in monolayer and spheroid cultures of
HNSCC cell lines are summarized in Table III, log fold-changes for spheroids
of each cell line in comparison with monolayer culture are shown in
Table IV.
| Table IIIGenes tested for expression in
monolayer and spheroid cultures of different HNSCC cell lines. |
Table III
Genes tested for expression in
monolayer and spheroid cultures of different HNSCC cell lines.
| Functional
group | Gene |
|---|
| Cell junctions | GJB6, gap
junction protein β6 |
| Cell adhesion | CDH1,
E-cadherin |
| Cytochrome P450
metabolism | AKR1C1,
aldo-keto family 1 reductase member |
| CYP1B1,
cytochrome P450 1B1 |
| CYP1A1,
cytochrome P450 1A1 |
| Cell cycle | MKI, Ki67
proliferative antigen |
| DNA mismatch
repair | FEN1, flap
endonuclease 1 |
| DNA
replication | RFC3,
replication factor C3 |
Common expression shifts occurred in cell lines
forming tight spheroids under 3D conditions. Thus, expression of
cell junction and cell adhesion genes, as well as cytochrome P450
detoxification genes increased (GJB6, E-cadherin, AKR1C1, Cyp1a1
and 1b1), while expression of genes important for proliferation and
DNA-replication (MKI and RCF3) decreased. In the DNA mismatch
repair group no common tendency of expression shift was visibleX
(at least for the tested FEN1/MLH1 genes). In cell lines, forming
only loose aggregates, no upregulation of GJB6 or E-cadherin
occurred under 3-dimensional conditions. Cell proliferation and DNA
replication genes, however, were downregulated independent of
spheroid compaction in the 3D context. Notably, the tested DNA
mismatch repair genes were uniformly downregulated in cell lines
aggregating loosely.
Discussion
The present study provides an overview of spheroid
formation properties of 12 HNSCC cell lines. Spheroids differed
enormously in size and tightness. The cell lines were divided in
those forming tight spheroids or intermediate/loose aggregates.
Since the size of spheroids is in general dictated by cell adhesion
and proliferation rates within spheroids, expression profiles of
Ki67 (proliferation) and E-cadherin (adhesion) were generated. For
generation of tight, regular spheroids a distinct level of
E-cadherin expression in monolayers was necessary and underwent a
further significant upregulation upon aggregation. Alternatively,
this further significant upregulation seemed to be expendable, when
E-cadherin expression in monolayer cell lines was exceptionally
high as in HNO210 or SCC4 cell lines, respectively. The cell lines
expressing only low levels of E-cadherin under two-dimensional (2D)
conditions were not able to gain a sufficient increase in
E-cadherin expression to generate compact spheroidal tissue-like
aggregates. Most of these cell lines even decreased E-cadherin
expression under non-adherent conditions. Proliferation, however,
decreased in all cell lines (except FADU) when the attachment to
cell culture surfaces was suspended and 3-dimensional growth was
initiated. The observation that spheroid tightness in HNSCC is
partially determined by the expression of E-cadherin in monolayer
culture is in agreement with the observation in other systems
(15). In general upregulation of
E-cadherin causes a β-catenin-ediated contact inhibition and
subsequent decrease in proliferation (13). Furthermore, it has been shown that
knock-down of E-cadherin enhances the proliferation of HNSCC cell
lines by upregulating epidermal growth factor (EGFR) receptor.
Despite the usual pathway of E-cadherinmediated contact inhibition,
in the cell lines HPaC78, Hep2 and Hep2-Tax, all forming only loose
aggregates, E-cadherin was downregulated, but yet proliferation
decreased. Obviously pathways initiated in monolayer cell cultures
are not uniformly conferrable to the 3D context.
A comparison of overall gene expression between the
monolayer culture of the human larynx carcinoma cell line HLaC78
and the corresponding 72 h old spheroids was performed. HLaC78
cells form tight spheroids spontaneously with a smooth, ciliated
surface. Gene expression changed towards more tissue-like features.
Changes in overall gene expression was organized in main functional
groups, concerning cell junctions, cell adhesion, cytochrome P450
metabolism, cell cycle, DNA mismatch repair and DNA replication.
While cell adhesion and cell junction gene expression increased,
DNA replication/cell cycle genes as well as base excision DNA
repair genes expression decreased in HLaC78 cell line. These
principal observations roughly conform with a study on prostate
cancer in 2007 (16), with respect
to cell cycling, cell adhesion and DNA repair genes. In contrast,
no angiogenesis genes were upregulated in HLaC78 upon spheroid
aggregation, and vascular endothelial growth factor was slightly
downregulated. It has to be considered, however, that in older
spheroids an upregulation of angiogenesis genes may also occur,
when central hypoxia increases (in the present study HIF-1 was
upregulated only non-significantly after 72 h). To transfer data
obtained from HLaC78 expression analysis line and to determine key
changes in switching between 2D and 3D conditions, the expression
of selected genes of each functional group were analyzed by
quantitative RT-PCR in monolayer and spheroid cultures of different
HNSCC cell lines.
The decrease in cell cycling/DNA synthesis seemed to
be a common mechanism also in HNSCC cell lines, as shown by the
expression analysis of Ki67 and RCF3. Cell junction and adhesion
gene upregulation, however, was restricted to those cell lines with
distinct E-cadherin expression already under two-dimensional
conditions. These cell lines usually experienced a further
upregulation of E-cadherin upon spheroid aggregation. Cell lines
with low E-cadherin levels in monolayer cultures, however, further
decreased expression under 3D conditions. This is somewhat
divergent from the findings of Kim et al (17), who unveiled E-cadherin directly
regulating the hippo signaling pathway controlling cell
proliferation. E-cadherin mediates contact inhibition, which is
essential for tissue maintenance. In the cell lines producing only
loose aggregates, proliferation decreased despite downregulation of
E-cadherin, indicating further pathways, regulating proliferation
under tissue-like conditions.
Upregulation of cytochrome P450 metabolism genes has
been solely reported several times for hepatocellular carcinoma
cell lines. Thus, overall gene expression was analysed in HepG2
liver carcinoma monolayer cells and corresponding spheroids
(18). The authors reported
upregulation of cytochrome p450 1A1 (CYP1A1) as well as aldo-keto
reductase C1 (AKR1C1), both factors involved in cytochrome
P450-mediated metabolism of xenobiotics in spheroids. Hsiao et
al (19) showed that CYP1A1 and
CYP1B1 activity increased in hepatocytes with assembly of spheroids
and decreased with disassembly of spheroids on collagen coated
surfaces.
Notably, Masood et al (20) reported downregulation of CYP1A1 mRNA
in head and neck cancer specimens compared to normal mucosal
tissue. Upregulation of the cytochrome P450 enzymes or AKR1A1 in
spheroids may therefore reflect a regression to a more regulated
cell type in a tissue-like context.
Francia et al (21) performed a differential display
analysis of monolayers and spheroids of EMT-6 mammary carcinoma
cells and compared differentially expressed genes with EMT-6
tumours selected in vivo to be resistant to alkylating
agents. They identified the DNA mismatch repair-associated mismatch
repair endonuclease 2 (PMS2) gene to be associated with resistance.
Downregulation of PMS2 caused a multicellular resistance of tumour
cell spheroids against alkylating agents. They hypothesized, that a
deficiency in DNA mismatch repair may explain some forms of
multicellular resistance, particularly to alkylating agents.
In HLaC78 genes of the functional group, DNA
mismatch repair was significantly downregulated. We have not tested
resistance of monolayers and spheroids of our cell lines against
alkylating agents. Furthermore, it seems, that downregulation of
DNA mismatch-repair genes is not a general mechanism of HNSCC
cancer cell lines upon aggregation into spheroids, but it is
notable, that the tested genes where more commonly downregulated in
those cell lines forming loose clusters instead of tight
spheroids.
Summarizing our results, it seems that in head and
neck cancer cell lines (HNSCC) the 3D context reverses monolayer
cells to growth and behavior of cells in a more tissue-like
controlled condition with enhanced cell-cell adhesion and decreased
proliferation. The formation of tight regular spheroids is
dependent on distinct E-cadherin expression levels in monolayer
cultures, usually resulting in further upregulation upon
aggregation into 3D structures. Cell lines expressing only low
levels of E-cadherin produce only loose cell clusters, frequently
decreasing E-cadherin expression further. These cell lines diminish
proliferation despite decreased E-cadherin. Common shifts in gene
expression between 2D and 3D growth of HNSCC cell lines include the
functional groups cell junctions, cell adhesion, cell cycle, DNA
replication as well as genes concerning the metabolism of
xenobiotics.
Acknowledgments
We would like to thank Dr Piet Tas (PhD) for
critical reading of the manuscript.
References
|
1
|
Guntinas-Lichius O, Wendt T, Buentzel J,
Esser D, Lochner P, Mueller A, Schultze-Mosgau S and
Altendorf-Hofmann A: Head and neck cancer in Germany: A
site-specific analysis of survival of the Thuringian cancer
registration database. J Cancer Res Clin Oncol. 136:55–63. 2010.
View Article : Google Scholar
|
|
2
|
Griffth LG and Swartz MA: Capturing
complex 3D tissue physiology in vitro. Nat Rev Mol Cell Biol.
7:211–224. 2006. View
Article : Google Scholar
|
|
3
|
Wustrow TP, Raffael A and Valet G:
Multiparametric flow cytometry of human squamous cell carcinoma
lines from the head and neck. Otolaryngol Head Neck Surg.
98:552–557. 1988.PubMed/NCBI
|
|
4
|
Lin RZ and Chang HY: Recent advances in
three-dimensional multicellular spheroid culture for biomedical
research. Biotechnol J. 3:1172–1184. 2008. View Article : Google Scholar : PubMed/NCBI
|
|
5
|
Zenner HPLW, Lehner W and Herrmann IF:
Establishment of carcinoma cell lines from larynx and submandibular
gland. Arch Otorhinolaryngol. 225:269–277. 1979. View Article : Google Scholar : PubMed/NCBI
|
|
6
|
Zenner HP, Herrmann IF, Bremer W and
Stahl-Maugé C: Head and neck carcinoma models. In vivo reproduction
in athymic mice and in vitro culture. Acta Otolaryngol. 95:371–381.
1983. View Article : Google Scholar : PubMed/NCBI
|
|
7
|
Berndt A, Hyckel P, Könneker A, Katenkamp
D and Kosmehl H: Oral squamous cell carcinoma invasion is
associated with a laminin-5 matrix re-organization but independent
of basement membrane and hemidesmosome formation. Clues from an in
vitro invasion model. Invasion Metastasis. 17:251–258.
1997.PubMed/NCBI
|
|
8
|
Vinci M, Gowan S, Boxall F, Patterson L,
Zimmermann M, Court W, Lomas C, Mendiola M, Hardisson D and Eccles
SA: Advances in establishment and analysis of three-dimensional
tumor spheroid-based functional assays for target validation and
drug evaluation. BMC Biol. 10:292012. View Article : Google Scholar : PubMed/NCBI
|
|
9
|
Irizarry RA, Hobbs B, Collin F,
Beazer-Barclay YD, Antonellis KJ, Scherf U and Speed TP:
Exploration, normalization, and summaries of high density
oligonucleotide array probe level data. Biostatistics. 4:249–264.
2003. View Article : Google Scholar : PubMed/NCBI
|
|
10
|
Bolstad BM, Irizarry RA, Astrand M and
Speed TP: A comparison of normalization methods for high density
oligonucleotide array data based on variance and bias.
Bioinformatics. 19:185–193. 2003. View Article : Google Scholar : PubMed/NCBI
|
|
11
|
Subramanian A, Tamayo P, Mootha VK,
Mukherjee S, Ebert BL, Gillette MA, Paulovich A, Pomeroy SL, Golub
TR, Lander ES, et al: Gene set enrichment analysis: A
knowledge-based approach for interpreting genome-wide expression
profiles. Proc Natl Acad Sci USA. 102:15545–15550. 2005. View Article : Google Scholar : PubMed/NCBI
|
|
12
|
Livak KJ and Schmittgen TD: Analysis of
relative gene expression data using real-time quantitative PCR and
the 2−ΔΔCT method. Methods. 25:402–408. 2001.
View Article : Google Scholar
|
|
13
|
Stockinger A, Eger A, Wolf J, Beug H and
Foisner R: E-cadherin regulates cell growth by modulating
proliferation-dependent beta-catenin transcriptional activity. J
Cell Biol. 154:1185–1196. 2001. View Article : Google Scholar : PubMed/NCBI
|
|
14
|
Wang D, Su L, Huang D, Zhang H, Shin DM
and Chen ZG: Downregulation of E-cadherin enhances proliferation of
head and neck cancer through transcriptional regulation of EGFR.
Mol Cancer. 10:1162011. View Article : Google Scholar : PubMed/NCBI
|
|
15
|
Ivascu A and Kubbies M: Diversity of
cell-mediated adhesions in breast cancer spheroids. Int J Oncol.
31:1403–1413. 2007.PubMed/NCBI
|
|
16
|
Takagi A, Watanabe M, Ishii Y, Morita J,
Hirokawa Y, Matsuzaki T and Shiraishi T: Three-dimensional cellular
spheroid formation provides human prostate tumor cells with
tissue-like features. Anticancer Res. 27:45–53. 2007.PubMed/NCBI
|
|
17
|
Kim NG, Koh E, Chen X and Gumbiner BM:
E-cadherin mediates contact inhibition of proliferation through
Hippo signaling-pathway components. Proc Natl Acad Sci USA.
108:11930–11935. 2011. View Article : Google Scholar : PubMed/NCBI
|
|
18
|
Chang TT and Hughes-Fulford M: Monolayer
and spheroid culture of human liver hepatocellular carcinoma cell
line cells demonstrate distinct global gene expression patterns and
functional phenotypes. Tissue Eng Part A. 15:559–567. 2009.
View Article : Google Scholar
|
|
19
|
Hsiao CC, Wu JR, Wu FJ, Ko WJ, Remmel RP
and Hu WS: Receding cytochrome P450 activity in disassembling
hepatocyte spheroids. Tissue Eng. 5:207–221. 1999. View Article : Google Scholar : PubMed/NCBI
|
|
20
|
Masood N, Malik FA and Kayani MA:
Expression of xenobiotic metabolizing genes in head and neck cancer
tissues. Asian Pac J Cancer Prev. 12:377–382. 2011.PubMed/NCBI
|
|
21
|
Francia G, Man S, Teicher B, Grasso L and
Kerbel RS: Gene expression analysis of tumor spheroids reveals a
role for suppressed DNA mismatch repair in multicellular resistance
to alkylating agents. Mol Cell Biol. 24:6837–6849. 2004. View Article : Google Scholar : PubMed/NCBI
|