Introduction
Epithelial ovarian cancer (EOC) has the highest
mortality rate among gynecological malignancies. Worldwide annual
incidence is 6.3 new cases/100,000 women and EOC accounts for 3.7%
of all female cancers (1,2).
Due to lack of specific diagnostic method, EOC is
usually diagnosed at advanced stages. The standard management of
EOC includes cytoreductive surgery, followed by platinum-
(carboplatin or cisplatin) and taxane-based chemotherapy (3,4).
Despite achievement of complete or partial remission after
first-line chemotherapy, majority of women with advanced EOC
experience disease recurrence, which suggests development of
multidrug resistance (MDR) phenotype during further therapy. The
development of either de novo drug resistance or induced
resistance significantly influences the efficacy of systemic
chemotherapy (5). Therefore,
information concerning the molecular mechanisms of chemotherapy
resistance and consequent validation of predictive and prognostic
biomarkers is needed for optimization of treatment the algorithms
in EOC.
Several membrane transporters, such as ATP-binding
cassette (ABC) transporters, solute carrier (SLC) transporters and
P-type ATPases, seem to be such potential promising biomarkers.
Members of ABC protein family and ATPases are important efflux
transporters, while members of SLC family act as up-take
transporters. ABC transporters play an important role in cellular
resistance to multiple drugs in different types of tumors, e.g. in
breast (6), colorectal (7) and pancreatic cancer (8), as well as in EOC. Expression of ABCB1
has been associated with drug resistance to paclitaxel in ovarian
cancer cell lines (9) and ABCC2 was
associated with resistance to cisplatin in vitro (10). In addition, epigenetic reactivation
of ABCG2 gene expression in ovarian cancer cells was shown to be an
early molecular event leading to resistance (11). In EOC tissues, ABCC1 transcript
level (as well as ABCC2 and ABCC3) was significantly increased when
compared to cyst-adenomas and normal ovarian tissues (12,13).
P-glycoprotein (encoded by ABCB1 gene) was shown to associate with
disease progression (14) and
prognosis of ovarian cancer patients (13). ABCC1 protein expression associated
with tumor grade in EOC and ABCC4 protein displayed an unfavorable
impact on disease relapse (15).
Recently, high gene expression of some members of ABCA subfamily of
transporters was associated with poor outcome in ovarian high grade
serous carcinoma (16).
Contrary to ABC transporters, information on the
clinical impact of SLC membrane transporters in ovarian carcinoma
patients is very limited. At present, only two studies of SLC
expression levels in different EOC drug-resistant sublines were
conducted providing heterogeneous results (17,18).
Complex analysis of SLC gene expression profile in ovarian
carcinoma patients is thus needed.
Additionally, P-type ATPases were also connected to
drug resistance in ovarian cancer cells. ATP7A and ATP7B
transporters were shown to mediate resistance to platinum-based
anticancer drugs in ovarian cancer (19,20).
ATP11B gene expression correlated with cisplatin resistance in
human ovarian cancer cell lines and in vitro. Moreover,
ATP11B gene silencing restored the sensitivity of ovarian cancer
cells to cisplatin (21) suggesting
the potential of its manipulation as a novel therapeutic tool.
ATP11B expression also correlated with higher tumor grade in
ovarian cancer tissues (21). Thus,
characterization of the role of P-type ATPase membrane proteins
seems highly relevant, as development of resistance is the major
limitation of therapeutic efficacy of platinum compounds in ovarian
cancer.
Since the role of membrane transporters in EOC still
remains poorly understood, the aim of the present study was to
provide gene expression profile of efflux (ABCs and ATPases) and
up-take (SLCs) membrane transporters in EOC, and to identify novel
putative prognostic markers of EOC progression. Gene expression
profile of ABC, SLC and ATPase transporters in primary EOC tissues
and in controls was assessed, and associations of expression levels
with clinicopathologic data of patients were evaluated. Results of
the present study provide novel targets for development of new
therapies for follow-up study.
Patients and methods
Patients
The present study consists of a pilot and validation
study. In the pilot study, tissue samples were obtained from 60
patients diagnosed with EOC at Motol University Hospital (Prague,
Czech Republic) and at Pilsen University Hospital (Pilsen, Czech
Republic) during 2009–2013. For the validation study, 57 tissue
samples of EOC diagnosed at Motol University Hospital during
2011–2013 were used. Fourteen samples of ovarian tissues without
morphological signs of carcinoma were used as controls in both
pilot and validation studies. Control samples were obtained from
patients who underwent surgery for other reason than ovarian
malignancy in Motol University Hospital.
The tissue samples collected during surgery were
histopathologically examined according to standard diagnostic
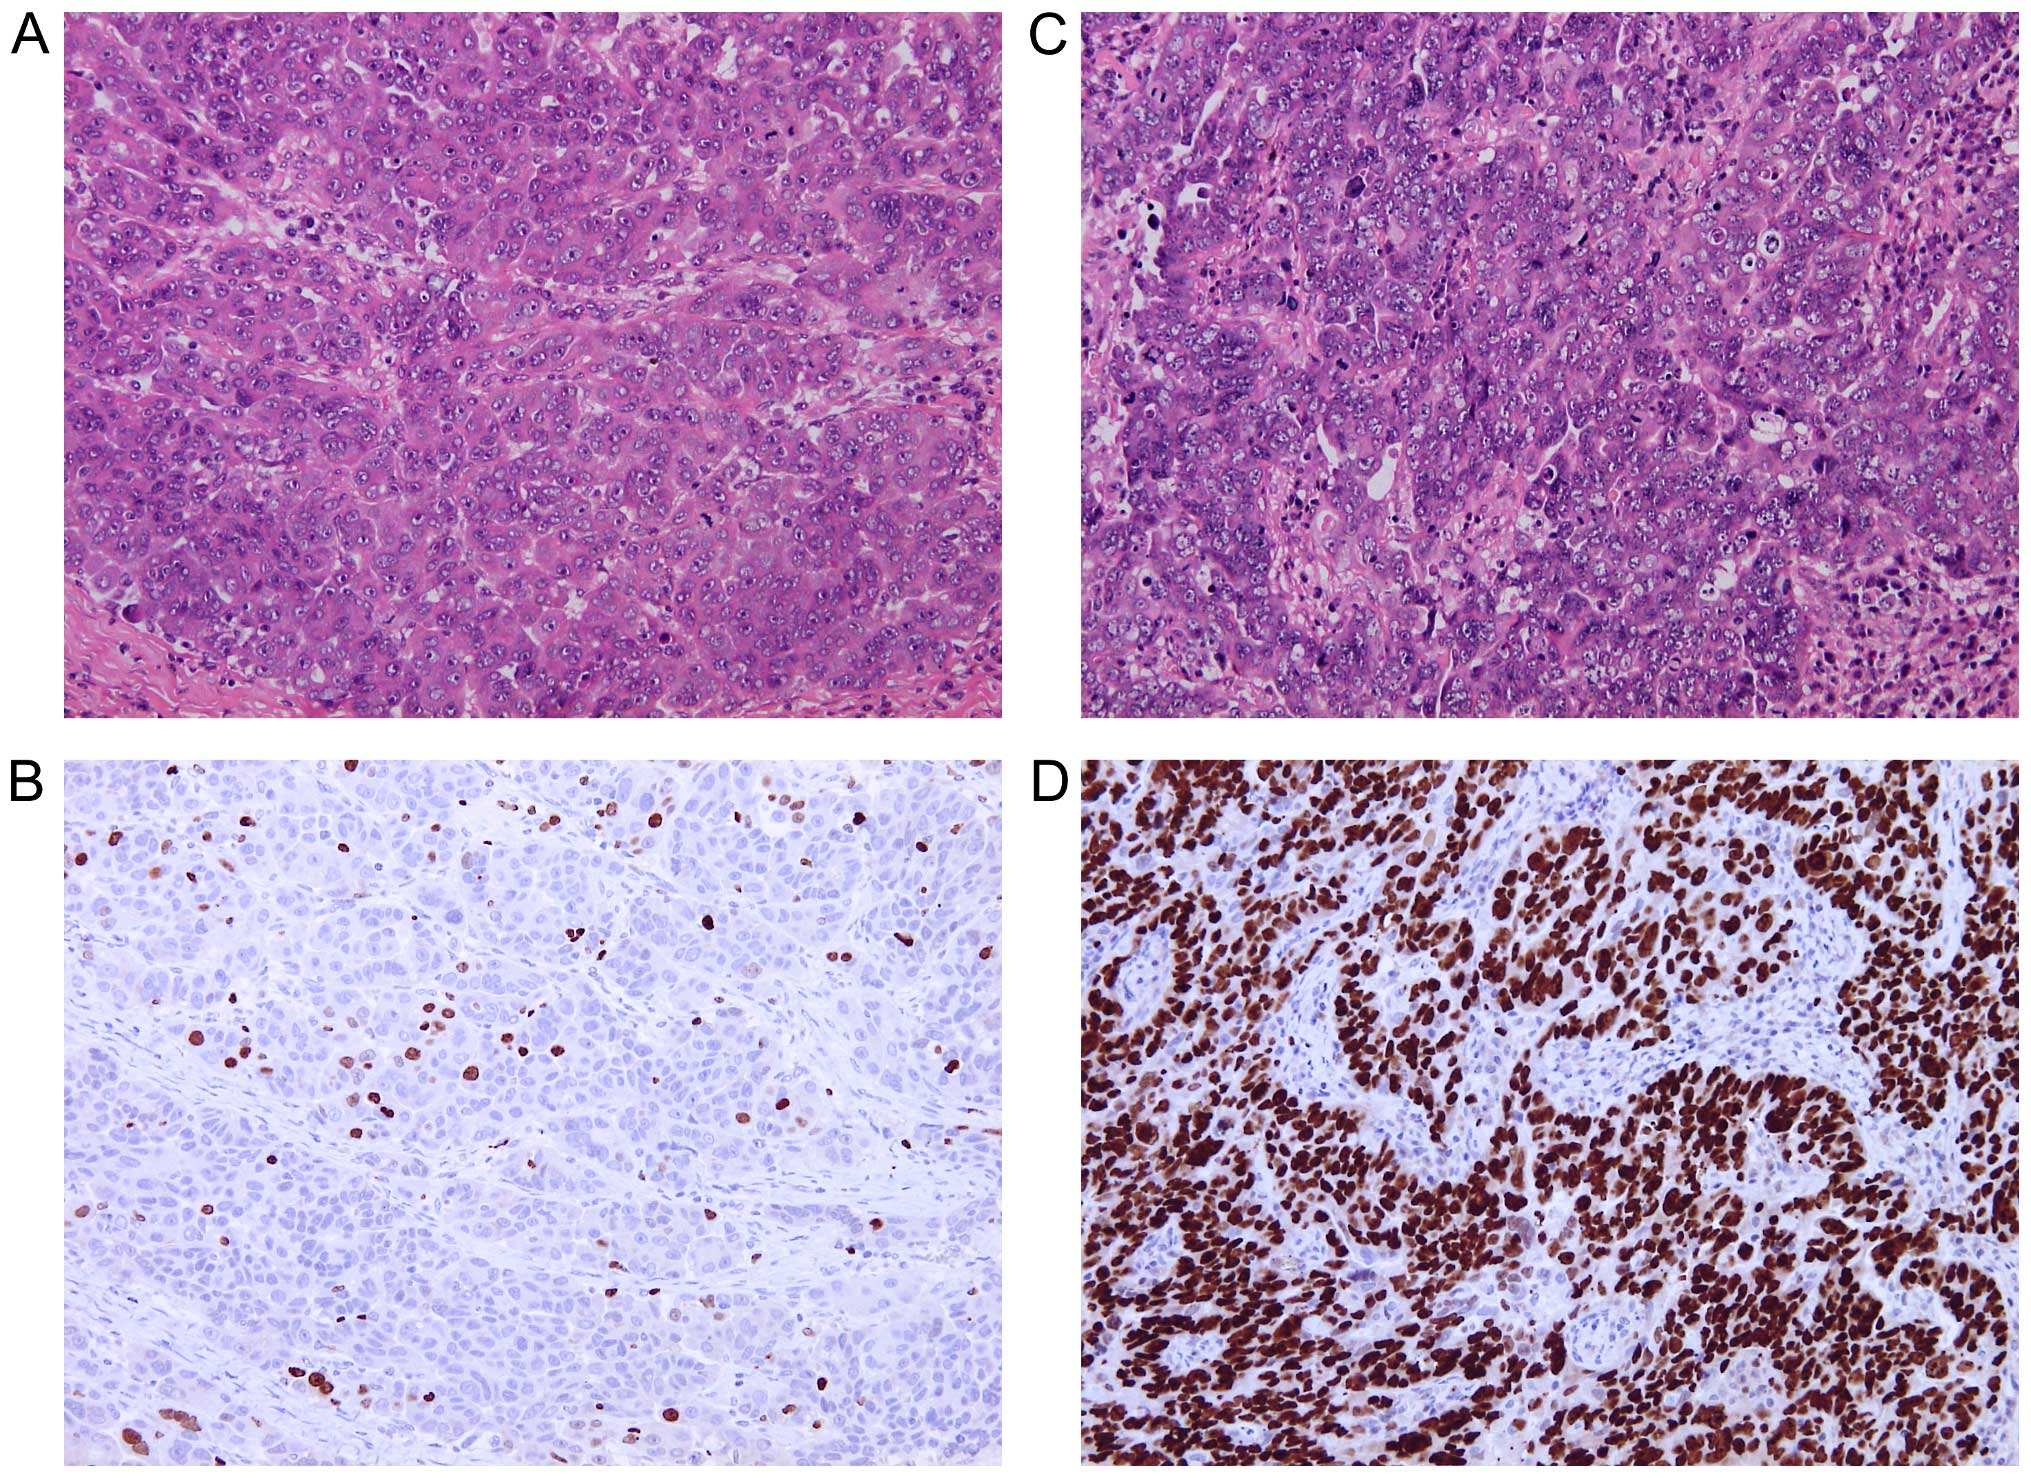
procedures. For Ki67 immunostaining, tissue sections of 4-µm
thickness were deparaffinized and rehydrated through decreasing
concentrations of ethanol to water. Heat-induced epitope retrieval
was performed in 0.01 M citrate buffer (pH 6.0) at 98°C for 30 min.
The endogenous peroxidase activity was blocked by standard
techniques at 20°C and tissue sections were incubated overnight at
4°C with primary monoclonal mouse anti-human antibody Ki67 (diluted
1:150; clone MIB-1; DakoCytomation, Glostrup, Denmark).
Immunocomplexes of the antigen and the primary antibody were
visualized using N-Histofine Simple Stain MAX PO (MULTI) detection
system (Nichirei Biosciences, Tokyo, Japan) with
3,3′-diaminobenzidine tetrahydrochloride (Fluka Chemie, Buchs,
Switzerland) as a chromogen. All sections were stained with
hematoxylin, dehydrated and mounted. Only nuclear staining, of any
intensity, was considered positive. Ki67 hot-spots were identified
in each tissue section under low magnification and the level of
Ki67 expression was quantified in 10 different high power fields as
a percentage of positive cells.
The tissue samples were fresh-frozen and stored at
−80°C until isolation of RNA, DNA and protein. The following data
on patients were retrieved from medical records: the patients age
at the time of diagnosis, FIGO stage, tumor grade and type of EOC,
expression of protein marker Ki67 in percentage (available only for
patients from Motol University Hospital) and progression of the
disease evaluated as time to progression (TTP) in months as
specified in Table I. Patients were
treated after surgery by adjuvant regimens based on paclitaxel and
platinum drugs. Follow-up of patients was performed by regular
physical examinations and monitoring of CA-125 levels.
 | Table IClinicopathologic characteristics of
EOC patients in the study. |
Table I
Clinicopathologic characteristics of
EOC patients in the study.
|
Characteristics | Pilot set N
(%)a | Validation set N
(%)a |
|---|
| Median age at
diagnosis, years | 62.5±11.2 | 57.0±9.8 |
| FIGO stage | | |
| I | 4 (7.3) | 3 (5.4) |
| II | 6 (10.9) | 2 (3.6) |
| III | 41 (74.5) | 47 (83.9) |
| IV | 4 (7.3) | 4 (7.1) |
| Not available | 5 | 1 |
| EOC type | | |
| Others | 10 (18.2) | 3 (5.3) |
| HGSC | 45 (81.8) | 54 (94.7) |
| Not available | 5 | 0 |
| Histological
grade | | |
| G1 | 5 (8.5) | 1 (1.8) |
| G2 | 11 (18.6) | 9 (15.8) |
| G3 | 43 (72.9) | 47 (82.5) |
| Not available | 1 | 0 |
| Distant
metastases | | |
| Present | 4 (8.0) | 4 (7.1) |
| Absent | 46 (92.0) | 52 (92.9) |
| Not available | 10 | 1 |
| Time to
progression | | |
| Median ± SD
(%) | 12.5±8.7 | 13.0±10.7 |
| Number of
evaluated patientsb | 24 | 29 |
| Ki67 protein
expression | | |
| Median ± SD
(%) | 30.0±25.4 | 25.0±19.4 |
| Number of
evaluated patientsc | 21 | 57 |
All patients were informed about the aims of the
present study, and provided their written consent to participate in
the study. The design of the study was approved by the Ethics
Commission of the National Institute of Public Health (Prague,
Czech Republic), Motol University Hospital and Pilsen University
Hospital.
Isolation of total RNA and cDNA
preparation
Tumor and control samples were ground to powder
under liquid nitrogen in mortar with pestle. Total RNA, DNA and
protein were isolated using AllPrep DNA/RNA/Protein Mini kit
(Qiagen, Hildesheim, Germany) according to the manufacturer's
protocol. Total RNA was quantified by Quant-iT RiboGreen RNA assay
kit (Invitrogen, Eugene, OR, USA). cDNA was synthesized using
Revert Aid First Strand cDNA Synthesis kit (MBI Fermentas, Vilnius,
Lithuania) with 0.5 µg of total RNA as previously described
(22). Quality of cDNA was
confirmed by PCR amplification of ubiquitin C fragment (23).
In the pilot study, pre-amplified cDNA was used for
all experiments. Two point five milliliters of cDNA was
pre-amplified using 5.0 µl of PerfeCTa PreAmp SuperMix
(Quanta BioSciences, Gaithersburg, MD, USA), 6.25 µl of
pooled assay mix containing all target TaqMan Gene Expression
Assays (Life Technologies, Foster City, CA, USA; listed in Table II) and nuclease-free water in a
final volume of 25.0 µl. A total of 14 pre-amplification
cycles were used according to the manufacturer's protocol. The
pre-amplified cDNA was stored at −20°C until real-time PCR was
performed. For the validation phase of the study, cDNA without
pre-amplification was used to test robustness of putative
markers.
| Table IIThe TaqMan Gene Expression Assays
used in the present study. |
Table II
The TaqMan Gene Expression Assays
used in the present study.
| Gene symbol | Assay ID | Gene bank accession
no. | Gene name | Amplicon length
(bp) |
|---|
| GAPDH | Hs02758991_g1 | NM_002046.4 |
Glyceraldehyde-3-phosphate
dehydrogenase | 93 |
| GUSB | Hs99999908_m1 | NM_000181.3 | Glucuronidase,
β | 81 |
| PPIAa | Hs99999904_m1 | NM_021130.3 | Peptidylprolyl
isomerase A | 98 |
| TBP | Hs00920495m1 | NM_003194.4 | TATA box binding
protein | 112 |
| UBCa | Hs00824723_m1 | NM_021009.5 | Ubiquitin C | 71 |
| YWHAZa | Hs03044281_g1 | NM_001135700.1 | Tyrosine
3-monooxygenase/tryptophan 5-monooxygenase activation protein, ζ
polypeptide | 106 |
| ABCA1 | Hs00194045_m1 | NM_005502.3 | ATP-binding
cassette, sub-family A (ABC1), member 1 | 125 |
| ABCA2 | Hs00242232_m1 | NM_212533.2 | ATP-binding
cassette, sub-family A (ABC1), member 2 | 58 |
| ABCA3 | Hs00184543_m1 | NM_001089.2 | ATP-binding
cassette, sub-family A (ABC1), member 3 | 77 |
| ABCA7 | Hs00185303_m1 | NM_019112.3 | ATP-binding
cassette, sub-family A (ABC1), member 7 | 80 |
| ABCA8 | Hs00992371_m1 | NM_007168.2 | ATP-binding
cassette, sub-family A (ABC1), member 8 | 85 |
| ABCA9 | Hs00329320_m1 | NM_080283.3 | ATP-binding
cassette, sub-family A (ABC1), member 9 | 145 |
| ABCA10b | Hs00365268_m1 | NM_080282.3 | ATP-binding
cassette, sub-family A (ABC1), member 10 | 127 |
| ABCA12 | Hs00292421_m1 | NR_103740.1 | ATP-binding
cassette, sub-family A (ABC1), member 1 | 77 |
| ABCA13 | Hs01110169_m1 | NM_152701.3 | ATP-binding
cassette, sub-family A (ABC1), member 13 | 80 |
| ABCB1 | Hs00184491_m1 | NM_000927.4 | ATP-binding
cassette, sub-family B (MDR/TAP), member 1 | 110 |
| ABCB2 | Hs00388677_m1 | NM_000593.5 | Transporter 1,
ATP-binding cassette, sub-family B (MDR/TAP) | 60 |
| ABCB3 | Hs00241060_m1 | NM_018833.2 | Transporter 2,
ATP-binding cassette, sub-family B (MDR/TAP) | 66 |
| ABCB4 | Hs00240956_m1 | NM_018850.2 | ATP-binding
cassette, sub-family B (MDR/TAP), member 4 | 73 |
| ABCB5 | Hs00698751_m1 | NM_178559.5 | ATP-binding
cassette, sub-family B (MDR/TAP), member 5 | 90 |
| ABCB11 | Hs00184824_m1 | NM_003742.2 | ATP-binding
cassette, sub-family B (MDR/TAP), member 11 | 63 |
| ABCC1 | Hs00219905_m1 | NM_004996.3 | ATP-binding
cassette, sub-family C (CFTR/MRP), member 1 | 74 |
| ABCC2 | Hs00166123_m1 | NM_000392.3 | ATP-binding
cassette, sub-family C (CFTR/MRP), member 2 | 75 |
| ABCC3 | Hs00358656_m1 | NM_003786.3 | ATP-binding
cassette, sub-family C (CFTR/MRP), member 3 | 98 |
| ABCC4 | Hs00195260_m1 | NM_005845.3 | ATP-binding
cassette, sub-family C (CFTR/MRP), member 4 | 86 |
| ABCC5 | Hs00981089_m1 | NM_005688.2 | ATP-binding
cassette, sub-family C (CFTR/MRP), member 5 | 68 |
| ABCC6 | Hs00184566_m1 | NM_001171.5 | ATP-binding
cassette, sub-family C (CFTR/MRP), member 6 | 56 |
| ABCC7 | Hs00357011_m1 | NM_000492.3 | ATP-binding
cassette sub-family C, member 7 | 93 |
| ABCC8 | Hs00165861_m1 | NM_000352.3 | ATP-binding
cassette, sub-family C (CFTR/MRP), member 8 | 137 |
| ABCC9 | Hs00245832_m1 | NM_020297.2 | ATP-binding
cassette, sub-family C (CFTR/MRP), member 9 | 70 |
| ABCC10 | Hs00375716_m1 | NM_033450.2 | ATP-binding
cassette, sub-family C (CFTR/MRP), member 10 | 142 |
| ABCC11 | Hs01090768_m1 | NM_032583.3 | ATP-binding
cassette, sub-family C (CFTR/MRP), member 11 | 76 |
| ABCC12 | Hs00264354_m1 | NM_033226.2 | ATP-binding
cassette, sub-family C (CFTR/MRP), member 12 | 90 |
| ABCD1 | Hs00163610_m1 | NM_000033.3 | ATP-binding
cassette, sub-family D (ALD), member 1 | 101 |
| ABCD2 | Hs00193054_m1 | NM_005164.3 | ATP-binding
cassette, sub-family D (ALD), member 2 | 109 |
| ABCD3 | Hs00161065_m1 | NM_002858.3 | ATP-binding
cassette, sub-family D (ALD), member 3 | 91 |
| ABCD4 | Hs00245340_m1 | NM_005050.3 | ATP-binding
cassette, sub-family D (ALD), member 4 | 117 |
| ABCE1 | Hs01009190_m1 | NM_001040876.1 | ATP-binding
cassette, sub-family E (OABP), member 1 | 91 |
| ABCF1 | Hs00153703_m1 | NM_001090.2 | ATP-binding
cassette, sub-family F (GCN20), member 1 | 69 |
| ABCF2 | Hs00606493_m1 | NM_005692.4 | ATP-binding
cassette, sub-family F (GCN20), member2 | 113 |
| ABCF3 | Hs00217977_m1 | NM_018358.2 | ATP-binding
cassette, sub-family F (GCN20), member3 | 61 |
| ABCG1 | Hs00245154_m1 | NM_207629.1 | ATP-binding
cassette, sub-family G (WHITE), member 1 | 58 |
| ABCG2 | Hs00184979_m1 | NM_004827.2 | ATP-binding
cassette, sub-family G (WHITE), member2 | 92 |
| ABCG5 | Hs00223686_m1 | NM_022436.2 | ATP-binding
cassette, sub-family G (WHITE), member5 | 60 |
| ABCG8 | Hs00223690_m1 | NM_022437.2 | ATP-binding
cassette, sub-family G (WHITE), member 8 | 63 |
| ATP7A | Hs00163707_m1 | NM_000052.6 | ATPase,
Cu++ transporting, α polypeptide | 88 |
| ATP7B | Hs00163739_m1 | NM_000053.3 | ATPase,
Cu++ transporting, β polypeptide | 83 |
| ATP11B | Hs00966779_m1 | NM_014616.2 | ATPase, class VI,
type 11B | 79 |
| SLC16A14 | Hs00541300_m1 | NM_152527.4 | Solute carrier
family 16, member 14 | 106 |
| SLC22A1 | Hs00427552_m1 | NM_003057.2 | Solute carrier
family 22 (organic cation transporter), member 1 | 79 |
| SLC22A2 | Hs01010723_m1 | NM_003058.3 | Solute carrier
family 22 (organic cation transporter), member 2 | 120 |
| SLC22A3 | Hs01009568_m1 | NM_021977.3 | Solute carrier
family 22 (organic cation transporter), member 3 | 73 |
| SLC22A4c | Hs00268200_m1 | NM_003059.2 | Solute carrier
family 22 (organic cation/zwitterion transporter), member 4 | 76 |
| SLC22A5 | Hs00929869_m1 | NM_003060.3 | Solute carrier
family 22 (organic cation/carnitine transporter), member 5 | 65 |
| SLC22A11 | Hs00945829_m1 | NM_018484.2 | Solute carrier
family 22 (organic anion/urate transporter), member 11 | 82 |
| SLC22A18 | Hs00180039_m1 | NM_002555.5 | Solute carrier
family 22, member 18 | 81 |
| SLC31A1 | Hs00977268_g1 | NM_001859.3 | Solute carrier
family 31 (copper transporter), member 1 | 81 |
| SLC31A2 | Hs00156984_m1 | NM_001860.2 | Solute carrier
family 31 (copper transporter), member 2 | 70 |
| SLC47A1 | Hs00217320_m1 | NM_018242.2 | Solute carrier
family 47 (multidrug and toxin extrusion), member 1 | 74 |
| SLC47A2 | Hs00945650_m1 | NM_152908.3 | Solute carrier
family 47 (multidrug and toxin extrusion), member 2 | 86 |
Quantitative real-time PCR
Quantitative real-time PCR (qPCR) was performed by
the use of ViiA7 Real-Time PCR system (Life Technologies). In the
pilot study, reaction mixture contained 2.5 µl of TaqMan
Gene Expression Master Mix, 0.25 µl of a specific TaqMan
Gene Expression Assay, 2.0 µl of cDNA 32-times diluted in TE
buffer, and nuclease-free water to make a final volume of 5.0
µl. Cycling parameters were, initial hold at 50°C for 2 min
and denaturation at 95°C for 10 min followed by 45 cycles
consisting of denaturation at 95°C for 15 sec and
annealing/extension at 60°C for 60 sec (exceptions are highlighted
in the list of TaqMan Gene Expression Assays, Table II). Fluorescence values were
acquired after each extension phase. Samples were analyzed in
duplicates and samples with standard deviation of duplicates
>0.5 Ct were re-analyzed.
As a calibrator, equimolar mixture of 10 control
samples was used. The calibrator was 20-times diluted in
nuclease-free water. Relative standard curve was generated from
5-log dilutions of the calibrator. Reaction efficiency of all
assays was >90% (under conditions described in Table II). Non-template control containing
nuclease-free water instead of cDNA was used.
In the validation study, reaction mixture contained
1.0 µl of 5X Hot FIREPol Probe qPCR Mix Plus (Solis BioDyne,
Tartu, Estonia), 0.25 µl of a specific TaqMan Gene
Expression Assay, 2.0 µl of cDNA 8-times diluted in
nuclease-free water, and nuclease-free water to make a final volume
of 5.0 µl. qPCR conditions were used as optimized in the
pilot study.
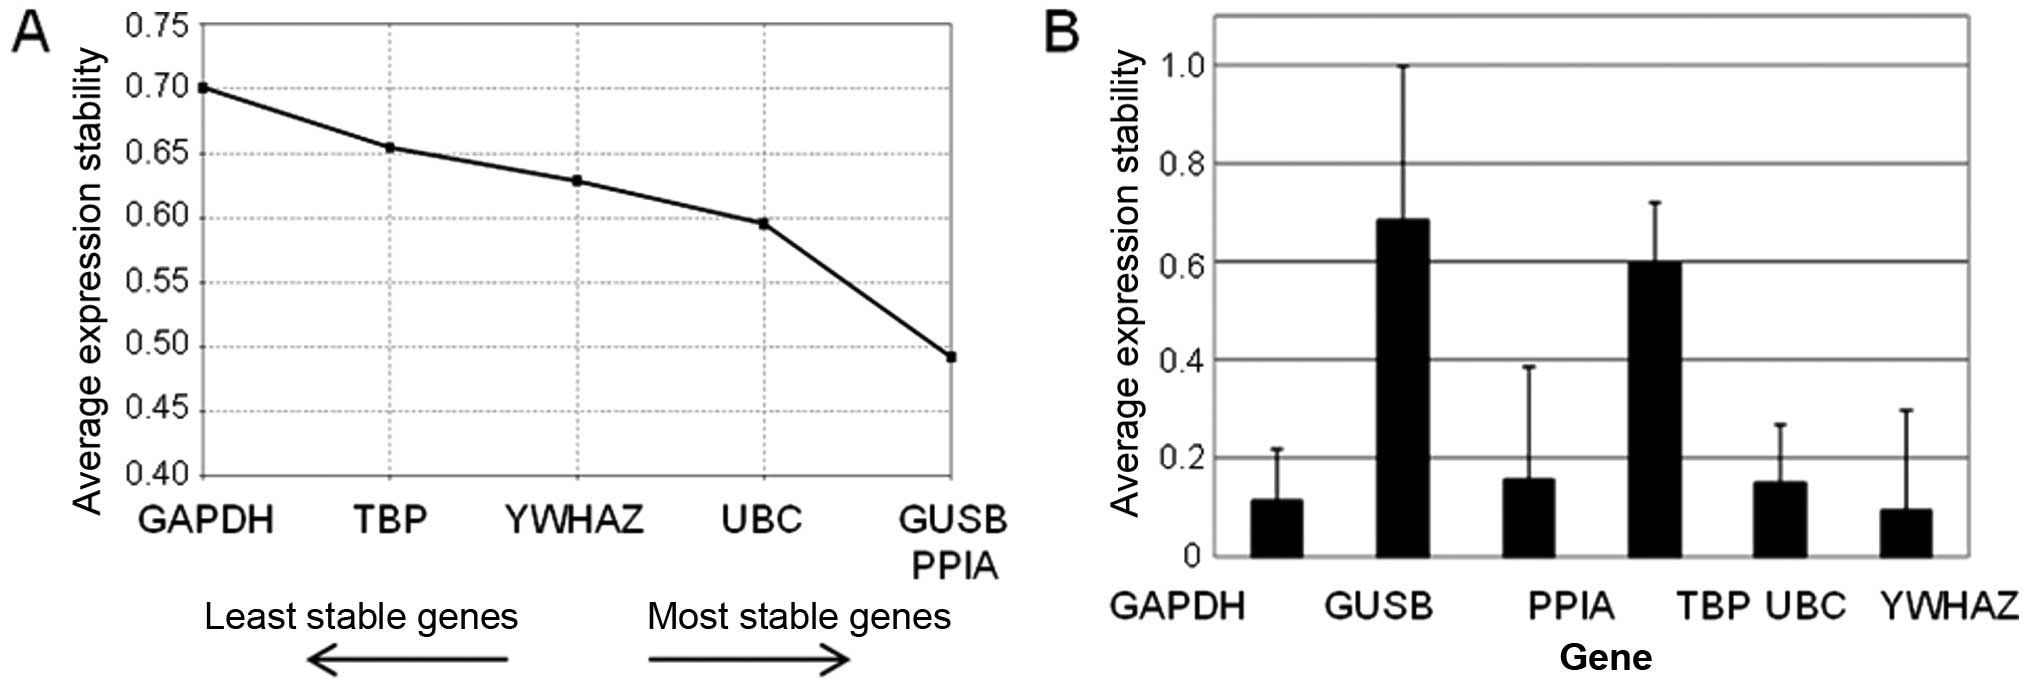
Selection of reference genes
Stability of six potential reference genes (GAPDH,
GUSB, PPIA, TBP, UBC and YWHAZ) was evaluated in the pilot sample
set. NormFinder and geNorm software was used for analysis of
results (24).
The real-time PCR study design adhered to the
Minimum Information for Publication of Quantitative Real-Time PCR
Experiments Guidelines (25).
Data analysis
Relative transcript levels in tumor and control
tissues samples were compared using REST 2009 software, [Qiagen;
(26)].
Statistical analyses of associations between gene
expression and clinicopathologic data of patients were carried out
by SPSS v16.0 software (SPSS, Inc., Chicago, IL, USA). A ratio of
Ct for a particular target gene to an arithmetic mean of all
reference genes was calculated for each sample, as described in
Ehrlichová et al (13).
Non-parametric Kruskal-Wallis test was used for evaluation of
relationships between gene expression and FIGO stage (stage I/II
vs. III/IV), tumor grade (grade 1/2 vs. 3), Ki67 (cut-off 15%) and
EOC type (high grade serous EOC vs. other types). Spearman rank
test was used for evaluation of correlation between mRNA level and
percentage of Ki67-positive cells. Time-to-progression was defined
as the time elapsed between surgical treatment and disease
progression or death from any cause. Progression-free survival
(PFS) was evaluated only for patients without distant metastases.
Survival functions were plotted by the Kaplan-Meier method and
statistical significance was evaluated by the log-rank test. For
multivariate analysis the Cox proportional hazards model was used.
P-values are departures from two-sided tests. A P-value of <0.05
was considered to indicate a statistically significant result. The
issue of multiple testing was addressed by validation of results in
a two-phase study.
Results
Characteristics of patients
Sets of 60 and 57 ovarian cancer patients were used
in the pilot and validation study, respectively. Percentage of
advanced stage or high grade EOC, as well as median age at
diagnosis, was similar in the pilot and in the validation set of
patients. The median age at diagnosis (± standard deviation) was
62.5±11.2 and 57.0±9.8 years in the pilot and validation set of
patients, respectively, and did not significantly differ from the
age of controls used for comparison (53.5±13.3 years). In contrast,
tissue samples significantly differed in expression level of marker
Ki67 (30.0±25.4 and 25.0±19.4% in the pilot and validation set of
EOC tissues, respectively), while it was ≤1% in the control tissues
(Fig. 1).
Disease progression occurred in 24 and 29 patients
in the pilot and validation sets, respectively. Median follow-up (±
standard deviation) was 12.5±8.7 months in the pilot set of
patients and 13.0±10.7 months in the validation set. The
relationship between TTP of these patients and gene expression in
EOC samples (PFS) was evaluated.
Tissue samples of 14 patients without morphological
signs of primary ovarian carcinoma in their ovaries (ovarian
leiomyoma, n=6; uterine leiomyoma, n=2; benign ovarian cyst, n=1;
cervical carcinoma, n=2; endometrial carcinoma, n=2; sarcoma, n=1)
were used as controls. Clinicopathological characteristics of EOC
patients are described in Table
I.
Selection of reference genes
Six genes were tested for stability in the pilot set
of patients. PPIA, UBC and YWHAZ were consistently evaluated among
the most stable four genes by both geNorm (Fig. 2A) and NormFinder (Fig. 2B) programs. Therefore, these genes
were selected as reference genes for the study on ovarian
tissues.
Transcript levels of transporter genes in
the pilot set
Transcripts of the analyzed 39 ABCs, 12 SLCs and
three ATPase genes (Table II) were
analyzed by qPCR in all tumor and control samples in the pilot
study. Six ABC (ABCB5, ABCC7, ABCC8, ABCC11, ABCC12 and ABCG5) and
three SLCs (SLC22A2, SLC22A11 and SLC47A2) genes were expressed
below limit of detection and thus were not further evaluated.
Significantly higher transcript levels of ABCA7, ABCA12, ABCA13,
ABCB2, ABCB3, ABCC3 and SLC22A18 were found in EOC tumors when
compared with the control ovarian tissues. In contrast, ABCA8,
ABCA9, ABCA10, ABCB1, ABCB4, ABCC9, ABCD3, ABCD4, ABCE1, ABCF1,
ABCF3, ABCG2, SLC16A4, SLC22A1, SLC22A3, SLC22A5, SLC47A1, ATP7A
and ATP11B levels were significantly decreased in tumors, when
compared with controls (Table
III). The rest of the genes were not significantly deregulated
in EOC tissues.
| Table IIIDifferences in the relative
transcript levels of target genes between controls and EOC tissues
in the pilot and validation sets. |
Table III
Differences in the relative
transcript levels of target genes between controls and EOC tissues
in the pilot and validation sets.
| Gene | Reaction efficiency
(%) | Pilot set
| Validation set
|
|---|
| Expression
difference | P-valuea | EOC tissues vs.
controls | Expression
difference | P-valuea | EOC tissues vs.
controls |
|---|
| ABCA1 | 93 | 0.84 | 0.340 | | | | |
| ABCA2 | 97 | 1.12 | 0.491 | | 1.16 | 0.424 | |
| ABCA3 | 95 | 0.83 | 0.314 | | 0.99 | 0.950 | |
| ABCA7 | 94 | 3.21 | <0.001 | Up | | | |
| ABCA8 | 93 | 0.04 | <0.001 | Down | 0.02 | <0.001 | Down |
| ABCA9 | 91 | 0.05 | <0.001 | Down | 0.03 | <0.001 | Down |
| ABCA10 | 96 | 0.03 | <0.001 | Down | 0.01 | <0.001 | Down |
| ABCA12 | 98 | 2.56 | 0.038 U | p | 2.34 | 0.019 | Up |
| ABCA13 | 98 | 7.21 | <0.001 | Up | | | |
| ABCB1 | 91 | 0.32 | <0.001 | Down | 0.33 | <0.001 | Down |
| ABCB2 | 95 | 1.93 | 0.001 | Up | | | |
| ABCB3 | 97 | 1.56 | 0.013 | Up | | | |
| ABCB4 | 97 | 0.45 | 0.003 | Down | | | |
| ABCB11 | 93 | 2.52 | 0.116 | | | | |
| ABCC1 | 96 | 1.01 | 0.946 | | | | |
| ABCC2 | 99 | 0.70 | 0.070S | | | | |
| ABCC3 | 94 | 4.49 | <0.001 | Up | 4.33 | <0.001 | Up |
| ABCC4 | 94 | 1.09 | 0.643 | | | | |
| ABCC5 | 97 | 1.08 | 0.587 | | | | |
| ABCC6 | 99 | 0.76 | 0.312 | | 0.72 | 0.289 | |
| ABCC9 | 94 | 0.18 | <0.001 | Down | 0.16 | <0.001 | Down |
| ABCC10 | 93 | 1.03 | 0.807 | | | | |
| ABCD1 | 94 | 0.91 | 0.440 | | | | |
| ABCD2 | 91 | 1.07 | 0.804 | | 1.05 | 0.887 | |
| ABCD3 | 92 | 0.67 | <0.001 | Down | 0.86 | 0.137 | |
| ABCD4 | 94 | 0.76 | 0.0240 | Down | | | |
| ABCE1 | 95 | 0.59 | <0.001 | Down | | | |
| ABCF1 | 97 | 0.73 | 0.001 | Down | | | |
| ABCF2 | 92 | 0.99 | 0.957 | | | | |
| ABCF3 | 93 | 0.69 | <0.001 | Down | | | |
| ABCG1 | 96 | 0.91 | 0.626 | | 1.00 | 0.975 | |
| ABCG2 | 94 | 0.11 | <0.001 | Down | 0.08 | <0.001 | Down |
| ABCG8 | 91 | 0.74 | 0.595 | | | | |
| ATP7A | 94 | 0.43 | <0.001 | Down | 0.43 | <0.001 | Down |
| ATP7B | 95 | 1.08 | 0.701 | | 1.06 | 0.760 | |
| ATP11B | 97 | 0.50 | <0.001 | Down | | | |
|
SLC16A14 | 92 | 0.17 | <0.001 | Down | 0.10 | <0.001 | Down |
| SLC22A1 | 99 | 0.56 | 0.007 | Down | | | |
| SLC22A3 | 96 | 0.09 | <0.001 | Down | | | |
| SLC22A4 | 98 | 0.89 | 0.612 | | | | |
| SLC22A5 | 95 | 0.55 | <0.001 | Down | 0.45 | <0.001 | Down |
| SLC22A18 | 94 | 1.76 | 0.002 | Up | | | |
| SLC31A1 | 93 | 1.12 | 0.309 | | | | |
| SLC31A2 | 96 | 0.97 | 0.873 | | | | |
| SLC47A1 | 94 | 0.16 | <0.001 | Down | | | |
Associations between transcript levels
and clinicopathological data in the pilot set
Transcript levels of target genes in EOC tissues
were evaluated for their associations with clinicopathological
characteristics (FIGO stage, grade, EOC type and expression of
protein marker Ki67) (Table IV-A)
and PFS of patients assessed as TTP (Fig. 3A).
| Table IVAssociations between transcript
levels of the investigated genes in EOC tissues and
clinicopathologic data of patients that were revealed in the pilot
study A, and in the validation study B. |
Table IV
Associations between transcript
levels of the investigated genes in EOC tissues and
clinicopathologic data of patients that were revealed in the pilot
study A, and in the validation study B.
A, Pilot set
|
|---|
| Gene | FIGO stage
| Grade
| EOC type
| Ki67 protein
expressiond
|
|---|
Cut-off 15%
| % |
|---|
| I/II | III/IV | 1/2 | 3 | Other types | HGSC | Low | High |
|---|
| ABCA2 | | |
1.46±0.05a |
1.49±0.07a | | | | | |
| NS | 0.038b | NS | NS | NS |
| ABCA3 | 1.54±0.07a | 1.47±0.07a | | | | | | | |
| 0.018b | NS | NS | NS | NS |
| ABCA8 | | | | | | | | | r=0.57 |
| NS | NS | NS | NS | 0.007c |
| ABCA9 | | | | | | | | | r=0.44 |
| NS | NS | NS | NS | 0.044c |
| ABCA10 | | | | | | | 1.67±0.16a | 1.85±0.19a | |
| NS | NS | NS | 0.049b | NS |
| ABCA12 | 1.80±0.21a | 2.00±0.15a | | | 1.81±0.21a | 1.96±0.16a | | | |
| 0.045b | NS | 0.008b | NS | NS |
| ABCB1 | | | | | | | 1.60±0.14a | 1.74±0.10a | r=0.59 |
| NS | NS | NS | 0.049b | 0.005c |
| ABCC3 | | | | | 1.41±0.14a | 1.54±0.10a | 1.35±0.10a | 1.54±0.16a | r=0.56 |
| NS | NS | 0.015b | 0.025b | 0.009c |
| ABCC6 | | | | | 1.63±0.13a | 1.74±0.11a | | | |
| NS | NS | 0.015b | NS | NS |
| ABCD2 | | | | | | | 1.58±0.18a | 1.75±0.12a | r=0.55 |
| NS | NS | NS | 0.028b | 0.010c |
| ABCD3 | | | | | 1.33±0.04a | 1.38±0.05a | | | |
| NS | NS | 0.007b | NS | NS |
| ABCG1 | | | | | 1.37±0.06a | 1.43±0.08a | 1.35±0.05a | 1.45±0.07a | r=0.44 |
| NS | NS | 0.038b | 0.039b | 0.047c |
| ABCG2 | | | | | | | 1.46±0.09a | 1.60±0.09a | |
| NS | NS | NS | 0.049b | NS |
| ATP7A | 1.50±0.06a | 1.46±0.06a | | | | | | | |
| 0.047b | NS | NS | NS | NS |
| ATP7B | 1.42±0.06a | 1.36±0.08a | | | | | | | |
| 0.034b | NS | NS | NS | NS |
| SLC16A14 | | | | | | | 1.46±0.09a | 1.59±0.09a | |
| NS | NS | NS | 0.044b | NS |
| SLC22A5 | | | | | 1.47±0.06a | 1.53±0.07a | | | |
| NS | NS | 0.004b | NS | NS |
B, Validation set
|
|---|
| Gene | Grade
| Ki67 in
percentage |
|---|
| 1/2 | 3 |
|---|
| ABCA2 |
1.27±0.05a |
1.31±0.04a | r=0.319 |
| 0.012b | 0.017c |
| ABCA10 | | | r=0.296 |
| NS | 0.025c |
ABCA3, ATP7A and ATP7B levels were significantly
higher in advanced FIGO III/IV stage carcinomas compared with
stages I or II. The opposite tendency was seen for expression of
ABCA12 gene, i.e., lower levels in patients with extrapelvic
metastases (FIGO III or IV). Lower ABCA2 transcript level was found
in tumors with grade 3 compared to the more differentiated grade 1
or 2 tumors. ABCA12, ABCC3, ABCC6, ABCD3, ABCG1 and SLC22A5 were
overexpressed in high grade serous carcinomas (HGSC) compared to
other EOC subtypes. A significant negative correlation of Ki67
protein expression with ABCA8, ABCA9, ABCB1, ABCC3, ABCD2 and ABCG1
was also observed. Using cut-off level 15%, correlations of Ki67
expression with ABCB1, ABCC3, ABCD2, and ABCG1 were confirmed. In
addition, significant associations with ABCA10, ABCG2 and SLC16A14
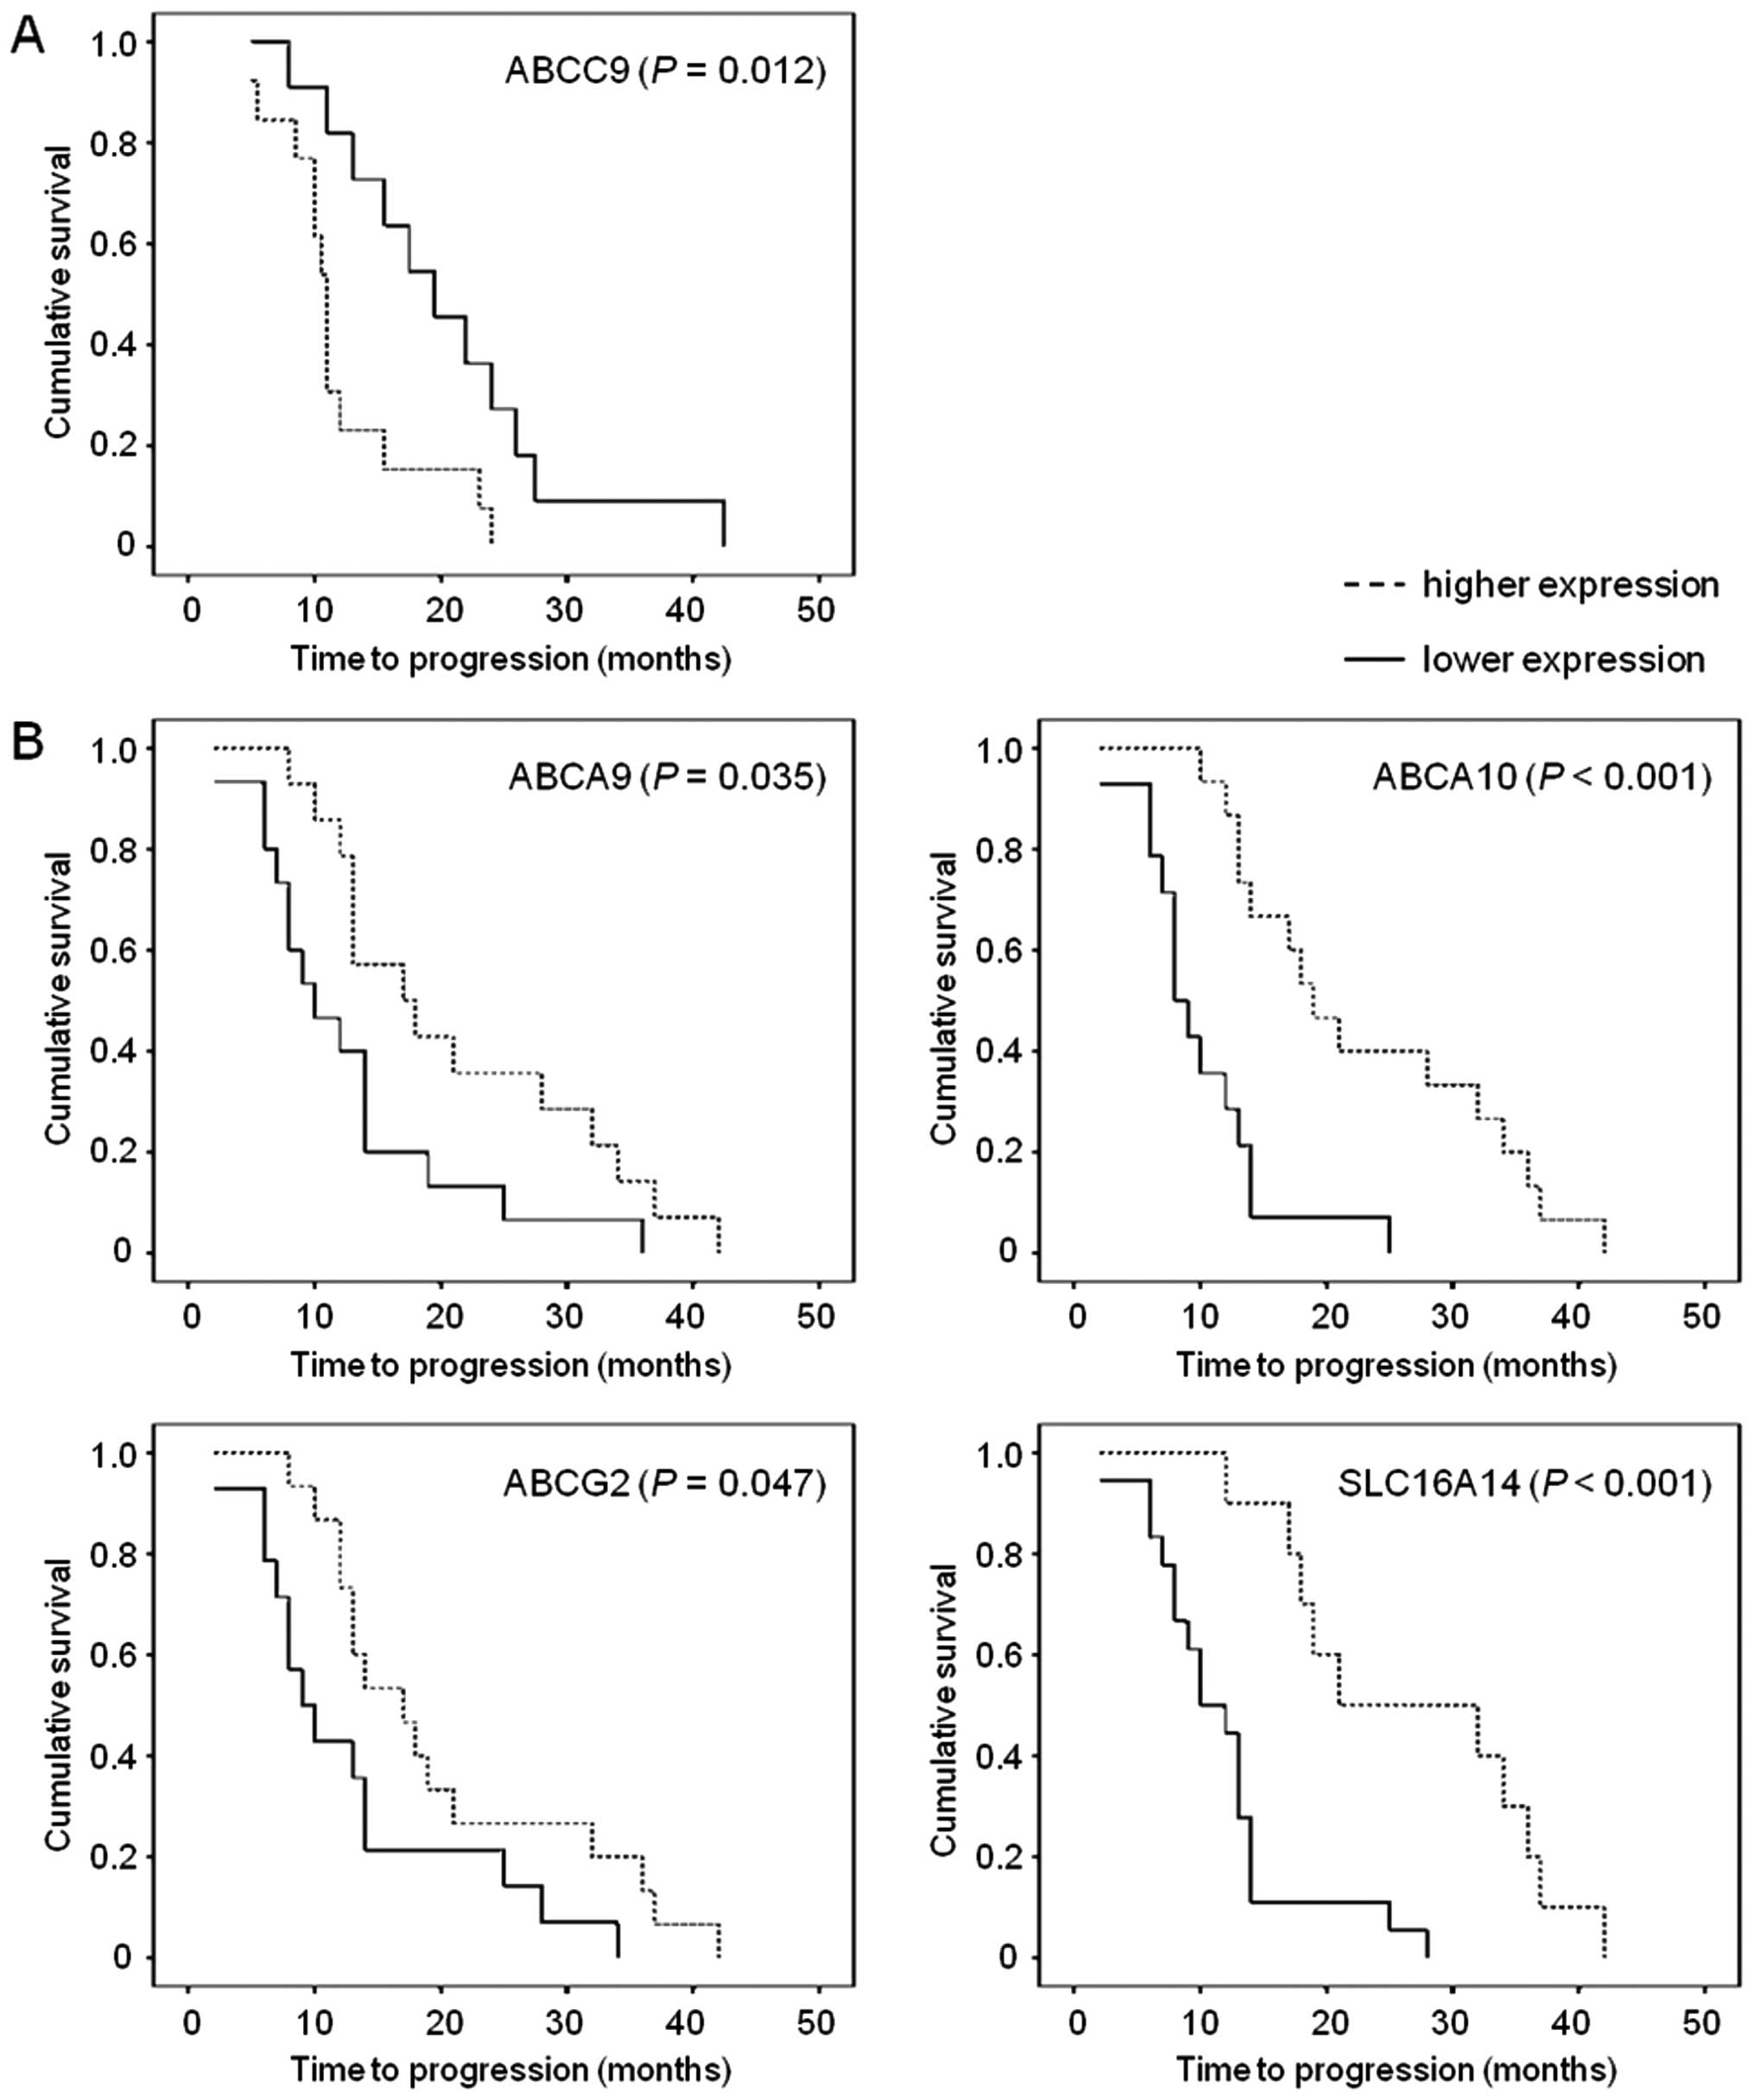
were revealed. Moreover, expression of ABCC9 gene significantly
associated with PFS of patients with EOC in the pilot set (n=24).
Patients with higher than median intratumoral ABCC9 level had
significantly shorter TTP than the rest of patients [hazard ratio
(HR)=2.64; 95% confidence interval (95% CI), 1.05–6.67). This
association was significant also in the Cox regression
multiparametric analysis adjusted to the stage, grade and presence
of distant metastases (P=0.040).
Transcript levels of transporter genes in
the validation set
Results of the pilot study were verified in the
validation set of patients. All genes that associated with any of
clinicopathological characteristics in the pilot set of patients
(Table IV-A) were selected for
subsequent validation.
The majority of deregulations in tumors compared to
controls observed in the pilot set were confirmed in the validation
study. Namely, ABCA8, ABCA9, ABCA10, ABCB1, ABCC9, ABCG2, ATP7A,
SLC16A14 and SLC22A5 were downregulated in tumors compared to
control tissues. ABCA12 and ABCC3 genes were overexpressed in
tumors (Table III).
Associations between transcript levels
and clinicopathological data in the validation set
Associations between gene expression levels of
candidate genes and FIGO stage, grade of tumors and Ki67 expression
were evaluated in the validation set (Table IV-B). However, low numbers of
patients with other than HGSC tumor type in the validation set
prevented the confirmation of these associations.
The association of ABCA2 expression in EOC with
grade was confirmed. In contrast with the pilot study, analysis of
the validation set revealed significant correlation of ABCA2 and
ABCA10 levels with expression of marker Ki67.
The association of ABCC9 with PFS of EOC patients
observed in the pilot set was not confirmed by the analysis of the
validation set (n=29). However, analyses of the validation set
discovered significant associations of overexpression of ABCA9
(HR=0.46; 95% CI, 0.20–1.04), ABCA10 (HR=0.17; 95% CI, 0.06–0.49),
ABCG2 (HR=0.41; 95% CI, 0.18–0.95), and SLC16A14 (HR=0.24; 95% CI,
0.09–0.61) with longer TTP of EOC patients (Fig. 3B). Multiparametric analysis adjusted
to stage, grade and presence of distant metastases was significant
for ABCA10 (P=0.001), ABCG2 (P=0.038), and SLC16A14 (P=0.003), but
not for ABCA9 (P=0.060).
Analysis of pooled sets (n=53) has shown significant
result for ABCG2 (P=0.004; HR=0.46; 95% CI, 0.25–0.85), but not for
ABCA9 (P=0.335), ABCA10 (P=0.080), ABCC9 (P=0.562) or SLC16A14
(P=0.125). Multiparametric analysis adjusted to stage, grade and
presence of distant metastases remained significant for ABCG2
(P=0.013).
Discussion
Although various previously reported studies
observed significant associations of particular membrane
transporters with ovarian carcinoma prognosis and therapy outcome
prediction, comprehensive study on the clinicopathologic impact of
membrane transporters in ovarian carcinoma is lacking. The present
study aimed to partially fill this gap and eventually provide new
knowledge and putative markers with prognostic significance or
targets for design of novel therapies in EOC.
Several alterations of gene expression levels of ABC
and SLC transporters and ATPases between tumors and controls were
found in the present study. Downregulation of ABCA8, ABCA9 and
ABCA10 in tumors compared to non-malignant tissues is in line with
our previous observation in colorectal carcinomas (7). In addition, ABCB1 gene was
downregulated in tumors compared to controls, which corroborates
our previous observations in EOC tissues (13), breast (26) and colorectal carcinomas (7). ABCB2, ABCB3 and ABCC3 genes were
upregulated in tumors compared to control tissues, which was
previously demonstrated in recurrent ovarian carcinomas [but not in
primary lesions; (12)] and in
pancreatic carcinoma (8). We also
observed upregulation of ABCC1; however, it was not significant
(P>0.05). Thus we could not confirm upregulation of ABCC1 gene
previously observed in ovarian carcinomas by Auner et al
(12) and by Ehrlichová et
al (13).
SLC transporters and ATPases are known to serve as
uptake and efflux pumps of platinum-based drugs, respectively, and
they also contribute to the resistance of ovarian cancer cells to
cisplatin and carboplatin (18–20,27).
The observed downregulation (in both pilot and validation sets) of
SLC16A14 is in line with its previously reported downregulation in
multiresistant W1 ovarian cancer cell line (17). Thus, the validated downregulation of
SLC16A14, SLC22A5 and ATP7A in EOC compared to controls observed by
the present study implies its potential for prediction of therapy
outcome.
The observed downregulation of ABCA2 transcript
level in grade 3 tumors compared with grade 1 or 2 carcinomas,
which was confirmed in the validation study, raises further
interest. Moreover, a negative relationship between ABCA2
expression and expression of protein Ki67 was revealed in the
validation set. Protein marker Ki67 is expressed in highly
proliferating cells and linked with advanced stage and high grade
ovarian tumors (28). Thus, low
ABCA2 expression may be a novel marker of aggressive tumor behavior
and its relation to Ki67 should be further investigated.
Besides ABCA2, other eight ABC transporter genes
(ABCA8/9/10, ABCB1, ABCC3, ABCD2 and ABCG1/2), SLC16A14 and SLC22A5
correlated with Ki67 expression in the pilot study. None of these
associations was confirmed in the validation set, however, a
negative correlation of ABCA10 with Ki67 level was found, thus
implicating a more universal role of this family of ABC
transporters. Transporters of ABCA transporters are active in
cellular transmembrane lipid transport (29,30)
suggesting involvement of lipid transport alterations (caused by
decreased expression of particular ABCA genes, e.g. ABCA2 and
ABCA10 observed in the pilot study) in increased proliferation of
ovarian cancer cells. No further data on associations of ABC and
SLC transporter genes with Ki67 marker is available in the
literature regarding ovarian cancer. However, higher proportion of
Ki67-positive cells in samples of ovarian carcinoma originating
from first-look laparotomies was detected in patients with a
shorter progression-free time (10). The results of the present study
therefore suggest that determination of relationship between mRNA
or protein expression of membrane transporters and Ki67 may be
important for diagnosis of advanced stages and prognosis of ovarian
carcinoma.
Tumors of the ovary are classified into several
histological types with HGSC being the most frequent one. The
particular types differ in their genetic profiles (31); however, alterations in membrane
transporters gene expression are unexplored. In the present study,
we identified significant relationships between five ABC (ABCA12,
ABCC3, ABCC6, ABCD3 and ABCG1) and SLC22A5 genes, and HGSC which
should be further followed. ABCC3 gene confers drug resistance and
it is involved in glutathione transport in ovarian cancer cells
(32). Recently, ABCC3 was found to
serve as a marker for MDR and as a predictor for poor clinical
outcome in non-small cell lung cancer (33) which supports our data on ABCC3
overexpression in HGSC tissues. In the study by Xu et al
upregulation of ABCC7 protein was found in serous and clear cell
type of ovarian cancer compared to other histological types. It was
also connected with proliferation rate of ovarian cancer cells in
in vitro experiments, suggesting a potential application of
this gene as a marker of EOC aggressiveness (34). In our study, very low level of ABCC7
transcript was detected, thus preventing further study of this
gene. However, according to the results of Xu et al
(34), the mechanism of function of
ABCC7 gene in EOC should be followed by functional in vitro
experiments.
Gene expression level of ABCC9 was associated with
progression-free survival (evaluated as TTP) of EOC patients that
were included in the pilot but not in the validation set. Previous
study found connection between amplification of ABCC9 and drug
resistance in SKOV3/VP ovarian cancer cell line in vitro
(35), but ABCC9 role in prognosis
of ovarian carcinoma was unknown. On the contrary, ABCA9, ABCA10,
ABCG2 and SLC16A14 significantly associated with PFS in the
validation set, but not in the pilot set of patients. The
histological subtype variability of analyzed patient sets could be
the likely source of these discrepancies. Therefore, we also
performed pooled analysis of PFS in both sets together. Only the
association of ABCG2 expression with PFS was significant in the
combined analysis of both sets and thus ABCG2 appears to be the
strongest putative candidate for prognostic marker in EOC patients
arising from the present study.
Among the recently studied ABC transporter genes
only members of ABCA subfamily were found to associate with
survival of patients. Overexpression of ABCA1/5/8 and ABCA9 in
primary tumors was significantly associated with the reduced
overall survival of ovarian HGSC patients (16). ABCG2 overexpression was recently
related to the chemoresistance in ovarian cancer cells (18,36)
and so was SLC16A14 overexpression (18). Thus, the role of these genes in
chemotherapy response and disease outcome should be further
followed in context with other molecular features, e.g. grade or
Ki67.
In conclusion, the present study revealed
significant differences in gene expression profile of ABC, SLC and
ATPase transporters in primary ovarian carcinomas compared with
controls, as well as remarkable associations between gene
expression and clinicopathologic data of patients. Most notably,
expression of ABCA2 gene associated with EOC grade and expression
of protein marker Ki67. Moreover, differences in membrane
transporters expression profile between HGSC and other histological
EOC subtypes were found suggesting the role of particular
transporter genes in clinical outcome. ABCA9, ABCA10, ABCC9, ABCG2
and SLC16A14 significantly associated with PFS in one set of the
followed patients and ABCG2 in both sets pooled. These genes are
thus novel putative markers of ovarian carcinoma prognosis and
targets for validation of their clinical utility by a larger
independent follow-up study.
Acknowledgments
The present study was supported by a grant from the
Internal Grant Agency of the Czech Ministry of Health no. NT14056-3
to R.V., L.R. and P.V., MH CZ-DRO (National Institute of Public
Health-NIPH, 75010330) to M.E., a grant from the Ministry of
Education, Youth and Sports of the Czech Republic no. LD14050 to
P.V., and the National Sustainability Program I (NPU I) no. LO1503
provided by the Ministry of Education Youth and Sports of the Czech
Republic to K.E., M.E. and P.S.
References
|
1
|
Ferlay J, Shin HR, Bray F, Forman D,
Mathers C and Parkin DM: Estimates of worldwide burden of cancer in
2008: GLOBOCAN 2008. Int J Cancer. 127:2893–2917. 2010. View Article : Google Scholar
|
|
2
|
Hannibal CG, Cortes R, Engholm G and Kjaer
SK: Survival of ovarian cancer patients in Denmark: Excess
mortality risk analysis of five-year relative survival in the
period 1978–2002. Acta Obstet Gynecol Scand. 87:1353–1360. 2008.
View Article : Google Scholar
|
|
3
|
Bast RC Jr, Hennessy B and Mills GB: The
biology of ovarian cancer: New opportunities for translation. Nat
Rev Cancer. 9:415–428. 2009. View
Article : Google Scholar : PubMed/NCBI
|
|
4
|
Muggia F: Platinum compounds 30 years
after the introduction of cisplatin: Implications for the treatment
of ovarian cancer. Gynecol Oncol. 112:275–281. 2009. View Article : Google Scholar
|
|
5
|
Bartouskova M, Melichar B and
Mohelnikova-Duchonova B: Folate receptor: A potential target in
ovarian cancer. Pteridines. 26:1–12. 2015. View Article : Google Scholar
|
|
6
|
Kunická T, Václavíková R, Hlaváč V, Vrána
D, Pecha V, Rauš K, Trnková M, Kubáčková K, Ambruš M, Vodičková L,
et al: Non-coding polymorphisms in nucleotide binding domain 1 in
ABCC1 gene associate with transcript level and survival of patients
with breast cancer. PLoS One. 9:e1017402014. View Article : Google Scholar : PubMed/NCBI
|
|
7
|
Hlavata I, Mohelnikova-Duchonova B,
Vaclavikova R, Liska V, Pitule P, Novak P, Bruha J, Vycital O,
Holubec L, Treska V, et al: The role of ABC transporters in
progression and clinical outcome of colorectal cancer. Mutagenesis.
27:187–196. 2012. View Article : Google Scholar : PubMed/NCBI
|
|
8
|
Mohelnikova-Duchonova B, Brynychova V,
Oliverius M, Honsova E, Kala Z, Muckova K and Soucek P: Differences
in transcript levels of ABC transporters between pancreatic
adenocarcinoma and nonneoplastic tissues. Pancreas. 42:707–716.
2013. View Article : Google Scholar : PubMed/NCBI
|
|
9
|
Eyre R, Harvey I, Stemke-Hale K, Lennard
TW, Tyson-Capper A and Meeson AP: Reversing paclitaxel resistance
in ovarian cancer cells via inhibition of the ABCB1 expressing side
population. Tumour Biol. 35:9879–9892. 2014. View Article : Google Scholar : PubMed/NCBI
|
|
10
|
Surowiak P, Materna V, Kaplenko I,
Spaczynski M, Dietel M, Lage H and Zabel M: Topoisomerase 1A,
HER/2neu and Ki67 expression in paired primary and relapse ovarian
cancer tissue samples. Histol Histopathol. 21:713–720.
2006.PubMed/NCBI
|
|
11
|
Bram EE, Stark M, Raz S and Assaraf YG:
Chemotherapeutic drug-induced ABCG2 promoter demethylation as a
novel mechanism of acquired multidrug resistance. Neoplasia.
11:1359–1370. 2009. View Article : Google Scholar : PubMed/NCBI
|
|
12
|
Auner V, Sehouli J, Oskay-Oezcelik G,
Horvat R, Speiser P and Zeillinger R: ABC transporter gene
expression in benign and malignant ovarian tissue. Gynecol Oncol.
117:198–201. 2010. View Article : Google Scholar
|
|
13
|
Ehrlichová M, Mohelnikova-Duchonova B,
Hrdy J, Brynychova V, Mrhalova M, Kodet R, Rob L, Pluta M, Gut I,
Soucek P, et al: The association of taxane resistance genes with
the clinical course of ovarian carcinoma. Genomics. 102:96–101.
2013. View Article : Google Scholar : PubMed/NCBI
|
|
14
|
Lu L, Katsaros D, Wiley A, Rigault de la
Longrais IA, Puopolo M and Yu H: Expression of MDR1 in epithelial
ovarian cancer and its association with disease progression. Oncol
Res. 16:395–403. 2007.PubMed/NCBI
|
|
15
|
Bagnoli M, Beretta GL, Gatti L, Pilotti S,
Alberti P, Tarantino E, Barbareschi M, Canevari S, Mezzanzanica D
and Perego P: Clinicopathological impact of ABCC1/MRP1 and
ABCC4/MRP4 in epithelial ovarian carcinoma. Biomed Res Int.
2013:1432022013. View Article : Google Scholar : PubMed/NCBI
|
|
16
|
Hedditch EL, Gao B, Russell AJ, Lu Y,
Emmanuel C, Beesley J, Johnatty SE, Chen X, Harnett P, George J, et
al Australian Ovarian Cancer Study Group: ABCA transporter gene
expression and poor outcome in epithelial ovarian cancer. J Natl
Cancer Inst. 106:dju1492014. View Article : Google Scholar : PubMed/NCBI
|
|
17
|
Januchowski R, Zawierucha P, Andrzejewska
M, Ruciński M and Zabel M: Microarray-based detection and
expression analysis of ABC and SLC transporters in drug-resistant
ovarian cancer cell lines. Biomed Pharmacother. 67:240–245. 2013.
View Article : Google Scholar : PubMed/NCBI
|
|
18
|
Januchowski R, Zawierucha P, Ruciński M,
Andrzejewska M, Wojtowicz K, Nowicki M and Zabel M: Drug
transporter expression profiling in chemoresistant variants of the
A2780 ovarian cancer cell line. Biomed Pharmacother. 68:447–453.
2014. View Article : Google Scholar : PubMed/NCBI
|
|
19
|
Katano K, Safaei R, Samimi G, Holzer A,
Rochdi M and Howell SB: The copper export pump ATP7B modulates the
cellular pharmacology of carboplatin in ovarian carcinoma cells.
Mol Pharmacol. 64:466–473. 2003. View Article : Google Scholar : PubMed/NCBI
|
|
20
|
Samimi G, Safaei R, Katano K, Holzer AK,
Rochdi M, Tomioka M, Goodman M and Howell SB: Increased expression
of the copper efflux transporter ATP7A mediates resistance to
cisplatin, carboplatin, and oxaliplatin in ovarian cancer cells.
Clin Cancer Res. 10:4661–4669. 2004. View Article : Google Scholar : PubMed/NCBI
|
|
21
|
Moreno-Smith M, Halder JB, Meltzer PS,
Gonda TA, Mangala LS, Rupaimoole R, Lu C, Nagaraja AS, Gharpure KM,
Kang Y, et al: ATP11B mediates platinum resistance in ovarian
cancer. J Clin Invest. 123:2119–2130. 2013. View Article : Google Scholar : PubMed/NCBI
|
|
22
|
Hubackova M, Vaclavikova R, Ehrlichova M,
Mrhalova M, Kodet R, Kubackova K, Vrána D, Gut I and Soucek P:
Association of superoxide dismutases and NAD(P)H quinone
oxidoreductases with prognosis of patients with breast carcinomas.
Int J Cancer. 130:338–348. 2012. View Article : Google Scholar
|
|
23
|
Soucek P, Anzenbacher P, Skoumalová I and
Dvorák M: Expression of cytochrome P450 genes in CD34+
hematopoietic stem and progenitor cells. Stem Cells. 23:1417–1422.
2005. View Article : Google Scholar : PubMed/NCBI
|
|
24
|
Mohelnikova-Duchonova B, Oliverius M,
Honsova E and Soucek P: Evaluation of reference genes and
normalization strategy for quantitative real-time PCR in human
pancreatic carcinoma. Dis Markers. 32:203–210. 2012. View Article : Google Scholar : PubMed/NCBI
|
|
25
|
Bustin SA, Benes V, Garson JA, Hellemans
J, Huggett J, Kubista M, Mueller R, Nolan T, Pfaffl MW, Shipley GL,
et al: The MIQE guidelines: Minimum information for publication of
quantitative real-time PCR experiments. Clin Chem. 55:611–622.
2009. View Article : Google Scholar : PubMed/NCBI
|
|
26
|
Hlaváč V, Brynychová V, Václavíková R,
Ehrlichová M, Vrána D, Pecha V, Koževnikovová R, Trnková M, Gatěk
J, Kopperová D, et al: The expression profile of ATP-binding
cassette transporter genes in breast carcinoma. Pharmacogenomics.
14:515–529. 2013. View Article : Google Scholar
|
|
27
|
Burger H, Zoumaro-Djayoon A, Boersma AW,
Helleman J, Berns EM, Mathijssen RH, Loos WJ and Wiemer EA:
Differential transport of platinum compounds by the human organic
cation transporter hOCT2 (hSLC22A2). Br J Pharmacol. 159:898–908.
2010. View Article : Google Scholar : PubMed/NCBI
|
|
28
|
Kamal CK, Simionescu CE, Mărgăritescu C
and Stepan A: P53 and Ki67 immunoexpression in mucinous malignant
ovarian tumors. Rom J Morphol Embryol. 53(Suppl 3): S799–S803.
2012.
|
|
29
|
Kaminski WE, Orsó E, Diederich W, Klucken
J, Drobnik W and Schmitz G: Identification of a novel human
sterol-sensitive ATP-binding cassette transporter (ABCA7). Biochem
Biophys Res Commun. 273:532–538. 2000. View Article : Google Scholar : PubMed/NCBI
|
|
30
|
Jessup W, Gelissen IC, Gaus K and
Kritharides L: Roles of ATP binding cassette transporters A1 and
G1, scavenger receptor BI and membrane lipid domains in cholesterol
export from macrophages. Curr Opin Lipidol. 17:247–257. 2006.
View Article : Google Scholar : PubMed/NCBI
|
|
31
|
Beaufort CM, Helmijr JC, Piskorz AM,
Hoogstraat M, Ruigrok-Ritstier K, Besselink N, Murtaza M, van
IJcken WF, Heine AA, Smid M, et al: Ovarian cancer cell line panel
(OCCP): Clinical importance of in vitro morphological subtypes.
PLoS One. 9:e1039882014. View Article : Google Scholar : PubMed/NCBI
|
|
32
|
Kool M, van der Linden M, de Haas M,
Scheffer GL, de Vree JM, Smith AJ, Jansen G, Peters GJ, Ponne N,
Scheper RJ, et al: MRP3, an organic anion transporter able to
transport anti-cancer drugs. Proc Natl Acad Sci USA. 96:6914–6919.
1999. View Article : Google Scholar : PubMed/NCBI
|
|
33
|
Zhao Y, Lu H, Yan A, Yang Y, Meng Q, Sun
L, Pang H, Li C, Dong X and Cai L: ABCC3 as a marker for multidrug
resistance in non-small cell lung cancer. Sci Rep. 3:31202013.
View Article : Google Scholar : PubMed/NCBI
|
|
34
|
Xu J, Yong M, Li J, Dong X, Yu T, Fu X and
Hu L: High level of CFTR expression is associated with tumor
aggression and knockdown of CFTR suppresses proliferation of
ovarian cancer in vitro and in vivo. Oncol Rep. 33:2227–2234.
2015.PubMed/NCBI
|
|
35
|
Yasui K, Mihara S, Zhao C, Okamoto H,
Saito-Ohara F, Tomida A, Funato T, Yokomizo A, Naito S, Imoto I, et
al: Alteration in copy numbers of genes as a mechanism for acquired
drug resistance. Cancer Res. 64:1403–1410. 2004. View Article : Google Scholar : PubMed/NCBI
|
|
36
|
He QZ, Luo XZ, Wang K, Zhou Q, Ao H, Yang
Y, Li SX, Li Y, Zhu HT and Duan T: Isolation and characterization
of cancer stem cells from high-grade serous ovarian carcinomas.
Cell Physiol Biochem. 33:173–184. 2014. View Article : Google Scholar : PubMed/NCBI
|